a ppendix 4d half year report for personal use only · includes the “harvey norman” and...
TRANSCRIPT
A
APPENDIX 4
Appendix Half-Year E
Key Dates
28 February
12 April 20136 May 2013 30 August 20
Contents
Company InResults for AChairman’s Directors’ ReStatement oIncome StatStatement oStatement oStatement oOperating SNotes to andfor the Half-YOther InformDirectors’ DeIndependen
Company InRegistered OA1 RichmondHomebush WPh: 02 9201 Fax: 02 9201Company SeMr Chris Men
4D / HALF –
4D / Half-YEnded 31 D
2013
3
013
nformation Announcemen
Report eport of Financial Potement of Comprehenof Changes in of Cash Flows Segments d forming parYear Ended 3
mation eclaration nt Review Rep
nformation Office: d Road
West NSW 2140 6111 6250
ecretary: ntis
– YEAR REPO
Year ReportDECEMBER 2
AnnouncemAnnouncemRecord datePayment of IAnnouncemAnnouncem
nt to the Marke
osition
nsive Income Equity
rt of the Financ1 December 2
port
0
Share RBoardroLevel 7,Sydney Ph: 02 AuditorErnst & Y
ORT
t 2012
ment of Half-Yement of Interim e for determiniInterim 2013 D
ment of Full Yeament of Final 20
et
cial Statemen2012
Registry: oom Pty Limite 207 Kent Stre NSW 2000 9290 9600 s: Young
ear Profit to 31 2013 Dividending entitlemen
Dividend ar Profit to 30 J013 Dividend
nts
ed eet
StocHarvsharSecu
SolicBrow
December 20d nt to Interim 20
June 2013
ck Exchange Lvey Norman Hes are quotedurities Exchang
citors: wn Wright Stein
012
013 Dividend
1111112
2444
Listing: Holdings Limited on the Austrage Limited (“A
n
1 2 3
12 14 15 16 17 19 21
26 41 42 43
ed alian
ASX”)
1
For
per
sona
l use
onl
y

2
RESULTS FOR ANNOUNCEMENT TO THE MARKET
Financial Highlights HY2011 Dec-10
HY2012 Dec-11
HY2013 Dec-12
No. of franchised outlets in Australia1
198
216
211
No. of franchisees in Australia
676
697
683
No. of company-operated stores2
95
73
77
Franchisee sales revenue1
$2.74bn
$2.58bn
$2.44bn
Company-operated sales revenue2
$804.13m
$806.88m
$676.94m
Other revenues and other income items
$590.38m
$584.11m
$548.82m
Earnings before interest and tax (EBIT)
$219.96m
$188.12m
$123.03m
Earnings before interest, tax, depreciation, amortisation and impairment
$265.11m
$230.87m
$167.36m Net Australian property revaluation (decrement) / increment
($4.98m)
$8.21m
($44.97m)
Profit after tax and non-controlling interests
$131.67m
$128.95m
$81.92m
Net cash flows from operating activities
$93.52m
$19.88m
$133.89m
Basic earnings per share
12.39c
12.14c
7.71c
Dividends per share (fully franked)
6.0c
5.0c
4.5c
Net debt to equity ratio (%)
25.12%
29.74%
27.24%
1 Sales made by franchisees in Australia do not form part of the financial results of the consolidated entity.
2 Includes the “Harvey Norman” and “Norman Ross” branded company-operated stores in New Zealand, Ireland, Northern Ireland, Singapore, Malaysia, Slovenia
and Croatia and the “Clive Peeters” and “Rick Hart” branded company-operated stores in Australia (prior to the restructure).
For
per
sona
l use
onl
y
CHAIRMAN’S REPORT
3
Business Performance Macroeconomic conditions in Australia and the global markets in which we operate remain tough. Whilst the aggressive discounting experienced in the second half of 2012 has stabilised, particularly in the last few months of the first half of 2013, and pleasingly we are seeing an uptick in sales. The historical lows we are seeing in interest rates and home loans should start moving the consumer back into the buying cycle from the savings cycle. Harvey Norman will be a beneficiary of this given the diverse homemaker categories in which Harvey Norman franchisees operate in. Homemaker retail will strengthen as housing and equities improve. Over the past year we have continued to execute the Harvey Norman omni channel strategy. The strategic initiatives require that Harvey Norman franchisees invest in their people, and deliver the best customer experience by focussing on the core mantras of “Quality”, “Value” and “Service”, in every communication, transaction and service with the customer. The critical focus on “best customer experience” is embodied in the new Harvey Norman “Shop with Confidence” marketing campaign, launched in February 2013.
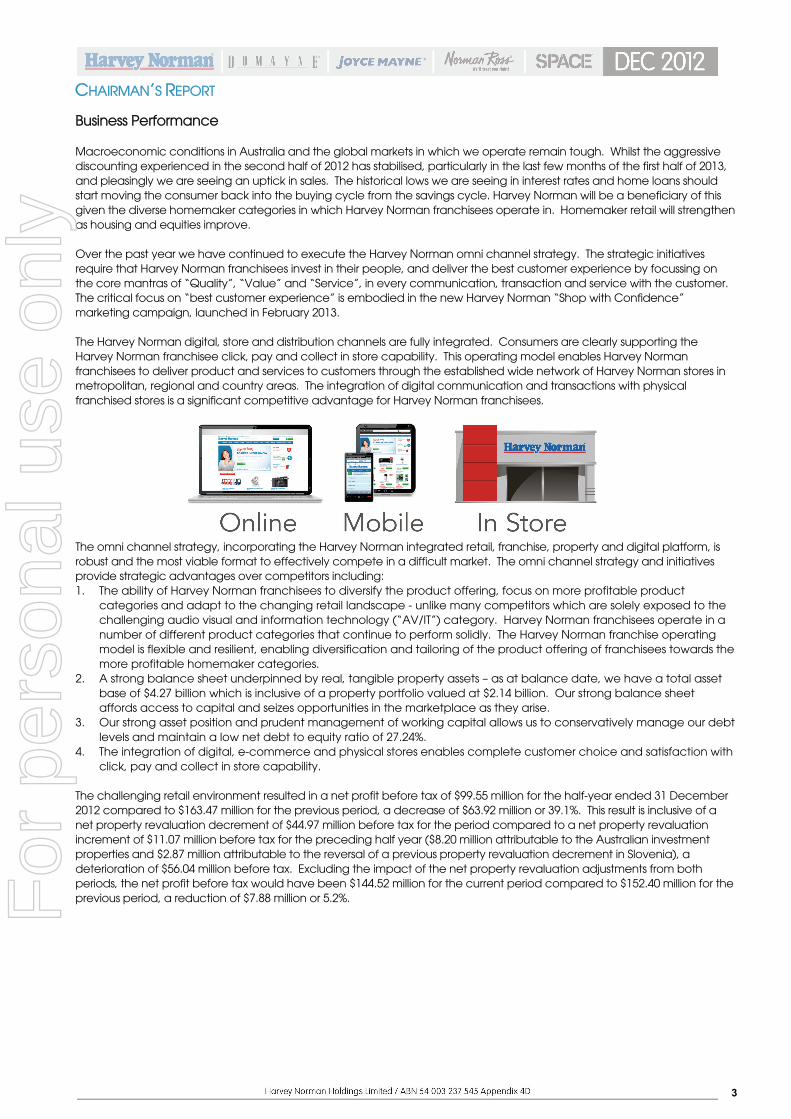
The Harvey Norman digital, store and distribution channels are fully integrated. Consumers are clearly supporting the Harvey Norman franchisee click, pay and collect in store capability. This operating model enables Harvey Norman franchisees to deliver product and services to customers through the established wide network of Harvey Norman stores in metropolitan, regional and country areas. The integration of digital communication and transactions with physical franchised stores is a significant competitive advantage for Harvey Norman franchisees. The omni channel strategy, incorporating the Harvey Norman integrated retail, franchise, property and digital platform, is robust and the most viable format to effectively compete in a difficult market. The omni channel strategy and initiatives provide strategic advantages over competitors including: 1. The ability of Harvey Norman franchisees to diversify the product offering, focus on more profitable product
categories and adapt to the changing retail landscape - unlike many competitors which are solely exposed to the challenging audio visual and information technology (“AV/IT”) category. Harvey Norman franchisees operate in a number of different product categories that continue to perform solidly. The Harvey Norman franchise operating model is flexible and resilient, enabling diversification and tailoring of the product offering of franchisees towards the more profitable homemaker categories.
2. A strong balance sheet underpinned by real, tangible property assets – as at balance date, we have a total asset base of $4.27 billion which is inclusive of a property portfolio valued at $2.14 billion. Our strong balance sheet affords access to capital and seizes opportunities in the marketplace as they arise.
3. Our strong asset position and prudent management of working capital allows us to conservatively manage our debt levels and maintain a low net debt to equity ratio of 27.24%.
4. The integration of digital, e-commerce and physical stores enables complete customer choice and satisfaction with click, pay and collect in store capability.
The challenging retail environment resulted in a net profit before tax of $99.55 million for the half-year ended 31 December 2012 compared to $163.47 million for the previous period, a decrease of $63.92 million or 39.1%. This result is inclusive of a net property revaluation decrement of $44.97 million before tax for the period compared to a net property revaluation increment of $11.07 million before tax for the preceding half year ($8.20 million attributable to the Australian investment properties and $2.87 million attributable to the reversal of a previous property revaluation decrement in Slovenia), a deterioration of $56.04 million before tax. Excluding the impact of the net property revaluation adjustments from both periods, the net profit before tax would have been $144.52 million for the current period compared to $152.40 million for the previous period, a reduction of $7.88 million or 5.2%. F
or p
erso
nal u
se o
nly
4
CHAIRMAN’S REPORT (CONTINUED) Financial Analysis and Commentary: Net Profit After Tax and Non-Controlling Interests Net profit after tax and non-controlling interests was $81.92 million for the half-year ended 31 December 2012 compared with $128.95 million for the preceding period, a decrease of $47.02 million or 36.5%. This result is inclusive of a net revaluation decrement attributable to investment properties and joint ventures in Australia of $31.48 million after tax compared to a net revaluation increment in the previous period of $8.07 million after tax, a devaluation of $39.55 million since the previous corresponding period. If the effects of the net property revaluation adjustments were excluded from the result, the net profit after tax and non-controlling interests for the half-year ended 31 December 2012 would have been $113.40 million compared to $120.88 million for the prior period, a reduction of $7.48 million or 6.2%. Net profit was impacted by the following: the net property revaluation decrement of $44.97 million before tax ($31.48 million after tax) recorded by the
Australian investment property portfolio and joint venture entities for the current period compared to a net revaluation increment of $11.07 million before tax ($8.07 million after tax) in the prior period, a deterioration of $56.04 million before tax ($39.55 million after tax);
a reduction in the profitability of the franchising operations segment by $24.50 million or 25.6% before tax ($17.15 million after tax) due to lower franchise fees and a higher level of tactical support offered to franchisees during the current half and leading into the critical Christmas trading period. The aggregate amount of tactical support provided to franchisees was $63.80 million in the current period compared to $45.30 million in the preceding period (tactical support is included in other expenses from ordinary activities);
the profit of $10.00 million before tax ($7.00 million after tax) that was recognised on the successful completion and opening of the Springvale development during the previous half-year;
an increase of $9.72 million before tax ($6.80 million after tax) in rent received from franchisees and third party tenants;
an appreciation of $8.12 million before tax ($5.68 million after tax) in the market value of the listed public securities and dividends received by the consolidated entity; and
restructuring and closure costs recognised in the previous period for the restructure of the Clive Peeters and Rick Hart businesses of $8.07 million before tax ($5.65 million after tax).
The tax charge in the income statement was lower by $15.74 million for the half-year ended 31 December 2012 compared to prior period mainly due to a reduction in profit before tax from $163.47 million in the previous period to $99.55 million in the current period, a decrease of $63.92 million. This translated to a reduction in our tax liability by approximately $20 million which was offset by a reduction in income tax benefits by approximately $4 million.
Key Elements of an Integrated Retail, Franchise, Property and Digital System
Review of the Franchising Operations Segment in Australia: Franchise sales revenue generated by independent franchisees amounted to $2.44 billion for the half-year ended 31 December 2012 compared with $2.58 billion for the preceding period, a decline of 5.3%. The reduction in franchisee sales has translated into a reduction in the segment result recorded by our franchising operations. The AV/IT categories continue to be challenged with deflationary headwinds affecting average selling prices and margins. However, the consolidation that occurred in the AV/IT market in the second half of 2012 places our franchisees in good stead to take advantage of any resurgence in that category. The other Homemaker Retail categories of home appliances, furniture and bedding remain stable and the businesses are well-placed for any upturn in housing starts. The result before tax of the franchising operations segment was $71.01 million for the half-year ended 31 December 2012 compared to $95.51 million for the preceding half, a reduction of $24.50 million or 25.6%. The result is after the provision of tactical support of $63.80 million in the current period compared to $45.30 million in the preceding period. Included in the tactical support of $63.80 million is $7.60 million of tactical support provided to closed Harvey Norman and rebranded ex Clive Peeters / Rick Hart stores. In accordance with our strategic omni channel initiatives, we provided tactical support to our franchisees over the crucial Christmas trading period. This enabled franchisees to invest in their people to deliver the best customer experience in every communication, transaction and service whether in store or online. Franchise fees received from our franchisees have reduced relative to prior period. Gross revenue from the franchising operations segment has reduced from $466.26 million in the previous half-year to $444.38 million for the half-year ended 31 December 2012, a reduction of $21.88 million or 4.7%. The Harvey Norman omni channel strategy requires us to provide our franchisees with tactical support, when and where necessary to enable them to effectively compete in their local markets. The provision of tactical support to franchisees has increased relative to prior period.
For
per
sona
l use
onl
y
5
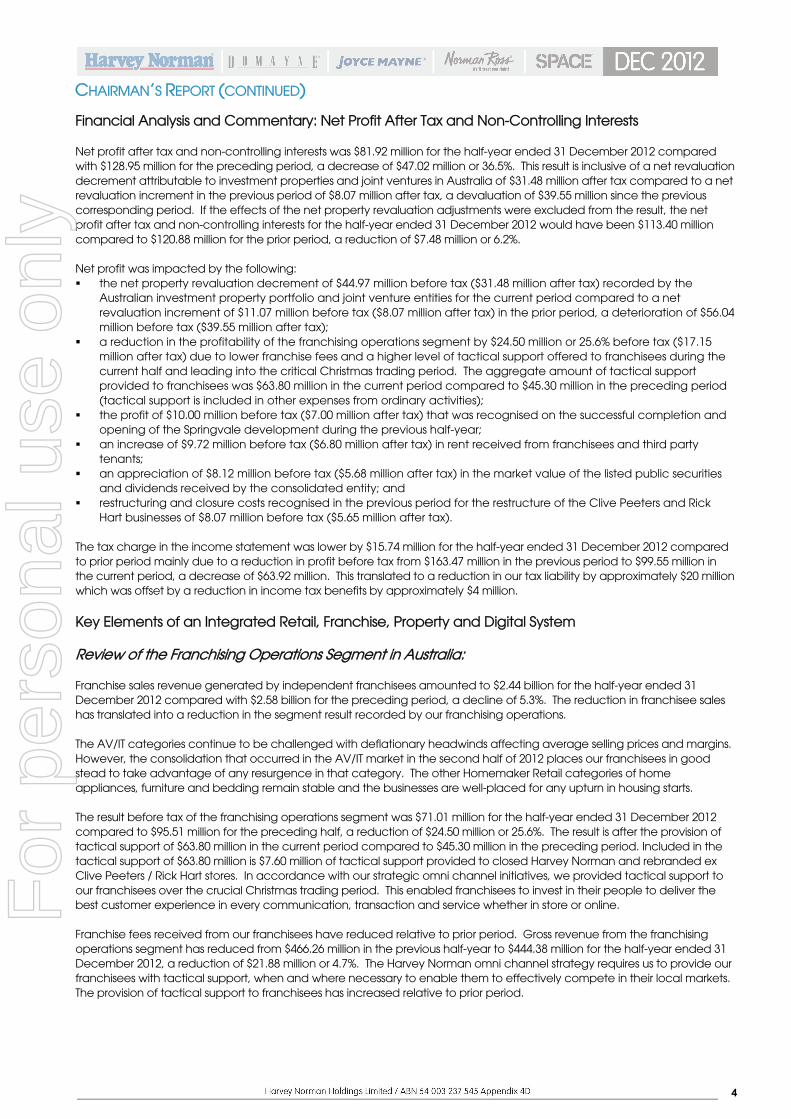
CHAIRMAN’S REPORT (CONTINUED) Our retail franchisees will continue to train and invest in their people to drive sales revenue and enhance the overall customer experience. We will continue to support our franchisees with the provision of tactical support to equip them with the necessary means to manage the difficult trading environment. This unique feature of our franchised model promotes the essential strong alliance with our franchisees necessary to grow market share and take advantage of any upturn in the discretionary retail market. Franchising Operations Margin and Key Statistics: The franchising operations margin is calculated as the segment result before tax of the franchising operations segment over franchisee aggregate sales revenue. The franchising operations margin was 2.91% for the half-year ended 31 December 2012 compared to 3.70% for the half-year ended 31 December 2011.
Franchising Operations Margin HY Dec 2010 HY Dec 2011 HY Dec 2012 No. of franchised outlets in Australia1 198 216 211 Franchising operations segment result before tax $150.36m $95.51m $71.01m Franchisee sales revenue1 $2.74bn $2.58bn $2.44bn Franchising operations margin (%)
5.48%
3.70%
2.91%
Franchising Operations Segment Key Statistics
HY Dec 2010
HY Dec 2011
HY Dec 2012
Return on franchising operations equity (a) (c) 20.81% 13.13% 9.91% Return on franchising operations assets (b) (c) 11.24% 7.03% 5.37% Revenue from franchising operations $498.99m $466.26m $444.38m Franchising operations EBITDA $189.14m $134.88m $109.21m
Review of the Integrated Franchising Operations and Retail Property Segments in Australia: The integrated franchising and retail property system in Australia (excluding freehold property located in New Zealand, Singapore and Slovenia) delivered a segment result before tax of $103.24 million for the half-year ended 31 December 2012 compared to a result before tax of $153.88 million for the comparative period, a reduction of $50.64 million or 32.9%.
Integrated Franchising & Retail Property Segment in Australia HY Dec 2010 HY Dec 2011 HY Dec 2012 Franchising operations segment result before tax $150.36m $95.51m $71.01m Australian retail property segment result before tax $49.65m $58.37m $32.23m
Total integrated franchising & Australian retail property segment result before tax
$200.01m
$153.88m
$103.24m
Australian Retail Property Segment – Key Statistics: The retail property segment in Australia is an ideal complement to the franchising operations segment. The existence of a robust property portfolio in Australia gives franchisees access to high-quality retail premises and a dynamic, cross-beneficial tenancy mix.
Australian Retail Property Segment Portfolio Statistics HY Dec 2010 HY Dec 2011 HY Dec 2012
Average occupancy rates 96.86% 97.64% 97.29% Net property yield (including property revaluation) (a) (d) 3.79% 4.03% 2.43% Net property yield (excluding property revaluation) (b) (d) 3.72% 3.56% 4.14% Return on equity (c) (d) 7.01% 7.54% 4.47% Australian Retail Property Segment Portfolio Australian retail property segment result (e) $49.65m $58.37m $32.23m Australian retail property EBIT (e) $58.21m $69.95m $43.57m Australian Net Property Revaluation Adjustment Total Australian net property revaluation (decrement) / increment ($4.98m) $8.21m ($44.97m)
(a) Calculated as: EBIT from Franchising Operations ÷ Franchising Operations Equity* [*equity allocated to franchising operations segment based on franchising operations assets as a proportion of total assets] (b) Calculated as: EBIT from Franchising Operations ÷ Franchising Operations Segment Assets (after eliminations) (c) Note that this is based on six months return not annualised
1 Sales made by franchisees in Australia do not form part of the financial results of the consolidated entity. Retail sales in Harvey Norman, Domayne and Joyce
Mayne complexes in Australia are made by independently owned franchised business entities that are not consolidated with the consolidated entity’s results.
For
per
sona
l use
onl
y
6
CHAIRMAN’S REPORT (CONTINUED)
(a) Calculated as: EBIT from Australian Retail Property Segment (including Australian net revaluation increments / (decrements)) ÷ Australian Retail Property Segment Assets (after eliminations) (b) Calculated as: EBIT from Australian Retail Property Segment (excluding Australian net revaluation increments / (decrements)) ÷ Australian Retail Property Segment Assets (after eliminations) (c) Calculated as: EBIT from Australian Retail Property Segment (including Australian net revaluation increments / (decrements)) ÷ Australian Retail Property Equity* [*equity allocated to Australian retail property segment based on Australian retail property assets as a proportion of total assets] (d) Note that this is based on six months return not annualised (e) The Australian retail property segment result and EBIT figures are inclusive of the Australian net revaluation increments/ (decrements)
Australian Net Property Revaluation Adjustments: The investment property portfolio in Australia is subject to a bi-annual review to fair market value at each reporting period. At each reporting period, one-sixth of the investment property portfolio is independently valued with the remaining five-sixths fair-valued by Directors. The whole portfolio is independently valued every three years. During the half-year ended 31 December 2012, nineteen (19) properties in Australia have been independently valued. The balance of the portfolio was reviewed resulting in the preparation of internal valuations for seven (7) additional sites. The valuation for the period resulted in a net decrement of $44.97m in Australia. The decrements in Australia were generally the result of development losses and a revaluation of a property which was affected by flooding. The values of established properties within the portfolio have remained relatively stable. Recent developments in Springvale, Maroochydore and Devonport have generated the majority of the decrement. I believe these properties will contribute to increases in operating income in the future. The flooding in Queensland in 2011 affected the value of a property in Oxley, Queensland. No other properties in the portfolio have been significantly affected by the flooding that happened in 2011 and the recent flooding that occurred in January 2013, post the valuation date. Valuations are undertaken on the basis that Harvey Norman stores are on a 30 day licence arrangement. The occupancy rate is 97.29% in December 2012 compared to 96.94% in June 2012.
Review of the Property Portfolio of the Consolidated Entity: Total Property Portfolio of the Consolidated Entity (Inclusive of Freehold Property located in New Zealand, Singapore and Slovenia): A strong property portfolio is an essential component of the Harvey Norman omni channel strategy. Physical stores and distribution centres are key channels that are integrated with Harvey Norman e-commerce operations. Since inception, we have adopted a selective and prudent acquisition and development strategy. Overall, the property portfolio remains fundamentally strong. It has high occupancy rates, growing revenue streams and it is anticipated to have a strong upside for capital growth. Operating profits have been robust as the business continues to focus on improving revenue streams and operating costs. Harvey Norman has no new developments in the short term, but is well positioned to acquire quality investment grade properties to complement its existing portfolio. It continues to focus on opportunities to upgrade existing properties within the portfolio to improve income, building layouts, tenancy commitments and capital growth. Our consolidated property portfolio is valued at $2.14 billion as at 31 December 2012. This represents over 50% of our total asset base as at balance date. The result before tax generated by our property segments represents 40.8% of our consolidated profit before tax for the half-year ended 31 December 2012 if we excluded the impact of the net property revaluation decrement for the period. The segment result before tax of our property segments was $14.00 million for the half-year ended 31 December 2012 compared to a result of $68.77 million for the previous half, a decrease of $54.77 million or 79.6%. Included in the segment result before tax was a contribution of $6.19 million from mining camp accommodation ($1.25 million for the previous corresponding period). If the net property revaluation adjustments were excluded from both years, the segment result before tax would have been $58.97 million for the current period compared to $57.70 million for the preceding half, an increase of $1.27 million or 2.2%. The preceding half result included a one off $10 million profit on the successful completion and opening of the Springvale development.
For
per
sona
l use
onl
y

7
CHAIRMAN’S REPORT (CONTINUED)
Composition of the Property Portfolio
HY Dec 2010 $000
HY Dec 2011 $000
HY Dec 2012 $000
Investment properties 1,395,200 1,593,557 1,620,915 Investment properties under construction
148,879
70,018
27,785
Joint venture properties 163,630 154,495 162,512 Owned land & buildings in New Zealand, Singapore, Slovenia & Australia
252,196
271,292
308,594 Properties held for resale 17,626 26,651 23,757 Total Property Portfolio 1,977,531 2,116,013 2,143,563
Benefits of Property Ownership: Property ownership delivers the following benefits to the consolidated entity: The presence of Harvey Norman, Domayne or Joyce Mayne franchisees as anchor tenants in a complex is a key
drawcard to attract superior national third-party tenants and quality local operators to co-locate within the same complex. This provides us with a distinct advantage in its ability to create a solid, dynamic and cross-beneficial tenancy mix in order to maximise the profitability of the retail property segment.
Despite the softening retail sector, property ownership delivers a steady and reliable income stream in the form of rent charged to franchisees and complementary third-party tenants.
A large property portfolio under management creates economies of scale, delivers operational cost efficiencies and enhanced negotiating power in the property sector.
Breakdown of Owned and Leased Sites: Geographic Spread: This diagram displays the geographic spread of the franchised Harvey Norman (“HN”), Domayne (“DM”) and Joyce Mayne (“JM”) franchised complexes in the Australian market, the Harvey Norman and Norman Ross (“NR”) branded company-operated stores in New Zealand, Ireland, Northern Ireland, Singapore, Malaysia, Slovenia and Croatia as at 31 December 2012.
31 December 2012 Number of Owned
Sites
Number of Leased
Sites *
Total
Australia: Franchised complexes 79 132 211 New Zealand 17 15 32 Slovenia 5 - 5 Croatia - 1 1 Ireland & Northern Ireland - 15 15 Asia - 24 24 TOTAL 101 187 288
The Harvey Norman property portfolio consists of Harvey Norman, Domayne and Joyce Mayne complexes in Australia, Harvey Norman and Norman Ross stores in New Zealand, properties located in Singapore, Harvey Norman stores in Slovenia, properties held under joint venture agreements and land and buildings in Australia for development and resale at a profit.
* leased from external parties
For
per
sona
l use
onl
y
8
CHAIRMAN’S REPORT (CONTINUED)
1.20
1.22
1.24
1.26
1.28
1.30
0
100
200
300
400
Dec 2010 Dec 2011 Dec 2012
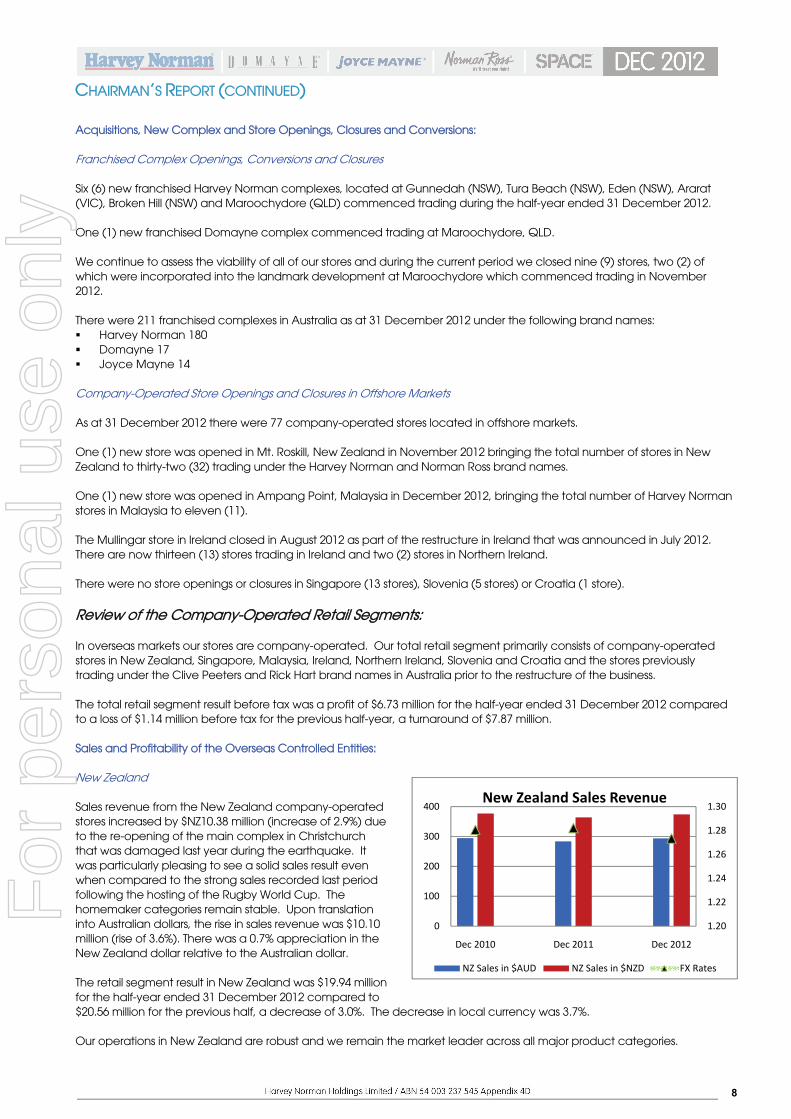
New Zealand Sales Revenue
NZ Sales in $AUD NZ Sales in $NZD FX Rates
Acquisitions, New Complex and Store Openings, Closures and Conversions: Franchised Complex Openings, Conversions and Closures Six (6) new franchised Harvey Norman complexes, located at Gunnedah (NSW), Tura Beach (NSW), Eden (NSW), Ararat (VIC), Broken Hill (NSW) and Maroochydore (QLD) commenced trading during the half-year ended 31 December 2012. One (1) new franchised Domayne complex commenced trading at Maroochydore, QLD. We continue to assess the viability of all of our stores and during the current period we closed nine (9) stores, two (2) of which were incorporated into the landmark development at Maroochydore which commenced trading in November 2012. There were 211 franchised complexes in Australia as at 31 December 2012 under the following brand names: Harvey Norman 180 Domayne 17 Joyce Mayne 14
Company-Operated Store Openings and Closures in Offshore Markets As at 31 December 2012 there were 77 company-operated stores located in offshore markets. One (1) new store was opened in Mt. Roskill, New Zealand in November 2012 bringing the total number of stores in New Zealand to thirty-two (32) trading under the Harvey Norman and Norman Ross brand names. One (1) new store was opened in Ampang Point, Malaysia in December 2012, bringing the total number of Harvey Norman stores in Malaysia to eleven (11). The Mullingar store in Ireland closed in August 2012 as part of the restructure in Ireland that was announced in July 2012. There are now thirteen (13) stores trading in Ireland and two (2) stores in Northern Ireland. There were no store openings or closures in Singapore (13 stores), Slovenia (5 stores) or Croatia (1 store).
Review of the Company-Operated Retail Segments: In overseas markets our stores are company-operated. Our total retail segment primarily consists of company-operated stores in New Zealand, Singapore, Malaysia, Ireland, Northern Ireland, Slovenia and Croatia and the stores previously trading under the Clive Peeters and Rick Hart brand names in Australia prior to the restructure of the business. The total retail segment result before tax was a profit of $6.73 million for the half-year ended 31 December 2012 compared to a loss of $1.14 million before tax for the previous half-year, a turnaround of $7.87 million. Sales and Profitability of the Overseas Controlled Entities: New Zealand Sales revenue from the New Zealand company-operated stores increased by $NZ10.38 million (increase of 2.9%) due to the re-opening of the main complex in Christchurch that was damaged last year during the earthquake. It was particularly pleasing to see a solid sales result even when compared to the strong sales recorded last period following the hosting of the Rugby World Cup. The homemaker categories remain stable. Upon translation into Australian dollars, the rise in sales revenue was $10.10 million (rise of 3.6%). There was a 0.7% appreciation in the New Zealand dollar relative to the Australian dollar. The retail segment result in New Zealand was $19.94 million for the half-year ended 31 December 2012 compared to $20.56 million for the previous half, a decrease of 3.0%. The decrease in local currency was 3.7%. Our operations in New Zealand are robust and we remain the market leader across all major product categories.
For
per
sona
l use
onl
y
9
CHAIRMAN’S REPORT (CONTINUED)
1.23
1.24
1.25
1.26
1.27
1.28
1.29
1.30
0
50
100
150
200
250
Dec 2010 Dec 2011 Dec 2012
Asian Sales Revenue
Asian Sales in AUD Asian Sales in SGD FX Rates
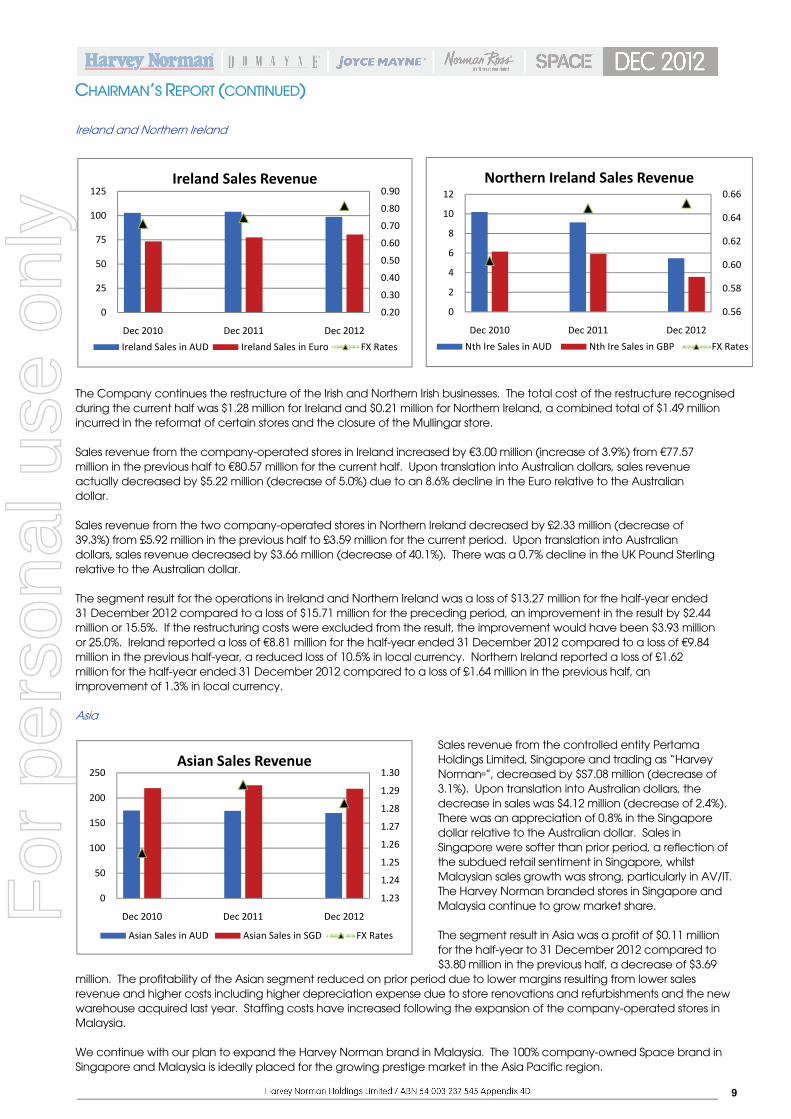
Ireland and Northern Ireland The Company continues the restructure of the Irish and Northern Irish businesses. The total cost of the restructure recognised during the current half was $1.28 million for Ireland and $0.21 million for Northern Ireland, a combined total of $1.49 million incurred in the reformat of certain stores and the closure of the Mullingar store. Sales revenue from the company-operated stores in Ireland increased by €3.00 million (increase of 3.9%) from €77.57 million in the previous half to €80.57 million for the current half. Upon translation into Australian dollars, sales revenue actually decreased by $5.22 million (decrease of 5.0%) due to an 8.6% decline in the Euro relative to the Australian dollar. Sales revenue from the two company-operated stores in Northern Ireland decreased by £2.33 million (decrease of 39.3%) from £5.92 million in the previous half to £3.59 million for the current period. Upon translation into Australian dollars, sales revenue decreased by $3.66 million (decrease of 40.1%). There was a 0.7% decline in the UK Pound Sterling relative to the Australian dollar. The segment result for the operations in Ireland and Northern Ireland was a loss of $13.27 million for the half-year ended 31 December 2012 compared to a loss of $15.71 million for the preceding period, an improvement in the result by $2.44 million or 15.5%. If the restructuring costs were excluded from the result, the improvement would have been $3.93 million or 25.0%. Ireland reported a loss of €8.81 million for the half-year ended 31 December 2012 compared to a loss of €9.84 million in the previous half-year, a reduced loss of 10.5% in local currency. Northern Ireland reported a loss of £1.62 million for the half-year ended 31 December 2012 compared to a loss of £1.64 million in the previous half, an improvement of 1.3% in local currency. Asia
Sales revenue from the controlled entity Pertama Holdings Limited, Singapore and trading as “Harvey Norman®”, decreased by $S7.08 million (decrease of 3.1%). Upon translation into Australian dollars, the decrease in sales was $4.12 million (decrease of 2.4%). There was an appreciation of 0.8% in the Singapore dollar relative to the Australian dollar. Sales in Singapore were softer than prior period, a reflection of the subdued retail sentiment in Singapore, whilst Malaysian sales growth was strong, particularly in AV/IT. The Harvey Norman branded stores in Singapore and Malaysia continue to grow market share. The segment result in Asia was a profit of $0.11 million for the half-year to 31 December 2012 compared to $3.80 million in the previous half, a decrease of $3.69
million. The profitability of the Asian segment reduced on prior period due to lower margins resulting from lower sales revenue and higher costs including higher depreciation expense due to store renovations and refurbishments and the new warehouse acquired last year. Staffing costs have increased following the expansion of the company-operated stores in Malaysia. We continue with our plan to expand the Harvey Norman brand in Malaysia. The 100% company-owned Space brand in Singapore and Malaysia is ideally placed for the growing prestige market in the Asia Pacific region.
0.20
0.30
0.40
0.50
0.60
0.70
0.80
0.90
0
25
50
75
100
125
Dec 2010 Dec 2011 Dec 2012
Ireland Sales Revenue
Ireland Sales in AUD Ireland Sales in Euro FX Rates
0.56
0.58
0.60
0.62
0.64
0.66
0
2
4
6
8
10
12
Dec 2010 Dec 2011 Dec 2012
Northern Ireland Sales Revenue
Nth Ire Sales in AUD Nth Ire Sales in GBP FX Rates
For
per
sona
l use
onl
y
10
CHAIRMAN’S REPORT (CONTINUED)
0.65
0.70
0.75
0.80
0.85
0
10
20
30
40
50
Dec 2010 Dec 2011 Dec 2012
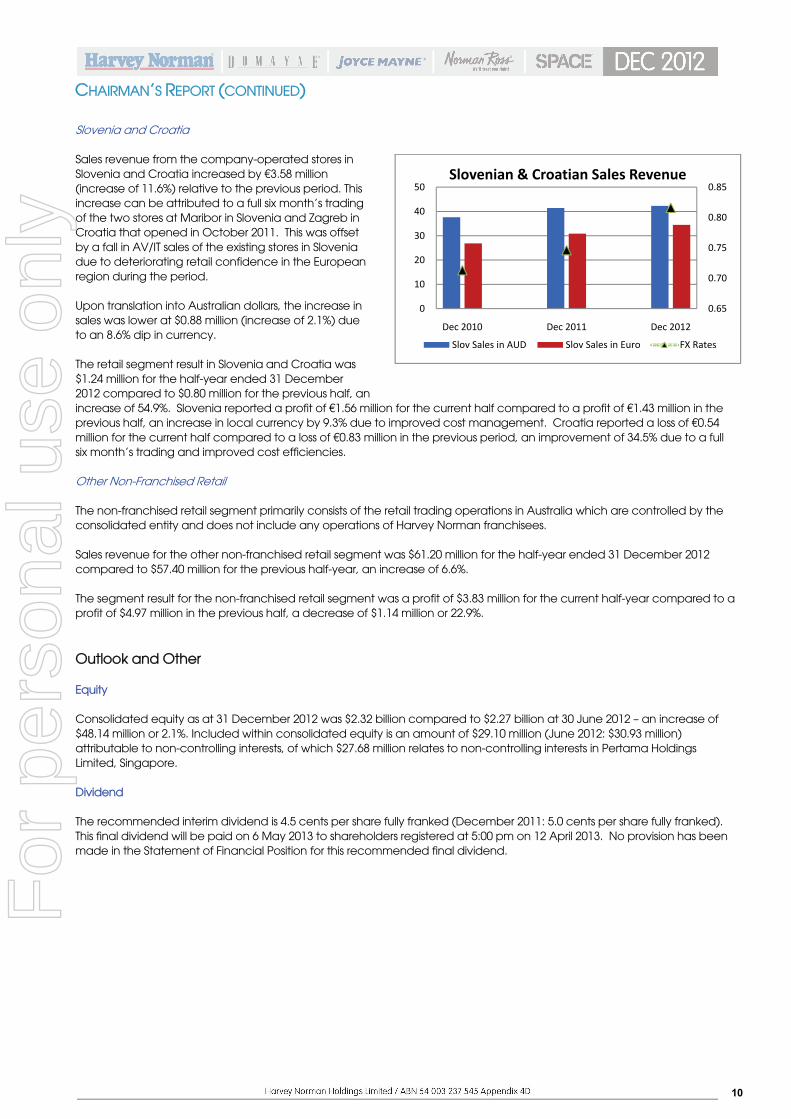
Slovenian & Croatian Sales Revenue
Slov Sales in AUD Slov Sales in Euro FX Rates
Slovenia and Croatia Sales revenue from the company-operated stores in Slovenia and Croatia increased by €3.58 million (increase of 11.6%) relative to the previous period. This increase can be attributed to a full six month’s trading of the two stores at Maribor in Slovenia and Zagreb in Croatia that opened in October 2011. This was offset by a fall in AV/IT sales of the existing stores in Slovenia due to deteriorating retail confidence in the European region during the period. Upon translation into Australian dollars, the increase in sales was lower at $0.88 million (increase of 2.1%) due to an 8.6% dip in currency. The retail segment result in Slovenia and Croatia was $1.24 million for the half-year ended 31 December 2012 compared to $0.80 million for the previous half, an increase of 54.9%. Slovenia reported a profit of €1.56 million for the current half compared to a profit of €1.43 million in the previous half, an increase in local currency by 9.3% due to improved cost management. Croatia reported a loss of €0.54 million for the current half compared to a loss of €0.83 million in the previous period, an improvement of 34.5% due to a full six month’s trading and improved cost efficiencies. Other Non-Franchised Retail The non-franchised retail segment primarily consists of the retail trading operations in Australia which are controlled by the consolidated entity and does not include any operations of Harvey Norman franchisees. Sales revenue for the other non-franchised retail segment was $61.20 million for the half-year ended 31 December 2012 compared to $57.40 million for the previous half-year, an increase of 6.6%. The segment result for the non-franchised retail segment was a profit of $3.83 million for the current half-year compared to a profit of $4.97 million in the previous half, a decrease of $1.14 million or 22.9%.
Outlook and Other Equity Consolidated equity as at 31 December 2012 was $2.32 billion compared to $2.27 billion at 30 June 2012 – an increase of $48.14 million or 2.1%. Included within consolidated equity is an amount of $29.10 million (June 2012: $30.93 million) attributable to non-controlling interests, of which $27.68 million relates to non-controlling interests in Pertama Holdings Limited, Singapore. Dividend The recommended interim dividend is 4.5 cents per share fully franked (December 2011: 5.0 cents per share fully franked). This final dividend will be paid on 6 May 2013 to shareholders registered at 5:00 pm on 12 April 2013. No provision has been made in the Statement of Financial Position for this recommended final dividend.
For
per
sona
l use
onl
y

11
CHAIRMAN’S REPORT (CONTINUED) Outlook We will continue to execute the Harvey Norman omni channel strategy. In Australia, Harvey Norman franchisees are committed to the “Customer First” program. Franchisees will benefit from the continued improvements in the Harvey Norman digital platform, merchandising and supply chain systems. Within the Australian franchising operations segment, the Entertainment and Technology category continues to be challenging. Product rationalisation and improved market share in key categories in the year ahead, led by the Customer First strategy, will provide opportunity for improved performance. Furniture, Bedding and Home Appliance categories continue to outperform the market. The New Zealand operation remains strong. The main complex in Christchurch has reopened. There is increasing consumer confidence in New Zealand. The Irish business has had a period of solid improvement. The balance sheet of the company remains strong. We are well placed to take advantage of emerging opportunities. I would like to thank my fellow directors, Harvey Norman employees, franchisees and their staff for their continuing efforts and loyalty.
G. HARVEY Chairman Sydney, 28 February 2013
For
per
sona
l use
onl
y

12
DIRECTORS’ REPORT The directors of Harvey Norman Holdings Limited (the “Company”) submit their report for the half-year ended 31 December 2012. Unless otherwise indicated, all directors (collectively termed “the Board”) held their position as a director throughout the entire financial period and up to the date of this report.
■ Directors Gerald Harvey Executive Chairman
Chris Mentis Director and Chief Financial Officer
Christopher Herbert Brown Non-Executive Director
Kay Lesley Page Director and Chief Executive Officer
Michael John Harvey Non-Executive Director
Kenneth William Gunderson-Briggs Non-Executive Director
John Evyn Slack-Smith Director and Chief Operating Officer
Ian John Norman Non-Executive Director
Graham Charles Paton AM Non-Executive Director
David Matthew Ackery Director
■ Committee Membership As at the date of this report, the Company had an Audit Committee, a Remuneration Committee and a Nomination Committee. Members acting on the committees of the board during the half year were: ■ Audit Committee: G.C. Paton AM (Chairman) C.H. Brown K.W. Gunderson-Briggs
■ Remuneration Committee: C.H. Brown (Chairman) K.W. Gunderson-Briggs G.C. Paton AM
■ Nomination Committee: C.H. Brown (Chairman) K.W. Gunderson-Briggs G.C. Paton AM
■ Principal Activities The principal activities of the consolidated entity are that of an integrated retail, franchise and property enterprise including: Franchisor; Sale of furniture, bedding, computers, communications and consumer electrical products in Australia, New Zealand,
Slovenia, Croatia, Ireland and Northern Ireland; Property investment; Lessor of premises to Harvey Norman franchisees and other third parties; Media placement; and Provision of consumer finance and other commercial advances.
The consolidated entity holds a controlling interest in Pertama Holdings Limited (“Pertama”). Shares in Pertama are listed on the Stock Exchange of Singapore. The principal activities of Pertama are retail sales of furniture, bedding, computers, communications and consumer electrical products in Singapore and Malaysia.
■ Review of Group Operations The total equity of the consolidated entity for the half-year ended 31 December 2012 increased over the total equity at 30 June 2012 due to the following: Profit attributable to the franchising operations segment; and Profit attributable to the property segment.
■ Significant Changes in the State of Affairs In the opinion of the directors, there were no significant changes in the state of affairs of the consolidated entity that occurred during the half-year ended 31 December 2012.
■ Significant Events After Balance Date There have been no circumstances arising since balance date which have significantly affected or may significantly affect: the operations; the results of those operations; or the state of affairs of the entity or consolidated entity in future financial years.
For
per
sona
l use
onl
y
DIRECTOR
■ Dividend The directors 2013 to sharePosition for th
■ Corpora The CompanASX Corporafor the entire
■ Auditor I The directors
Auditor’s In In relation to 2012, to the brequirements
Ernst & Young
Katrina ZdrilicPartner Sydney 28 February 2 This report ha
G. HARVEY Chairman Sydney 28 February 2
RS’ REPORT (
ds
recommend eholders registhis recommen
ate Governanc
ny is committeate Governance financial peri
Independenc
received the
ndependen
our review of best of my knos of the Corpo
g
c
2013
as been made
2013
(CONTINUED
a fully frankedtered at 5:00 p
nded interim d
ce
ed to good coce Council's "Piod, unless oth
ce
following dec
nce Declar
the financial owledge and orations Act 20
e in accordan
D)
d interim dividpm on 12 Apri
dividend.
orporate govePrinciples of Gherwise stated
claration from
ration to the
report of Harv belief, there h001 or any app
nce with a reso
dend of 4.5 cel 2013. No pro
ernance and dGood Corporad.
m the auditors o
e Directors
vey Norman Hhave been noplicable code
olution of direc
K.L. PAGE Chief Exec Sydney 28 Februar
ents per share.ovision has be
disclosure. Theate Governanc
of Harvey Nor
of Harvey N
Holdings Limiteo contraventioe of profession
ctors.
cutive Officer
ry 2013
This interim den made in th
e Company hace and Best P
rman Holdings
Norman Ho
ed for the half-ons of the audnal conduct.
Liability under P
dividend will behe Statement
as substantiallyPractice Recom
s Limited
oldings Limit
-year ended 3ditor independ
limited by a sProfessional Sta
e paid on 6 M of Financial
y adopted themmendations
ted
31 December dence
scheme approandards Legis
13
May
e s"
oved slation.
For
per
sona
l use
onl
y
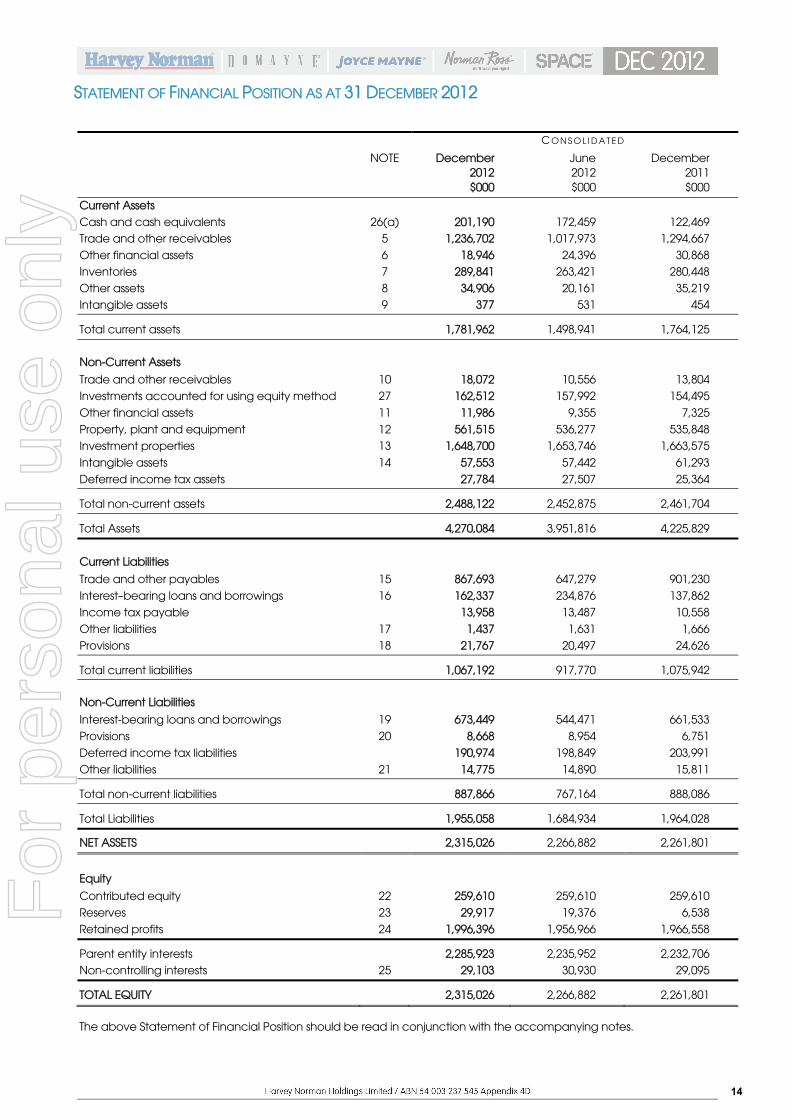
STATEMENT OF FINANCIAL POSITION AS AT 31 DECEMBER 2012
14
C O N S O L I D A T E D
NOTE December 2012
June 2012
December 2011
$000 $000 $000
Current Assets
Cash and cash equivalents 26(a) 201,190 172,459 122,469 Trade and other receivables 5 1,236,702 1,017,973 1,294,667 Other financial assets 6 18,946 24,396 30,868 Inventories 7 289,841 263,421 280,448 Other assets 8 34,906 20,161 35,219 Intangible assets 9 377 531 454
Total current assets 1,781,962 1,498,941 1,764,125
Non-Current Assets
Trade and other receivables 10 18,072 10,556 13,804 Investments accounted for using equity method 27 162,512 157,992 154,495
Other financial assets 11 11,986 9,355 7,325 Property, plant and equipment 12 561,515 536,277 535,848 Investment properties 13 1,648,700 1,653,746 1,663,575
Intangible assets 14 57,553 57,442 61,293 Deferred income tax assets 27,784 27,507 25,364
Total non-current assets 2,488,122 2,452,875 2,461,704
Total Assets 4,270,084 3,951,816 4,225,829
Current Liabilities
Trade and other payables 15 867,693 647,279 901,230 Interest–bearing loans and borrowings 16 162,337 234,876 137,862 Income tax payable 13,958 13,487 10,558
Other liabilities 17 1,437 1,631 1,666 Provisions 18 21,767 20,497 24,626
Total current liabilities 1,067,192 917,770 1,075,942
Non-Current Liabilities
Interest-bearing loans and borrowings 19 673,449 544,471 661,533 Provisions 20 8,668 8,954 6,751
Deferred income tax liabilities 190,974 198,849 203,991 Other liabilities 21 14,775 14,890 15,811
Total non-current liabilities 887,866 767,164 888,086
Total Liabilities 1,955,058 1,684,934 1,964,028
NET ASSETS 2,315,026 2,266,882 2,261,801
Equity
Contributed equity 22 259,610 259,610 259,610 Reserves 23 29,917 19,376 6,538 Retained profits 24 1,996,396 1,956,966 1,966,558
Parent entity interests 2,285,923 2,235,952 2,232,706 Non-controlling interests 25 29,103 30,930 29,095
TOTAL EQUITY 2,315,026 2,266,882 2,261,801
The above Statement of Financial Position should be read in conjunction with the accompanying notes.
For
per
sona
l use
onl
y

INCOME STATEMENT FOR THE HALF-YEAR ENDED 31 DECEMBER 2012
15
C O N S O L I D A T E D
NOTE December 2012
December 2011
$000 $000
Sales revenue 2 676,935 806,879 Cost of sales (488,686) (601,877)
Gross profit
188,249
205,002
Revenues and other income items 2 548,819 584,110
Distribution expenses (5,360) (5,468) Marketing expenses (189,912) (204,630) Occupancy expenses 3 (152,879) (111,167)
Administrative expenses (188,544) (210,364) Other expenses from ordinary activities (86,695) (71,748) Finance costs 3 (23,478) (24,653)
Share of equity accounted entities: - Share of net profit of joint venture entities (a) 2, 27 10,968 6,086 - Share of joint venture property revaluation (a) 3, 27 (1,620) (3,698)
Profit before income tax
99,548
163,470
Income tax expense
(16,894)
(32,637)
Profit after tax
82,654
130,833
Attributable to:
Owners of the parent 81,923 128,947
Non-controlling interests 731 1,886
82,654
130,833
Earnings Per Share: Basic earnings per share (cents per share) 4 7.71 cents 12.14 cents Diluted earnings per share (cents per share) 4 7.71 cents 12.14 cents Dividends per share (cents per share)
4.5 cents
5.0 cents
The above Income Statement should be read in conjunction with the accompanying notes. (a) The total share of net profit of joint venture entities, including the share of joint venture property revaluation, was
$9.35 million before tax for the half-year ended 31 December 2012 (December 2011: $2.39 million before tax).For
per
sona
l use
onl
y
16
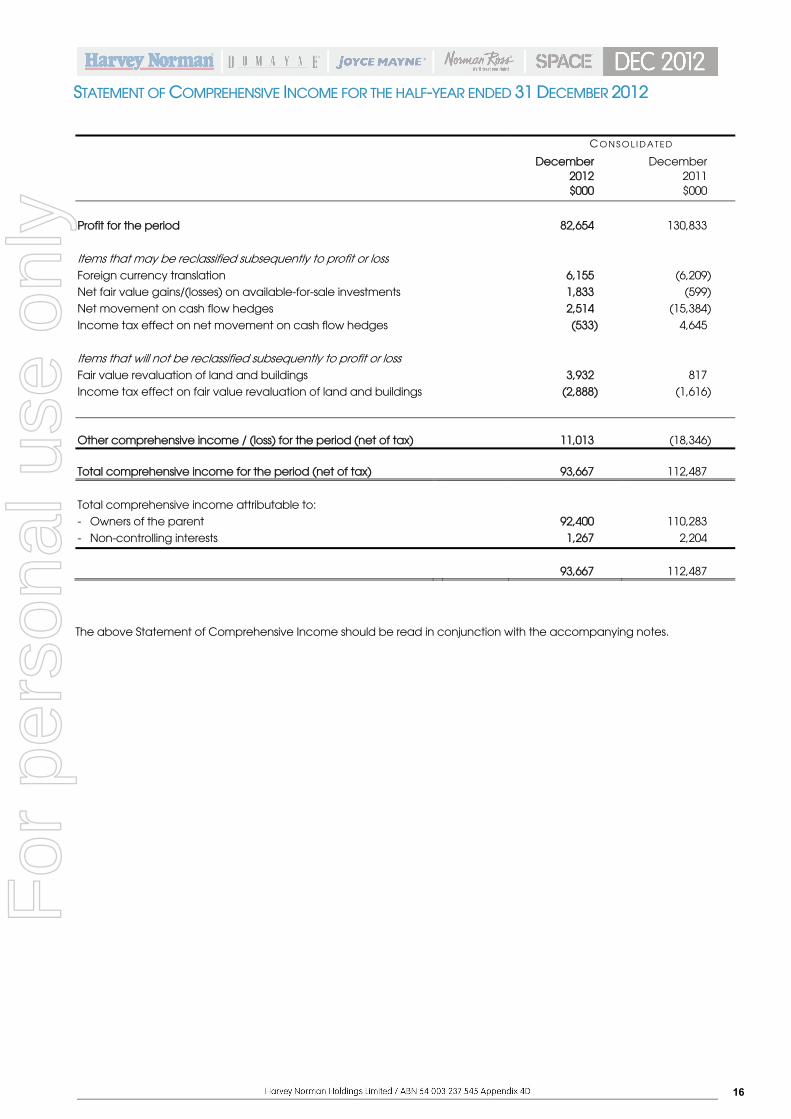
STATEMENT OF COMPREHENSIVE INCOME FOR THE HALF-YEAR ENDED 31 DECEMBER 2012
C O N S O L I D A T E D
December 2012
December 2011
$000 $000
Profit for the period 82,654 130,833 Items that may be reclassified subsequently to profit or loss
Foreign currency translation 6,155 (6,209) Net fair value gains/(losses) on available-for-sale investments 1,833 (599) Net movement on cash flow hedges 2,514 (15,384)
Income tax effect on net movement on cash flow hedges (533) 4,645 Items that will not be reclassified subsequently to profit or loss
Fair value revaluation of land and buildings 3,932 817 Income tax effect on fair value revaluation of land and buildings (2,888) (1,616)
Other comprehensive income / (loss) for the period (net of tax)
11,013
(18,346)
Total comprehensive income for the period (net of tax)
93,667
112,487
Total comprehensive income attributable to: - Owners of the parent 92,400 110,283
- Non-controlling interests 1,267 2,204
93,667
112,487
The above Statement of Comprehensive Income should be read in conjunction with the accompanying notes.
For
per
sona
l use
onl
y

STA
TEM
ENT
OF
CH
AN
GES
IN E
QU
ITY
FOR
TH
E H
ALF
-YEA
R E
ND
ED 3
1 D
ECEM
BER
201
2
1
7
A
ttrib
uta
ble
to
Eq
uity
Ho
lde
rs o
f th
e P
are
nt
Co
ntr
ibu
ted
Eq
uity
R
eta
ine
d
Pro
fits
A
sse
t R
eva
lua
tion
R
ese
rve
Fo
reig
n
Cu
rre
nc
y Tr
an
slatio
n
Re
serv
e
A
vaila
ble
fo
r Sa
le R
ese
rve
C
ash
Flo
w
He
dg
e
Re
serv
e
Em
plo
yee
Eq
uity
Be
ne
fits
Re
serv
e
A
cq
uisi
tion
R
ese
rve
N
on
-c
on
tro
llin
g
Inte
rest
s
TO
TAL
EQU
ITY
$0
00
$000
$0
00
$000
$0
00
$000
$0
00
$000
$0
00
$000
At 1
Ju
ly 2
012
25
9,61
0
1,95
6,96
6
72,2
29
(3
5,36
9)
3,
354
(1
3,88
6)
7,
786
(1
4,73
8)
30
,930
2,26
6,88
2 O
the
r co
mp
reh
en
sive
inc
om
e:
Re
valu
atio
n o
f la
nd
an
d b
uild
ing
s -
- 1,
044
- -
- -
- -
1,04
4 R
eve
rse
exp
ired
or r
ea
lise
d c
ash
flo
w h
ed
ge
rese
rve
s -
- -
- -
73
7 -
- -
73
7 C
urre
nc
y tr
an
slatio
n d
iffe
ren
ce
s -
- -
5,61
9 -
- -
- 53
6 6,
155
Fair
valu
e o
f in
tere
st ra
te s
wa
ps
- -
- -
- 1,
231
- -
- 1,
231
Fair
valu
e o
f fo
rwa
rd fo
reig
n
exc
ha
ng
e c
on
tra
cts
-
- -
- -
13
-
- -
13
Fa
ir va
lue
of a
vaila
ble
for s
ale
fin
an
cia
l ass
ets
-
- -
-
1,83
3 -
- -
-
1,83
3 O
the
r co
mp
reh
en
sive
inc
om
e
- -
1,
044
5,
619
1,
833
1,
981
- -
53
6
11,0
13
Pro
fit fo
r th
e p
erio
d
- 81
,923
-
- -
- -
- 73
1 82
,654
To
tal c
om
pre
he
nsiv
e in
co
me
fo
r th
e p
erio
d
-
81,9
23
1,
044
5,
619
1,
833
1,
981
- -
1,
267
93
,667
Co
st o
f sh
are
ba
sed
pa
yme
nts
-
- -
- -
- 64
-
- 64
D
ivid
en
ds
pa
id
- (4
2,49
3)
- -
- -
- -
(1,0
25)
(43,
518)
D
istrib
utio
n to
me
mb
ers
-
- -
- -
- -
- (2
,069
) (2
,069
) A
t 31
De
ce
mb
er 2
012
25
9,61
0
1,99
6,39
6
73,2
73
(2
9,75
0)
5,
187
(1
1,90
5)
7,
850
(1
4,73
8)
29
,103
2,31
5,02
6
For
per
sona
l use
onl
y
18
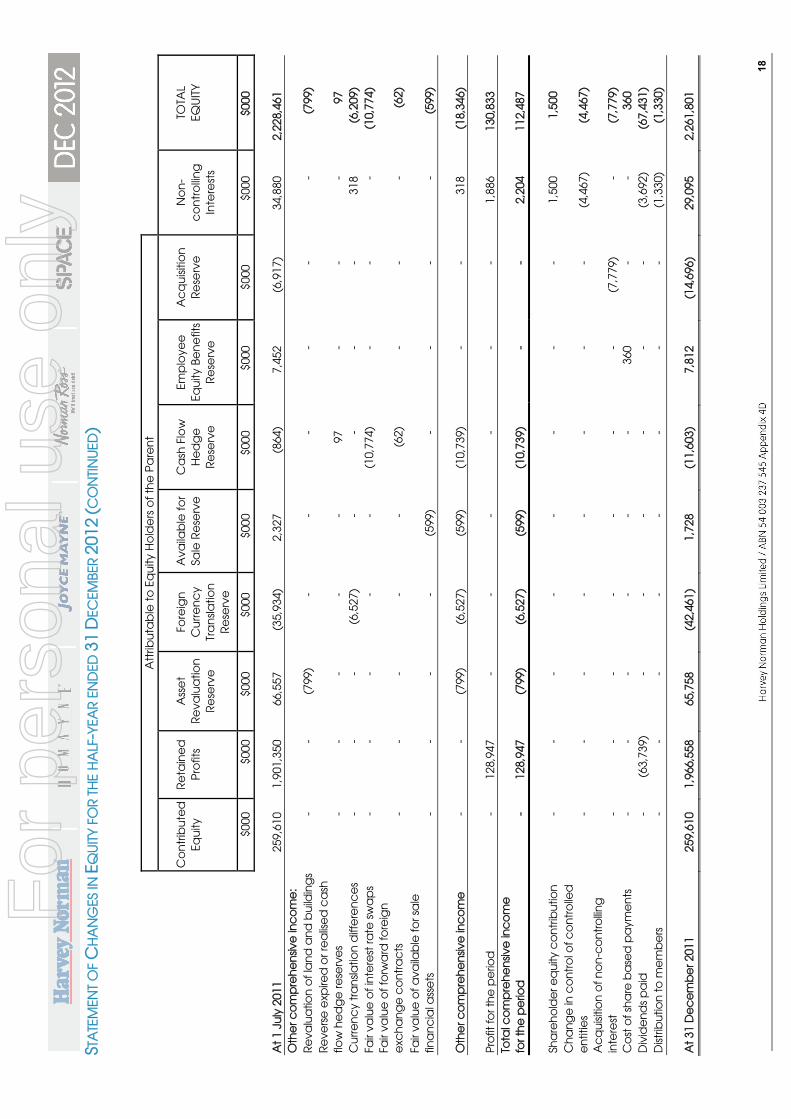
STA
TEM
ENT
OF
CH
AN
GES
IN E
QU
ITY
FOR
TH
E H
ALF
-YEA
R E
ND
ED 3
1 D
ECEM
BER
201
2 (C
ON
TIN
UED
)
Att
ribu
tab
le t
o E
qu
ity H
old
ers
of t
he
Pa
ren
t
Co
ntr
ibu
ted
Eq
uity
R
eta
ine
d
Pro
fits
A
sse
t R
eva
lua
tion
R
ese
rve
Fo
reig
n
Cu
rre
nc
y Tr
an
slatio
n
Re
serv
e
A
vaila
ble
fo
r Sa
le R
ese
rve
C
ash
Flo
w
He
dg
e
Re
serv
e
Em
plo
yee
Eq
uity
Be
ne
fits
Re
serv
e
A
cq
uisi
tion
R
ese
rve
N
on
-c
on
tro
llin
g
Inte
rest
s
TO
TAL
EQU
ITY
$0
00
$000
$0
00
$000
$0
00
$000
$0
00
$000
$0
00
$000
At 1
Ju
ly 2
011
25
9,61
0
1,90
1,35
0
66,5
57
(3
5,93
4)
2,32
7
(864
)
7,45
2
(6,9
17)
34
,880
2,22
8,46
1 O
the
r co
mp
reh
en
sive
inc
om
e:
Re
valu
atio
n o
f la
nd
an
d b
uild
ing
s -
- (7
99)
- -
- -
- -
(799
) R
eve
rse
exp
ired
or r
ea
lise
d c
ash
flo
w h
ed
ge
rese
rve
s -
- -
- -
97
-
- -
97
C
urre
nc
y tr
an
slatio
n d
iffe
ren
ce
s -
- -
(6,5
27)
- -
- -
318
(6,2
09)
Fair
valu
e o
f in
tere
st ra
te s
wa
ps
- -
- -
- (1
0,77
4)
- -
- (1
0,77
4)
Fair
valu
e o
f fo
rwa
rd fo
reig
n
exc
ha
ng
e c
on
tra
cts
-
- -
- -
(6
2)
- -
-
(62)
Fa
ir va
lue
of a
vaila
ble
for s
ale
fin
an
cia
l ass
ets
-
- -
-
(599
) -
- -
-
(599
) O
the
r co
mp
reh
en
sive
inc
om
e
- -
(7
99)
(6
,527
)
(599
)
(10,
739)
-
-
318
(1
8,34
6)
Pr
ofit
for t
he
pe
riod
-
128,
947
- -
- -
- -
1,88
6 13
0,83
3 To
tal c
om
pre
he
nsiv
e in
co
me
fo
r th
e p
erio
d
-
128,
947
(7
99)
(6
,527
)
(599
)
(10,
739)
-
-
2,20
4
112,
487
Sh
are
ho
lde
r eq
uity
co
ntr
ibu
tion
-
- -
- -
- -
- 1,
500
1,50
0 C
ha
ng
e in
co
ntr
ol o
f co
ntr
olle
d
en
titie
s -
- -
- -
- -
-
(4,4
67)
(4
,467
) A
cq
uisi
tion
of n
on
-co
ntr
ollin
g
inte
rest
-
- -
- -
- -
(7
,779
) -
(7
,779
) C
ost
of s
ha
re b
ase
d p
aym
en
ts
- -
- -
- -
360
- -
360
Div
ide
nd
s p
aid
-
(63,
739)
-
- -
- -
- (3
,692
) (6
7,43
1)
Dist
ribu
tion
to m
em
be
rs
- -
- -
- -
- -
(1,3
30)
(1,3
30)
At 3
1 D
ec
em
be
r 201
1
259,
610
1,
966,
558
65
,758
(42,
461)
1,72
8
(11,
603)
7,81
2
(14,
696)
29,0
95
2,
261,
801
For
per
sona
l use
onl
y
STATEMENT OF CASH FLOWS FOR THE HALF-YEAR ENDED 31 DECEMBER 2012
19
C O N S O L I D A T E D
NOTE December 2012
December 2011
$000 $000
Cash Flows from Operating Activities
Inflows/(Outflows)
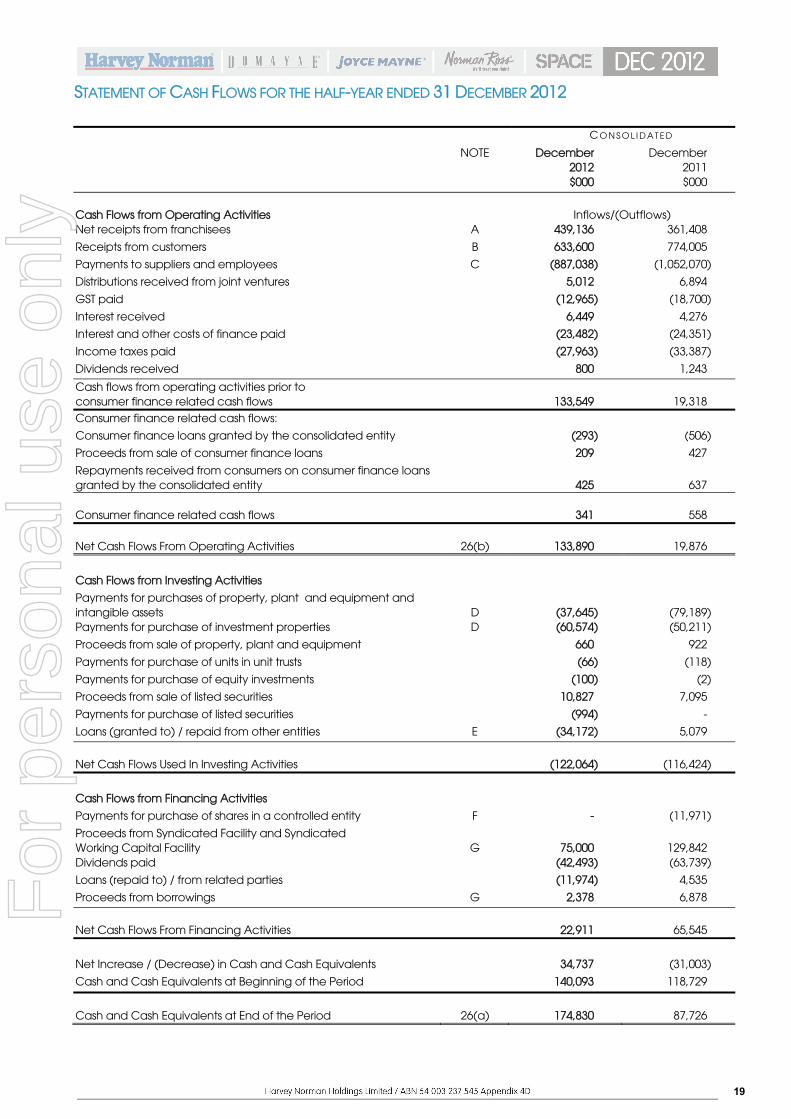
Net receipts from franchisees A 439,136 361,408
Receipts from customers B 633,600 774,005
Payments to suppliers and employees C (887,038) (1,052,070)
Distributions received from joint ventures 5,012 6,894
GST paid (12,965) (18,700)
Interest received 6,449 4,276
Interest and other costs of finance paid (23,482) (24,351)
Income taxes paid (27,963) (33,387)
Dividends received 800 1,243
Cash flows from operating activities prior to consumer finance related cash flows
133,549
19,318
Consumer finance related cash flows:
Consumer finance loans granted by the consolidated entity (293) (506)
Proceeds from sale of consumer finance loans 209 427
Repayments received from consumers on consumer finance loans granted by the consolidated entity
425
637
Consumer finance related cash flows
341
558
Net Cash Flows From Operating Activities
26(b)
133,890
19,876
Cash Flows from Investing Activities
Payments for purchases of property, plant and equipment and intangible assets
D
(37,645)
(79,189)
Payments for purchase of investment properties D (60,574) (50,211)
Proceeds from sale of property, plant and equipment 660 922
Payments for purchase of units in unit trusts (66) (118)
Payments for purchase of equity investments (100) (2)
Proceeds from sale of listed securities 10,827 7,095
Payments for purchase of listed securities (994) -
Loans (granted to) / repaid from other entities E (34,172) 5,079
Net Cash Flows Used In Investing Activities
(122,064)
(116,424)
Cash Flows from Financing Activities
Payments for purchase of shares in a controlled entity F - (11,971)
Proceeds from Syndicated Facility and Syndicated Working Capital Facility
G
75,000
129,842
Dividends paid (42,493) (63,739)
Loans (repaid to) / from related parties (11,974) 4,535
Proceeds from borrowings G 2,378 6,878
Net Cash Flows From Financing Activities
22,911
65,545
Net Increase / (Decrease) in Cash and Cash Equivalents 34,737 (31,003)
Cash and Cash Equivalents at Beginning of the Period 140,093 118,729
Cash and Cash Equivalents at End of the Period
26(a)
174,830
87,726
For
per
sona
l use
onl
y
STATEMENT OF CASH FLOWS FOR THE HALF-YEAR ENDED 31 DECEMBER 2012 (CONTINUED)
20
Commentary to the Statement of Cash Flows: <A> Total revenue received from franchisees decreased from $511.94 million for the previous half year to $489.60 million
for the half-year ended 31 December 2012, a decrease of $22.33 million or 4.4% (refer Note 2). The aggregate amount of tactical support for the current period was $63.80 million compared to $45.30 million for the previous corresponding period, an increase of $18.50 million or 40.8% (refer Note 3). Cash flows from operating activities are also affected by movements in franchisee working capital loans receivable for the half-year ended 31 December 2012 relative to the previous corresponding period. The rate of increase in loans advanced to franchisees as at 31 December 2012 was lower than the increase as at 31 December 2011 by $114.73 million. This was predominantly due to franchisees reducing their working capital requirements in relation to their inventory holding. Additionally, the prior year comparative included a loan to franchisees to fund the purchase of $35 million of computer hardware and Digital SLR inventory in the second quarter of the 2012 financial year to cater for the component shortage as a result of the Thailand floods. This brought forward loans to franchisees to fund purchases from the January and February 2012 period. Accordingly, net receipts from franchisees increased by $77.73 million compared to the previous corresponding period.
<B> Receipts from customers derived by company-operated stores decreased for the half-year ended 31 December 2012 relative to the previous corresponding period due to the closure of Clive Peeters and Rick Hart stores.
<C> The decrease in payments to suppliers and employees was due to the closure of Clive Peeters and Rick Hart stores.
<D> Payments for purchases of property, plant and equipment and intangible assets decreased by $41.54 million relative to the previous corresponding period predominantly due to higher payments in the prior period attributable to the opening of two (2) new owned stores in offshore markets located in Maribor, Slovenia and Zagreb, Croatia. Payments for purchase of investment properties increased by $10.36 million due to the acquisition of the remaining 50% interest in a complex in Browns Plains, Queensland.
<E>
Loans granted to other entities increased by $39.25 million compared to the previous corresponding period due to increases in commercial loans.
<F> During the previous half year, the consolidated entity acquired an additional 12,592,150 shares in Pertama Holdings Limited, Singapore for a total purchase consideration of $6.19 million and acquired a further 24.9% interest in a controlled entity for a total purchase consideration of $5.78 million.
<G> The utilised Syndicated Facility and “Syndicated Working Capital Facility” increased to $665.00 million during the half-year ended 31 December 2012 to fund operating activities (refer to Notes 16 & 19 for further information on these facilities).
For
per
sona
l use
onl
y

21
OPERATING SEGMENTS OPERATING SEGMENTS – 31 December 2012
SEGMENT REVENUE Sales to Customers
Outside the Consolidated Entity
Other Revenues from Outside the
Consolidated Entity
Share of Net
Profit/(Loss) of Equity Accounted
Investments
Segment Revenue
Dec 2012 $000
Dec 2012 $000
Dec 2012 $000
Dec 2012 $000
FRANCHISING OPERATIONS 2,381 442,001 - 444,382
Retail – New Zealand 293,942 5,205 - 299,147 Retail – Asia 170,177 1,827 - 172,004
Retail – Slovenia & Croatia 42,283 333 - 42,616
Retail – Ireland & Northern Ireland 104,206 1,420 - 105,626
Non-Franchised Retail – Clive Peeters & Rick Hart
-
8
-
8
Other Non-Franchised Retail 61,203 1,556 - 62,759
TOTAL RETAIL
671,811
10,349
-
682,160
Retail Property 65 96,351 10,985 107,401 Property Under Construction for Retail - 64 (17) 47
Property Development for Resale 2,678 288 - 2,966 TOTAL PROPERTY
2,743
96,703
10,968
110,414
Equity Investments - 5,705 - 5,705
Other - 9,663 - 9,663
Inter-company eliminations - (15,602) - (15,602)
Total segment revenue
676,935
548,819
10,968
1,236,722
For
per
sona
l use
onl
y

22
OPERATING SEGMENTS (CONTINUED)
Operating Segments – 31 December 2012 (continued)
SEGMENT RESULT Segment Result Before Interest,
Taxation, Depreciation, Impairment & Amortisation
Interest Expense
Depreciation
Expense
Amortisation & Impairment
Expense
Segment
Result Before Tax
Dec 2012 $000
Dec 2012 $000
Dec 2012 $000
Dec 2012 $000
Dec 2012 $000
FRANCHISING OPERATIONS 109,210 (7,797) (25,007) (5,396) 71,010
Retail – New Zealand 23,422 (3) (3,465) (11) 19,943 Retail – Asia 3,504 (17) (3,364) (15) 108 Retail – Slovenia & Croatia 2,652 (618) (758) (34) 1,242 Retail – Ireland & Northern Ireland (10,593) (1,482) (1,196) - (13,271) Non-Franchised Retail – Clive Peeters & Rick Hart
(4,791)
(330)
-
-
(5,121)
Other Non-Franchised Retail 5,231 (624) (746) (29) 3,832 TOTAL RETAIL
19,425
(3,074)
(9,529)
(89)
6,733
Retail Property 43,491 (11,901) (2,534) - 29,056 Property Under Construction for Retail (12,634) (230) - - (12,864) Property Development for Resale (2,012) (179) - - (2,191) TOTAL PROPERTY
28,845
(12,310)
(2,534)
-
14,001
Equity Investments 5,705 (127) - - 5,578 Other 4,609 (604) (1,779) - 2,226
Inter-company eliminations (434) 434 - - - Total segment result before tax
167,360
(23,478)
(38,849)
(5,485)
99,548
Income tax expense (16,894) Profit attributable to non-controlling interests
(731)
Net profit for the period attributable to owners of the parent
81,923
For
per
sona
l use
onl
y

23
OPERATING SEGMENTS (CONTINUED) OPERATING SEGMENTS – 31 December 2011
SEGMENT REVENUE Sales to Customers
Outside the Consolidated Entity
Other Revenues from Outside the
Consolidated Entity
Share of Net
Profit/(Loss) of Equity Accounted
Investments
Segment Revenue
Dec 2011 $000
Dec 2011 $000
Dec 2011 $000
Dec 2011 $000
FRANCHISING OPERATIONS 2,393 463,866 - 466,259
Retail – New Zealand 283,841 4,681 - 288,522 Retail – Asia 174,292 1,386 - 175,678
Retail – Slovenia & Croatia 41,401 342 - 41,743
Retail – Ireland & Northern Ireland 113,085 2,002 - 115,087
Non-Franchised Retail – Clive Peeters and Rick Hart
134,412
8,002
-
142,414
Other Non-Franchised Retail 57,399 1,687 - 59,086
TOTAL RETAIL
804,430
18,100
-
822,530
Retail Property 56 100,089 5,054 105,199 Property Under Construction for Retail - 199 10 209 Property Development for Resale - 10,175 1,022 11,197 TOTAL PROPERTY
56
110,463
6,086
116,605
Equity Investments - 1,243 - 1,243
Other - 6,275 - 6,275
Inter-company eliminations - (15,837) - (15,837)
Total segment revenue
806,879
584,110
6,086
1,397,075
F
or p
erso
nal u
se o
nly
24
OPERATING SEGMENTS (CONTINUED) Operating Segments – 31 December 2011 (continued)
SEGMENT RESULT Segment Result Before Interest,
Taxation, Depreciation, Impairment & Amortisation
Interest Expense
Depreciation
Expense
Amortisation & Impairment
Expense
Segment
Result Before Tax
Dec 2011 $000
Dec 2011 $000
Dec 2011 $000
Dec 2011 $000
Dec 2011 $000
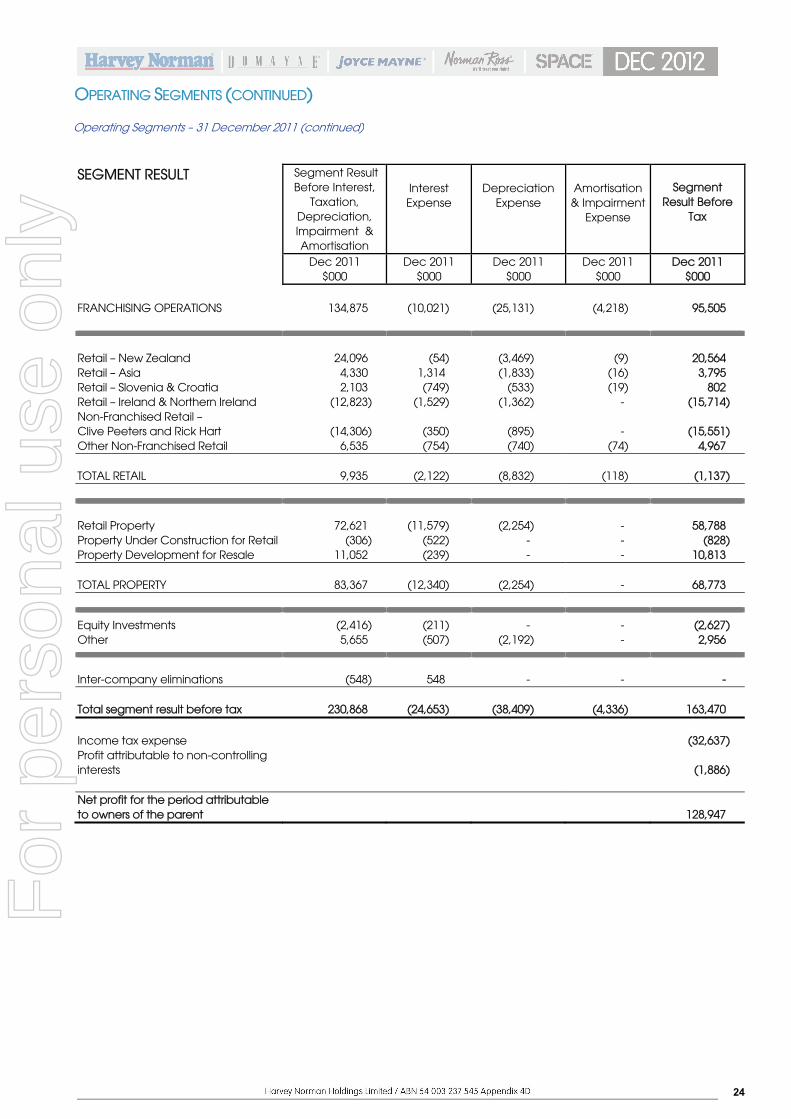
FRANCHISING OPERATIONS 134,875 (10,021) (25,131) (4,218) 95,505
Retail – New Zealand 24,096 (54) (3,469) (9) 20,564 Retail – Asia 4,330 1,314 (1,833) (16) 3,795 Retail – Slovenia & Croatia 2,103 (749) (533) (19) 802 Retail – Ireland & Northern Ireland (12,823) (1,529) (1,362) - (15,714) Non-Franchised Retail – Clive Peeters and Rick Hart
(14,306)
(350)
(895)
-
(15,551)
Other Non-Franchised Retail 6,535 (754) (740) (74) 4,967 TOTAL RETAIL
9,935
(2,122)
(8,832)
(118)
(1,137)
Retail Property 72,621 (11,579) (2,254) - 58,788 Property Under Construction for Retail (306) (522) - - (828) Property Development for Resale 11,052 (239) - - 10,813 TOTAL PROPERTY
83,367
(12,340)
(2,254)
-
68,773
Equity Investments (2,416) (211) - - (2,627) Other 5,655 (507) (2,192) - 2,956
Inter-company eliminations (548) 548 - - - Total segment result before tax
230,868
(24,653)
(38,409)
(4,336)
163,470
Income tax expense (32,637) Profit attributable to non-controlling interests
(1,886)
Net profit for the period attributable to owners of the parent
128,947
For
per
sona
l use
onl
y
25
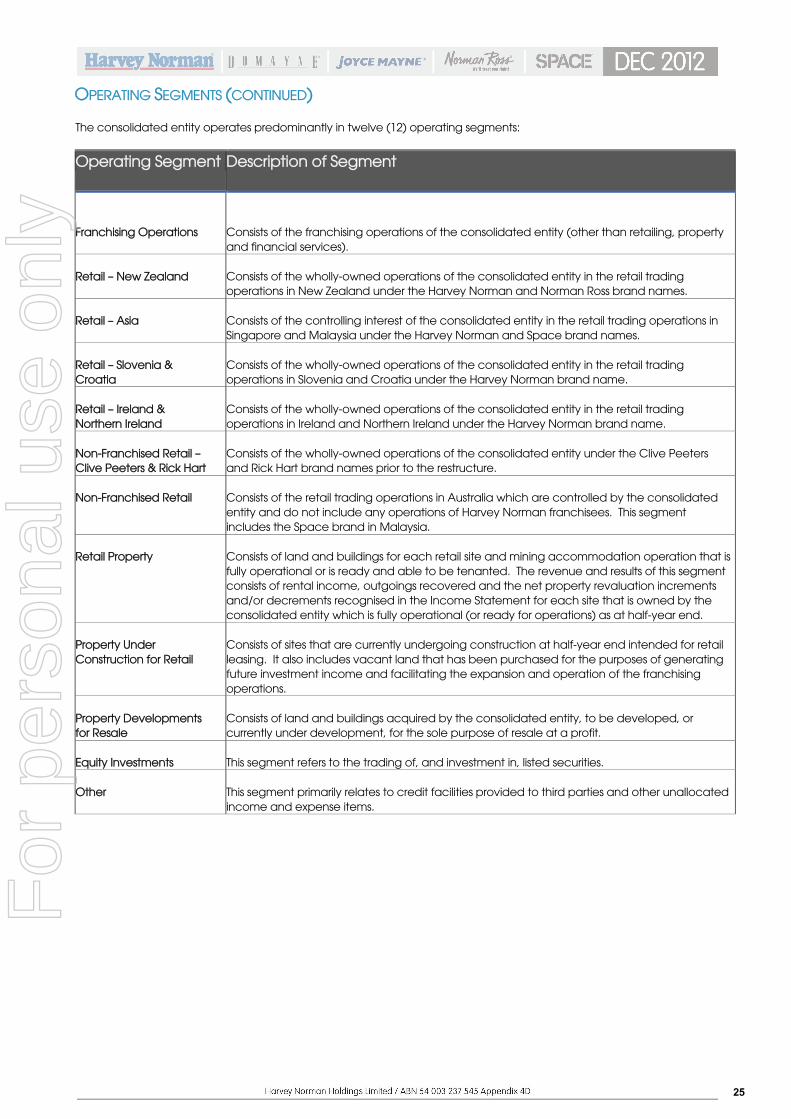
OPERATING SEGMENTS (CONTINUED) The consolidated entity operates predominantly in twelve (12) operating segments:
Operating Segment Description of Segment
Franchising Operations
Consists of the franchising operations of the consolidated entity (other than retailing, property and financial services).
Retail – New Zealand
Consists of the wholly-owned operations of the consolidated entity in the retail trading operations in New Zealand under the Harvey Norman and Norman Ross brand names.
Retail – Asia
Consists of the controlling interest of the consolidated entity in the retail trading operations in Singapore and Malaysia under the Harvey Norman and Space brand names.
Retail – Slovenia & Croatia
Consists of the wholly-owned operations of the consolidated entity in the retail trading operations in Slovenia and Croatia under the Harvey Norman brand name.
Retail – Ireland & Northern Ireland
Consists of the wholly-owned operations of the consolidated entity in the retail trading operations in Ireland and Northern Ireland under the Harvey Norman brand name.
Non-Franchised Retail – Clive Peeters & Rick Hart
Consists of the wholly-owned operations of the consolidated entity under the Clive Peeters and Rick Hart brand names prior to the restructure.
Non-Franchised Retail
Consists of the retail trading operations in Australia which are controlled by the consolidated entity and do not include any operations of Harvey Norman franchisees. This segment includes the Space brand in Malaysia.
Retail Property
Consists of land and buildings for each retail site and mining accommodation operation that is fully operational or is ready and able to be tenanted. The revenue and results of this segment consists of rental income, outgoings recovered and the net property revaluation increments and/or decrements recognised in the Income Statement for each site that is owned by the consolidated entity which is fully operational (or ready for operations) as at half-year end.
Property Under Construction for Retail
Consists of sites that are currently undergoing construction at half-year end intended for retail leasing. It also includes vacant land that has been purchased for the purposes of generating future investment income and facilitating the expansion and operation of the franchising operations.
Property Developments for Resale
Consists of land and buildings acquired by the consolidated entity, to be developed, or currently under development, for the sole purpose of resale at a profit.
Equity Investments
This segment refers to the trading of, and investment in, listed securities.
Other
This segment primarily relates to credit facilities provided to third parties and other unallocated income and expense items.
For
per
sona
l use
onl
y

26
1.
Statement of Significant Accounting Policies
(a) Corporate Information The financial report of Harvey Norman Holdings Limited for the half-year ended 31 December 2012 was authorised for issue in accordance with a resolution of the directors on 28 February 2013. Harvey Norman Holdings Limited (the “Company”) is a company limited by shares incorporated in Australia whose shares are publicly traded on the Australian stock exchange.
(b) Basis of Preparation The half-year financial report does not include all notes of the type normally included within the annual financial report and therefore cannot be expected to provide as full an understanding of the financial performance, financial position and financing and investing activities of the consolidated entity as the full financial report. The half-year financial report should be read in conjunction with the annual Financial Report of Harvey Norman Holdings Limited as at 30 June 2012. It is also recommended that the half-year financial report be considered together with any public announcements made by Harvey Norman Holdings Limited and its controlled entities during the half-year ended 31 December 2012 in accordance with the continuous disclosure obligations arising under the Corporations Act 2001. The half-year consolidated financial report is a general-purpose financial report, which has been prepared in accordance with the requirements of the Corporations Act 2001 and Accounting Standard AASB 134 “Interim Financial Reporting”. The financial report has been prepared on a historical cost basis, except for investment properties, land and buildings, derivative financial instruments, listed shares held for trading and available-for-sale investments, which have been measured at fair value. The carrying values of recognised assets and liabilities that are hedged items in fair value hedges, and are otherwise carried at cost, are adjusted to record changes in the fair values attributable to the risks that are being hedged. The financial report is presented in Australian dollars and all values are rounded to the nearest thousand dollars ($’000) unless otherwise stated under the option available to the consolidated entity under ASIC Class Order 98/0100. The consolidated entity is an entity to which the class order applies. (c) Summary of Significant Accounting Policies These consolidated financial statements have been prepared using the same accounting policies as used in the annual financial statements for the year ended 30 June 2012, except for the adoption of amending standards mandatory for annual periods beginning on or after 1 July 2012. The adoption of the amending standards did not have a significant impact on the consolidated entity.
NOTES TO THE FINANCIAL STATEMENTS
For
per
sona
l use
onl
y

27
NOTES TO THE FINANCIAL STATEMENTS (CONTINUED)
C O N S O L I D A T E D
December 2012
December 2011
$000 $000
2.
Revenues
Revenue from the sale of products 676,935 806,879
Gross revenue from franchisees:
- Franchise fees 360,925 386,217
- Rent 112,763 109,458
- Interest 15,914 16,260
Total revenue received from franchisees
489,602
511,935
Rent received from other third parties 29,890 23,477
Interest received from other unrelated parties 6,449 4,276
Dividends from other unrelated parties 822 1,243
Total other revenues
526,763
540,931
Share of net profit from joint venture entities (Note 27)
10,968
6,086
Total revenues
1,214,666
1,353,896
Other Income Items:
Net property revaluation increment on Australian investment properties - 11,903
Reversal of a previous property revaluation decrement - 2,867
Net profit on the revaluation of equity investments to fair value 4,883 -
Net foreign exchange gains 740 538
Other revenue 16,433 27,871
Total other income items
22,056
43,179
Total revenues and other income items
1,236,722
1,397,075
Total revenue is disclosed on the Income Statement as follows:
Sales revenue 676,935 806,879
Other revenues 526,763 540,931
Other income items 22,056 43,179
Total other revenues and income items
548,819
584,110
Share of net profit of joint venture entities
10,968
6,086
Total revenues and other income items
1,236,722
1,397,075
For
per
sona
l use
onl
y
28
NOTES TO THE FINANCIAL STATEMENTS (CONTINUED)
C O N S O L I D A T E D
December 2012
December 2011
$000 $000
3.
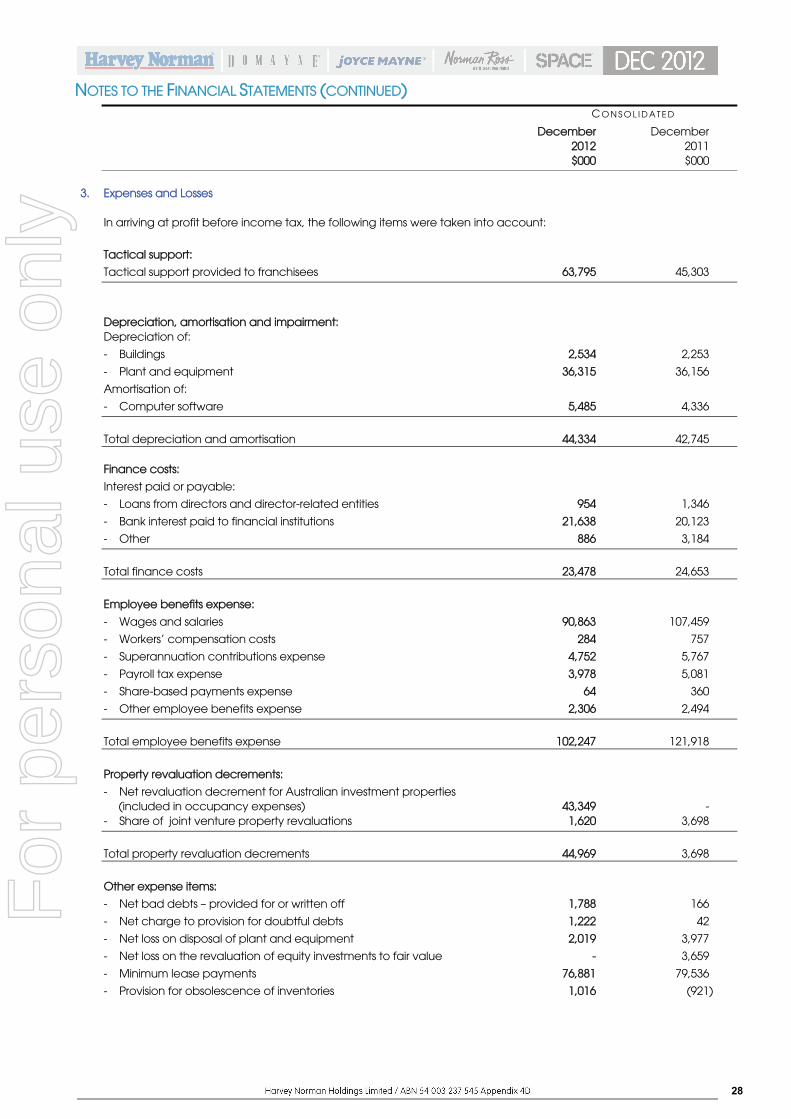
Expenses and Losses
In arriving at profit before income tax, the following items were taken into account:
Tactical support:
Tactical support provided to franchisees 63,795 45,303
Depreciation, amortisation and impairment:
Depreciation of:
- Buildings 2,534 2,253
- Plant and equipment 36,315 36,156
Amortisation of:
- Computer software 5,485 4,336
Total depreciation and amortisation
44,334
42,745
Finance costs:
Interest paid or payable:
- Loans from directors and director-related entities 954 1,346
- Bank interest paid to financial institutions 21,638 20,123
- Other 886 3,184
Total finance costs
23,478
24,653
Employee benefits expense:
- Wages and salaries 90,863 107,459
- Workers’ compensation costs 284 757
- Superannuation contributions expense 4,752 5,767
- Payroll tax expense 3,978 5,081
- Share-based payments expense 64 360
- Other employee benefits expense 2,306 2,494
Total employee benefits expense
102,247
121,918
Property revaluation decrements:
- Net revaluation decrement for Australian investment properties (included in occupancy expenses)
43,349
-
- Share of joint venture property revaluations 1,620 3,698
Total property revaluation decrements
44,969
3,698
Other expense items:
- Net bad debts – provided for or written off 1,788 166
- Net charge to provision for doubtful debts 1,222 42
- Net loss on disposal of plant and equipment 2,019 3,977
- Net loss on the revaluation of equity investments to fair value - 3,659
- Minimum lease payments 76,881 79,536
- Provision for obsolescence of inventories 1,016 (921)
For
per
sona
l use
onl
y

29
NOTES TO THE FINANCIAL STATEMENTS (CONTINUED)
(a) Weighted Average Number of Ordinary Shares The number of ordinary shares on issue at 31 December 2012 was 1,062,316,784 (December 2011: 1,062,316,784). There has been no movement in the weighted average number of ordinary shares used in calculating basic earnings per share as there has been no movement in the number of shares on issue since the previous reporting period. There has been no exercise of share options granted under any executive option plans in respect of previous years. (b) Effect of Dilutive Securities On 29 November 2010, the consolidated entity issued 3,000,000 unlisted options to certain executive directors (the “First Tranche”). These options are capable of exercise from 1 January 2014 to 30 June 2016 at an exercise price of $3.02 per option. The options were valued at grant date utilising the assumptions underlying the Black-Scholes methodology. Under this valuation methodology, the value of each option was $0.87 per option or $2,610,000 in total. On 13 June 2012, the consolidated entity announced that a total of 966,000 options over 966,000 shares in respect of the First Tranche had lapsed and will never be exercisable by the participants. On 29 November 2011, the consolidated entity issued 3,000,000 unlisted options to certain executive directors (the “Second Tranche”). These options are capable of exercise from 1 January 2015 to 30 June 2017 at an exercise price of $2.03 per option. The options were valued at grant date utilising the assumptions underlying the Black-Scholes methodology. Under this valuation methodology, the value of each option was $0.51 per option or $1,530,000 in total. On 29 November 2012, the consolidated entity announced that a total of 2,250,000 options over 2,250,000 shares in respect of the Second Tranche had lapsed and will never be exercisable by the participants. On 29 November 2012, the consolidated entity issued 3,000,000 unlisted options to certain executive directors (the “Third Tranche”). These options are capable of exercise from 1 January 2016 to 30 June 2018 at an exercise price of $1.83 per option. The options were valued at grant date utilising the assumptions underlying the Black-Scholes methodology. Under this valuation methodology, the value of each option was $0.282 per option or $846,000 in total. Options issued pursuant to the First Tranche and the Second Tranche have both been excluded from the calculation of diluted earnings per share as the exercise price of each of the options granted was higher than the average market price of an ordinary share as calculated during the half year. Options issued pursuant to the Third Tranche have been included in the calculation of diluted earnings per share as the exercise price of each of the options granted was less than the average market price of an ordinary share from the grant date to 31 December 2012. There have been no other conversions to, calls of, or subscriptions for ordinary shares or issues of potential ordinary shares since the reporting date.
C O N S O L I D A T E D
December 2012
December 2011
$000 $000
4. Earnings Per Share
The following reflects the income and share data used in the calculations of basic and diluted earnings per share:
Profit after tax 82,654 130,833
Profit after tax attributable to non-controlling interests (731) (1,886)
Profit after tax attributable to the parent
81,923
128,947
NU M B E R O F SH A R E S
December 2012
December 2011
Weighted average number of ordinary shares used in calculating basic earnings per share (a)
1,062,316,784
1,062,316,784
Effect of dilutive securities (b):
- Share Options 2,832 -
Adjusted weighted average number of ordinary shares used in calculating diluted earnings per share
1,062,319,616
1,062,316,784
For
per
sona
l use
onl
y
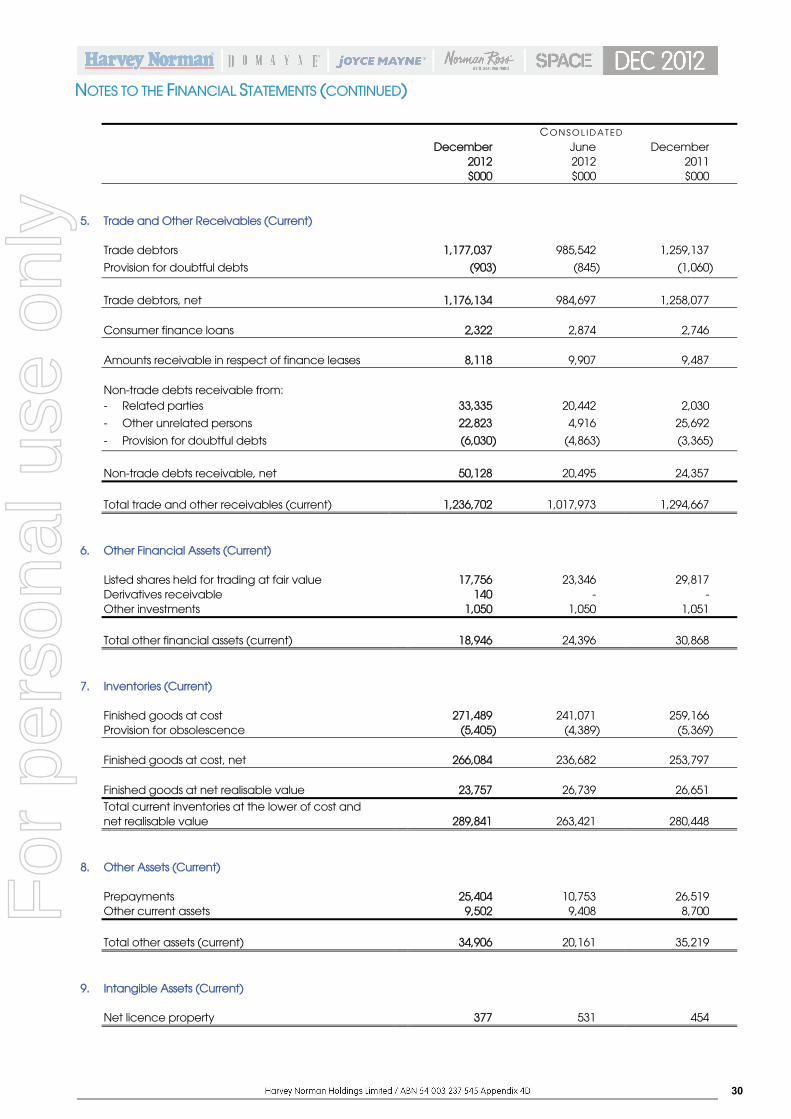
30
NOTES TO THE FINANCIAL STATEMENTS (CONTINUED)
C O N S O L I D A T E D December
2012 June 2012
December 2011
$000 $000 $000 5.
Trade and Other Receivables (Current)
Trade debtors 1,177,037 985,542 1,259,137
Provision for doubtful debts (903) (845) (1,060)
Trade debtors, net
1,176,134
984,697
1,258,077
Consumer finance loans 2,322 2,874 2,746 Amounts receivable in respect of finance leases 8,118 9,907 9,487 Non-trade debts receivable from: - Related parties 33,335 20,442 2,030
- Other unrelated persons 22,823 4,916 25,692
- Provision for doubtful debts (6,030) (4,863) (3,365)
Non-trade debts receivable, net
50,128
20,495
24,357
Total trade and other receivables (current)
1,236,702
1,017,973
1,294,667
6.
Other Financial Assets (Current)
Listed shares held for trading at fair value 17,756 23,346 29,817 Derivatives receivable 140 - - Other investments 1,050 1,050 1,051
Total other financial assets (current)
18,946
24,396
30,868 7.
Inventories (Current)
Finished goods at cost 271,489 241,071 259,166 Provision for obsolescence (5,405) (4,389) (5,369)
Finished goods at cost, net
266,084
236,682
253,797
Finished goods at net realisable value
23,757
26,739
26,651 Total current inventories at the lower of cost and
net realisable value
289,841
263,421
280,448 8.
Other Assets (Current)
Prepayments 25,404 10,753 26,519 Other current assets 9,502 9,408 8,700
Total other assets (current)
34,906
20,161
35,219
9.
Intangible Assets (Current)
Net licence property 377 531 454
For
per
sona
l use
onl
y
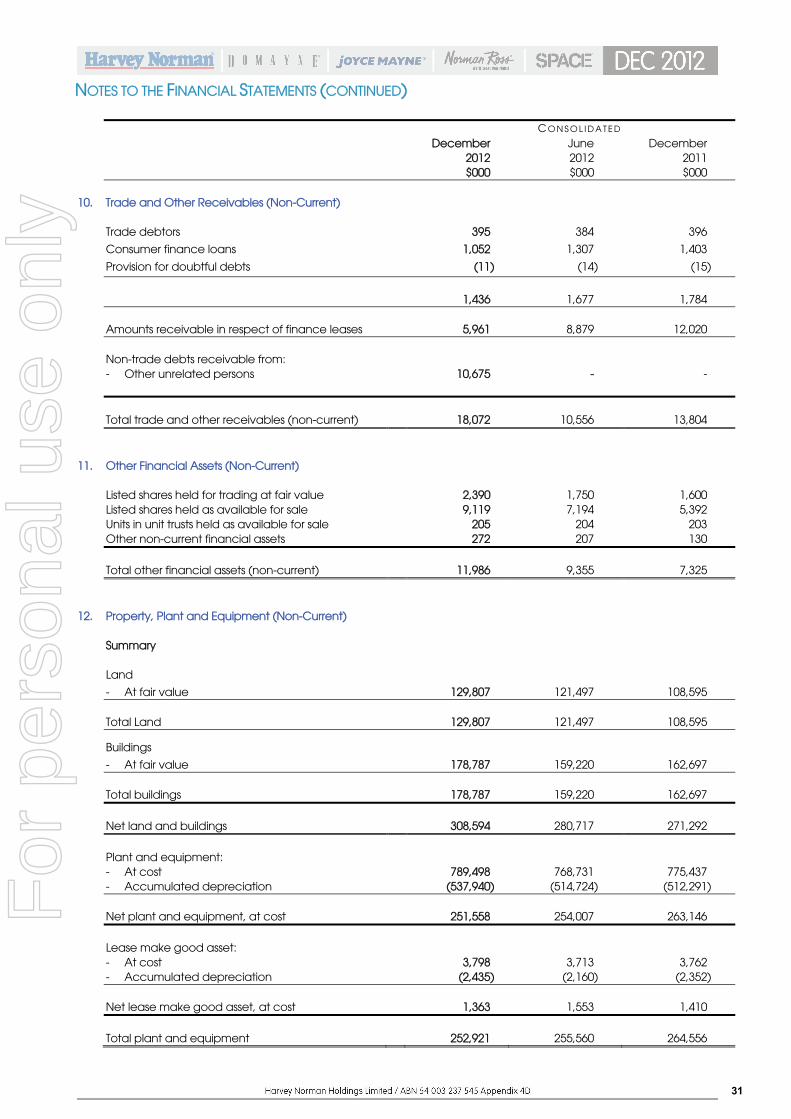
31
NOTES TO THE FINANCIAL STATEMENTS (CONTINUED)
C O N S O L I D A T E D
December
2012 June 2012
December 2011
$000 $000 $000 10.
Trade and Other Receivables (Non-Current)
Trade debtors 395 384 396
Consumer finance loans 1,052 1,307 1,403
Provision for doubtful debts (11) (14) (15)
1,436
1,677
1,784
Amounts receivable in respect of finance leases
5,961
8,879
12,020
Non-trade debts receivable from: - Other unrelated persons 10,675 - -
Total trade and other receivables (non-current)
18,072
10,556
13,804
11.
Other Financial Assets (Non-Current)
Listed shares held for trading at fair value 2,390 1,750 1,600 Listed shares held as available for sale 9,119 7,194 5,392 Units in unit trusts held as available for sale 205 204 203 Other non-current financial assets 272 207 130
Total other financial assets (non-current)
11,986
9,355
7,325 12.
Property, Plant and Equipment (Non-Current)
Summary Land
- At fair value 129,807 121,497 108,595
Total Land
129,807
121,497
108,595 Buildings
- At fair value 178,787 159,220 162,697
Total buildings
178,787
159,220
162,697
Net land and buildings
308,594
280,717
271,292
Plant and equipment: - At cost 789,498 768,731 775,437 - Accumulated depreciation (537,940) (514,724) (512,291)
Net plant and equipment, at cost
251,558
254,007
263,146 Lease make good asset: - At cost 3,798 3,713 3,762 - Accumulated depreciation (2,435) (2,160) (2,352)
Net lease make good asset, at cost
1,363
1,553
1,410
Total plant and equipment
252,921
255,560
264,556
For
per
sona
l use
onl
y
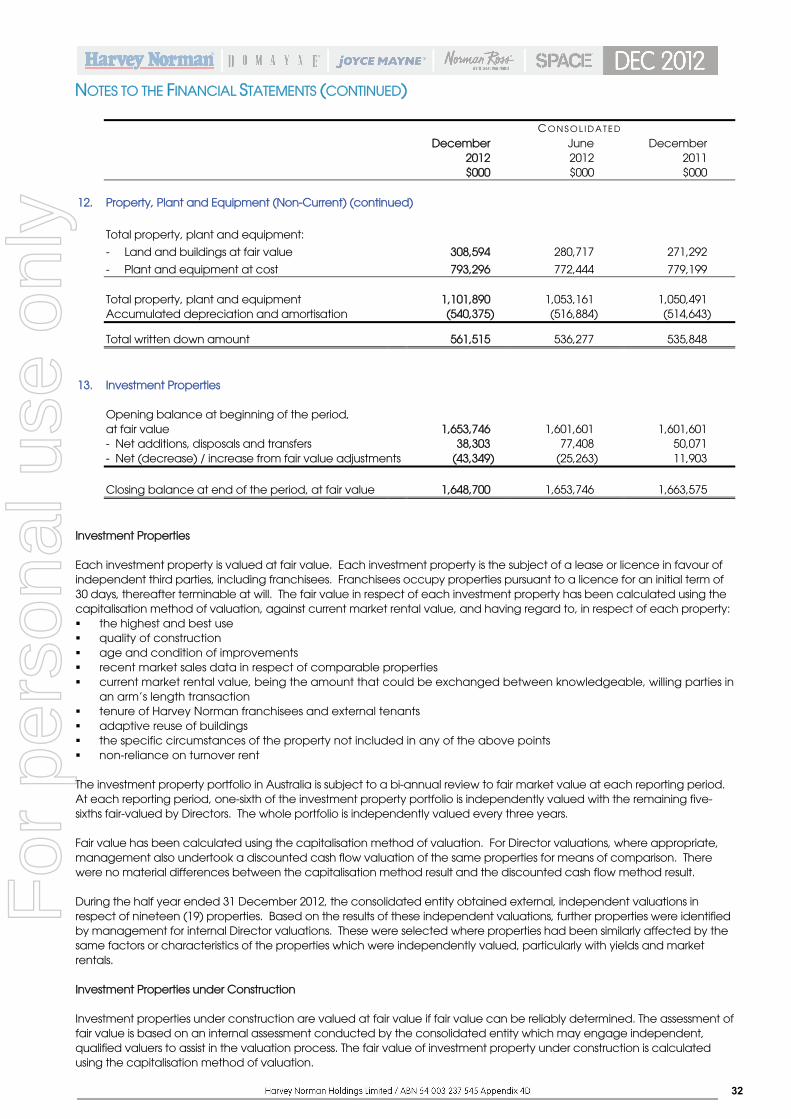
32
NOTES TO THE FINANCIAL STATEMENTS (CONTINUED)
C O N S O L I D A T E D December
2012 June 2012
December 2011
$000 $000 $000 12.
Property, Plant and Equipment (Non-Current) (continued)
Total property, plant and equipment:
- Land and buildings at fair value 308,594 280,717 271,292
- Plant and equipment at cost 793,296 772,444 779,199
Total property, plant and equipment
1,101,890
1,053,161
1,050,491 Accumulated depreciation and amortisation (540,375) (516,884) (514,643)
Total written down amount 561,515 536,277 535,848
13.
Investment Properties
Opening balance at beginning of the period,
at fair value
1,653,746
1,601,601
1,601,601 - Net additions, disposals and transfers 38,303 77,408 50,071 - Net (decrease) / increase from fair value adjustments (43,349) (25,263) 11,903
Closing balance at end of the period, at fair value
1,648,700
1,653,746
1,663,575 Investment Properties Each investment property is valued at fair value. Each investment property is the subject of a lease or licence in favour of independent third parties, including franchisees. Franchisees occupy properties pursuant to a licence for an initial term of 30 days, thereafter terminable at will. The fair value in respect of each investment property has been calculated using the capitalisation method of valuation, against current market rental value, and having regard to, in respect of each property: the highest and best use quality of construction age and condition of improvements recent market sales data in respect of comparable properties current market rental value, being the amount that could be exchanged between knowledgeable, willing parties in
an arm’s length transaction tenure of Harvey Norman franchisees and external tenants adaptive reuse of buildings the specific circumstances of the property not included in any of the above points non-reliance on turnover rent
The investment property portfolio in Australia is subject to a bi-annual review to fair market value at each reporting period. At each reporting period, one-sixth of the investment property portfolio is independently valued with the remaining five-sixths fair-valued by Directors. The whole portfolio is independently valued every three years. Fair value has been calculated using the capitalisation method of valuation. For Director valuations, where appropriate, management also undertook a discounted cash flow valuation of the same properties for means of comparison. There were no material differences between the capitalisation method result and the discounted cash flow method result. During the half year ended 31 December 2012, the consolidated entity obtained external, independent valuations in respect of nineteen (19) properties. Based on the results of these independent valuations, further properties were identified by management for internal Director valuations. These were selected where properties had been similarly affected by the same factors or characteristics of the properties which were independently valued, particularly with yields and market rentals. Investment Properties under Construction Investment properties under construction are valued at fair value if fair value can be reliably determined. The assessment of fair value is based on an internal assessment conducted by the consolidated entity which may engage independent, qualified valuers to assist in the valuation process. The fair value of investment property under construction is calculated using the capitalisation method of valuation.
For
per
sona
l use
onl
y
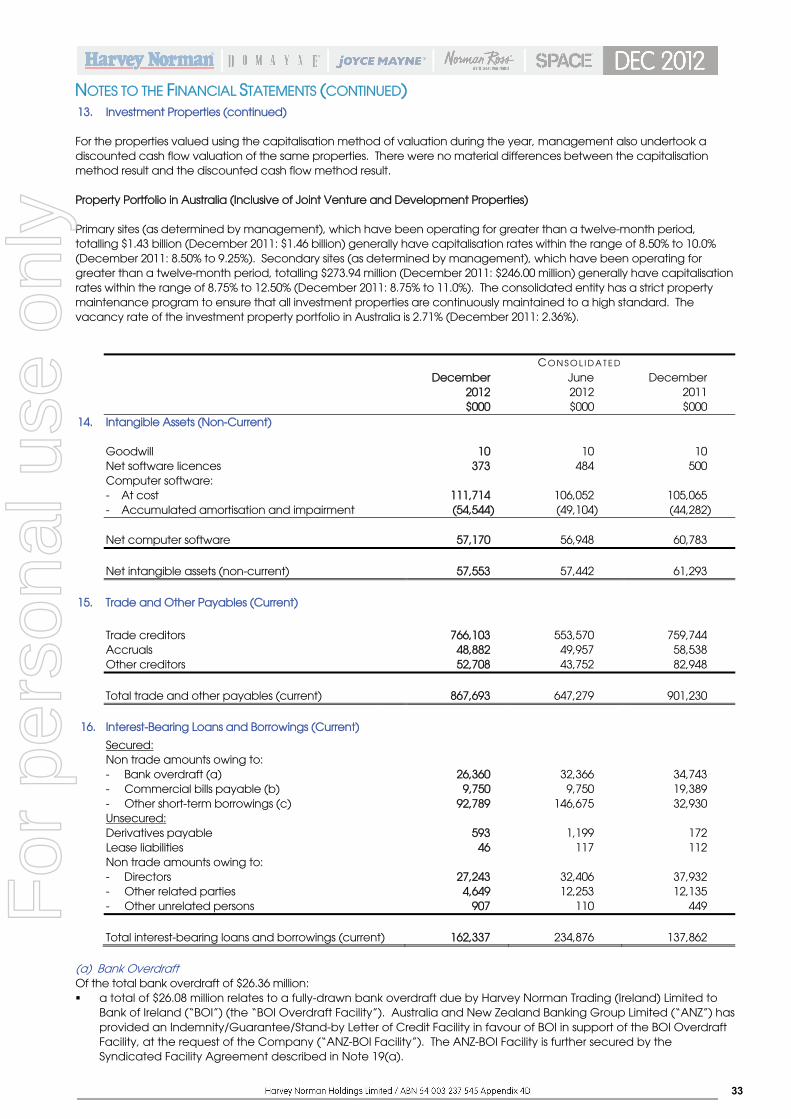
33
NOTES TO THE FINANCIAL STATEMENTS (CONTINUED)
13. Investment Properties (continued) For the properties valued using the capitalisation method of valuation during the year, management also undertook a discounted cash flow valuation of the same properties. There were no material differences between the capitalisation method result and the discounted cash flow method result. Property Portfolio in Australia (Inclusive of Joint Venture and Development Properties) Primary sites (as determined by management), which have been operating for greater than a twelve-month period, totalling $1.43 billion (December 2011: $1.46 billion) generally have capitalisation rates within the range of 8.50% to 10.0% (December 2011: 8.50% to 9.25%). Secondary sites (as determined by management), which have been operating for greater than a twelve-month period, totalling $273.94 million (December 2011: $246.00 million) generally have capitalisation rates within the range of 8.75% to 12.50% (December 2011: 8.75% to 11.0%). The consolidated entity has a strict property maintenance program to ensure that all investment properties are continuously maintained to a high standard. The vacancy rate of the investment property portfolio in Australia is 2.71% (December 2011: 2.36%).
C O N S O L I D A T E D December
2012 June 2012
December 2011
$000 $000 $000 14. Intangible Assets (Non-Current) Goodwill 10 10 10 Net software licences 373 484 500 Computer software: - At cost 111,714 106,052 105,065 - Accumulated amortisation and impairment (54,544) (49,104) (44,282)
Net computer software
57,170
56,948
60,783
Net intangible assets (non-current)
57,553
57,442
61,293 15. Trade and Other Payables (Current) Trade creditors 766,103 553,570 759,744 Accruals 48,882 49,957 58,538 Other creditors 52,708 43,752 82,948
Total trade and other payables (current)
867,693
647,279
901,230
16. Interest-Bearing Loans and Borrowings (Current) Secured: Non trade amounts owing to: - Bank overdraft (a) 26,360 32,366 34,743 - Commercial bills payable (b) 9,750 9,750 19,389 - Other short-term borrowings (c) 92,789 146,675 32,930 Unsecured: Derivatives payable 593 1,199 172 Lease liabilities 46 117 112 Non trade amounts owing to: - Directors 27,243 32,406 37,932 - Other related parties 4,649 12,253 12,135 - Other unrelated persons 907 110 449
Total interest-bearing loans and borrowings (current)
162,337
234,876
137,862 (a) Bank Overdraft Of the total bank overdraft of $26.36 million: a total of $26.08 million relates to a fully-drawn bank overdraft due by Harvey Norman Trading (Ireland) Limited to
Bank of Ireland (“BOI”) (the “BOI Overdraft Facility”). Australia and New Zealand Banking Group Limited (“ANZ”) has provided an Indemnity/Guarantee/Stand-by Letter of Credit Facility in favour of BOI in support of the BOI Overdraft Facility, at the request of the Company (“ANZ-BOI Facility”). The ANZ-BOI Facility is further secured by the Syndicated Facility Agreement described in Note 19(a).
For
per
sona
l use
onl
y

34
NOTES TO THE FINANCIAL STATEMENTS (CONTINUED)
16. Interest-Bearing Loans and Borrowings (Current) (continued) a total of $0.28 million relates to a bank overdraft facility with AmBank (M) Berhad in Malaysia which is subject to
periodic review. The Company has granted a guarantee to AmBank (M) Berhad in Malaysia in respect of the obligations of Space Furniture Collection Sdn Bhd.
(b) Commercial Bills Payable The commercial bills payable form part of facilities granted by ANZ. The payment of each commercial bill is secured by the securities given pursuant to the Syndicated Facility Agreement (as defined in Note 19(a)), and subject to annual review by ANZ. Each commercial bill has a tenure not exceeding 180 days but is repayable on demand by ANZ, upon the occurrence of any event of default or Relevant Event (as defined in Note 19(a)) under the Syndicated Facility Agreement, or after any annual review date. (c) Other Short –Term Borrowings Of the total other short-term borrowings of $92.79 million: a total of $85.00 million is secured by the securities given pursuant to a separate further facility agreement that
was established on 17 February 2012 by a subsidiary of the Company (as borrower), and several other subsidiaries of the Company (as guarantors), with certain banks totalling $85.00 million (the “Syndicated Working Capital Facility”). Refer to further details below on the Syndicated Working Capital Facility.
a total of $5.20 million relates to a revolving credit facility with ANZ in Singapore. This facility is subject to periodic review and is secured by the securities given pursuant to the Syndicated Facility Agreement (as defined in Note 19(a)).
a total of $1.42 million relates to a revolving credit facility with Hypo Alpe-Adria-Bank d.d. in Slovenia. This facility will be repaid in full on 1 October 2013. The Company has granted an independent first demand guarantee to Hypo Alpe-Adria-Bank d.d. in Slovenia in respect of the obligations of Harvey Norman Trading d.o.o.
A total of $0.70 million relates to a cash advance facility with ANZ in Australia which is subject to periodic review. The Company has granted a guarantee to ANZ in Australia in respect of the obligations of Glo Light Pty Limited.
a total of $0.47 million relates to a revolving credit facility with AmBank (M) Berhad in Malaysia which is reviewed on an annual basis. The Company has granted a guarantee to AmBank (M) Berhad in Malaysia in respect of the obligations of Space Furniture Collection Sdn Bhd.
Syndicated Working Capital Facility The Syndicated Working Capital Facility is a twelve (12) month revolving facility, secured by properties located in Australia and New Zealand. The utilised portion of $85.00 million is secured by the securities given pursuant to the Syndicated Working Capital Facility. The Syndicated Working Capital Facility was originally due for repayment on 17 February 2013. On 23 January 2013, the Syndicated Working Capital Facility was renegotiated and is repayable: (a) on 16 February 2014; (b) otherwise on demand by or on behalf of the lenders under the Syndicated Working Capital Facility (the
“Syndicated Working Capital Facility Lenders”) upon the occurrence of any one of a number of events (each a “Syndicated Working Capital Facility Relevant Event”), including events which are not within the control of the Company, the Borrower or the Guarantors. Each of the foll1owing is a Syndicated Working Capital Facility Relevant Event:
(i) an event occurs which has or is reasonably likely to have a material adverse effect on the business, operation, property, condition (financial or otherwise) or prospects of the Borrower or the Company and the subsidiaries of the Company;
(ii) if any change in law or other event makes it illegal or impractical for a Syndicated Working Capital Facility Lender to perform its obligations under the Syndicated Working Capital Facility Agreement or fund or maintain the amount committed by that Syndicated Working Capital Facility Lender to the provision of the Syndicated Working Capital Facility ("Syndicated Working Capital Facility Commitment"), the Syndicated Working Capital Facility Lender may by notice to the Borrower, require the Borrower to repay the secured moneys in respect of the Syndicated Working Capital Facility Commitment of that Syndicated Working Capital Facility Lender, in full on the date which is forty (40) business days after the date of that notice.
The Company has not received notice of the occurrence of any Relevant Event from any Financier. During the current and prior periods, there were no defaults or breaches on any of the interest-bearing loans and borrowings referred to in this note.
For
per
sona
l use
onl
y

35
NOTES TO THE FINANCIAL STATEMENTS (CONTINUED)
C O N S O L I D A T E D December
2012 June 2012
December 2011
$000 $000 $000 17.
Other Liabilities (Current)
Lease incentives 1,433 1,503 1,522 Unearned revenue 4 128 144
Total other liabilities (current)
1,437
1,631
1,666
18.
Provisions (Current)
Employee entitlements 16,003 15,843 16,659 Lease make good 1,295 1,061 2,727 Deferred lease expenses 596 737 754 Onerous lease costs 3,453 2,110 3,999 Other 420 746 487
Total provisions (current)
21,767
20,497
24,626
19.
Interest-Bearing Loans and Borrowings (Non-Current)
Secured: Non trade amounts owing to: Other borrowings
- Syndicated Facility Agreement (a)
580,000
525,000
610,000 - Other non-current borrowings (b) 77,017 675 34,986 Unsecured: Derivatives payable 16,432 18,784 16,485 Lease liabilities - 12 62
Total interest-bearing loans and borrowings (non-current)
673,449
544,471
661,533
(a) Non-Current Borrowings – Syndicated Facility Agreement On 2 December 2009, the Company, a subsidiary of the Company (“Borrower”) and certain other subsidiaries of the Company (“Guarantors”) entered into a Syndicated Facility Agreement with certain banks (“Financiers” and each a “Financier”) in relation to a loan facility of $435.00 million (the “Original Facility”). The Original Facility was to be otherwise repayable on 3 December 2012. On 22 December 2011, the Borrower and Guarantors entered into arrangements to increase the amount of the Original Facility to $610.00 million (the “Increased Facility”) and to further secure the liability of the Company to ANZ pursuant to the ANZ-BOI Facility (refer to Note 16(a)). The Increased Facility is secured by: (a) a fixed and floating charge granted by the Company and each of the Guarantors in favour of a security trustee for
the Financiers; and (b) real estate mortgages granted by certain Guarantors in favour of the security trustee for the Financiers over various
real properties owned by those Guarantors. Under the terms of the Syndicated Facility Agreement, the Increased Facility is repayable: (a) as to $370 million, on 22 December 2014; (b) as to $240 million, on 22 December 2016; (c) otherwise on demand by or on behalf of the Financiers upon the occurrence of any one of a number of events
(each a “Relevant Event”), including events which are not within the control of the Company, the Borrower or the Guarantors. Each of the following is a Relevant Event:
For
per
sona
l use
onl
y
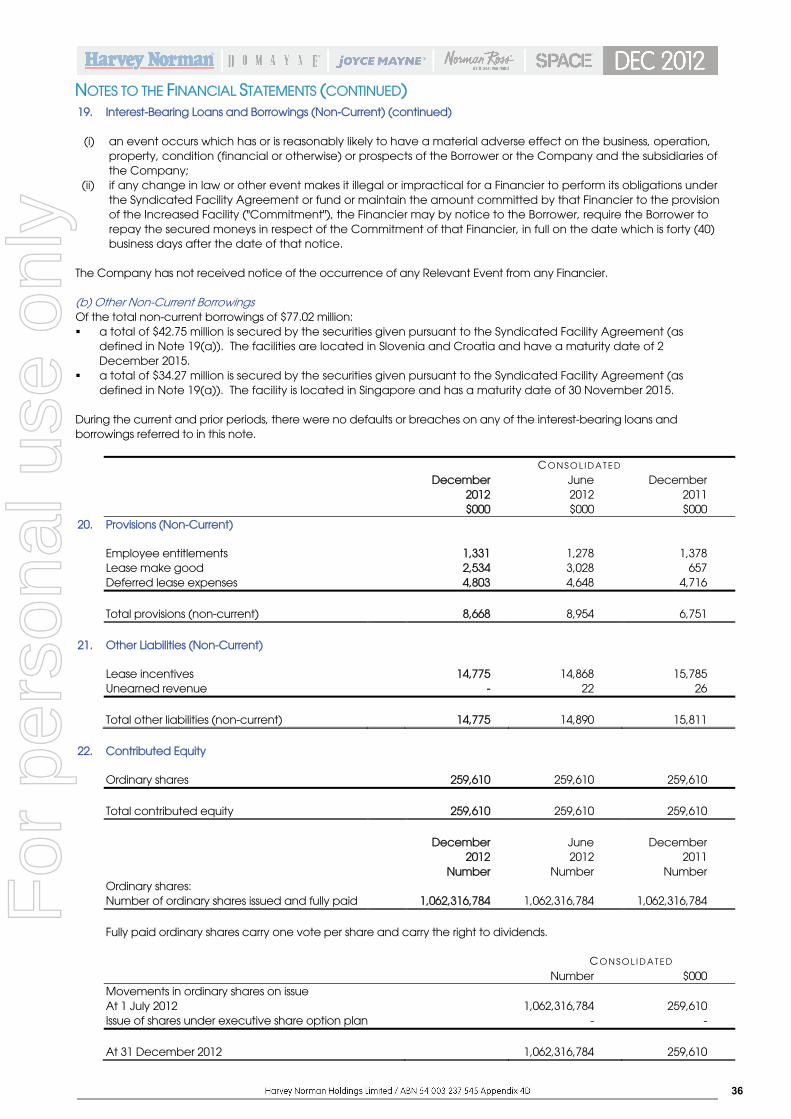
36
NOTES TO THE FINANCIAL STATEMENTS (CONTINUED)
19. Interest-Bearing Loans and Borrowings (Non-Current) (continued)
(i) an event occurs which has or is reasonably likely to have a material adverse effect on the business, operation, property, condition (financial or otherwise) or prospects of the Borrower or the Company and the subsidiaries of the Company;
(ii) if any change in law or other event makes it illegal or impractical for a Financier to perform its obligations under the Syndicated Facility Agreement or fund or maintain the amount committed by that Financier to the provision of the Increased Facility ("Commitment"), the Financier may by notice to the Borrower, require the Borrower to repay the secured moneys in respect of the Commitment of that Financier, in full on the date which is forty (40) business days after the date of that notice.
The Company has not received notice of the occurrence of any Relevant Event from any Financier. (b) Other Non-Current Borrowings Of the total non-current borrowings of $77.02 million: a total of $42.75 million is secured by the securities given pursuant to the Syndicated Facility Agreement (as
defined in Note 19(a)). The facilities are located in Slovenia and Croatia and have a maturity date of 2 December 2015.
a total of $34.27 million is secured by the securities given pursuant to the Syndicated Facility Agreement (as defined in Note 19(a)). The facility is located in Singapore and has a maturity date of 30 November 2015.
During the current and prior periods, there were no defaults or breaches on any of the interest-bearing loans and borrowings referred to in this note. C O N S O L I D A T E D December
2012 June 2012
December 2011
$000 $000 $000 20. Provisions (Non-Current) Employee entitlements 1,331 1,278 1,378 Lease make good 2,534 3,028 657 Deferred lease expenses 4,803 4,648 4,716
Total provisions (non-current)
8,668
8,954
6,751
21. Other Liabilities (Non-Current)
Lease incentives 14,775 14,868 15,785 Unearned revenue - 22 26
Total other liabilities (non-current)
14,775
14,890
15,811
22. Contributed Equity Ordinary shares 259,610 259,610 259,610
Total contributed equity
259,610
259,610
259,610
December
2012 June 2012
December 2011
Number Number Number Ordinary shares: Number of ordinary shares issued and fully paid 1,062,316,784 1,062,316,784 1,062,316,784
Fully paid ordinary shares carry one vote per share and carry the right to dividends. C O N S O L I D A T E D Number $000 Movements in ordinary shares on issue At 1 July 2012 1,062,316,784 259,610 Issue of shares under executive share option plan - -
At 31 December 2012
1,062,316,784
259,610
For
per
sona
l use
onl
y
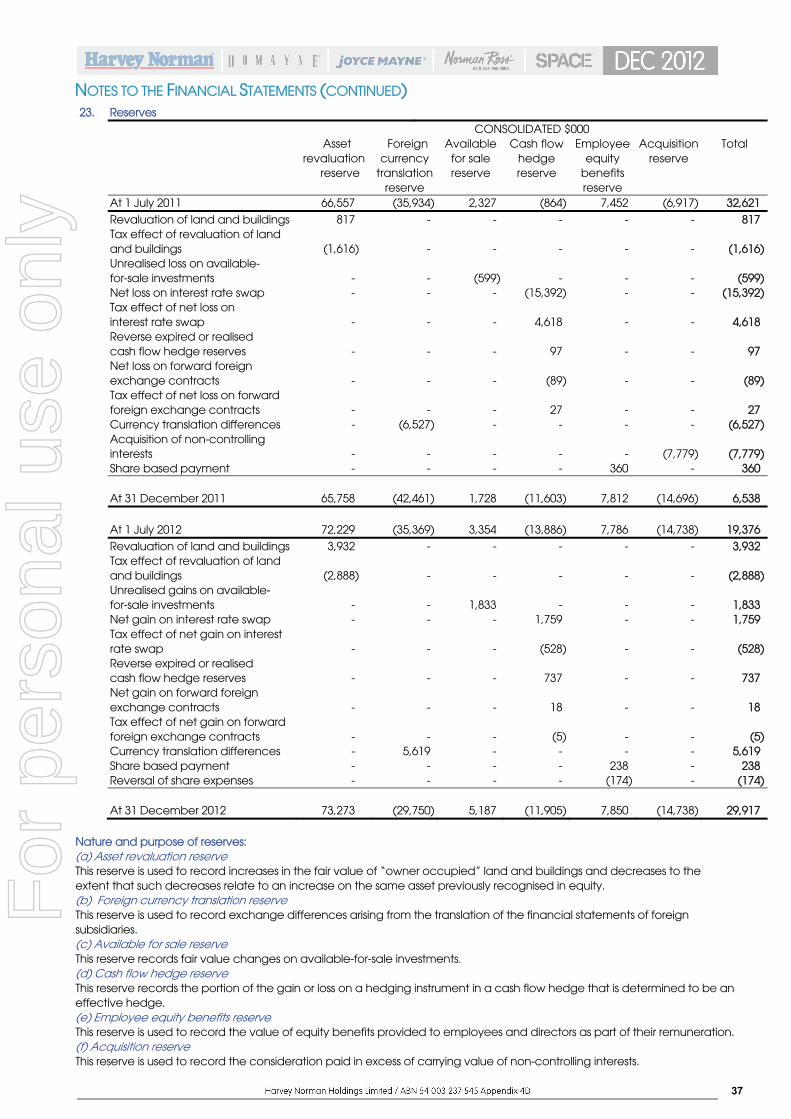
37
NOTES TO THE FINANCIAL STATEMENTS (CONTINUED)
Nature and purpose of reserves: (a) Asset revaluation reserve This reserve is used to record increases in the fair value of “owner occupied” land and buildings and decreases to the extent that such decreases relate to an increase on the same asset previously recognised in equity. (b) Foreign currency translation reserve This reserve is used to record exchange differences arising from the translation of the financial statements of foreign subsidiaries. (c) Available for sale reserve This reserve records fair value changes on available-for-sale investments. (d) Cash flow hedge reserve This reserve records the portion of the gain or loss on a hedging instrument in a cash flow hedge that is determined to be an effective hedge. (e) Employee equity benefits reserve This reserve is used to record the value of equity benefits provided to employees and directors as part of their remuneration. (f) Acquisition reserve This reserve is used to record the consideration paid in excess of carrying value of non-controlling interests.
23.
Reserves
CONSOLIDATED $000 Asset
revaluation reserve
Foreign currency
translation reserve
Available for sale reserve
Cash flow hedge reserve
Employee equity
benefits reserve
Acquisition reserve
Total
At 1 July 2011 66,557 (35,934) 2,327 (864) 7,452 (6,917) 32,621
Revaluation of land and buildings 817 - - - - - 817 Tax effect of revaluation of land
and buildings
(1,616)
-
-
-
-
-
(1,616) Unrealised loss on available-
for-sale investments
-
-
(599)
-
-
-
(599) Net loss on interest rate swap - - - (15,392) - - (15,392) Tax effect of net loss on
interest rate swap
-
-
-
4,618
-
-
4,618 Reverse expired or realised
cash flow hedge reserves
-
-
-
97
-
-
97 Net loss on forward foreign
exchange contracts
-
-
-
(89)
-
-
(89) Tax effect of net loss on forward foreign exchange contracts - - - 27 - - 27 Currency translation differences - (6,527) - - - - (6,527) Acquisition of non-controlling
interests
-
-
-
-
-
(7,779)
(7,779) Share based payment - - - - 360 - 360
At 31 December 2011
65,758
(42,461)
1,728
(11,603)
7,812
(14,696)
6,538 At 1 July 2012 72,229 (35,369) 3,354 (13,886) 7,786 (14,738) 19,376 Revaluation of land and buildings 3,932 - - - - - 3,932 Tax effect of revaluation of land
and buildings
(2,888)
-
-
-
-
-
(2,888) Unrealised gains on available-
for-sale investments
-
-
1,833
-
-
-
1,833 Net gain on interest rate swap - - - 1,759 - - 1,759 Tax effect of net gain on interest
rate swap
-
-
-
(528)
-
-
(528) Reverse expired or realised
cash flow hedge reserves
-
-
-
737
-
-
737 Net gain on forward foreign
exchange contracts
-
-
-
18
-
-
18 Tax effect of net gain on forward
foreign exchange contracts
-
-
-
(5)
-
-
(5) Currency translation differences - 5,619 - - - - 5,619 Share based payment - - - - 238 - 238 Reversal of share expenses - - - - (174) - (174)
At 31 December 2012
73,273
(29,750)
5,187
(11,905)
7,850
(14,738)
29,917
For
per
sona
l use
onl
y
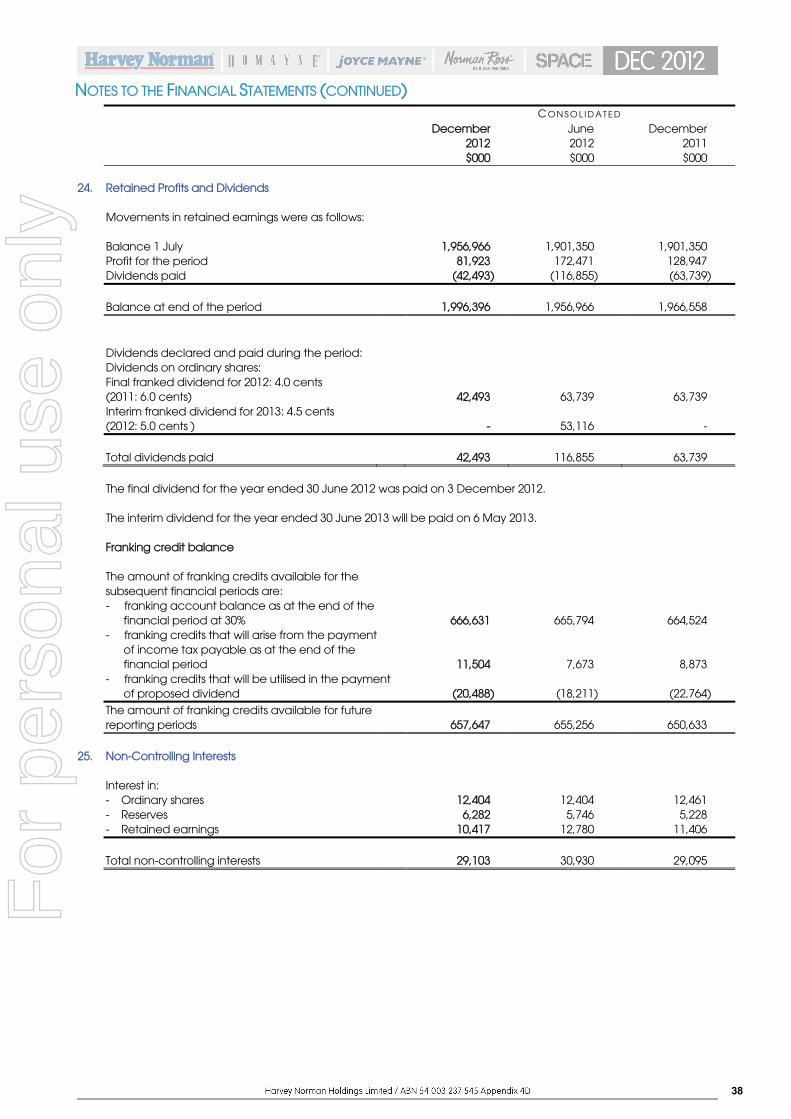
38
NOTES TO THE FINANCIAL STATEMENTS (CONTINUED)
C O N S O L I D A T E D December
2012 June 2012
December 2011
$000 $000 $000 24.
Retained Profits and Dividends
Movements in retained earnings were as follows: Balance 1 July 1,956,966 1,901,350 1,901,350 Profit for the period 81,923 172,471 128,947 Dividends paid (42,493) (116,855) (63,739)
Balance at end of the period
1,996,396
1,956,966
1,966,558
Dividends declared and paid during the period: Dividends on ordinary shares: Final franked dividend for 2012: 4.0 cents
(2011: 6.0 cents)
42,493
63,739
63,739 Interim franked dividend for 2013: 4.5 cents
(2012: 5.0 cents )
-
53,116
-
Total dividends paid
42,493
116,855
63,739 The final dividend for the year ended 30 June 2012 was paid on 3 December 2012. The interim dividend for the year ended 30 June 2013 will be paid on 6 May 2013. Franking credit balance
The amount of franking credits available for the subsequent financial periods are:
- franking account balance as at the end of the financial period at 30%
666,631
665,794
664,524
- franking credits that will arise from the payment of income tax payable as at the end of the financial period
11,504
7,673
8,873 - franking credits that will be utilised in the payment
of proposed dividend
(20,488)
(18,211)
(22,764) The amount of franking credits available for future
reporting periods
657,647
655,256
650,633 25.
Non-Controlling Interests
Interest in: - Ordinary shares 12,404 12,404 12,461 - Reserves 6,282 5,746 5,228 - Retained earnings 10,417 12,780 11,406
Total non-controlling interests
29,103
30,930
29,095
For
per
sona
l use
onl
y

39
NOTES TO THE FINANCIAL STATEMENTS (CONTINUED)
C O N S O L I D A T E D December
2012 June 2012
December 2011
$000 $000 $000 26.
Cash and Cash Equivalents
(a) Reconciliation to Cash Flow Statement Cash and cash equivalents comprise the following at
end of the period:
Cash at bank and on hand 133,387 141,159 94,387 Short term money market deposits 67,803 31,300 28,082 201,190 172,459 122,469 Bank overdraft (Note 16) (26,360) (32,366) (34,743)
Cash and cash equivalents at end of the period 174,830 140,093 87,726
C O N S O L I D A T E D December
2012 December
2011 $000 $000 (b) Reconciliation of profit after income tax to net operating cash flows:
Profit after tax
82,654
130,833 Adjustments for: Net foreign exchange gains (740) (538) Bad and doubtful debts 1,788 166 Provision for inventory obsolescence 1,016 (921) Share of net profit from joint venture entities (10,968) (6,086) Depreciation of property, plant and equipment 38,849 38,409 Amortisation 5,485 4,336 Revaluation of investment properties and properties held under
joint ventures
44,969
(8,205) Reversal of a previous property revaluation decrement - (2,867) Profit on property development - (10,000) Deferred lease expenses 230 (637) Provision for onerous leases 2,326 2,941 Other provisions 728 572 Executive remuneration expenses 64 360 Accrued income items (3,394) (2,072) Transfers to provisions: - Employee entitlements (112) (4,756) - Doubtful debts 1,222 42 (Profit) / loss on disposal and revaluation of: - Property, plant and equipment, and listed securities (2,864) 7,636 Changes in assets and liabilities net of effects from purchase and sale of
controlled entities:
(Increase)/decrease in assets: Receivables (193,403) (233,951) Inventory (27,438) 57,215 Other current assets (14,745) (14,179) Deferred tax assets (277) (2,883) Increase in liabilities: Payables and other current liabilities 208,029 61,269 Income tax payable 471 3,192 Net cash from operating activities 133,890 19,876
For
per
sona
l use
onl
y
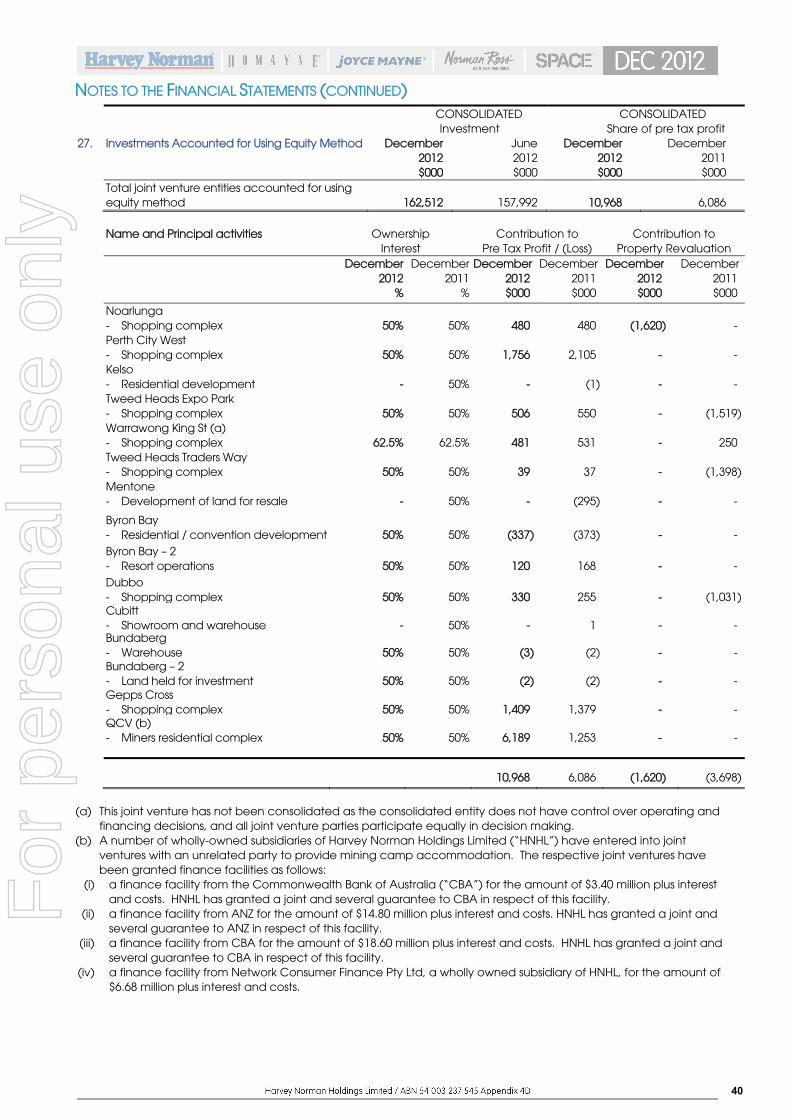
40
NOTES TO THE FINANCIAL STATEMENTS (CONTINUED)
CONSOLIDATED CONSOLIDATED 27.
Investments Accounted for Using Equity Method
Investment Share of pre tax profit December
2012 June 2012
December 2012
December 2011
$000 $000 $000 $000 Total joint venture entities accounted for using
equity method
162,512
157,992
10,968
6,086
Name and Principal activities Ownership
Interest Contribution to
Pre Tax Profit / (Loss) Contribution to
Property Revaluation
December 2012
December 2011
December 2012
December 2011
December 2012
December 2011
% % $000 $000 $000 $000
Noarlunga - Shopping complex
50%
50%
480
480
(1,620)
-
Perth City West - Shopping complex
50%
50%
1,756
2,105
-
-
Kelso - Residential development
-
50%
-
(1)
-
-
Tweed Heads Expo Park - Shopping complex
50%
50%
506
550
-
(1,519)
Warrawong King St (a) - Shopping complex
62.5%
62.5%
481
531
-
250
Tweed Heads Traders Way - Shopping complex
50%
50%
39
37
-
(1,398)
Mentone - Development of land for resale
-
50%
-
(295)
-
-
Byron Bay - Residential / convention development
50%
50%
(337)
(373)
-
-
Byron Bay – 2 - Resort operations
50%
50%
120
168
-
-
Dubbo - Shopping complex
50%
50%
330
255
-
(1,031)
Cubitt - Showroom and warehouse
-
50%
-
1
-
-
Bundaberg - Warehouse
50%
50%
(3)
(2)
-
-
Bundaberg – 2 - Land held for investment
50%
50%
(2)
(2)
-
-
Gepps Cross - Shopping complex
50%
50%
1,409
1,379
-
-
QCV (b) - Miners residential complex
50%
50%
6,189
1,253
-
-
10,968 6,086 (1,620) (3,698)
(a) This joint venture has not been consolidated as the consolidated entity does not have control over operating and
financing decisions, and all joint venture parties participate equally in decision making. (b) A number of wholly-owned subsidiaries of Harvey Norman Holdings Limited (“HNHL”) have entered into joint
ventures with an unrelated party to provide mining camp accommodation. The respective joint ventures have been granted finance facilities as follows:
(i) a finance facility from the Commonwealth Bank of Australia (“CBA”) for the amount of $3.40 million plus interest and costs. HNHL has granted a joint and several guarantee to CBA in respect of this facility.
(ii) a finance facility from ANZ for the amount of $14.80 million plus interest and costs. HNHL has granted a joint and several guarantee to ANZ in respect of this facility.
(iii) a finance facility from CBA for the amount of $18.60 million plus interest and costs. HNHL has granted a joint and several guarantee to CBA in respect of this facility.
(iv) a finance facility from Network Consumer Finance Pty Ltd, a wholly owned subsidiary of HNHL, for the amount of $6.68 million plus interest and costs.
For
per
sona
l use
onl
y

41
NOTES TO THE FINANCIAL STATEMENTS (CONTINUED)
Non-Cash Financing and Investing Activities Details of financing and investing transactions which have had a material effect on consolidated assets and liabilities but did not involve cash flows are as follows.
N/A
CONSOLIDATED
December 2012
December 2011
Net Tangible Assets Per Security
Net tangible asset backing per ordinary security
2.25 2.21
Business Combinations Having Material Effect Name of business combination N/A N/A Consolidated profit/(loss) after tax of the business combination since the date in the current half year on which control was acquired
N/A
N/A
Date from which such profit has been calculated N/A N/A Profit/(loss) after tax of the controlled business combination for the whole of the previous corresponding period
N/A
N/A
Loss of Control of Entities Having Material Effect
Name of entity (or group of entities) N/A N/A Consolidated profit/(loss) from discontinued operations after tax of the controlled entity (or group of entities) for the current half year to the date of loss of control
N/A
N/A Date from which such profit/(loss) has been calculated N/A N/A Profit (loss) from discontinued operations after tax of the controlled entity (or group of entities) while controlled during the whole of the previous corresponding period
N/A
N/A
OTHER INFORMATION
For
per
sona
l use
onl
y
42
DIRECTOR’S DECLARATION
In accordance with a resolution of the directors of Harvey Norman Holdings Limited, we state that: In the opinion of the directors: (a) the financial statements, notes and the additional disclosures included in the Directors’ Report of the consolidated
entity are in accordance with the Corporations Act 2001, including:
(i) giving a true and fair view of the Company’s and consolidated entity’s financial position as at 31 December 2012 and of their performance for the half-year ended on that date; and
(ii) complying with Accounting Standards and the Corporations Regulations 2001;
(b) there are reasonable grounds to believe that the Company will be able to pay its debts as and when they become due and payable.
This declaration has been made after receiving the declarations required to be made to the directors in accordance with section 295A of the Corporations Act 2001 for the half-year ended 31 December 2012. On behalf of the Board. G. HARVEY K.L. PAGE Chairman Director / Chief Executive Officer Sydney Sydney 28 February 2013 28 February 2013
For
per
sona
l use
onl
y
43
To the members of Harvey Norman Holdings Limited
Report on the Half-Year Financial Report
We have reviewed the accompanying half-year financial report of Harvey Norman Holdings Limited which comprises statement of financial position as at 31 December 2012, income statement, statement of comprehensive income, statement of changes in equity and statement of cash flows for the half-year ended on that date, notes comprising a summary of significant accounting policies and other explanatory information, and the directors’ declaration of the consolidated entity comprising the company and the entities it controlled at the half-year end or from time to time during the half-year.
Directors’ Responsibility for the Half-Year Financial Report
The directors of the company are responsible for the preparation of the half-year financial report that gives a true and fair view in accordance with Australian Accounting Standards and the Corporations Act 2001 and for such internal controls as the directors determine are necessary to enable the preparation of the half-year financial report that is free from material misstatement, whether due to fraud or error.
Auditor’s Responsibility
Our responsibility is to express a conclusion on the half-year financial report based on our review. We conducted our review in accordance with Auditing Standard on Review Engagements ASRE 2410 Review of a Financial Report Performed by the Independent Auditor of the Entity, in order to state whether, on the basis of the procedures described, we have become aware of any matter that makes us believe that the financial report is not in accordance with the Corporations Act 2001 including: giving a true and fair view of the consolidated entity’s financial position as at 31 December 2012 and its performance for the half-year ended on that date; and complying with Accounting Standard AASB 134 Interim Financial Reporting and the Corporations Regulations 2001. As the auditor of Harvey Norman Holdings Limited and the entities it controlled during the half-year, ASRE 2410 requires that we comply with the ethical requirements relevant to the audit of the annual financial report.
A review of a half-year financial report consists of making enquiries, primarily of persons responsible for financial and accounting matters, and applying analytical and other review procedures. A review is substantially less in scope than an audit conducted in accordance with Australian Auditing Standards and consequently does not enable us to obtain assurance that we would become aware of all significant matters that might be identified in an audit. Accordingly, we do not express an audit opinion.
Independence
In conducting our review, we have complied with the independence requirements of the Corporations Act 2001. We have given to the directors of the company a written Auditor’s Independence Declaration, a copy of which is included in the Directors’ Report.
For
per
sona
l use
onl
y
44
Conclusion
Based on our review, which is not an audit, we have not become aware of any matter that makes us believe that the half-year financial report of Harvey Norman Holdings Limited is not in accordance with the Corporations Act 2001, including:
a) giving a true and fair view of the consolidated entity’s financial position as at 31 December 2012 and of its performance for the half-year ended on that date; and
b) complying with Accounting Standard AASB 134 Interim Financial Reporting and the Corporations Regulations 2001.
Ernst & Young
Katrina Zdrilic Partner Sydney 28 February 2013
For
per
sona
l use
onl
y