a post-cold war cash of civilizations? - duo - universitetet i oslo
TRANSCRIPT
A Post-Cold War Clash of Civilizations? A New Approach to Testing Huntington’s Thesis
Bård Ludvig Thorheim
Master Thesis, Department of Political Science, University of Oslo
October, 2002

Acknowledgements
I have had the benefit of much support and assistance throughout writing this
thesis. The people who have spent most time hearing about this thesis and
assisting me with it, are probably my fiancée Inger Karin Fuglesteg, and
thereafter Svein Olav Krøgli, who has provided invaluable assistance operating
GIS software. Without their support I would definitely not have accomplished
this work within the prescribed time of one year. A great share of this
accomplishment is, no doubt, due to my tutors, Bjørn Erik Rasch at the
University of Oslo and Tanja Ellingsen at the Norwegian University of Science
and Technology (NTNU), who have provided excellent guidance through every
step of the process. Not only have Tanja and Bjørn expertly guided me through
this field of research, they have also been available for me at all times. The
same goes for my tutors and good colleagues at PRIO, Scott Gates, Nils Petter
Gleditsch and Håvard Strand. In addition, I have profited much from the
scholarly environment at PRIO through my residence with a student
scholarship at this excellent research institute. The Department of Political
Science, University of Oslo, has provided extra funding for generating data.
Fredrik Skribeland has proofread the thesis and provided valuable comments. I
would also like to thank David W. Throup at the Center for Strategic and
International Studies in Washington, with whom I had many enlightening
discussions on the topic during our time as election observers in Sierra Leone.
Bård Ludvig Thorheim
1
Table of Contents
Acknowledgements .................................................................................................................................1 Table of Contents....................................................................................................................................2 1 Introduction...................................................................................................................................3
1.1 Background ...........................................................................................................................3 1.2 Overall Objective and Research Questions ...........................................................................4 1.3 Theory ...................................................................................................................................5 1.4 Definitions .............................................................................................................................6 1.5 Research Design and Methodology.......................................................................................7
2 Theoretical Framework..............................................................................................................10 2.1 The theory of Civilizations ..................................................................................................11 2.2 Huntington’s Thesis in a Theoretical Context .....................................................................19 2.3 Attempts to Test Huntington’s Thesis Empirically .............................................................24 2.4 Hypotheses ..........................................................................................................................28
3 Method and Data.........................................................................................................................33 3.1 The PRIO/Uppsala Dataset..................................................................................................36 3.2 Geographical Data ...............................................................................................................38 3.3 Combining the Data in GIS – how the “Civilizational Variable” is Generated...................42 3.4 Reliability ............................................................................................................................48 3.5 Validity................................................................................................................................50
4 Analysis ........................................................................................................................................55 4.1 The Significance of Civilizational Borders to the Pattern of Conflict .................................55 4.2 Is the Civilizational Theory more Applicable to the Post-Cold War Era?...........................62 4.3 Fault Line Wars – Bloodier and over Territory? .................................................................64 4.4 Is the Civilizational Theory only Significant for Civil Wars? .............................................67 4.5 Civilizations and their Clashes ............................................................................................68
5 A Qualitative Approach..............................................................................................................77 5.1 The Top Ten Civilizational Conflicts ..................................................................................78 5.2 Introduction to Studying Bosnia..........................................................................................84 5.3 Bosnia – A Civilizational Conflict ......................................................................................88 5.4 “The Puppet Masters” – the Instrumentalist Approach .......................................................90 5.5 Constructivists – and the Relevance of Other Variables .....................................................93 5.6 Triggers, Targets, Channels and Catalysts – Sorting the Causes of Armed Conflict ..........98 5.7 An Attempt to Answer the Initial Questions .....................................................................100
6 Conclusion .................................................................................................................................102 6.1 Findings.............................................................................................................................103 6.2 Suggestions for Further Research......................................................................................105
Bibliography........................................................................................................................................108 Appendixes ..........................................................................................................................................114 Maps and Tables Map 1…………………………………………………………………………………………………...13 Map 2…………………………………………………………………………………………………...45 Map 3…………………………………………………………………………………………………...56 Map 4………………………………………………………………………………………………..….79 Table 1…………………………………………………………………………………………………..57 Table 2…………………………………………………………………………………………………..62 Table 3…………………………………………………………………………………………………..63 Table 4…………………………………………………………………………………………………..66 Table 5…………………………………………………………………………………………………..69 Table 6…………………………………………………………………………………………………..70 Table 7…………………………………………………………………………………………………103
2
1 Introduction
1.1 Background
A major area of interest after the Cold War, among academics as well as world
leaders, has been to reveal new sources of armed conflict. What will be the
causes of war in the post-Cold War era? The “grand theories” of international
relations have been applied also in this field, although the debate has been more
focused on the extent of war in the new era rather than on specific causes.
While liberal institutionalism claims that armed conflict can be avoided the
next decade with a “continuous pattern of cooperation” (Keohane 1993),
realists like John Mearsheimer, claim that there is no promise of more stability
going from a bi-polar world to a multi-polar world (Mearsheimer 1995). Some
empirical research has been conducted in order to detect changes when
proceeding to a new era. For instance, Oneal & Russet (1999: 36) conclude:
“The post-Cold War era is full of affirmations about the importance of
democracy, freedom, and prosperity built on interdependent markets.” And
further: “Analytically, we are progressing towards a synthesis of Kantian and
realist influences and of dyadic and systemic perspectives” (Oneal & Russett
1999: 36). Fukuyama (1992) has perhaps the most commonly known
contribution claiming that the end of the Cold War marks the “The End of
History”. The traditional lines, and eventually all lines of conflict, will
disappear, according to Fukuyama, as the nation-states acknowledge the
“universal principles” of democracy and liberal markets. It will be the end of
all international wars, except minor conflicts between the states that are still “in
history”, and the ones that have reached the “end of history”.
On this background, Samuel P. Huntington created great controversy
with his article “The Clash of Civilizations?” in 1993 and the follow-up book
3
The Clash of Civilizations and the Remaking of World Order in 1996. Instead
of harmony in “the new era”, Huntington focuses on emerging conflicts based
on cultural dissimilarities. He makes precise predictions about causes of
conflict and wars after the fall of the Iron Curtain: “It is my hypothesis that the
fundamental source of conflict in this new world will not be primarily
ideological or primarily economic. The great divisions among humankind and
the dominating source of conflict will be cultural.” (Huntington 1993: 22). This
proposition started a discussion that reaches far beyond academic circles. After
the events of September 11 2001, Huntington’s theories are discussed with
renewed enthusiasm.1
1.2 Overall Objective and Research Questions
The overall objective of this thesis is to investigate into the relationship
between culture (religious, ethnic and linguistic differences) and conflict. As a
point of departure, I choose to test the validity of Huntington’s “civilizations
theory”. This is a theory that emphasizes the importance of culture as a
determinant of conflict, and it holds many explicit propositions concerning the
relationship between culture and conflict. Specifically, I seek to answer the
following questions, derived form Huntington’s theory: Do conflicts occur
along the fault lines of civilizations? And if they do – is this a phenomenon
strictly evident in the post-Cold War era? Are certain civilizations significantly
more prone to conflict than others? Are the Muslim and Western civilizations
more prone to conflict than other pairs of civilizations? If the empirical
findings suggest that the answer to these questions is yes (hence, support for
Huntington’s thesis), this calls for a further inquiry into: What are the
mechanisms that explain how cultural dissimilarity may be a cause of armed
conflict?
1 The Economist September 22 2001; Newsweek December 2001; Aftenposten 24 October 2001: 8.
4
Obviously, these are important questions to decision-makers who deal
with foreign affairs and multilateral matters. But also academically, these
questions are of high interest. Although Huntington’s civilizations theory has
met virtually nothing but criticism in quantitative assessments (Henderson
1998; Henderson & Tucker: 2001; Russett, Oneal & Cox 2000), Huntington
claims that their results are due to methodological shortcomings (Huntington
2000). Hence, one objective is to contribute with a more appropriate
methodological approach to testing Huntington’s theory. Second, I aim to
contribute to the theoretical debate between primordialists, instrumentalists and
constructivists on how cultural dissimilarity is linked to armed conflict (see
Chapter 2). Through the findings of my analysis I wish to shed more light on
this relationship and hopefully contribute to the research in this field (Carment
& James 1995; Ellingsen 2000; Fox 2001; Geertz 1973; Glazer and Moynihan
1975; Horowitz 1985; Väyrynen 1994).
1.3 Theory
Huntington’s civilizations theory is first and foremost an attempt to describe
the emerging world order after the collapse of the bi-polarity structure during
the Cold War (Huntington 1996: 13-14). Huntington suggests that, as part of an
evolution from earlier eras of world history, the post-Cold War era will mark a
turning point, following which “culture” is the key to understanding the nature
of world trade, world politics, co-operation – and conflict. Huntington claims
that, in the new era, the factor determining the nature of conflicts is cultural.
Huntington suggests that identity, the question of “who am I?”, will become
increasingly important to all individuals after the Cold War. This change at the
individual level will eventually reach the level of the broadest cultural identities
– civilizations. Thus, civilizations will be dominant actors in world affairs.
“Clashes” of these cultural entities will, allegedly, be the primary source of
5
armed conflict. In Huntington’s words: “The conflicts of the future will occur
along the cultural fault lines separating civilizations” (Huntington 1993: 25).
In a theoretical setting, one may argue that this theoretical view belongs
to the primordial “school” of conflict, although Huntington does not present an
entirely mono-causal explanation. In the primordial view, cultural dissimilarity
is a traditional feature that is naturally linked to conflict. This perspective is
contested by instrumentalists, who claim that elites of society construct cultural
differences in order to mobilize the masses and use them as instruments to
pursue their personal agenda. The constructivists oppose Huntington from yet a
different angle: they agree that cultural dissimilarity may play a role as a cause
of armed conflict, but only when facilitated by certain socio-economic
background factors. These different perspectives will be further discussed in
Chapter 2.
1.4 Definitions
“Conflict” may be defined as a situation in which one or more distinct parties
have preferences that are incompatible with each other. Conflict, as defined
here, is usually the prerequisite for “war”, which is defined as a conflict
between a state A and one or more other states, involving more than 1,000
battle-related deaths (Singer & Small 1972; Holsti 1992). We need, however, a
more refined definition in a time when wars are internal, external and often
subjected to international intervention. Also, wars often involve less than the
definition 1,000 battle casualties; still, they are referred to as wars. In this thesis
I will generally refer to war by Singer & Small’s definition, but I will mostly
use the term “armed conflict”. By armed conflict I refer to the definition of the
PRIO/Uppsala dataset, which again refers to all types of armed conflict that
are: “A contested incompatibility that concerns government or territory or both
where the use of armed force between the two parties results in at least 25
6
battle-related deaths. Of these two parties at least one is the government.”
(Gleditsch et al. 2002: 619, and Gleditsch et al. 2001: 5. Appendix 1)2.
The concept “culture” stems from anthropology. An agreed definition of
the concept is hard to find. Some view culture a shared orientation, others as a
shared interpretative framework, and others again as a common social heritage
in custom and norms (Geertz 1973). In most cases, culture is linked to factors
like ethnicity, religion, and language. Now that culture is defined, it is easier to
explain what Huntington means by “civilizations”. Civilizations are the
broadest cultural entities; it is culture writ large (Huntington 1996: 43). A
civilization is most commonly defined by religious commonality, but also by
ethnic and linguistic commonalities, and by tradition and history. Huntington
identifies nine distinct civilizations (see Map 1, Chapter 2). “Clash of
civilizations” refers to disputes among these large cultural entities. These
disputes are, according to Huntington, the primary cause of armed conflict in
the new era.
1.5 Research Design and Methodology
I choose to explain the research design step by step in accordance with the
framework (content) of the thesis. Since I aim to test the validity of the
civilizations theory, the first step will be to present and to scrutinize the theory.
What are its premises, how does it relate to other theories in this field, what is
the main critique against this theory? This will provide a basis for later
discussion of the validity of the theory in light of the results. Next, I pinpoint
the specific areas of the theory that I would like to test (the causes and nature of
conflicts). I then derive verifiable “empirical statements” from Huntington’s
specific theoretical statements. This means that I formulate a certain
expectation of an empirical phenomenon that occurs, or does not occur,
2 It is important to notice that I will in this assignment often mention “conflict” and “armed conflict” (and sometimes even “war”), while referring to the same minimum definition from the PRIO/Uppsala dataset.
7
provided that Huntington’s theory corresponds with reality. In other words:
“After this logical deduction of empirical statements from the theory, one can
make the observations called for in the empirical statements to see whether or
not they are true” (Stinchcombe, 1968: 15-17). The formulations of empirical
statements are hypotheses that I set out to test empirically in the analysis.
The analysis seeks to test Huntington’s theory, but at the same time it is
a design for generalizing about the phenomenon “armed conflict” within a
certain period. Since there are many cases of conflict in the relevant period
(before and after the Cold War), it is probably not appropriate to apply any sort
of case study to test the validity of this theory. The selection bias of a case
study and possibility of tendentious relationships calls for a large N-study. I
choose as units all armed conflicts from the PRIO/Uppsala dataset ten years of
the Cold War and ten years after the Cold War – 1979-2000. From
Huntington’s theory I have derived certain expectations (hypotheses) of the
features of these conflicts. The analysis tests the existence of a certain
relationship between the locations and nature of conflicts, and cultural borders.
I do so by expecting certain correlations and properties of the measured
variables. One very central variable in the analysis is “distance”, which I have
generated (see Chapter 3). This variable is simply a ranking of the conflicts: to
what extent does a conflict “occur along the fault lines of civilizations”. Every
conflict is measured by its distance to the nearest civilizational fault line, or
border. According to the hypotheses, this variable is expected to have certain
properties, when controlled for pre- and post-Cold War, and bivariate
correlations with other relevant variables in the dataset.
The most central question to be answered through the quantitative
analysis is whether conflicts are more frequent along the fault lines of
civilizations, since this refers to Huntington’s overall claim. Another essential
question is whether such a relationship is more evident in the post-Cold War
era, like Huntington claims. I have already pointed out that a case study
approach is not suitable for testing the general validity of Huntington’s thesis.
However, in order to investigate into the micro foundations behind the
8
existence, or non-existence, of a relationship between cultural difference and
armed conflict, such an approach is fruitful. A limited case study will provide a
basis upon which to interpret the results in a suitable context and to provide a
better understanding of the matter studied. Whereas the initial quantitative
analysis tests whether there is such a relationship, i.e. the validity of
Huntington’s overall claim, a case study may indicate how cultural differences
may, or may not, play a role as a (primary) cause of armed conflict. For this
purpose, I choose to study the causes of the war in Bosnia 1992-95 (Chapter 5).
I stress, however, that the quantitative test is the main focus of this thesis; the
case study is primarily intended to be a basis for discussing the results in an
appropriate context. Therefore, the whole of Chapter 3 is dedicated to
explaining the methodology of the quantitative test, focusing on the validity
and the reliability. Regarding methodological aspects of the case study, I will
mention these in the introduction of Chapter 5. The case study is very limited
and may just as well be viewed as an extended discussion of the large-N
analysis and its results.
For the following, Chapter 2 presents the theory, its premises, critique,
and logical derivations in form of hypotheses. In Chapter 3 I present the data,
explain how I generated a “civilizational variable”, and discuss problems of
validity and reliability. Chapter 4 provides presentation and discussion of the
results from the quantitative analysis. Chapter 5 is a qualitative approach with
main focus on investigating into the causes of the conflict in Bosnia. In Chapter
6 I sum up the thesis, including the results, and suggest directions for further
research.
9
2 Theoretical Framework
This thesis is based upon Huntington’s theory of a “clash of civilizations”.
Under the heading “The Next Pattern of Conflict”, Huntington stated in his
1993 article: “It is my hypothesis that the fundamental source of conflict in this
new world [referring to the post-Cold War era] will not be primarily
ideological or primarily economic. The great divisions among humankind and
the dominating source of conflict will be cultural” (Huntington 1993: 22). And
he concludes: “The fault lines between civilizations will be the battle lines of
the future” (Huntington 1993: 22). In 1996 Huntington published the book The
Clash of Civilizations and Remaking of World Order, which is a more detailed
argument for the hypothesis presented in the article. The renewed interest for
this hypothesis following the September 11 attack on the US, calls for an
inquiry into this theory, its premises, and the validity of its conclusion3.
The focus of this chapter will be to present the “clash of civilizations”
theory, primarily based on the argument in the book. Initially, I will present the
overall theory of Huntington, focusing on its premises (2.1). Next, I will
identify what the position of Huntington is in the context of the theoretical
debate on cultural differences as a cause of conflict (2.2). Then follows an
account of some attempts to test empirically the part of his argument that
concerns causes of armed conflict (2.3). Finally, I will review Huntington’s
specific propositions with regard to causes of armed conflict and deduce
hypotheses that can be tested empirically (2.4).
3 Huntington has changed focus slightly towards demographic explanations of armed conflict following September 11; see Newsweek December 2002 and parts of Chapter 4.
10
2.1 The theory of Civilizations
In order to understand Huntington’s theory properly, it is convenient to clarify
some basic questions first. Is this a descriptive or normative theory? What is
the purpose of launching the theory? Many have been led to believe that the
civilization theory is somehow normative, making the West alert that it is
losing relative power to other civilizations and, thus, pointing out how the West
ought to react in this situation. The theory may also seem to be provocative, as
it focuses on the increase of conflict and describes different cultures in a
harsher, and less subtle, manner than is the norm in world politics, e.g. “Islam’s
bloody borders” (Huntington 1996: 254, 257-258).
However, following Huntington’s argument, it becomes clear that the
purpose of the theory is to describe what he sees as an emerging world order
after the Cold War. “The central theme of this book is that culture and cultural
identities, which at the broadest level are civilization identities, are shaping the
patterns of cohesion, disintegration, and conflict in the post-Cold War world”
(Huntington 1996: 20). This passage clearly demonstrates that Huntington’s
endeavor is to describe features of changing world politics, regardless of how
politically incorrect it may seem. However, Huntington also attempts to present
a concept for policy-makers to “act on”. His “advice” to policy makers is
normative in the regard that they express “this is how you ought to act granted
that the theory corresponds to reality”. This, however, does not mean that the
theory per se is normative. Huntington endeavors to describe the emerging
world order – the distribution of power and potential for conflict in this new
era. Nevertheless, it is difficult to avoid perceiving the theory as normative
guidance to (Western) world leaders. This is due to both his “advice”, and the
fact that the topic, cultural differences, is so subjective. Whatever way
Huntington is perceived by the reader, it is important to stress the fact that this
thesis, and indeed this chapter, is an attempt to present and test Huntington’s
theory as objectively as possible. Testing Huntington’s propositions is merely a
starting point for acquiring more knowledge about the causes of conflict.
11
2.1.1 A World of Civilizations
Huntington’s central argument is that culture (history, language, tradition, and
most importantly, religion) is the primary factor shaping the post-Cold War era
with regards to politics, economic co-operation, military alliances and the
pattern of conflict. This is a result of the de-alignment of the strict bi-polarity of
the Cold War. In the emerging world of modernization and globalization,
people have more interaction across cultures, but this development also urges
people to search for and find their cultural belonging and identity. This identity
has become increasingly important. Culture, in this regard, both unites and
divides us. As examples of the striving for identity after the Iron Curtain came
down, Huntington mentions the fighting on former Yugoslav and Soviet
territory, the struggles over identity within Russia, Turkey, and Mexico, and
many ethnic and religious conflicts, such as in Somalia and Sri Lanka.
Although Huntington does not neglect the role of states, he claims that
in order to understand essential developments in this new era, we must also
look at the relations between the largest cultural entities – civilizations.
Civilizations will shape world affairs in most respects: economic, political, and
military. And most importantly, the clashes of civilizations will explain the
pattern of conflict. Huntington claims that the clash of civilizations is the
primary factor for explaining armed conflict. Civilizational conflicts are apt to
happen as civil wars (which is by far the most common type of conflict after
the Cold War) in countries that are located along the fault lines of civilizations.
These fault line (civilizational) conflicts are prone to escalate into more severe
interstate conflicts, and possibly even erupt into inter-civilizational world wars.
Huntington identifies six main civilizations among nine altogether (see Map 1).
Huntington holds that the Latin American and African civilizations (including
Sub-Saharan Africa) are not mature and well-established civilizations, but they
are emerging. Although Huntington includes the Buddhist civilization, he finds
it difficult to speak of this as a distinct civilization, partly because Buddhism is
12
split in two – Theravada (including Sri Lanka, Thailand, Burma, Cambodia),
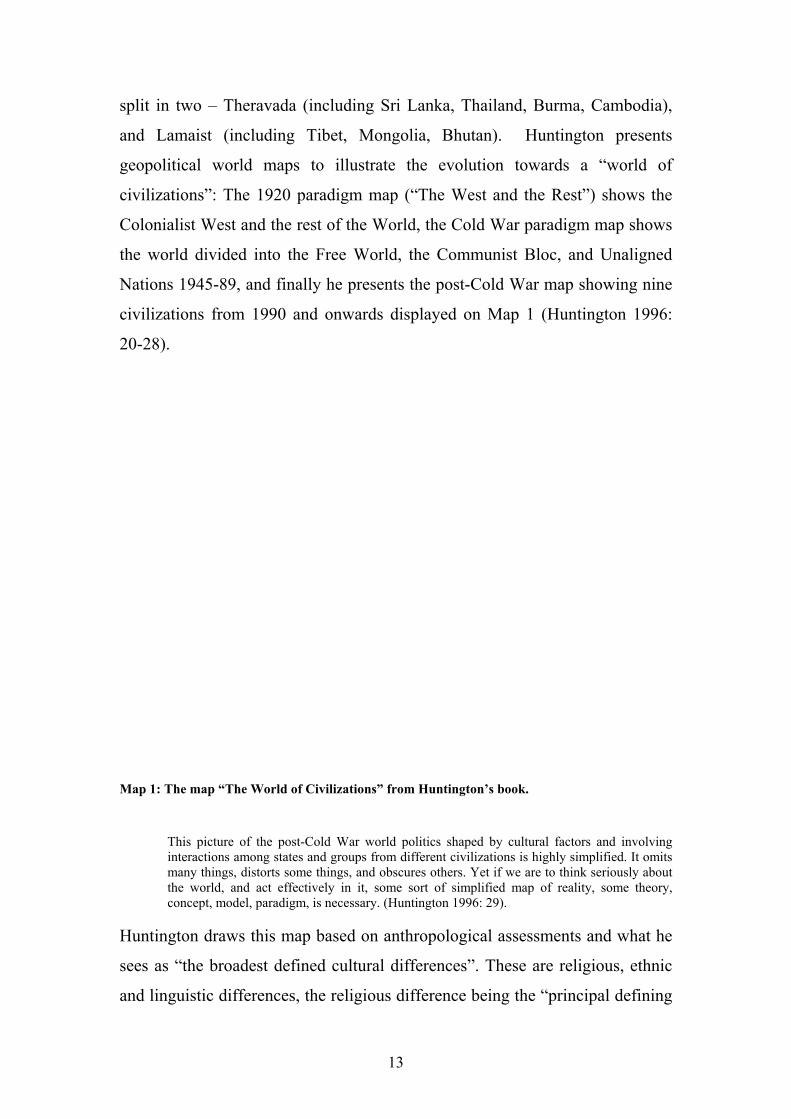
and Lamaist (including Tibet, Mongolia, Bhutan). Huntington presents
geopolitical world maps to illustrate the evolution towards a “world of
civilizations”: The 1920 paradigm map (“The West and the Rest”) shows the
Colonialist West and the rest of the World, the Cold War paradigm map shows
the world divided into the Free World, the Communist Bloc, and Unaligned
Nations 1945-89, and finally he presents the post-Cold War map showing nine
civilizations from 1990 and onwards displayed on Map 1 (Huntington 1996:
20-28).
Map 1: The map “The World of Civilizations” from Huntington’s book.
This picture of the post-Cold War world politics shaped by cultural factors and involving interactions among states and groups from different civilizations is highly simplified. It omits many things, distorts some things, and obscures others. Yet if we are to think seriously about the world, and act effectively in it, some sort of simplified map of reality, some theory, concept, model, paradigm, is necessary. (Huntington 1996: 29).
Huntington draws this map based on anthropological assessments and what he
sees as “the broadest defined cultural differences”. These are religious, ethnic
and linguistic differences, the religious difference being the “principal defining
13

characteristic of civilizations” (Huntington 1996: 253). This does not imply that
he ignores the “finer” cultural/identity borders that are within states, small
regions and even municipalities, but they are not displayed when showing a
world map of civilizations. For example, Huntington has not bothered to draw a
border around Israel representing the Western civilization or perhaps a distinct
Jewish civilization. Also, many would question why Kazakhstan is among the
Orthodox civilization and not the Muslim. There are many examples of
civilizational borderlines, or lack of such, that may seem less successful in
capturing what are the present civilizations and where are their borders. Many
would strongly disagree on where the lines are drawn, on what basis they are
created, and on whether it is fruitful even to theorize along these lines.
Nevertheless, Huntington claims that these cultural borders provide the most
suitable basis for explaining (patterns of) conflict today. Therefore, I choose to
focus on the civilizations and their borderlines on Map 1, since this is the only
way to present, and eventually to test, Huntington’s theory on Huntington’s
own terms.
Huntington attempts to explain how – in this post-1990 “world of civilizations”
– some civilizational relations promote integration and cooperation, while other
civilizations clash. Since this thesis is concerned with causes of conflict, I will
concentrate on the latter. One distinct feature is that the West is losing relative
power to the other civilizations. This may, according to the theory, result in a
“West against the rest” scenario. At the same time, the West imposes its values
(Western democracy, liberal markets, etc.) on other civilizations. The Muslim
civilization is the least tolerant towards the West imposing its values. Hence,
clashes of the Western and Muslim civilizations are the most likely to occur.
Huntington also mentions the possibility of the Muslim civilization aligning
with the Sinic (Chinese) civilization in this dispute. In general, the argument
holds that the Western and Muslim civilizational borders are most conflict
prone. This will be further reviewed in 3.4.2.
14
2.1.2 Premises for the Civilizations Theory
A basic assumption that Huntington takes for granted is that the end of the Cold
War creates a whole new era for world politics. It is taken for granted that the
“events” of 1989 form a turning point in world affairs that will create many
further substantial changes. Among them, changes in how we think at the
individual level, in how states perceive one another, and, eventually, in the
patterns of conflict. At the highest level, it will increase the significance of
civilizations in world affairs. However, the underlying assumption is that the
structural change after the Cold War causes of all the other changes.
A second, more explicit, premise leading to the theory of “a world of
civilizations”, is that processes at the individual level can be aggregated into
explaining major developments at both group, state, and world level.
Huntington’s model of the “new world” is a multi-polar world, since states are
still central actors in world affairs. At the same time, it is multi-civilizational
and multi-level world. With some resemblance to a Hobbesian approach,
Huntington assesses what the reaction of the individual is to the new world of
modernization. He emphasizes that people will become more concerned with
the basic question: “Who am I?” as opposed to “Whose side am I on?” during
the Cold War.
In the post-Cold War world, the most important distinctions among peoples are not ideological, political, or economic. They are cultural. Peoples and nations are attempting to answer the most basic question humans can face: Who are we? And they are answering that question in the traditional way human beings have answered it, by reference to the things that mean most to them. People define themselves in terms of ancestry, religion, language, history, values, customs, and institutions. They identify with cultural groups: tribes, ethnic groups, religious communities, nations, and, at the broadest level, civilizations (Huntington 1996: 21).
The process at the individual level will also be evident at meso- and macro-levels. This describes the impact on nation states:
Their behavior is shaped as in the past by the pursuit of power and wealth, but it is also shaped by cultural preferences, commonalties, and differences. The most important groupings of states are no longer the three blocs of the Cold War but rather the world’s seven or eight major civilizations (Huntington 1996: 21).
15
A core element of the theory is hence to focus on “identity” or “commonality”,
initially at the individual level, eventually forcefully at all levels. This notion of
“identity” may to Huntington be linguistic, historical, ethnic, and religious. All
these factors fit to the concept “cultural”. These identities, “culture writ large”,
constitute civilizations. Cultural borders also exist at lower levels, even
between people from different parts of the same constituency. However, it is
the broad cultural borders – civilizational borders – that Huntington claims are
significant to the nature of conflict.
Third, Huntington bases his theory on the assumption that we are
experiencing a development along long historical lines. He tries to predict the
“next phase” that will naturally and logically follow from the previous phases:
All these developments have led many to see the gradual end of the hard, “billiard ball” state, which purportedly has been the norm since the Treaty of Westphalia in 1648, and the emergence of a varied, complex, multi-layered international order more closely resembling that of medieval times (Huntington 1996: 35).
Huntington predicts that the next step in the evolution of world affairs has
resemblance to previous eras, e.g. medieval times. This theoretical perspective
has resemblance to Hegel’s and Marx’s explanations of evolution. The basic
assumption is that there are mechanisms (ideas and substance) of evolution.
One stage of development is an evolution based on earlier stages. Huntington
claims that when the bi-polarity world becomes history, the “new” world order
that emerges will bear some resemblance to the old world order before the Cold
War and even before the Treaty of Westphalia in 1648. This logic implies that
the forces in the evolution of world affairs remain the same throughout the
different eras.
Fourth, Huntington has a theoretical basis for his argument. Although he
does not devote many pages to a theoretical debate, Huntington does make
some references to other ideas about what forces will shape world affairs after
the Cold War. Ideas of Mearsheimer (1995) about the “New World Order” and
Fukuyama (1992) are characterized as “describing features” of the new era.
Moreover, Huntington gives some credit to attempts to view the world as
16
divided between North and South, and paradigms suggesting the rising of other
world actors than states – NGOs, international crime organizations, terrorist
organizations, etc. At the same time, Huntington criticizes these theories and
uses them as starting points for his own theory. Although Huntington
recognizes that: “States are and will remain the dominant entities in world
affairs” (Huntington 1996: 34), he also claims that states pursue their interests
differently from one historical period to another. In the post-Cold War era, the
way states perceive threats and intentions by other states are “powerfully
shaped by cultural considerations” (Huntington 1996: 34). Meanwhile,
Huntington criticizes Fukuyama for painting a far too harmonic picture of the
world. Huntington claims that the civilizational paradigm is a sort of synthesis
of all these theories. It is the right combination of “parsimony and realism”
(Huntington 1996: 36-39).
2.1.3 Empirical Evidence
As reviewed above, Huntington’s theory has some theoretical basis and
assumptions, but it is just as much based on empirical observations, and on his
prediction of the consequences of a perceived turning point in the history of
world affairs. Huntington draws historical lines from medieval times and even
more ancient times, to today. Huntington points at significant events in
contemporary global politics and explains them as part of a development
towards a multi-civilizational world. In this regard, the basis of the theory is to
a large extent empirical examples describing the contemporary world from a
civilizational perspective. ”Paradigms also generate predictions, and a crucial
test of a paradigm’s validity and usefulness is the extent to which the
predictions derived from it turn out to be more accurate than those from
alternative paradigms” (Huntington 1996: 37). Huntington puts much effort
into showing how the civilizational approach is superior to the realist approach
in predicting and describing/explaining the post-Cold War era:
17
A statist paradigm, for instance, leads John Mearsheimer to predict that “the situation between Ukraine and Russia is ripe for the outbreak of security competition between them […] A civilizational approach, on the other hand, emphasizes the close cultural, personal, and historical links between Russia and Ukraine and the intermingling of Russians and Ukrainians in both countries, and focuses instead on the civilizational fault line that divides Orthodox eastern Ukraine from Uniate western Ukraine, a central historical fact of long standing which, in keeping with the “realist” concept of states as unified and self-evident entities, Mearsheimer totally ignores. While a statist approach highlights the possibility of a Russian-Ukrainian war, a civilizational approach minimizes that and instead highlights the possibility of Ukraine splitting in half, a separation which cultural factors would lead one to predict might be more violent than that of Czechoslovakia but far less bloody than that of Yugoslavia. The different predictions, in turn, give rise to different policy priorities (Huntington 1996: 37).
The empirical examples discussed by Huntington are generally cases where the
civilizational approach presumably has a stronger explanatory force than other
approaches. The empirical examples of the book can be divided into two kinds.
One kind of empirical examples is of civilizations in history, before 1989.
These serve two purposes. First, to demonstrate that conflicts between
civilizations, and indeed civilizational wars, have persisted throughout history.
Further, that the bi-polarity of the Cold War era diminished the role of
civilizations, and that now, after the end of that era, civilizations will again play
a greater role. Second, these examples provide a basis to understand the nature
of civilizations and inter-civilizational issues. They will be useful lessons and
provide guidance for an emerging multi-civilizational world.
The second type of empirical examples is from more recent times (1989-
96). Huntington applies the civilizational approach when explaining several
recent events and conflicts. He refers to a large extent to the Balkans conflict
and the break-up of the former Yugoslavia. Huntington views the wars of the
former Yugoslavia as purely cultural (ethnic and religious in origin), and hence
a result of a clash of civilizations. On pp. 38-39 Huntington makes reference to
19 events in world affairs during a six-month period in 1993. These are
incidents in world affairs that Huntington believes can be best explained with a
civilizational approach. He claims: “A comparable list of events demonstrating
the relevance of the civilization paradigm could be compiled for almost any
other six-month period in the early 1990s” (Huntington 1996: 39). His book is
rife with examples of conflicts and wars, both inter- and intra-state, involving
religious and ethnic rivalries. Huntington makes no explicit distinction between
18
types of conflict, however, he theorizes about which inter-civilizational
relations are most prone for conflict (see 2.4.1 and 2.4.2).
2.2 Huntington’s Thesis in a Theoretical Context
Huntington’s civilizational theory has been criticized from many different
angles4. This is hardly surprising since the theory has become so widely known
and comprises parts of many different subjects, such as religion, political
science, history, sociology, and anthropology. One common critique is that the
theory has too high ambitions – that it aspires to be “all-comprising”. For the
purpose of this thesis, it is fruitful to narrow the scope. I will strictly review
critique concerning the causes of armed conflict. Specifically, I will present
challenging views to the assertion that civilizational clashes are the “primary
cause” of armed conflict.
I will initially make some brief remarks concerning the problematic term
“civilization”. Next, this section seeks to locate where to place Huntington in
the debate on culture as a cause of conflict. Are cultural differences per se a
cause of conflict? Or are cultural differences simply emphasized and exploited
by interest-driven political leaders? Or are the determinants of conflict rather
political and economic factors, such as poverty, unequal distribution of
resources, and type of regime?
2.2.1 The Notion of “Civilization”
As mentioned in the introduction and earlier in this chapter, Huntington views
civilization to be “the broadest way” in which people identify their belonging
to a community. Religion is the foremost definition of such an identity, or
“cultural difference”, followed by ethnicity and language. In addition, other
4 See among others Ahari 1997; Ajami 1993; Esposito 1995; Gregg 1997; Harris 1996; Hassner 1997; Henderson 1997; Kirkpatrick 1993; Kurth 1994; Murphey 1998; Pfaff 1998; Rosencrance 1998; Yamazaki 1996.
19
identity factors play a role, like history, ancestry, and tradition. This is a
foundation for the whole theory. Nevertheless, many scholars of various
disciplines contest this basic assumption. I will not go into this criticism, but
only mention that there are considerable problems in viewing any of these
“cultural differences” (religion, ethnicity and language) as direct causes of
conflict. Huntington does not present any comprehensive logical deduction of
how these factors separately cause conflict, nor does he present substantive
empirical evidence for this view. Moreover, there is no waterproof argument as
to why these three factors combined constitute civilizations, nor is there any
rationale for when a civilizational border follows an ethnic border as opposed
to a religious or linguistic border. Why, for example, is there no civilizational
division of Protestants and Catholics in Europe, while there is a division of
Muslims and “Africans” through the African continent? Huntington does
provide some answers, but there does seem to be some lack of consistency for
drawing the civilizational borders. I will not go further into this criticism than
to say that when testing Huntington’s theory one must be aware of these
problems. On the basis of the results in this analysis one may review the theory
and consider corrections. It is through testing a theory and revising it that it
develops to describe reality more precisely.
2.2.2 Is Huntington a Primordialist?
During the Cold War, many political scientists were led to believe that cultural
factors, like religion and ethnicity, are traditional (as opposed to modern)
features of a society. These features would become less significant through
modernization (Gurr 1994). This view is also evident in the theories of
globalization. Now that we are so inter-connected through technology, the
differences will decrease. Sworn idealists even stress that the decline of states
as the most important international actors is a step in the direction of a “global
village” or even the “perpetual peace” thesis of Immanuel Kant (1795),
suggesting a world government. The conflicts during the early 1990s, however,
20

restored meaning to the concept “ethnic cleansing“, e.g. in Bosnia 1992-95, and
it became quite common to say that cultural differences are the primary cause
of conflicts.
Furthermore, why and how culture matters for conflict, became part of
the academic discussion again. We may speak of a primordial “school”, which
considers religion and ethnicity as deeply-rooted cultural, psychological, and
affective attachment to historical and ancestral ties (Connor 1994; Geertz 1963;
Isaacs 1975; Smith 1986). Cultural division is seen as a “natural” feature, the
same way that cultural differences are viewed “naturally” to be linked with
conflict. As Isaacs (1975: 38) puts it: Basic group identity consists of the ready-made set of endowments and identifications that every individual shares with others from the moment of birth by chance of the family into which he is born.
The primordialists view cultural matters, or cultural differences, as given, non-
changeable features that constitute a primary source of conflict. It is fair to say
that Huntington’s clash of civilizations thesis falls into this category of
arguments. It is the same theoretical point that Huntington makes, except that
he tries to push it a bit further and makes this type of argument very explicit by
dividing the whole world into cultural entities – civilizations. He maps out
where cultural groups are located and predicts armed conflict along their fault
lines. Huntington also describes the “psychological” process of identity at the
individual level as an important premise. On the other hand, he does not argue
that cultural structures are static. Whereas the primordialist view stresses the
immutable character of cultural traits, Huntington asserts that culture and
civilizations change, as do identities. Nevertheless, the change of identity is a
very slow process, according to Huntington. Some civilizations live for a
thousand years. In that sense, it may seem fair to place Huntington in the
primordialist school after all. This point remains to be clarified by Huntington.
21
2.2.3 Instrumentalists vs Primordialists
A common criticism of the primordialists is their assumption of fixed identities
and their failure to account for variations in the level of conflict with time and
place. Primordialists fail to explain the fact that new and transformed identities
emerge. Furthermore, they fail to explain the absence of conflicts in many areas
that are characterized by different cultural groups living side by side in
harmony. There are many examples of ethnic or religious communities within a
political system being divided politically, but still sorting things out peacefully,
such as in the Netherlands and Switzerland.
The instrumentalist perspective claims to take these variations into
account. They perceive religion and ethnicity as tools; they can be used by
individuals, groups, or, most commonly, elites in order to obtain access to
social, political, and material resources (Brass 1985; Glazer and Moynihan
1975; Rothchild 1986; Steinberg 1981). Culture is a tool for politicians to
recruit people to achieve a political advantage. In this view, it is not cultural
dissimilarity itself that causes conflict, it is rather that an elite figure, or group,
sees a window of opportunity that he/they can realize by mobilizing a certain
cultural group. One example may be Slobodan Milošević seizing power in
Yugoslavia late 1980s and beginning of 1990s. Also economic interests may
drive elite figures to use this “tool”. (Especially in many developing countries,
there are both economic and political gains of seizing political power). Equally,
the elites may use this tool defensively, to thwart the ambitions of others or
cling to beneficial positions, or offensively, to achieve certain political or
economic advantages.
Much of the theoretical criticism against Huntington can be classified as
instrumental arguments, e.g. the changing nature of civilizations (Kirkpatrick
1993). Identities are not fixed, they constantly evolve, allegedly. Furthermore,
cultural dissimilarities can also be “constructed” in a certain way, or
“activated”. They are not per se a cause of conflict.
22

2.2.4 The Constructivists – Towards a Synthesis?
The criticism faced by instrumentalists concerns a theoretical assumption
inherent in their argument. If elites are able to “construct” a cultural identity
from virtually nothing, this implies that individuals can choose freely what
cultural group they want to belong to. This is not logical since most people are
raised with a certain religious belief. Very few people change their religious
identity, and the ethnicity is virtually impossible to change. In general, people
do not choose which cultural group to belong to. Therefore, cultural identities
cannot be entirely “constructed” (at least not over a short period of time), they
may, however, matter more in some places and situations than others. Another
criticism against the instrumentalists, and also against Huntington, is that
macro political and economic factors are not included as explanatory factors.
Are not causes of conflict more intricate than just cultural dissimilarities, one
way or the other? Senghaas (1998), for example, claims that economic
deprivation is the real cause of conflict.
This leads to the constructivist perspective (not to be confused with the
constructivist school of International Relations, although related), which claims
that cultural dissimilarity is not necessarily fraught with conflict, but it can be,
given certain societal conditions. Culture may change and evolve over time, but
only within the framework of the society. In this approach, culture is seen
neither as immutable nor as completely open, but rather as constructed from the
interaction of dense webs of social interaction (Anderson 1983; Brubacker
1995; Dominguez 1989; Young 1993). Constructivists claim that if society is in
a certain political and/or economic (crisis) state, cultural dissimilarities may be
“activated” as a conflict factor. Whereas when political and economic relations
are harmonic, the chances of a cultural conflict are very small. This theory may
be applied in explaining many cases, such as why cultural differences are a
cause of armed conflict in some areas of the world (say in Rwanda), whereas
on the American border towards Mexico the ethnic, religious and linguistic
differences between the Latin American, American and other cultures have not
23
erupted in armed conflict. Ethnic hatred might well erupt in the US if Arizona
and New Mexico were to experience the catastrophic economic conditions and
lack of political control prevailing in Rwanda. The comparison perhaps seems
far-fetched, but these are questions one needs to address; why do we find
cultural conflict, and indeed genocide, in a society at a given point in time,
whereas peace prevails in another society with strong cultural dissimilarities.
This is the kind of question to which the constructivist perspective tries to build
an answer. For the purpose of explaining variations of cultural conflict,
occurrence by time and location, it is probably more beneficial to combine
these views into a single theory. Academically, this perspective seems to be
gaining some consensus (Brubacker 1995; Gurr 1994), although there are still
many unsettled questions.
After this presentation of a theoretical setting to Huntington’s theory, I will
now turn to some of the criticism that Huntington has faced, based on empirical
testing. In the next section, I will focus on attempts to assess the general
validity of Huntington’s thesis based upon systematic and quantitative
empirical studies.
2.3 Attempts to Test Huntington’s Thesis Empirically
As I have reviewed above, many scholars have contributed to the theoretical
debate on cultural dissimilarity as a determinant of conflict. There is, however,
little systematic empirical research conducted to test such theories as
Huntington’s “Clash of Civilizations” theory. Certainly, many interesting case
studies have the civilizational theory as one contesting approach to a conflict or
a country and show how other models relatively fit that particular case better or
worse. For my purpose, these are interesting findings, but I choose to
concentrate on quantitative, generalizing research. This is due to a case study’s
24
unsuitability as a basis for dismissing Huntington’s general theory; the pitfall of
a biased selection of cases may be best avoided by including a large number of
units in the analysis. Relatively few scholars have attempted in a systematic
way to test quantitatively the validity of the (rather explicit) propositions
Huntington sets out. One reason for this is probably the fact that his theory
concerns the post-Cold War era, which is still in the making, and hence there is
a lack of available data. I will present here some attempts that have been made
to test Huntington thus far.
During the past five to ten years, fruitful efforts have been made to test theories
of International Relations and causes of conflict through the use of datasets
containing information on armed conflicts and states. Russett, Oneal & Cox
(2000) present a quite recent test of the civilizational theory: “We assess the
degree to which propositions from Samuel Huntington’s The Clash of
Civilizations and the Remaking of World Order can account for the incidence
of militarized interstate disputes between countries during the period 1950-92”
(Russet et al. 2000), and further: “Pairs of states split across civilizational
boundaries are no more likely to become engaged in disputes than are other
states ceteris paribus. Even disputes between the West and the rest of the
world, or with Islam, were no more common than those between or within most
other groups. Among Huntington’s eight civilizations, interstate conflict was
significantly less likely only within the West; dyads in other civilizations were
as likely to fight as were states split across civilizations, realist and liberal
influences are held constant.” They conclude: “We can be grateful that
Huntington challenged us to consider the role that civilizations might play in
international relations, but there is little evidence that they define the fault lines
along which international conflict is apt to occur.”
Although Russett et al. (2000) use Militarized Interstate Disputes
(MIDs) (high number of units), and they categorized the countries into
civilizations by Huntington’s own map, the analysis does not take into account
the fact that the theory is a prediction for the post-Cold War era. Nor does the
25
analysis account for causes of civil wars and their relationship with interstate
wars. Nor do Russett et al. (2000) provide for the fact that the unit country-
years reflects state borders and thus not necessarily reflects cultural
(civilizational) borderlines, which are often located within states. I will
readdress this point in Chapter 3. Another interesting result of their analysis is
that even when only controlled for contiguity, the civilizational variable is not
significant. This study was heavily criticized by Huntington (2000) on
methodological grounds (see the beginning of Chapter 3 for some of this
criticism).
Other studies conclude slightly differently. Henderson (1997, 1998) also uses
Militarized Interstate Disputes (MIDs) as his dependent variable, but in
addition to religion, he takes into account ethnic and linguistic dissimilarities.
The results indicate that religious differences do increase the propensity for
such disputes (MIDs), whereas ethnic and linguistic dissimilarities have no
significance or negative effect. Since Huntington relies on religion as his prime
cultural factor, this study provides some support for the civilizations theory.
However, the study also shows that these religious-based clashes are not a
distinct phenomenon for the post-Cold War era. One should keep in mind that
the basis for generalizing about the post-Cold War era in these studies is only
the period 1989-92. Henderson & Tucker (2001) use the dependent variable
interstate war (Correlates of War data, COW) in a more direct test of
Huntington’s propositions. They find no support for Huntington for any periods
1816-1945, 1946-88 and 1989-92. In all these studies each state is categorized
by its civilizational “membership” and the extent of conflict between states
belonging to the same civilization is compared statistically with the extent of
conflict between states belonging to different civilizations. Huntington (2000)
criticized this approach5 on the grounds that finding the relative frequency of
inter- and intra-civilizational disputes is not a logical derivation of the
theoretical claim in his book. Besides, he pointed out, civil wars are left out of
26
the analysis despite the fact that the vast majority of wars are civil wars,
especially in the post-Cold War era. Lastly, Huntington remarked that 1989-92
is not a representative time span for the post-Cold War era.
Recent studies have been concerned with testing more specific propositions of
Huntington, especially the clash of the Western and Muslim civilizations and
“Islam’s bloody borders”.6 At least for more recent times, using the Minorities
at Risk dataset, Fox (2001) finds some support for Huntington’s claims
regarding Islam. Shannon (2001) finds no support for them in her study.
Shannon replicates the work of Russett et al. (2000), but she focuses on the
West and Islam. She uses the same dependent variable (MID) and the same
independent variables, with one important exception. Instead of categorizing
states into civilizations by Huntington’s map, explores different variables for
categorizing e.g. a “Muslim country”. Shannon tries different thresholds for
what percentage of a population needs to belong to a certain religion, in order
for the population’s country to be categorized by that religion. Although this
study is more refined in this respect, also Shannon makes the very questionable
generalization for the post-Cold War era from data for the period 1989-92. In
several ways, these studies do not represent a correct derivation of
Huntington’s propositions. I will return to this matter in Chapter 3, but I will
briefly mention here a few deficiencies of this earlier research. First, more
years of the post-Cold War era must be included in order to generalize about it.
Second, civil wars must be included in the analysis, since they account for the
majority of conflicts and are part of the central argument of Huntington. Third,
we need a more sophisticated “civilizational variable” and method to measure
whether conflicts are “civilizational” or caused by other factors.
5 Huntington (2000) criticizes Russett et al. (2000), but the criticism applies equally for Henderson & Tucker (2001) since the methodology is so similar. 6 Another recent study by Norris & Inglehart (2002) applies the world value data in order to assess Huntington’s propositions. This is a very interesting and different approach, where they find some support for Huntington.
27
2.4 Hypotheses
Earlier in this chapter, I have discussed the premises and basic assumptions of
the civilizations theory. I then presented the theoretical criticism against
Huntington concerning cultural differences as a cause of conflict. Next, I
reviewed some recent attempts to test the theory empirically . In this section, I
aim to make transparent the derivation of verifiable hypotheses concerning
armed conflict from theoretical statements. The hypotheses will be the basis for
my quantitative analysis (Chapter 4).
2.4.1 Conflicts Along the Fault Lines of Civilizations
One of Huntington’s central theoretical claims is that conflicts will occur along
the fault lines of civilizations. Empirically, this implies that conflicts will be
located geographically close to the borderlines that separate civilizations.
Huntington explains the dynamics that cause such civilizational conflicts in the
fault line areas. One of the terms he uses is “fault line wars”, which are the
conflicts at a local or micro level that have grown violent. As opposed to this,
he uses the term “core state wars”. Core state wars are wars between major
states of different civilizations that might lead to World Wars. However, the
core state wars are often escalations of fault line wars (Huntington 1996: 207-
208). Since there are very few, if any, core state wars so far in the post-Cold
War era, I choose to concentrate primarily on the fault line wars. In addition, if
there were any core state wars, they would have their origin in a fault line war.
How should one interpret the proposition that the post-Cold War
conflicts will occur along the fault lines of civilizations? “Fault lines” can be
interpreted literally as the geographical border where one civilization ends and
another starts, or more generally as a border area or a division between two or
more cultures. In any case, we are talking in general about local conflicts or
wars. We have no reason to assume that these wars occur exactly at the
borderlines of civilizations, but there should at least be a higher density of
28
conflict close to civilizational borders than further away. If Huntington is
correct in his contention that civilizational borderlines are significant in
explaining patterns of conflict, it must follow that the closer a location is to the
civilizational border, the higher is the frequency of conflicts. This will be
evident empirically if the conflicts do occur along the fault lines of
civilizations, as Huntington asserts. Hence, my first hypothesis:
H1: Conflicts more frequently occur along the fault lines of civilizations.
Huntington’s theory concerns primarily the post-Cold War era, a point that
Huntington (2000) very strongly emphasizes in his reply to Russett et al.
(2000). Therefore, it is crucial to test whether there is any evidence of such a
change when we move from the Cold War to the post-Cold War era. This is
one of the most crucial tests since it deals with the very foundation of the
theory. Huntington claims that the basis for a clash of civilizations is people’s
increased need for identity, caused by the collapse of the Cold War’s bi-
polarity. Hence, a second expectation derived from the theory is that the
above-mentioned relationship posited in H1 is significantly more evident in the
period 1990-2000 than in the Cold War era (represented by the decade 1979-
89). This accounts for ten years during Cold War compared with ten years after
the Cold War, which should be a good basis for investigating a change in the
pattern of conflict.
H2: The conflicts of 1990-2000 are generally more closely located to the
civilizational borders than the conflicts of 1979-89.
Huntington makes several propositions about the nature of fault line wars
(Huntington 1996: 252-253). He claims that fault line wars “tend to be vicious
and bloody, since fundamental issues of identity are at stake”, and makes
reference to conflict areas from the early 1990s that have large death tolls, such
as the Philippines, Sri Lanka, Kashmir, Sudan, Tajikistan, Croatia, Bosnia,
Chechnya, Tibet, and East Timor. This type of conflict (civilizational conflict,
29
i.e. fault line war) tends to be territorial: “Fault line conflicts sometimes are
struggles for control over people. More frequently the issue is control over
territory”. Granted that the conflicts of the post-Cold War era occur along the
fault lines of civilizations, i.e. we find support for H1 and H2, one may also
expect that for 1990-2000, the closer a conflict is located to a civilizational
border, the more likely it is “bloody and over territory”. What Huntington treats
in one paragraph of his book is in fact two different propositions that need to be
tested separately. The next two hypotheses express these expectations:
H3: The closer a conflict is located to a civilizational border, the more
likely the conflict has a high number of battle deaths.
H4: The closer a conflict is located to a civilizational border, the more
likely the conflict is over territory.
As mentioned, the theory holds that fault line wars are local conflicts, or wars
at a micro level. However, they may “occur between states, between
nongovernmental groups, and between states and nongovernmental groups”
(Huntington 1996: 252). Moreover, they may escalate into major wars between
several states. In light of these statements, it is fruitful to inquire into whether
the theory applies mainly to civil wars, as opposed to interstate wars and
internationalized civil wars. The latter type may be fought on several different
locations, not necessarily following the “fault lines”, even though they may be
escalations of fault line wars. Also, it is interesting to see if there is any
difference between these types of conflicts since they have thus far very often
been studied separately in the study of causes of armed conflict. One may
expect that:
H5: Intrastate wars are generally closer located to the civilizational
borders than interstate and internationalized intrastate wars.
30
2.4.2 The Clashes
All clashes of civilizations are not alike in their propensity to cause war,
according to Huntington. Although Huntington claims that most conflicts will
arise along the fault lines of civilizations (H1 and H2) in the post-Cold War era,
he distinguishes the fault lines by saying: “Some intercivilizational relations are
more conflict-prone than others” (Huntington 1996: 185). For instance,
Huntington claims that the West will, to a relatively large extent, be exposed to
conflict, since this civilization has been losing relative power since the 1920s
and simultaneously has been trying to impose its values on other civilizations.
This may lead to a “West versus the rest” scenario.
At the micro level, the most violent fault lines are between Islam and its Orthodox, Hindu, African and Western Christian neighbors. At the macro level, the dominant division is between “The West and the rest”, with the most intense conflicts occurring between Muslim and Asian societies on the one hand, and the West on the other. The dangerous clashes of the future are likely to arise from the interaction of Western arrogance, Islamic intolerance, and Sinic assertiveness (Huntington 1996: 183).
The clash between the Western and Muslim civilizations will be severe.
Huntington devotes a whole section on this specific clash (Huntington 1996:
209-218). Among the civilizations Huntington expects to have particularly
peaceful border, he mentions the Buddhist civilization. This is due to the fact
that the Buddhist civilization diverges into two forms and has a weaker identity
and cohesion compared to other civilizations. It is also very uncertain,
following Huntington’s argument, whether the Sinic civilization will align with
the Muslim civilization in a future international dispute against the West. Not
all of these ideas can easily be reformulated as testable propositions. But some
are clearer than others and give rise to the following general hypothesis (H6),
with four sub-hypotheses (H6 A-D):
H6: Certain civilizations and certain pairs of civilizations are more
conflict-prone than others.
H6A: The Western civilization is more than averagely exposed to conflict.
31

H6B: The Muslim civilization is more than averagely exposed to conflict.
H6C: The Buddhist civilization is less than averagely exposed to conflict.
H6D: The Western and Muslim civilizations are particularly prone to fight
each other.
32
3 Method and Data The aim of this chapter is to make as transparent as possible the process by
which variables are generated and subjected to statistical analysis, as tests of
the hypotheses set forth in Chapter 2. This transparency will allow other
scholars to replicate the research and fill in the holes that invariably remain.
Measuring variables is by nature a rough and imperfect procedure; in this
regard I have encountered problems, argued for the way I have chosen to deal
with them, and pointed out remaining shortcomings.
I will start this chapter with a very brief presentation of my quantitative
research design, as a response to problems related to previous attempts to test
Huntington’s theory. Next, I will present the data used in the analysis and some
relevant variables from the dataset (3.1 and 3.2). I further explain how I have
combined data to generate a “civilizational” variable – the central variable of
the analysis (3.3). Last, I discuss the problems I have encountered, and the
solutions, in light of reliability and validity (3.4 and 3.5).
In Chapter 2, I presented various attempts to test Huntington’s propositions
concerning the civilizational concept. These attempts used the “Correlates of
War” (COW) datasets, where the units are “country-years” or “dyad-years”
(respectively called monadic and dyadic forms of analysis). In these studies, the
units of analysis are all combinations of states, or pairs of states, for all years.
The dependent variable, “conflict”, is measured either as Militarised Interstate
Disputes (MIDs), or by a threshold of 1000 battle deaths, COW data for civil
wars. The independent variables are various measurable features of a country:
its level of democracy, GNP per capita, level of “open economy” (trade), etc.,
and control variables such as whether the state has recently been at war, and
whether a pair of states are neighbors or not (contiguity). This approach has
been very fruitful in testing IR theory and represents a systematic way in which
33
to generalize about causes of conflict. I will argue, however, that the same
approach is less appropriate to testing the propositions of Huntington. Some of
this criticism has already been put forward by Huntington (2000) himself.
First, Huntington’s theory concerns the post-Cold War era, and an
analysis of conflicts that account for the period 1945-92, which is essentially
the Cold War era, can neither prove nor disprove Huntington’s central
argument. An analysis should endeavor to include as many post-Cold War
years as possible, and there should be a sufficiently high number of units
representing each era from which one wishes to generalize. Second, if we are to
examine Huntington’s propositions about the nature of conflicts in the “new
era”, his claim that interstate, intrastate and internationalized intrastate conflicts
are all somehow interrelated, should be reflected in the design of the analysis. It
is therefore inadequate to focus merely on interstate conflicts. Third, the idea of
applying country-years as units in an analysis concerning religious, ethnic and
linguistic differences (cultural differences) – which know no state borders – is
questionable. Country-years are well suited for categorizing countries and
generating variables that easily follow the administrative system of state
borders, but in regards to civilizational borders it is rather problematic.
Two solutions to this problem have been tried thus far: a) to use
Huntington’s map (see Chapter 2) to categorize countries into civilizations, and
b) to categorize countries into civilizations by cultural composition, such as the
percentage of the population belonging to a certain religious community, or the
country’s majority ethnic group (see Shannon 2001). Both these approaches are
problematic. The first does not take account of the fact that civilizational
borders often cross through countries. In India, for example, the mix of Hindus
and Muslims throughout the country makes it very problematic to classify even
parts of India as belonging to one civilization or the other. Approach b)
neglects Huntington’s map, and one will have to decide on some kind of
percentage measure for which countries are mixed, which are not, and between
which groups. Moreover, it is not a test of Huntington’s theory to measure
whether “Muslim countries” fight “Hindu countries” significantly more than
34
they fight their own “Muslim countries”. Huntington’s argument is rather that
the areas along the fault lines of civilizations, i.e. where the major cultures
meet, or clash, are more prone to conflict than other areas. If this proposition
gains empirical support, it is an indication that cultural dissimilarity is a
stronger determinant of the pattern of conflict, than assumed in the studies
reviewed in Chapter 2. This is not the proposition that has been tested by
researchers thus far. In this chapter, I present a method to test some of
Huntington’s propositions. I believe that this method addresses the
shortcomings of the previous attempts to test Huntington.
For the dependent variable, I use the PRIO/Uppsala dataset. This dataset has a
more inclusive definition of conflict than the previously used datasets, which
will be discussed below. In addition, it contains more recent data, which
provides a better basis for generalizing about the post-Cold War era, and for
detecting possible changes from one era to the other. Furthermore, I will use
“conflicts”, as opposed to country-years, as units in the analysis. The units
include all types of conflicts in the dataset: interstate, intrastate and
internationalized intrastate conflicts. It thus provides a fairer and more
including approach to testing the propositions/hypotheses. By using conflicts
as units, I also avoid having to categorize every country into one civilization,
which is extremely problematic. With this approach, I examine general features
of conflicts, such as their location. More specifically, I generate a
“civilizational variable” by ranking each conflict by its distance to the nearest
civilizational border. As a reference, I also rank cities with more than one
million inhabitants by their distance to the nearest civilizational border. I test:
to what extent do the conflicts of the post-Cold War era occur geographically
along the fault lines of civilizations? Furthermore, is civilizational conflict a
feature merely of the post-Cold War era? Are civilizational conflicts generally
over territory, and do they involve significantly high numbers of battle-related
deaths? Which civilizational borders are most prone to conflict? This chapter
35
will explain in detail this applied method and the generating of data, and then
discuss problems of validity and reliability.
3.1 The PRIO/Uppsala Dataset
The PRIO/Uppsala dataset is a newly released dataset showing armed conflict
1946-2001 (Gleditsch et al. 2002). The definition of (armed) conflict in this
dataset is: “A contested incompatibility that concerns government or territory
or both where the use of armed force between the two parties results in at least
25 battle-related deaths. Of these two parties at least one is the government.”
(Gleditsch et al. 2002: 619). A conflict may be “interstate” (between two or
more states), “internationalized internal” (between the government of a state
and internal opposition with intervention of other states), or “internal” (between
a government of a state and internal opposition groups without outside
intervention) (Gleditsch et al. 2002: 619). The threshold is the same for all
conflicts. This is a more reasonable threshold (with regards to number of battle
deaths) than either the COW project’s war data (1000), or the MID data (where
the threshold is simply a threat to use force, not necessarily involving a single
battle-related death). Because of the lower threshold, the PRIO/Uppsala dataset
includes a larger number of conflicts than the COW dataset on war. It excludes
disputes with no, or only a very few, battle-related deaths7. The Uppsala
University Conflict Data Project has collected data on low-level conflict,
internal and external, from the end of the Cold War. The dataset has been
extended back from the end of the Cold War to the end of World War II. The
dataset has been generated in two steps: First, a candidate list was generated on
the basis of 13 existing datasets. Second, the candidate conflicts were checked
systematically on the basis of the Uppsala coding criteria. In sum, the
PRIO/Uppsala dataset includes more conflicts from recent times and at the
same time includes all relevant types of conflicts for my analysis for the period
36

1946-2001. The 2001 data were released quite recently, and my analysis is
limited to the period 1979-2000.
Although the work of generating the dataset has been conducted with
great care, there are some problems concerning the categorization of conflicts.
First, there is the problem of deciding whether the fighting of a conflict-year in
the later years is a continuation of the conflict in the first year, or a new
conflict. The guidelines used by the creators of the dataset are somewhat
unclear. A second point is that even with this low threshold, a user will find
important conflicts missing because they fail to reach the 25 battle-related
deaths limit. For example, both in Israel/Palestine and Northern Ireland there is
not registered “conflict” in the database for the period 1990-2000 since the
number of battle-related deaths in those conflicts did not exceed 25 in a single
year in that period.
3.1.1 The Variables in the Dataset
The conflicts in the PRIO/Uppsala dataset are classified by whether they
concern government or territory. A “government” conflict concerns the type of
political system, the replacement of the central government or the change of its
composition. A “territory” conflict concerns “a change from one state to
another in the control of territory in the case of interstate conflict or demands of
secession or autonomy in the case of intrastate conflict” (Gleditsch et al. 2002:
619-620). This dichotomous variable is labeled “Incompatibility” and responds
directly to my Hypothesis 4.
A variable that responds to H3 (the proposition that civilizational
conflicts are “bloodier”) is the one labeled “Intensity”. “Intensity” has three
levels: 1. “Minor” involves at least 25 battle-related deaths per year and fewer
than 1,000 battle-related deaths during the course of the conflict. 2.
“Intermediate” involves at least 25 battle-related deaths per year and an
7 For a more detailed discussion see the presentation in Journal of Peace Research 5/2002, also with further reference to the dataset codebook. The codebook is also available at www.pcr.uu.se.
37
accumulated total of at least 1,000 deaths, but fewer than 1,000 in any given
year of the conflict. 3. “War” involves at least 1,000 battle-related deaths per
year (Gleditsch et al. 2002: 619). In practice, and especially for the 1979-2000
period, there is no difference between category 1 and 2. They are, in fact, not
properly scaled, since there is hardly any substantial difference between these
two categories. Therefore I choose to dichotomize the variable and merge
category 1 and 2 into “0”, and the remaining “1”. This variable will account for
how violent a conflict is, especially since Huntington explicitly mentions that
“bloody” translates to the number of battle-related deaths (Huntington 1996:
252-253).
As I have explained earlier, this analysis includes all the conflicts in the
dataset. Therefore, it is interesting to see if there is any difference when
distinguishing between types of conflicts (H5). Since internationalized internal
conflicts according to Huntington are civil wars that have “spilled over”, the
same way he regards interstate wars to be spill-overs, I choose to merge the two
categories into one “international conflicts”, as opposed to “internal conflicts”,
which makes this variable a dichotomy that is labeled “Type”.
3.2 Geographical Data
I use two types of geographical data for generating a “civilizational variable”.
One is the location of conflicts, which Halvard Buhaug has added to the
PRIO/Uppsala dataset (Rød, Gleditsch & Buhaug 2001; Buhaug & Gates
2002). This contains information on the location (longitude, latitude) and
geographical extent of each conflict (radius) in the dataset. The conflict
locations can be viewed on Map 2 in section 3.3.1. The second set of data is
simply a file with the location of cities with more than one million inhabitants
(see Appendix 1).
38
The data for the location of the conflicts have been incorporated into the
PRIO/Uppsala database (Gleditsch et al. 2002). For any given conflict, Buhaug
et al. outlined a “conflict area”, i.e. where the armed conflict took place, in an
Eckert VI projection of the world. Based on the most distant points of this area,
Buhaug defined a circular conflict zone. (This approximation is, of course, not
a perfect description of the size or shape of the conflict area). The center of the
circle is the center of the conflict. This is used to define the “location of the
conflict”. The same simplification is made when developing the
“ViewConflict” program from the same set of data (see Rød et al. 2001). The
conflict location of an interstate conflict is registered on the border of the two
warring countries, hence not necessarily exactly where the fighting took place.
A radius variable has only been generated for internal conflicts.
Given the definition of conflict in the PRIO/Uppsala dataset, the number of
“observations” in this dataset is higher than the actual number of conflicts (See
Codebook Sections 3 and 4.1-3). Several observations of “armed conflict” that
are related, constitute one conflict. The geographical data, which is the basis for
my analysis, counts every observation as one conflict. Hence, there are 536
observations, or conflicts, in the period 1946-2000, and 295 in the period of
analysis, 1979-2000. What is the difference between applying “observations”
or “conflicts”? When the PRIO/Uppsala dataset was generated, every
observation received an ID. Later, it received a Conflict ID for every conflict
involving several observations. For example, the conflicts in Tibet in 1950,
1956 and 1959 all have the same Conflict ID, but different IDs as separate
observations. This means that for every year that is coded from “peace” to
“conflict” or from “conflict” to “peace” (an “observation”) in a certain area of
the world, this is registered as a “conflict” with a co-ordinate for the location.
In sum, the geographical data contains many more (about twice as many) units
(locations of conflicts) than the PRIO/Uppsala final set. However, the two sets
of data correspond perfectly, since they are merely more aggregated (conflicts)
and less aggregated (observations) data. In the analysis of this thesis, I have
39
chosen to apply the same set of units as in the geographical data – which means
observations.
However, I will conduct the same analysis with the other set of units for
conflicts as well. Since the results are the same, I will subsequently report only
findings from the first set and refer to Appendix 6; for the results from the
alternative set of units. Although it does not seem to matter which type of
conflict unit I choose, I find the geographical data units more appropriate in a
quantitative analysis since they contain more information. Second, with as
many as 295 units, split up between during- and post-Cold War, it is more
justifiable to run comparisons of means when both variables are strongly
skewed (Skog 1998: 167-170). Therefore, I will use “observations” in my
analysis, and I will use the term “conflicts” for these observations.
The second type of geographical data is the location of cities with more than 1
million inhabitants in relation to civilizational borders (see Appendix 1). The
purpose of this variable is to create a control variable when testing H1: the
significance of civilizational borders to the location of conflicts. If it turns out
that the frequency of conflicts increases closer to the civilizational borders,
there is still no reference to determine if this is a distinct phenomenon. A
(statistical) test of whether this is a distinct empirical pattern would be to see
how random locations would be distributed in relation to civilizational borders,
in comparison with how the actual locations of conflicts are spread in relation
to civilizational borders. This is a basic statistical principle often performed as
a t-test of means between the random and actual distribution. This leads to the
question: how could one generate a random set of locations that could
hypothetically be locations of conflicts? There are two limitations: None of the
conflicts are located (at least not their center) at sea, which rules out more than
70% of the world surface, and there are no conflicts where no, or very few,
people live.
The best solution would be to generate random geographical points in
populated areas of a certain density level and higher. Since this would be too
40
time consuming and geographically challenging, I have chosen what seems to
be one out of very few alternatives, which is to select all cities with more than
one million inhabitants. I was able to get hold of a GIS file (ESRI) with the
location of all (250) cities with more than one million inhabitants. This will
serve as a set of random locations of conflict. Therefore, when I apply the
civilizational variable to conflict locations, I conduct the exact same operations
with this “random set” in order to compare whether the actual distribution of
conflicts is significantly closer located to civilizational borders than the random
distribution of “conflicts” (cities) (H1). This means I do not only measure the
extent to which conflicts are distributed closely along the civilizational borders,
I also test statistically whether random (populated) locations in the world are
distinguishably closer located to civilizational borderlines compared to
conflicts. Distances to cities are an important indicator as a control and a
reference for the distance between conflicts and borders8.
If cities are to express fictitious conflict points, as a reference to actual
conflict locations, in relation to civilizational borders, this presupposes that the
locations of cities are not correlated with civilizational borderlines. However,
there are arguments that such correlations exist. On the one hand, one may
argue that cities with more than one million inhabitants are systematically
located farther from civilizational borderlines. One argument in this direction
may be that while many cities are located along the coastal areas, civilizational
borderlines are, to a large extent, stretched out across continents. It is also
conceivable that people wish to live in culturally homogenous areas, i.e. away
from civilizational borderlines. On the other hand, one may argue that there are
factors affecting cities to be located close to civilizational borderlines. One
argument is that many great cities have developed from the inter-civilizational
trade. Istanbul, Sarajevo, and Alexandria are some examples. These factors are
important to be aware of, especially if the result shows marginal difference.
8 Also, the control of cities provides a certain control of “no conflict” as opposed to “conflict”, which was the initial reason for the country-year analysis approach.
41
3.3 Combining the Data in GIS – how the “Civilizational Variable” is Generated
I have now presented the data I use to generate a civilizational variable. These
are the next steps I have taken: First, from Map 1 (Chapter 2) I identified where
one civilization meets another – the civilizational borders. I coded each border
by which civilizations meet, or “clash”. Next, I drew these borderlines on to a
world map (Eckert VI projection of the world) where also all conflict locations
are marked as points (see Map 2, below). Next, I ran an operation in the GIS
program where every conflict was measured automatically by the distance to its
nearest civilizational borderline. Hence, I ended up with a new variable where
every conflict is ranked by its distance to the nearest civilizational border,
measured in meters. I also coded for each conflict which borderline it aligns to
as the closest. This civilizational variable I labeled “Distance” and I added it to
the original dataset (see Appendix 2, which contains the whole dataset used for
the analysis). This provides interesting opportunities for running correlations
with other variables already in the dataset.
In the following, I will explain which problems I encountered when
projecting the civilizational borders, and how I dealt with those problems. I
then comment on the process of identifying which civilizational border is
closest to each conflict, and measuring the distance. The matrix that was
eventually produced is displayed in Appendix 2. Furthermore, I suggest some
of its utilities. The exact same procedure was conducted with the measuring of
location of cities in relation to civilizational borders, and I will therefore not
comment more on that. The statistical tests will be further commented in (3.4).
3.3.1 Drawing Civilizational Borders
The programs used are ArcView (ESRI) for display and presentation and
Arc/Info for calculations (ESRI). Both programs are software in the category
Geographical Information Systems (GIS). The objective is to measure
distances from locations (points of conflicts and cities) to the nearest
42
civilizational border. Since the conflicts are already in the program, the task is
to draw civilizational borders. The only source used for drawing the borders is
Huntington’s map (see Map 1, Chapter 2) (Huntington 1996: 26-27).
Huntington’s map simply displays the various civilizations in the world. I want
to draw the lines where one civilization ends and another starts – their
borderlines. There are some problems attached to this. First, the lines on the
map are, according to Huntington, only the broader cultural borderlines, and
they are not very accurate (Some places it is quite difficult to see exactly where
the lines are drawn). However, this is Huntington’s most explicit and concrete
exposure of his theory. Although the theory suggests that there are many finer
cultural borders on a micro-level, the borders on the map are the ones that,
allegedly, have an influence on war and peace. Therefore, it is appropriate to
use these borders as a basis for testing his theory concerning patterns of
conflict.
The second problem faced is that of reaching some kind of standard as
to when the division between two civilizations by a long distance of sea (e.g.
the Atlantic) should constitute a civilizational border. My solution is to use the
threshold of Correlates of War project (Singer & Small 1994) when
distinguishing whether two states are neighbors (the contiguity variable): less
than 150 English miles (approximately 241 km). This means, for example, that
there is a civilizational border across the Gibraltar strait, but not between Japan
and Russia. A third problem is that the whole of India, and only India, is
hatched on Huntington’s map, indicating that it is mixed between one or more
civilizations. The solution that is most fair to testing the theory is to define this
whole area as a clash of civilizations where every conflict will have 0 meters
distance to its nearest civilizational border. This method constitutes a problem
since one area is treated differently from other areas, however, the potential
negative effects are outweighed by the fact that there are relatively many cities
in India that have one million inhabitants or more. Furthermore, the use of this
method is justified by the lack of better alternatives. A fourth and final problem
was the difficulty of drawing the borderlines accurately. In some (very few)
43

places there is a 20-30 km gap between where the line ought to be drawn, as
opposed to where it is actually drawn. This discrepancy is randomly distributed
and is relatively minor (30 km, the maximum margin of error, is 4,6% of the
average distance between a conflict and the closest civilizational borderline of
295 conflicts 1979-2000).
44
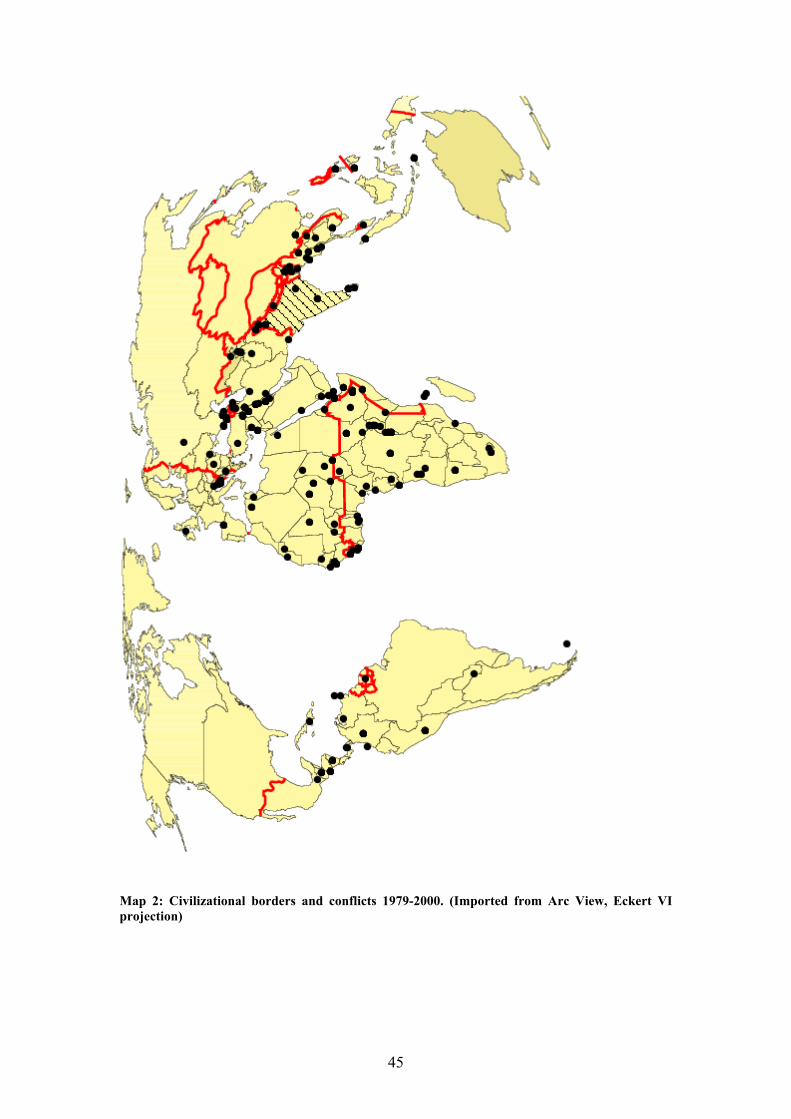
Map 2: Civilizational borders and conflicts 1979-2000. (Imported from Arc View, Eckert VI projection)
45
3.3.2 Distances to Civilizational Borders
In Map 2, the locations (points) are conflicts 1979-2000 from the PRIO dataset,
which are also the units in my analysis. The aim is, as already explained, to
generate a variable by which these units are scaled by their distance to the
nearest civilizational border. This means that, for all conflicts, I identify the
closest point on the civilizational border and then measure the distance between
the two points. This measurement is possible to do automatically in the
program ArcInfo when the civilizational borders have been drawn in ArcView.
The distance from each of the conflict locations to its closest borderline is
measured by the program, displayed in ArcView, and made ready to export to
Excel and other statistics programs (Stata and SPSS in my case).
The next stage is to identify the closest civilizational border from each
conflict. The purpose of gathering this information is to compare the amount of
conflict relatively along the various borders. The idea is to measure the total
distance to all borders and thereafter divide the distance to each civilizational
border by the total distance. This proportion multiplied with the total number of
conflicts provides an “even” measure, i.e. the number of conflicts
“attached/related” to a certain civilizational border provided that the conflicts
were spread out evenly. In other words, this “even” measure expresses the
expected number of conflicts along a certain civilizational border provided that
civilizational issues did not affect the distribution of conflict. Therefore, it is
interesting to compare with the actual distribution. The process of adding up
distances is straightforward in the GIS software. All the lines drawn have been
automatically coded (1-43). Each of these lines responds to a civilizational
border, which is also coded (1-16). The final result is reached by summing up
the number of conflicts of all lines belonging to each civilizational border. This
information provides a good descriptive test of H6A-D. See Appendix 3 to
review the information I have added.
46
3.3.3 Projection versus Reality
The earth has an approximately ellipsoidal shape. The world map used is a
representation of the earth projected on the plane with the Eckert VI projection.
We can imagine going from the globe to a sheet. This causes errors to occur in
the distances in the plane compared to the distances on the earth itself. Errors in
distance, direction, area and shape will vary according to which projection one
chooses. Hence, a decision must be made on whether to change the projection
and, alternatively, conduct distance measurements without a projection, i.e.
using geographical co-ordinates (latitudes and longitudes), as opposed to plane
co-ordinates.
Distances will never be 100% accurate when measured in a plane.
Distances from one geographical co-ordinate to another, with a known datum
(a datum contains information about the shape of the earth) can be easily
measured. Finding a distance to a line, however, is more problematic. For that
reason, and because the geographical data available was already plotted in a
projection, using a projection was the most convenient solution. A different
question is whether I should use a different projection than Eckert VI. There
are world projections with smaller errors in distance, but accordingly greater
errors in shape, etc. However, the fact that the data was already in this
projection, and that a transfer to another projection could cause errors in the
dataset, made the choice easy. Another argument for choosing Eckert VI is that
this makes it easier to present the results and to replicate the analysis.
Eckert VI is a pseudocylindrical, equal-area projection, where all parallels are
straight lines and all meridians are equally spaced sinusoidal curves, except the
central meridian (Greenwich), which is a straight line (ESRI manual on map
projections. 1994 ESRI: Appendix 36). Equal-area means that the various land
areas are displayed with correct area-size relative to each other. This implies
that shape, distance and directions will be inaccurate. Here, I will only
comment on the inaccuracy in distance. For distance, the scale is distorted N-S
47
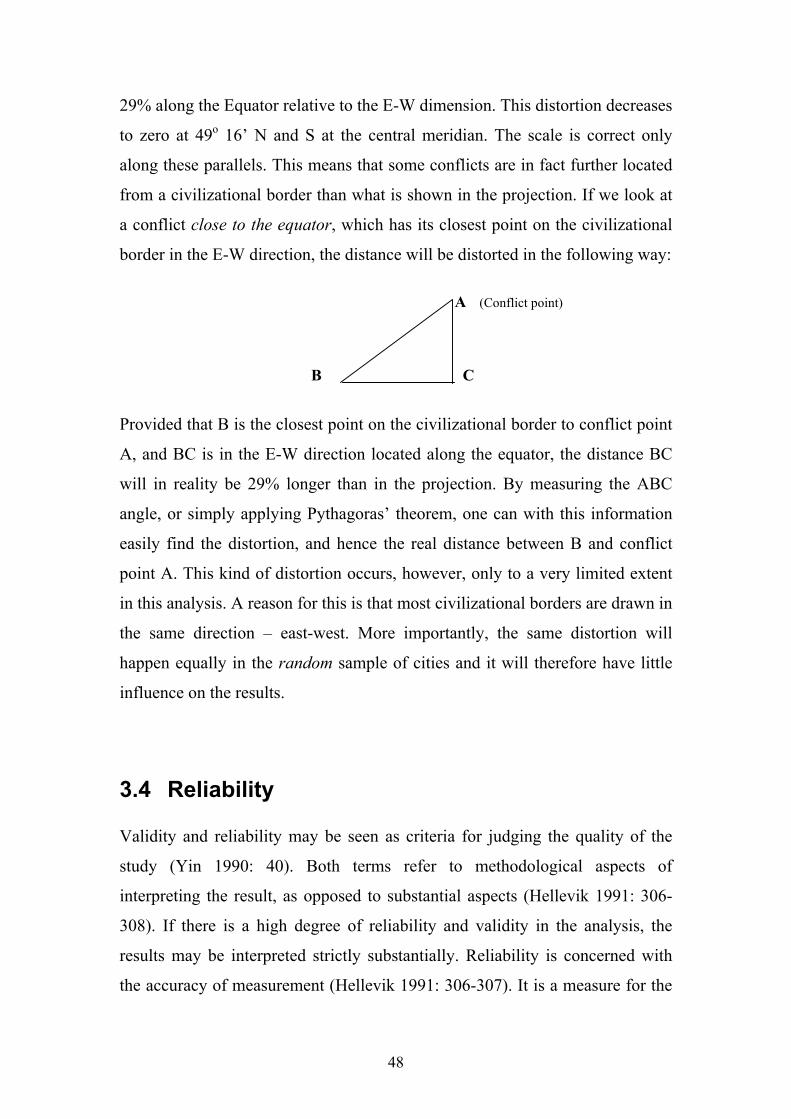
29% along the Equator relative to the E-W dimension. This distortion decreases
to zero at 49o 16’ N and S at the central meridian. The scale is correct only
along these parallels. This means that some conflicts are in fact further located
from a civilizational border than what is shown in the projection. If we look at
a conflict close to the equator, which has its closest point on the civilizational
border in the E-W direction, the distance will be distorted in the following way:
A (Conflict point)
B C
Provided that B is the closest point on the civilizational border to conflict point
A, and BC is in the E-W direction located along the equator, the distance BC
will in reality be 29% longer than in the projection. By measuring the ABC
angle, or simply applying Pythagoras’ theorem, one can with this information
easily find the distortion, and hence the real distance between B and conflict
point A. This kind of distortion occurs, however, only to a very limited extent
in this analysis. A reason for this is that most civilizational borders are drawn in
the same direction – east-west. More importantly, the same distortion will
happen equally in the random sample of cities and it will therefore have little
influence on the results.
3.4 Reliability
Validity and reliability may be seen as criteria for judging the quality of the
study (Yin 1990: 40). Both terms refer to methodological aspects of
interpreting the result, as opposed to substantial aspects (Hellevik 1991: 306-
308). If there is a high degree of reliability and validity in the analysis, the
results may be interpreted strictly substantially. Reliability is concerned with
the accuracy of measurement (Hellevik 1991: 306-307). It is a measure for the
48
degree of reproductivity of the study and the results. In this section, I will
briefly sum up the most important issues regarding reliability that may in some
way affect the results. The aim is to make these concerns explicit in order to
assess whether they are problematic with regard to the analysis.
Although I have pointed out many measurements that are not 100%
accurate, these are not systematic errors that are expected to affect the results.
What could affect the result is the way borders are drawn between neighboring
civilizations divided by sea. It would, for example, probably affect the result if
no border was drawn across the Gibraltar strait. There are conceivable
alternatives to using a threshold of 150 miles. This threshold has, however,
previously been used for similar purposes. There is a guidance, made explicit,
which makes it possible for other researchers to replicate and assess whether a
change of threshold affects the result of the analysis. A different reliability
issue of concern may be the distortion of distances in this kind of projection.
For the most part, however, this is not a concern, since the distances only to a
small extent are in the east-west direction. Furthermore, for this concern, and
other concerns regarding measurement in the projection, it is important to ask
whether it affects any of the tests in the analysis. Since all tests are made on the
basis of measurement in the same projection (distances from the cities, the
random set, is generated the exact same way in the same projection), the
concerns do not constitute reliability problems.
With regards to the dataset, the reliability concerns are few and minor.
The most problematic point is, perhaps, how the start time and end time of the
conflicts have been generated. This is often hard to tell, since conflicts tend to
persist in some form or another. Are there several conflicts in, for instance, Sri
Lanka and Sierra Leone in the 1990s, or is it just the same conflict re-emerging
some years later? It is also a concern that no clear guidelines seem to exist, by
which to judge in these matters. This does not concern my analysis to a large
extent. Because I have relatively many units, unsystematic misjudging will not
disturb the discovery of the main tendencies in the material. However, I have
not ruled out effectively the possibility of a standard error in the material
49
attached to the time-element of the PRIO/Uppsala definition. There may be a
systematic error of not including conflicts of 20 battle-related deaths in
December one year, and another 20 January the following year, whereas 25
battle-related deaths one year is included as a conflict.
3.5 Validity
In general terms, validity may be defined as the relevance of the data for the
problem one studies (Hellevik 1991: 159). I have already discussed issues
concerning validity in this chapter, and for that reason, this paragraph only
makes reference to what has already been stated. Validity can be broken down
to four parts (Skog 1998: 85-86). The first two points are internal and external
validity. The former refers to the causal interpretation of the data, and the latter
refers to the generalizing on the grounds of the analyzed data (Skog 1998: 86-
90). I will treat them simultaneously as I present the research design. The
analysis has a relatively large N, which means that the number of units is
relatively high (295). The data contains systematically gathered properties of
the units (conflicts): their location in relation to civilizational borders, intensity
(number of battle-related deaths), and other characteristics of the units. I make
two generalizations: I postulate that the nature of conflicts in the periods 1979-
89 and 1990-2000 are representative of the conflicts in the Cold War era the
post-Cold War era, respectively.
With relatively few variables and large N, the analysis suits explanation. It is
my aim to contribute to the debate on what the causes of conflict are on the
background of seeing location of conflicts in relation to causes of conflict.
Nevertheless, the more specific objective and project of this thesis is to test
certain propositions of Huntington’s theory, from which I have deduced
hypotheses in Chapter 2. These hypotheses are logical derivations from
theoretical statements. They are deduced “empirical statements”. “After this
50
logical deduction of empirical statements from the theory, one can make the
observations called for in the empirical statements to see whether or not they
are true” (Stinchcombe 1968: 15-17). One central derivation is that the
conflicts of the post-Cold War era occur along the fault lines of civilizations. I
have formulated H1 to test this theoretical statement empirically. I make
observations of the locations of conflicts for the period I wish to generalize
about, and measure their location in relation to the fault lines of civilizations. If
H1 corresponds with reality, Huntington’s theory gains more credibility. If not,
Huntington’s proposition is false. Furthermore, there are logical expectations
deduced from the theory about how the “civilizational variable” will correlate
with other relevant variables. This is provided that I have made correct
measurements, deductions and statistical tests; hence, the results from the test
can be interpreted substantially rather than methodologically. This type of
research design is a quite standardized and recognized research method.
A third approach to validity is the validity of conclusions. This is a matter of
applying appropriate statistical tests and design, so that the results will
correctly mirror the data. The statistical tests of this analysis will consist of
descriptive statistics and bivariate correlations between the civilizational
variable and other relevant variables. Examples of descriptive statistics are the
average distance between civilizational borders and conflicts, when controlling
for post- and Cold War period, or cities. As means of comparison, I apply the
Student’s t-tests of averages to see if they are significantly different. This kind
of test is problematic if the variable is strongly skewed, which the civilizational
variable is. Provided that the number of units exceeds 100, however, it is still
plausible to apply this kind of test, according to Skog (1998: 166-170). Both for
H1 and H6A-D I apply descriptive statistics to some extent. The underlying
principle for these tests is to compare the actual distribution with a random
distribution in order to judge if they are significantly different. A difference
implies the existence of a distinct empirical phenomenon. This is, for example,
the case when comparing random (even) distribution of conflicts along
51

civilizational borders, with the actual distribution of conflicts controlled for
civilizational borders (H6A-D).
In this context, I will briefly return to the issue of internal validity, i.e.
the causal relations. It is obvious that the civilizational variable comes first in
time of the relevant variables. E.g. the fact that a conflict is located in an area
where different civilizations meet, may affect the length of the conflict or how
“bloody” it will be. However, it is not logical that the duration of a conflict
determines the location of the conflict in relation to the civilizational border.
Although there may be a relatively strong correlation between the civilizational
variable and another relevant variable to the theory, it does not necessarily
predict or explain an empirical relationship. The relationship may be a
spurious effect, meaning that the variation in the dependent variable may be
caused by a different independent variable than the one used. For example, the
areas through which the civilizational borders are drawn may be densely
populated and this factor determines a relatively high death rate. It is common
to use control variables in order to rule out this possibility. In my case, the only
variables available are the existing ones in the dataset and additional variables
must be generated. I have already generated one, and generating more
geographically based variables would be too time-consuming. This is probably
the most severe limitation of my analysis – the lack of control variables. This
will be further discussed at the end of Chapter 4, and I will suggest remedies to
this problem through including relevant control variables in a qualitative
approach in Chapter 5. One solution to the lack of variables is to reduce the
number of units to a few (comparative study) or one (case-study). I have in the
introduction suggested conducting a case study in order to investigate the
micro-foundations of a general relationship that may be revealed in the initial
quantitative analysis. Such combinations of quantitative and qualitative
research may complement each other with great advantage, and compensate
some for the lack of control variables by providing more understanding of the
results and the interplay of various factors (Madsen 1979; Collier 1993: 105-
110; King et al. 1994: 3-33).
52
A fourth, and final, aspect of validity is construct validity, which may be
defined as the extent to which the chosen operationalization corresponds with
the theoretical concepts (Hellevik 1999: 17; Skog 1998: 87-92. Even though it
is problematic to simply translate the concept of civilization to “cultural
factors” such as linguistic, ethnic, and, especially, religious differences, I leave
it to Huntington to defend this. My objective is to test his theory, and then, on
the basis of the results, I can criticize the logical arguments of his theory. For
the sake of the analysis, I take for granted that his theory is correct and test the
logical implication of the theory empirically. As regards construct validity in
general, I have already discussed the process of operationalization throughout
Chapters 2 and 3. Nevertheless, I think it is timely ask what the civilizational
variable expresses. The theoretical point of departure is Huntington’s claim that
the conflicts of the post-Cold War era will mainly occur along the fault lines of
civilizations. One solution to measure this phenomenon would be to see how
many conflicts are located within a certain buffer zone along the borderlines.
This solution is in essence to create a categorical variable. But then again, how
wide should this buffer zone be across the different parts of the world? How
many layers (categories) should one make and what distance between the layers
should define the categories? The better solution is to use a continuous (scale)
variable measured in meters. Although this solution does not entirely match the
fact that borders are in many cases buffer zones, it provides more information
and solves having to “guess” which lines should have a wider or narrower
buffer zone. But what does such a variable express? Is a conflict more
civilizational the closer it is located to a civilizational border? This question is
important to answer in regard to the bivariate correlations where the
civilizational variable is one of the two. Since the variable is measured in
meters at the interval level, the answer must be yes: it is a ranking of how
civilizational a conflict is. This is obviously not a perfect measurement of “how
civilizational” a conflict is. Take a conflict that is located in India. Since India
is mixed, and thus hatched, it would mean that the conflict has the value 0
53
meters distance from the nearest civilizational border. This should then be the
most civilizational conflict of all. One problem is that all conflicts in India have
this value, so there is no way of scaling them. Second, this specific conflict
may strictly concern resource shortages, even though it is located in an area
marked as “clash of civilizations”. It is, in other words, not a perfect scale.
Even so, it is a very good approximation to testing the validity of Huntington’s
argument. The relatively large number of units outweighs the problems with
the scale of the variable. With as many units as 295, it will be quite evident,
statistically speaking, whether the conflicts of the various periods are centered
along the fault lines of civilizations or if they are randomly spread in relation to
these borderlines. If there is such a pattern and relationship that Huntington
proposes, it will be identified with this type of analysis (this also concerns
conclusion validity).
54
4 Analysis
4.1 The Significance of Civilizational Borders to the Pattern of Conflict
H1: Conflicts more frequently occur along the fault lines of civilizations.
This relationship seems evident in a visual presentation when testing for the
period 1979-2000, like below on Map 3. The civilizational borders are drawn
on a display of conflict locations 1979-20009. Map 3 shows that conflicts are
visually, to a large extent, located along the fault lines of civilizations. Judging
from this visualization, one would expect support for H1, although there
apparently are great variations, i.e. different parts of the borders are unequally
exposed to conflicts. For example, it may seem that the theory is less suitable
for explaining conflicts on the American continent than in the rest of the world.
Another apparent feature of this map is the absence of conflicts in Northern
China and further north, despite the existence of civilizational borderlines also
in this area.
9 See Appendix 4 for a visual comparison of the conflict locations 1979-89 and 1990-2000. The zone, marked grey, is 650 km around the borders (650 km is the average distance from a conflict to the nearest border)
55
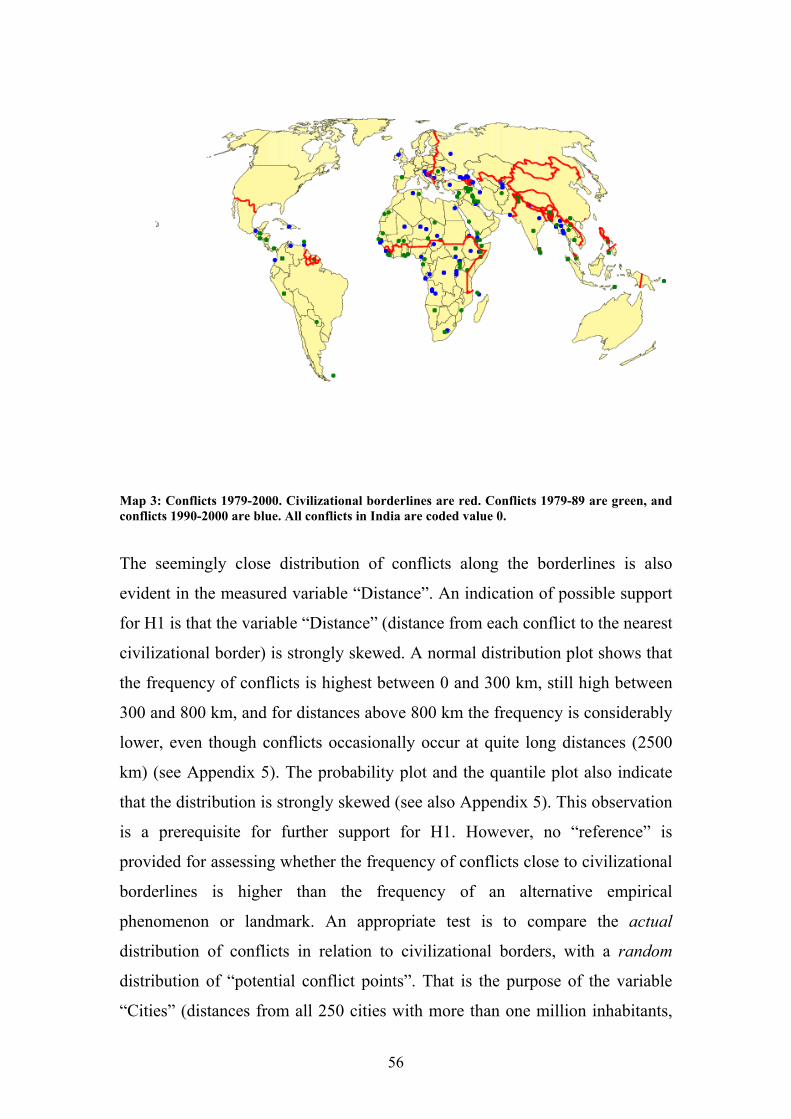
Map 3: Conflicts 1979-2000. Civilizational borderlines are red. Conflicts 1979-89 are green, and conflicts 1990-2000 are blue. All conflicts in India are coded value 0.
The seemingly close distribution of conflicts along the borderlines is also
evident in the measured variable “Distance”. An indication of possible support
for H1 is that the variable “Distance” (distance from each conflict to the nearest
civilizational border) is strongly skewed. A normal distribution plot shows that
the frequency of conflicts is highest between 0 and 300 km, still high between
300 and 800 km, and for distances above 800 km the frequency is considerably
lower, even though conflicts occasionally occur at quite long distances (2500
km) (see Appendix 5). The probability plot and the quantile plot also indicate
that the distribution is strongly skewed (see also Appendix 5). This observation
is a prerequisite for further support for H1. However, no “reference” is
provided for assessing whether the frequency of conflicts close to civilizational
borderlines is higher than the frequency of an alternative empirical
phenomenon or landmark. An appropriate test is to compare the actual
distribution of conflicts in relation to civilizational borders, with a random
distribution of “potential conflict points”. That is the purpose of the variable
“Cities” (distances from all 250 cities with more than one million inhabitants,
56

to their nearest civilizational border – see Chapter 3). Below is a t-test
comparison of the average distances of the variables10.
Table 1: Average distances to civilizational borderlines, and t-tests of whether conflicts are located significantly closer than cities, to civilizational borders.
Mean distance (km) Difference in mean distance (km) (cities-conflicts)
T-test of means* significance probability
Conflicts 1979-89 734 387 0.000
Conflicts 1990-2000 544 573 0.000
Cities 1117 - - * One-tailed test. P-value for two-sample t-test of averages.
The first column of Table 1 contains the average distances from conflicts (split
up in two eras), and cities, to civilizational borders11. The average distances
have great variations. The second column displays the difference in mean
distance (from column 1). Each number in this column is the result of
subtracting the conflicts’ mean distance (for each period) from the cities’ mean
distance. Column three displays the result from a statistical test: what is the
likelihood (p-value) that the differences of means (in column two: cities -
conflicts) reflect a significant change? I.e. what is the possibility that cities and
conflicts are located at about the same distance from civilizational borders?
The result in column three shows that, with 99% statistical confidence, cities
are located farther from civilizational borders than conflicts. This is evident for
both periods, and thus, for the whole period 1979-2000.
The “Cities”-variable is a reference and a sort of control variable
expressing the assumption that conflict is more likely in areas with a relatively
high population density. In Chapter 3, I pointed out that there are arguments
both for cities being systematically farther away from, and being closer to,
civilizational borders. This means that the cities’ locations are far from a
10 The purpose of a Student’s t-test in this case is to determine by what likelihood the average distances are significantly different from each other. The basic model is to calculate the critical t-value by the following formula: t = (m1 – m2) / (St.dev. (m1 – m2)), where m1 is the average distance from one population, and m2 from the other population.
57
perfect measure of random points in populated areas. It is, however, the best
approximation available at this stage. If cities are, for the reasons mentioned in
Chapter 3, systematically located farther away from civilizational borders, this
constitutes a problem for the confidence in the results in Table 1. In regards to
the interpretation of the result, this may imply that the size of the difference of
the mean distances may be imprecise. This is probably the major point of
contention against the robustness of the result. Nevertheless, since the
difference is so substantial (34% minimum difference), it is not that likely that
such an inaccuracy affects the significance of the results. Hence, the conclusion
remains: conflicts are located significantly closer to civilizational borders than
random locations in populated areas. This means that I find support for H1.
As already commented on, the result in Table 1 clearly shows that conflicts are
located closely along the civilizational borders. How should this result be
interpreted? First of all, the result indicates that cultural boundaries do affect
the location of conflicts. Where cultures meet, there is a higher propensity for
conflict. This suggests that previous research testing this theory has somehow
underestimated the significance of a civilizational variable (see 4.1.1). If we are
to apply Huntington’s explanation of this result, it is a support for the claim that
difference in cultural identity is among the primary causes of armed conflict.
However, I cannot judge from this analysis whether it truly is a “primary”
cause of armed conflict. For such an assessment I would have to add more
relevant control variables to the analysis. I will discuss this further in the
context of results from similar attempts to test the general validity of
Huntington’s theory.
11 For results using the alternative set of units for the test in Table 1, see Appendix 6 and discussion in Chapter 3.
58
4.1.1 Comparing the Results
The results in Table 1 are derived from a new methodological approach
compared to previous attempts to test Huntington’s theory. The result that
civilizational borders constitute a significant determinant of armed conflict
1979-2000 seems clear. The analysis does not, however, include relevant
control variables in a multivariate analysis, like Russett et al. (2000) and
Henderson & Tucker (2001) do. (See presentation of this research in Chapters 2
and 3). Nevertheless, the result is comparable to bivariate correlations. A
control variable inherent in my analysis is the “contiguity” variable, the same
as used by Russett et al. (2000). I do not allow for civilizational borders to
exceed more than 150 miles of sea. With this same approach, it is interesting to
review the result Russet et al. (2000) reach when measuring the propensity for
civilizations “ceteris paribus” to fight each other (MIDs) when controlling for
contiguity (period 1950-92). Russett et al. (2000: 594, Table 1) find a positive,
but not significant, correlation between mixed civilizations and the propensity
for militarized interstate disputes. However, contiguity is strongly correlated
with the dependent variable. They also demonstrate the non-significance of the
civilizational variable when expanding the analysis to include control variables
expressing “realist” and “liberal” assumptions.
Henderson & Tucker (2001) have a very similar analysis. However, they
do not include their control variables one by one. Instead, they show that their
civilizational variable (also pairs of mixed civilizations) alone is negatively,
and significantly, correlated with the propensity for war, i.e. the opposite of
what Huntington claims (Henderson & Tucker 2001: 329, Table 1). Their
contiguity variable (distance) is measured slightly differently, but they do not
include it as a control variable when measuring the effect from their
“civilizational variable”. On this background, their result (an opposite
civilizational effect) is not surprising at all. The contiguity variable is known to
correlate strongly with the propensity for war in dyadic analyses. Without this
control variable, the analysis is not much worth. It simply shows that, on
59
average, two states from different civilizations are distantly located from one
another (e.g. Senegal and China) and will, thus, not likely be at war. Whereas
two states from the same civilization (e.g. Iran and Iraq, and other Muslim
states) are more prone to be at war with each other since they, on average, are
located relatively close to each other. This kind of test does neither prove, nor
disprove, Huntington’s argument. It is simply irrelevant to this theory12.
Since the initial tests of Henderson & Tucker (2001), as argued, make
little sense without including the contiguity variable, I choose to compare my
findings with the results of Russett et al. (2000). They have, correctly, added
the contiguity variable when analyzing the effect from their civilizational
variable. Also, they show the effect when adding one control variable at a time.
What do their result express (as opposed to my results)? They find for the
period 1950-92, when controlling only for contiguity, that states of different
civilizations have a higher propensity for militarized interstate disputes;
however, this correlation is not significant by far. The non-significance of this
relationship, however, even Huntington would most likely acknowledge. For
this indicator to be significant, we would have to experience major
civilizational alliances and wars on the international arena (which Huntington
regards as the extreme consequence of his theory). For testing this specific part
of Huntington’s theory, the indicator of Russett et al. (2000) is appropriate.
What Russett et al. (2000) do not measure is Huntington’s claim that
conflicts will have a more evident cultural dimension in the new era. In order to
measure the relevance of this dimension, one ought to concentrate on whether
such interstate disputes occur along cultural cleavages, either at an abstract
level, or physically along the civilizational borderlines. This challenge could be
met by measuring how many miles of a country’s border follow a civilizational
border, or whether a country is divided by a civilizational border (however, this
is quite problematic to measure, see 6.2). Another weakness of the Russett et al.
(2000) research design is the single focus on interstate war. This should be
12 The “distance” variable is absent from the dataset of Henderson & Tucker (2001) at http://www.vanderbilt.edu/~rtucker/data/clash/. This makes it hard for me to replicate their work,
60
addressed by expanding the analysis to include all sorts of armed conflicts, not
only the small proportion of conflicts that are interstate militarized disputes.
Huntington stresses the fact that the majority of civilizational conflicts are fault
line wars at a micro level, most commonly civil wars (Huntington 1996: 252-
254). Last, as Russett et al. (2000) also are aware of, they do not have sufficient
recent data to generalize about the post-Cold War era.
In effect, the deficiencies commented on above justify my
methodological approach. I include all types of conflict, I include recent data
from the post-Cold War era, and I look at the actual locations of conflicts in
relation to civilizational borders – a more appropriate, direct, and more accurate
measure to testing Huntington’s overall claim. As control variables, I include a
demographic measure (the cities-variable), and a contiguity variable, similar to
the one Russett et al. (2000) use, is inherent in the measurement of
civilizational borderlines. Hence, the results of Russett et al. (2000) and
Henderson & Tucker (2001) must be interpreted on this background. If they
had applied a more appropriate method for testing Huntington’s propositions,
they would probably also have gotten results similar to mine. However, since
the approach I am using has not been tried out before, there are no measured
control variables available that suit this kind of analysis. I have demonstrated
the relevance of a civilizational variable to the pattern of conflict, but this
relationship has yet to be subjected to multivariate analysis with additional
relevant control variables. It is natural to measure control variables that express
the same features as the control variables used by Russett et al. (2000) and
Henderson & Tucker (2001), e.g. the level of democracy, and socio-economic
conditions. Such an analysis will reveal the actual relevance of a civilizational
factor in relation to other factors that are known to correlate with conflict.
Since it is too time-consuming to generate control variables for the analysis in
this thesis, I will compensate by looking at the relevance of control variables in
the case study in Chapter 5.
including the “distance” variable that they themselves fail to include, although it is appropriate to do so.
61
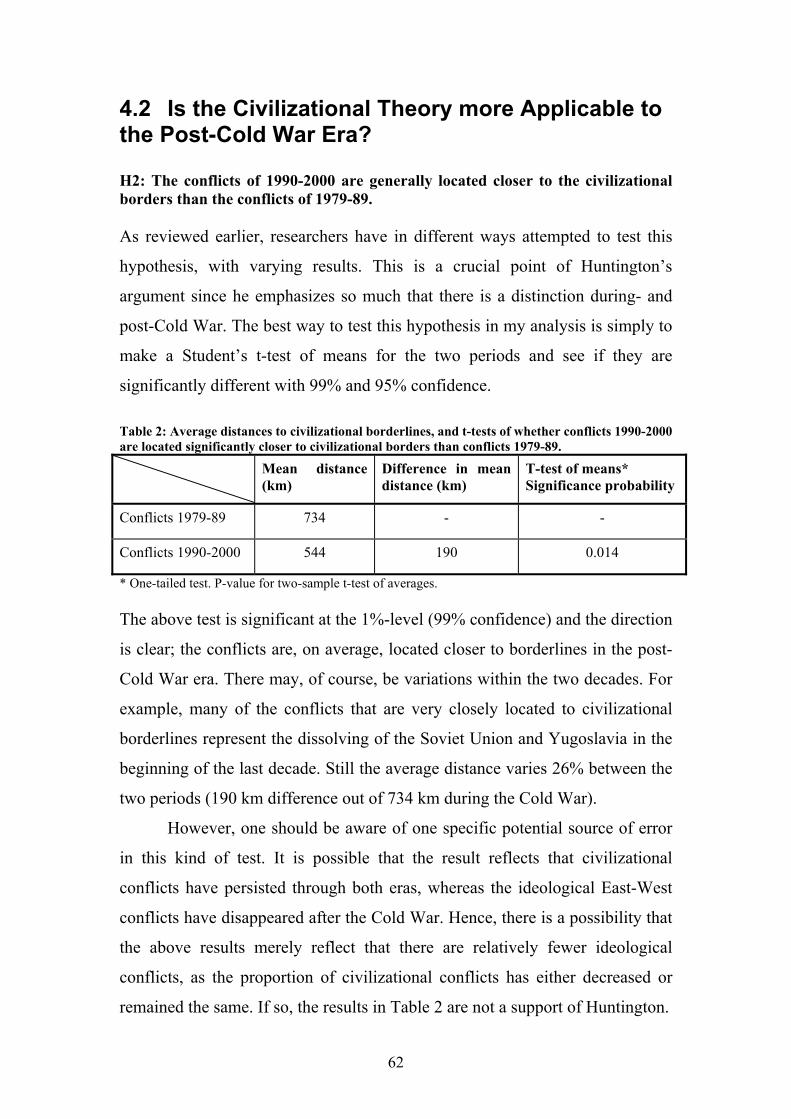
4.2 Is the Civilizational Theory more Applicable to the Post-Cold War Era?
H2: The conflicts of 1990-2000 are generally located closer to the civilizational borders than the conflicts of 1979-89. As reviewed earlier, researchers have in different ways attempted to test this
hypothesis, with varying results. This is a crucial point of Huntington’s
argument since he emphasizes so much that there is a distinction during- and
post-Cold War. The best way to test this hypothesis in my analysis is simply to
make a Student’s t-test of means for the two periods and see if they are
significantly different with 99% and 95% confidence.
Table 2: Average distances to civilizational borderlines, and t-tests of whether conflicts 1990-2000 are located significantly closer to civilizational borders than conflicts 1979-89.
Mean distance (km)
Difference in mean distance (km)
T-test of means* Significance probability
Conflicts 1979-89 734 - -
Conflicts 1990-2000 544 190 0.014
* One-tailed test. P-value for two-sample t-test of averages. The above test is significant at the 1%-level (99% confidence) and the direction
is clear; the conflicts are, on average, located closer to borderlines in the post-
Cold War era. There may, of course, be variations within the two decades. For
example, many of the conflicts that are very closely located to civilizational
borderlines represent the dissolving of the Soviet Union and Yugoslavia in the
beginning of the last decade. Still the average distance varies 26% between the
two periods (190 km difference out of 734 km during the Cold War).
However, one should be aware of one specific potential source of error
in this kind of test. It is possible that the result reflects that civilizational
conflicts have persisted through both eras, whereas the ideological East-West
conflicts have disappeared after the Cold War. Hence, there is a possibility that
the above results merely reflect that there are relatively fewer ideological
conflicts, as the proportion of civilizational conflicts has either decreased or
remained the same. If so, the results in Table 2 are not a support of Huntington.
62
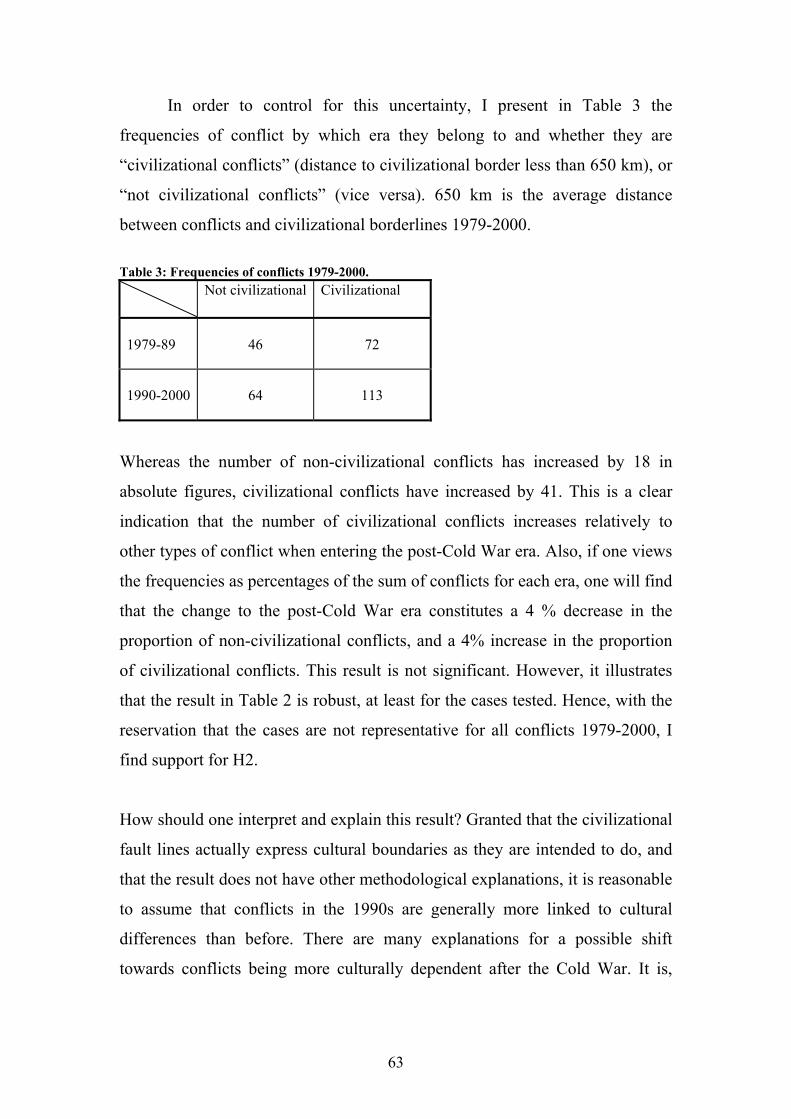
In order to control for this uncertainty, I present in Table 3 the
frequencies of conflict by which era they belong to and whether they are
“civilizational conflicts” (distance to civilizational border less than 650 km), or
“not civilizational conflicts” (vice versa). 650 km is the average distance
between conflicts and civilizational borderlines 1979-2000.
Table 3: Frequencies of conflicts 1979-2000. Not civilizational
Civilizational
1979-89
46
72
1990-2000
64
113
Whereas the number of non-civilizational conflicts has increased by 18 in
absolute figures, civilizational conflicts have increased by 41. This is a clear
indication that the number of civilizational conflicts increases relatively to
other types of conflict when entering the post-Cold War era. Also, if one views
the frequencies as percentages of the sum of conflicts for each era, one will find
that the change to the post-Cold War era constitutes a 4 % decrease in the
proportion of non-civilizational conflicts, and a 4% increase in the proportion
of civilizational conflicts. This result is not significant. However, it illustrates
that the result in Table 2 is robust, at least for the cases tested. Hence, with the
reservation that the cases are not representative for all conflicts 1979-2000, I
find support for H2.
How should one interpret and explain this result? Granted that the civilizational
fault lines actually express cultural boundaries as they are intended to do, and
that the result does not have other methodological explanations, it is reasonable
to assume that conflicts in the 1990s are generally more linked to cultural
differences than before. There are many explanations for a possible shift
towards conflicts being more culturally dependent after the Cold War. It is,
63
however, most natural to apply Huntington’s explanation, since the hypothesis,
which has been strengthened, is derived from the civilizational theory.
Huntington’s explanation of the empirical findings would be that
cultural difference in identity is the primary cause of armed conflict in the post-
Cold War era, and perhaps a secondary factor during the Cold War period. The
underlying rationale for this assessment is that at the individual level there has
been a change in identity following the end of the Cold War. People ask
themselves who they are. Civilization is an expression of the broadest cultural
affinity, which, following the end of the Cold War, has an increased impact on
shaping world politics, determining war and peace. For Eastern and Central
Europe the civilizational concept may be quite applicable. When the Soviet
Union dissolved it was like removing a “lid” under which different ethnic
groups were forced to live under one system, often without any representation
for their interests. When this lid was removed, the various groups claimed their
historical “rights” over territory and rights to political representation13. Without
the sudden collapse of the East-West bi-polarity structure, events would
probably have been very different.
In the following, I will concentrate on the period 1990-2000,
representing the post-Cold War era, since this is the era for which Huntington
expects his theory to be valid.
4.3 Fault Line Wars – Bloodier and over Territory?
H3: The closer a conflict is located to a civilizational border, the more likely the conflict has a high number of battle deaths. H4: The closer a conflict is located to a civilizational border, the more likely the conflict is over territory.
13 See the “Pressure Cooker” conceptualization by Mearsheimer (1990).
64
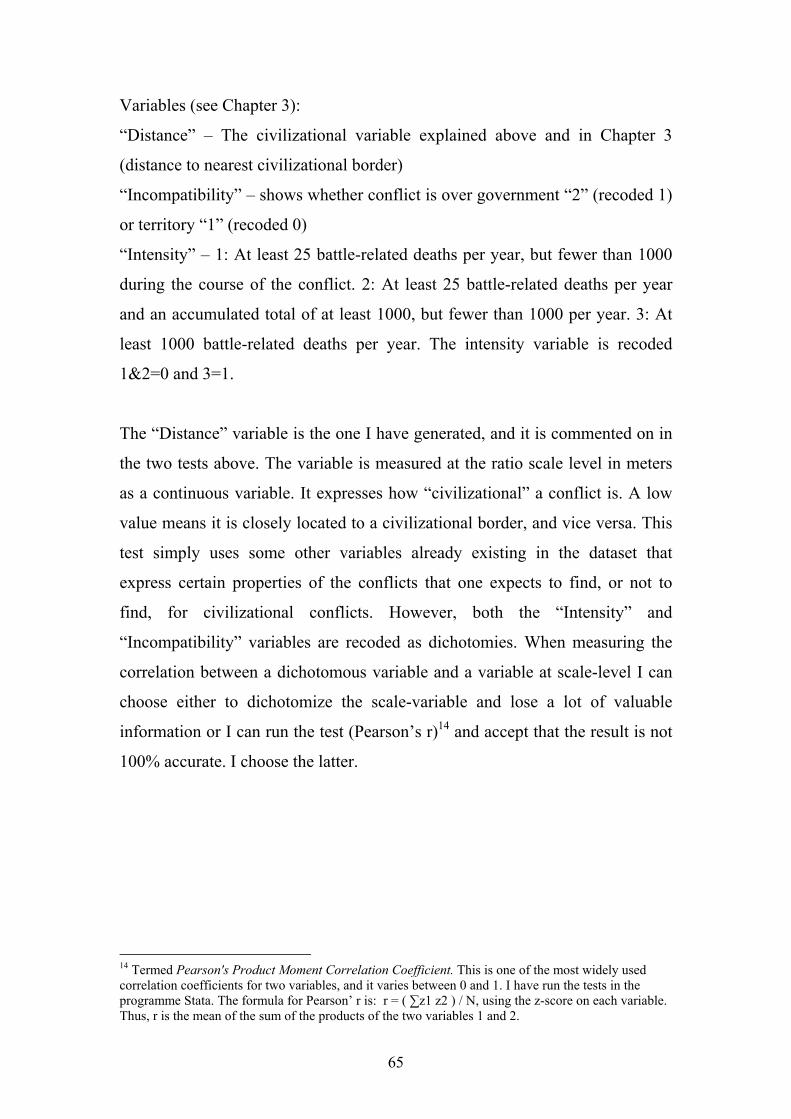
Variables (see Chapter 3):
“Distance” – The civilizational variable explained above and in Chapter 3
(distance to nearest civilizational border)
“Incompatibility” – shows whether conflict is over government “2” (recoded 1)
or territory “1” (recoded 0)
“Intensity” – 1: At least 25 battle-related deaths per year, but fewer than 1000
during the course of the conflict. 2: At least 25 battle-related deaths per year
and an accumulated total of at least 1000, but fewer than 1000 per year. 3: At
least 1000 battle-related deaths per year. The intensity variable is recoded
1&2=0 and 3=1.
The “Distance” variable is the one I have generated, and it is commented on in
the two tests above. The variable is measured at the ratio scale level in meters
as a continuous variable. It expresses how “civilizational” a conflict is. A low
value means it is closely located to a civilizational border, and vice versa. This
test simply uses some other variables already existing in the dataset that
express certain properties of the conflicts that one expects to find, or not to
find, for civilizational conflicts. However, both the “Intensity” and
“Incompatibility” variables are recoded as dichotomies. When measuring the
correlation between a dichotomous variable and a variable at scale-level I can
choose either to dichotomize the scale-variable and lose a lot of valuable
information or I can run the test (Pearson’s r)14 and accept that the result is not
100% accurate. I choose the latter.
14 Termed Pearson's Product Moment Correlation Coefficient. This is one of the most widely used correlation coefficients for two variables, and it varies between 0 and 1. I have run the tests in the programme Stata. The formula for Pearson’ r is: r = ( ∑z1 z2 ) / N, using the z-score on each variable. Thus, r is the mean of the sum of the products of the two variables 1 and 2.
65
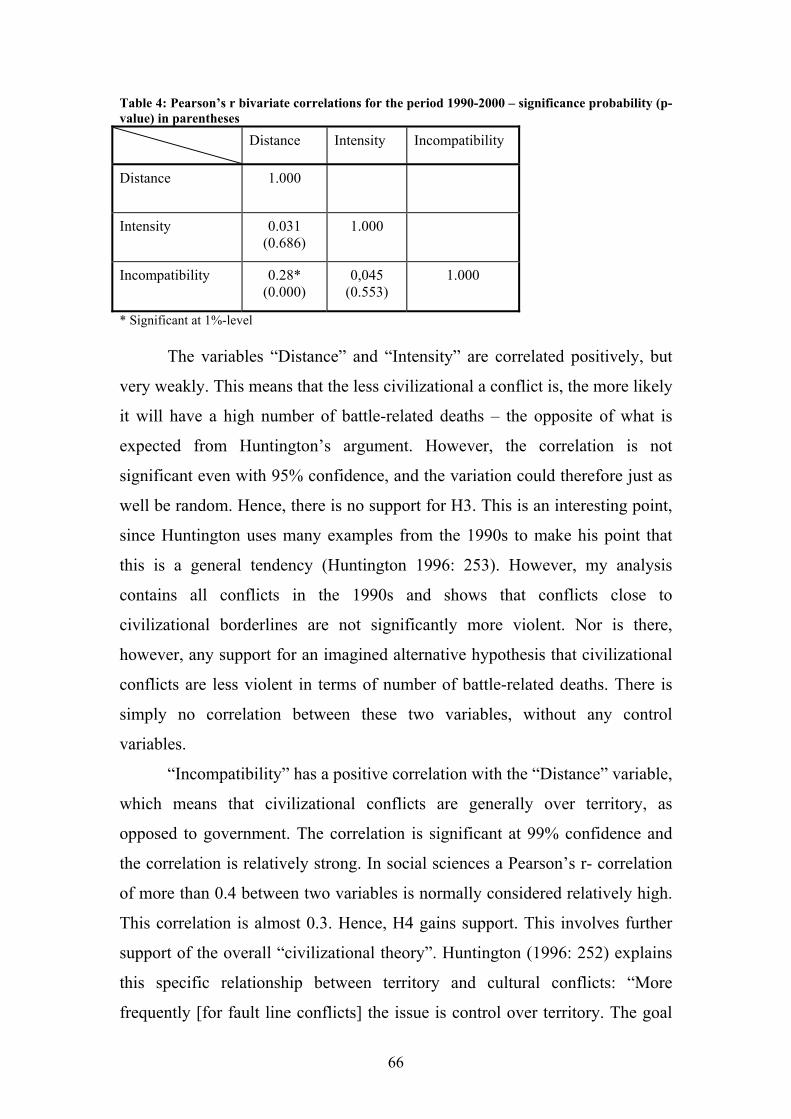
Table 4: Pearson’s r bivariate correlations for the period 1990-2000 – significance probability (p-value) in parentheses
Distance Intensity Incompatibility
Distance 1.000
Intensity 0.031 (0.686)
1.000
Incompatibility 0.28* (0.000)
0,045 (0.553)
1.000
* Significant at 1%-level
The variables “Distance” and “Intensity” are correlated positively, but
very weakly. This means that the less civilizational a conflict is, the more likely
it will have a high number of battle-related deaths – the opposite of what is
expected from Huntington’s argument. However, the correlation is not
significant even with 95% confidence, and the variation could therefore just as
well be random. Hence, there is no support for H3. This is an interesting point,
since Huntington uses many examples from the 1990s to make his point that
this is a general tendency (Huntington 1996: 253). However, my analysis
contains all conflicts in the 1990s and shows that conflicts close to
civilizational borderlines are not significantly more violent. Nor is there,
however, any support for an imagined alternative hypothesis that civilizational
conflicts are less violent in terms of number of battle-related deaths. There is
simply no correlation between these two variables, without any control
variables.
“Incompatibility” has a positive correlation with the “Distance” variable,
which means that civilizational conflicts are generally over territory, as
opposed to government. The correlation is significant at 99% confidence and
the correlation is relatively strong. In social sciences a Pearson’s r- correlation
of more than 0.4 between two variables is normally considered relatively high.
This correlation is almost 0.3. Hence, H4 gains support. This involves further
support of the overall “civilizational theory”. Huntington (1996: 252) explains
this specific relationship between territory and cultural conflicts: “More
frequently [for fault line conflicts] the issue is control over territory. The goal
66

of at least one of the participants is to conquer territory and free it of other
people by expelling them, killing them, or doing both, that is, by “ethnic
cleansing” […] The territory at stake often is for one or both sides a highly
charged symbol of their history and identity, sacred land to which they have an
inviolable right: The West Bank, Kashmir, Nagorno-Karabakh, the Drina
Valley, Kosovo.”
4.4 Is the Civilizational Theory only Significant for Civil Wars?
H5: Intrastate wars are generally closer located to the civilizational borders than interstate and internationalized civil wars. The variable “Type”: 1 = extra-systemic conflict; does not exist in this sample, 2 = interstate conflict, 3 = intrastate conflict, and 4 = internationalized intrastate conflict (see Chapter 3). I have recoded: 4&2=0, 3=1.
The Pearson’s r correlation between “Type” and “Distance” has a positive
coefficient of 0.033. The variables are positively correlated, which means that
intrastate wars are less civilizational (they are located further away from
civilizational borders). The result, however, is not significant – hence not valid.
The fact that it is not significant is interesting. For a long time, scholars have
tended to study the various types of conflict separately. This result may indicate
that, at least when it comes to variables expressing the meaning of cultural
dissimilarity in relation to conflict, it is not so far-fetched to analyze them
concurrently.
67
4.5 Civilizations and their Clashes
H6: Certain civilizations and certain pairs of civilizations are more
conflict-prone than others.
H6A: The Western civilization is more than averagely exposed to conflict.
H6B: The Muslim civilization is more than averagely exposed to conflict.
H6C: The Buddhist civilization is less than averagely exposed to conflict.
H6D: The Western and Muslim civilizations are particularly prone to fight
each other.
The technique for generating results relevant to these hypotheses is briefly
described in Chapter 3. A repetition may be useful before commenting on the
results. For each conflict I have information that tells which civilizational
borderline is the closest. This allows me to sum up all conflicts that are related
to one “clash”, for each of the various borderlines. Hence, I get the number of
conflicts attached to each borderline (each clash), and to each civilization. This
information on the actual distribution of conflicts along each of the borderlines
is interesting only when compared to a random distribution. I obtain a random
distribution by dividing the length of a borderline by the total length of all
borderlines. I then multiply that fraction with the total number of conflicts.
More precisely, this procedure gives me a distribution as if conflicts were
equally distributed along the borderlines. This expresses a situation in which
there is no variance among the borderlines in propensity for conflict. The
difference between this distribution and the actual distribution holds interesting
results that are clearly relevant to the hypotheses above. A big difference,
negative or positive, is an indication of a more or less war prone civilizational
border. Values around 0 indicate average. It is important to notice that since I
use observations as units for conflict, the differences will be greater than if I
had applied the other set of units (see Chapter 3).
68
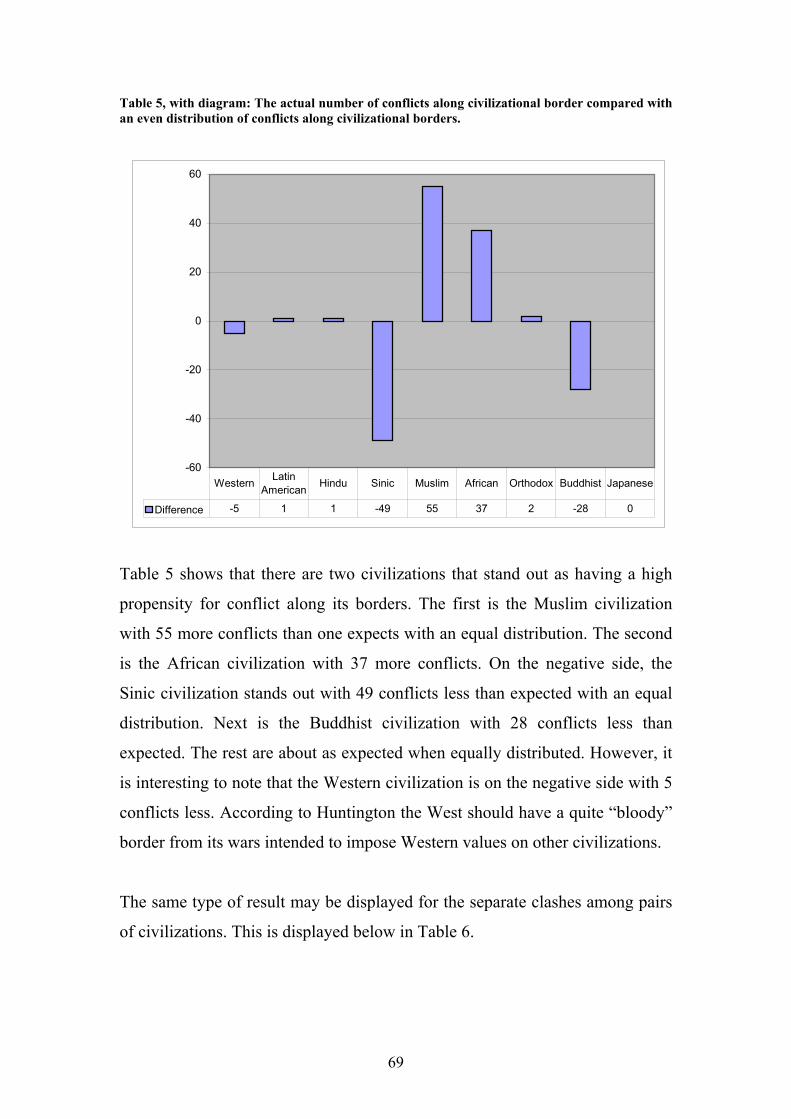
Table 5, with diagram: The actual number of conflicts along civilizational border compared with an even distribution of conflicts along civilizational borders.
-60
-40
-20
0
20
40
60
Difference -5 1 1 -49 55 37 2 -28 0
Western Latin American Hindu Sinic Muslim African Orthodox Buddhist Japanese
Table 5 shows that there are two civilizations that stand out as having a high
propensity for conflict along its borders. The first is the Muslim civilization
with 55 more conflicts than one expects with an equal distribution. The second
is the African civilization with 37 more conflicts. On the negative side, the
Sinic civilization stands out with 49 conflicts less than expected with an equal
distribution. Next is the Buddhist civilization with 28 conflicts less than
expected. The rest are about as expected when equally distributed. However, it
is interesting to note that the Western civilization is on the negative side with 5
conflicts less. According to Huntington the West should have a quite “bloody”
border from its wars intended to impose Western values on other civilizations.
The same type of result may be displayed for the separate clashes among pairs
of civilizations. This is displayed below in Table 6.
69
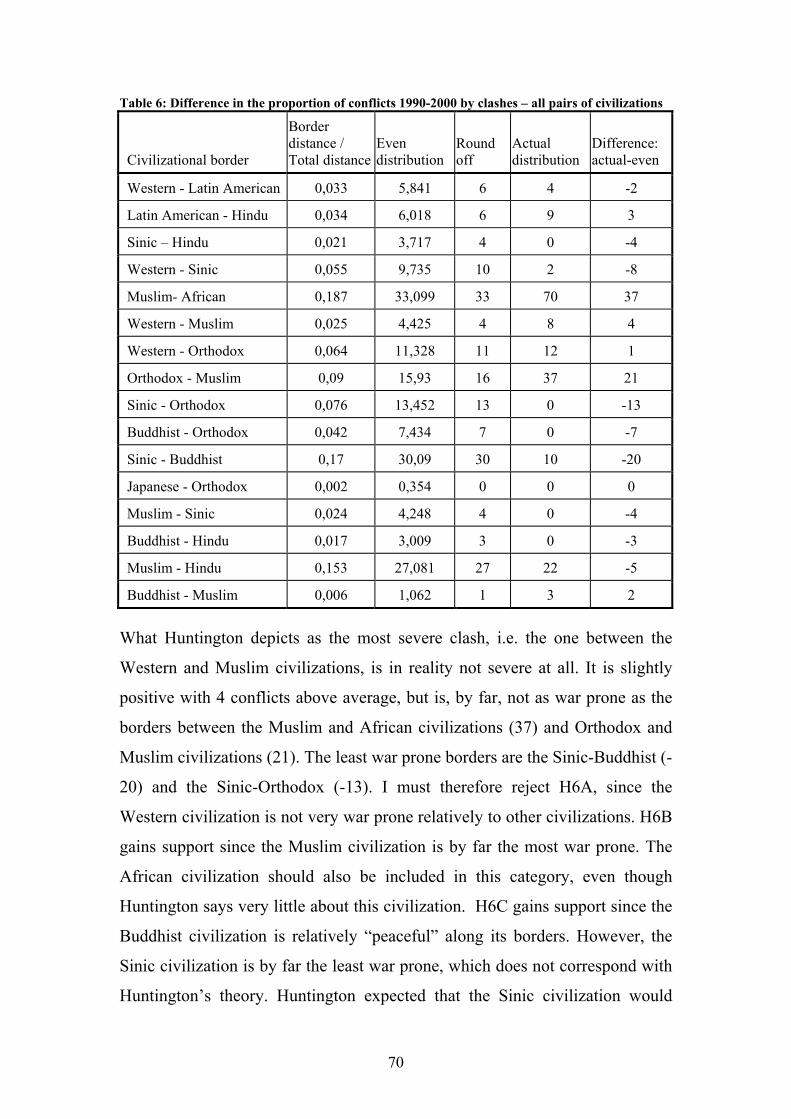
Table 6: Difference in the proportion of conflicts 1990-2000 by clashes – all pairs of civilizations
Civilizational border
Border distance / Total distance
Even distribution
Round off
Actual distribution
Difference: actual-even
Western - Latin American 0,033 5,841 6 4 -2
Latin American - Hindu 0,034 6,018 6 9 3
Sinic – Hindu 0,021 3,717 4 0 -4
Western - Sinic 0,055 9,735 10 2 -8
Muslim- African 0,187 33,099 33 70 37
Western - Muslim 0,025 4,425 4 8 4
Western - Orthodox 0,064 11,328 11 12 1
Orthodox - Muslim 0,09 15,93 16 37 21
Sinic - Orthodox 0,076 13,452 13 0 -13
Buddhist - Orthodox 0,042 7,434 7 0 -7
Sinic - Buddhist 0,17 30,09 30 10 -20
Japanese - Orthodox 0,002 0,354 0 0 0
Muslim - Sinic 0,024 4,248 4 0 -4
Buddhist - Hindu 0,017 3,009 3 0 -3
Muslim - Hindu 0,153 27,081 27 22 -5
Buddhist - Muslim 0,006 1,062 1 3 2
What Huntington depicts as the most severe clash, i.e. the one between the
Western and Muslim civilizations, is in reality not severe at all. It is slightly
positive with 4 conflicts above average, but is, by far, not as war prone as the
borders between the Muslim and African civilizations (37) and Orthodox and
Muslim civilizations (21). The least war prone borders are the Sinic-Buddhist (-
20) and the Sinic-Orthodox (-13). I must therefore reject H6A, since the
Western civilization is not very war prone relatively to other civilizations. H6B
gains support since the Muslim civilization is by far the most war prone. The
African civilization should also be included in this category, even though
Huntington says very little about this civilization. H6C gains support since the
Buddhist civilization is relatively “peaceful” along its borders. However, the
Sinic civilization is by far the least war prone, which does not correspond with
Huntington’s theory. Huntington expected that the Sinic civilization would
70
form alliances with other civilizations against the Western civilization, and it
would, thus, be relatively war prone. H6D is false. Although the Muslim and
Western civilizations have a few more conflicts than expected (see Table 6),
this clash is, by far, not the most severe and conflict prone among clashes of
civilizations. Instead, the most conflict prone clashes are between the Muslim
civilization on one hand and the African and Orthodox on the other.
4.5.1 Interpreting the Results – Islam’s Bloody Borders
What can one make out of reading these results? At best, 50% of Huntington’s
predictions are correct, 50 % are wrong. If his theory were to be considered
valid, the score would have to be much better. Hence, H6 gains no support.
Huntington is right in assuming that certain civilizations are more exposed to
conflict than others, but his assessment of the variation among the specific
civilizations is not in accordance with the result. In this case, it is natural to
look at other explanatory factors for this result than Huntington’s “realpolitik
among civilizations” explanation. It is clear that the propensity for conflict does
change when controlling for different civilizations. What (other) factors may
explain this phenomenon? There are numerous approaches to answering this
question. I will at this point only suggest some angles from which to theorize
about this phenomenon. First, let us assume that the civilizational borderlines
do express actual cultural boundaries. Let us also assume that it is not just a
failure in the analysis of inter-civilizational relations that causes the non-
correspondence between theory and the results, but that other explanations
must be applied in order to understand the variations. The results show, for
instance, that the Muslim civilization is most prone to conflict. One explanation
for this, which also Huntington has stressed in Newsweek (12/2001), is
demographic. Areas of the world with so-called youth bulges in their
population may be more prone to conflict than other areas (For a recent
empirical study of this argument, see Urdal (2002)). A youth bulge is a large
youth cohort (caused by a rapid decline in infant mortality about 20 years in
71
advance). Huntington (2001) believes that Islam’s “bloody borders” can be
explained partly by the huge youth bulges currently experienced in Middle
Eastern countries. Zakaria (2001: 25) claims: “The Arab world has a problem
with its Attas in more than one sense. Globalisation has caught it in a bad
demographic moment. Arab societies are going through a massive youth bulge,
with more than half of most countries’ populations under the age of 25.”
A different explanation points at socio-economic factors, such as
economic deprivation (often measured by movement in GNP/capita) and non-
democratic regimes, both correlating with a high propensity for conflict. These
explanations would probably fit even better for the African civilization,
although the Middle East scores low on such indicators as well. Despite the oil
revenues of many Middle Eastern countries and attempts to introduce
democratic reform some places, socio-economic explanations may still be
fruitful for explaining the variation compared to other civilizations – perhaps
more so than focusing merely on cultural factors such as religion. However,
socio-economic explanations and cultural explanations cannot be seen entirely
separately in this case. Perhaps religion and cultural factors affect
democratization, which again affects the likelihood of conflict. Kedourie
(1994) claims that the idea of democracy is quite alien to the mind-set of Islam.
The relationship between Islam and democracy turns out to be rather intricate
when more relevant factors are included15. One aspect is that the Arab
societies have not yet developed a large and influential middle class, a factor
that Moore (1966) holds to be essential for the promotion of democracy.
Regarding religion as an obstacle to democracy may seem politically incorrect,
but it is in fact not far from the argument Rokkan (1987) made about what he
called “nation building” in Western Europe. Rokkan created a model for
explaining both how democracy was developed in the various Western states,
and at what pace representative democracy was developed. In his model,
religion is an important background variable. He distinguished between
whether the population was catholic, protestant or mixed. Rokkan claimed that
72
this variation was essential, among other factors, in explaining constraints in
developing democracy, as we know it today. Analogically, Islam, in its various
forms across the Arab world, may explain why the development towards
democracy has experienced so many constraints in the Middle East.
Economically speaking, some Middle Eastern countries have suffered
severely from being rentier-states (see e.g. Ross 2001). Most countries with
considerable oil revenues have become very dependent on their petroleum
sector and have failed to distribute that wealth among all layers of the
population. On the other side, there are also states in the “Muslim world” that
are not that dependent on the oil sector, e.g. Indonesia and Malaysia. Some
explanations of Islamic fundamentalism suggest that the underlying root causes
lie in deep disparities between rich and poor within societies, buttressed by the
pervasive inequalities in political power in Middle Eastern regimes (Chirot
2001). Although it may be argued that the high propensity for conflict is in part
due to a low economic level and democracy deficit in this region, the question
remains: What came first? Economic deprivation and political instability, or did
a clash of civilizations occur prior in time causing the socio-economic
problems?
Through studies of Islam, Roy (1994) provides new perspectives on
religious factors as a cause of conflict. He distinguishes between, on the one
hand, Islam as a world religion, and, on the other hand, “Islamism” as a
combative nationalistic ideology within various states. One group is identified
and labeled (radical) “neo-fundamentalists”. It is this third group that,
allegedly, is most combative and plays an active part in many conflicts. Neo-
fundamentalists do not aim to establish an Islamic state within a certain
territory, according to Roy. Unlike Islamism, they disregard the notion of a
“state” as a notion imported from the enemy – the West. Their objective is
rather to fight for “Ummah”, an Islamic world. Therefore, the neo-
fundamentalists fight for Islam in the “de-territorialized” outskirts of Islam, like
Bosnia, Chechnya, Afghanistan and the Philippines. This may also be one
15 See Esposito (1992, 1996), Midlarsky (1998), Jurgensmeyer (1993), among others.
73
explanation of why the Muslim civilization has relatively many conflicts going
along its borders. There is an ever-stronger network of neo-fundamentalists
playing an active part on the side of Muslims living in a given conflict area. In
addition, these elements may play a role of polarizing and radicalizing the
relationship between Muslims and other cultural groups in a potential conflict
area.
4.5.2 On the Sinic and Buddhist Civilizations
On the other hand, it may be just as challenging to explain why the Sinic
civilization is the most peaceful in the 1990s. Why is there a relative absence of
conflicts in this area? One explanation is, naturally, that much of this area is
just one country – China. Hence, it may be fruitful to apply analyses of China
as a country. Although China may emerge as a civilization, there are also
signals that it may not. China is still in the making politically, and the
legitimacy of the current government rests on month-to-month economic
performance (Thorheim 2000). If the economic development makes a
downward turn, the situation and prospects of China as an emerging
civilization may soon be fading. So far, China has been able to handle, or at
least put a lid on, the many potential conflicts that lure in this vast country and
population. The ruling government is very aware of the need to keep the
economic fright-train rolling, and therefore it is not in the country’s interest to
get involved in armed conflict internally with the many ethnic minorities in the
North and North-West, religious movements like the Falun Gong, a workers’
union that is growing stronger outside government control, or, externally, over
Tibet, Taiwan or the borderlines with India.
A second reason for this result is that the Sinic civilization shares
borders mostly with the second most peaceful civilization – the Buddhist
civilization. The Buddhist civilization, according to Huntington, does not have
a strong cohesion and is divided into two separate practices of Buddhism, as
explained in Chapter 2. When comparing this relatively “peaceful” part of Asia
74
with Africa and the Middle East, one difference is the amount of transitional
regimes in the regions. Hegre et al. (2001) find that it is the not fully autocratic,
yet not quite democratic, regimes that are most prone to conflict. They suggest
that countries experiencing regime change/transitions are particularly exposed
to conflict. This accords with the situation in large parts of Africa, both
countries in the “Muslim North”, and the rest of the continent. Relatively many
African states have been transitional democracies during the past 10-20 years.
Many of these have previously been dictatorships, and are now striving for
their fragile democracy to prevail. Whereas in countries like China, Thailand,
South Korea and Singapore, the main emphasis has been on economic
liberalization, not so much political change.
In sum, this discussion has emphasized that, in accordance with the
results of H6 A-D, other explanations than Huntington’s inter-civilizational
power politics analysis may be just as applicable when attempting to explain
the variation in the propensity for conflict among civilizations. The results
show that the actual variations are not in accordance with Huntington’s
predictions. There are probably two reasons for this. First, the level of the
analysis is so high, that it is very difficult to point out which factors are
relevant. By this I mean that the analysis is based on generating and
accumulating processes from an individual level, above state level, to a
“civilizational level”. Phenomena on this level may have a very high number of
contributing factors. It is virtually impossible, at least with certainty, to identify
them, let alone to measure their relative impact. Second, Huntington does only
to a very limited extent take these other explanatory factors into account. It is a
weakness in Huntington’s argument that he focuses solely on one factor
without examining how it may inter-act with other factors in producing a
certain result. This is particularly problematic when other explanatory factors
are probably more applicable for this kind of analysis, as partly demonstrated in
the discussion above. These other explanatory factors may very well be better
suited to explain the variations among civilizations (H6 A-D). At least, it is
75
crucial to look at how a civilizational approach may constitute one factor in a
model of several inter-acting factors.
In this chapter, I have found support for Huntington’s overall claim, while I
have rejected other claims (see summary of findings in Table 7 in the
concluding Chapter 6). Through the discussion, I have emphasized that many
other factors, along with cultural factors, determine the nature of conflict. In the
next chapter, I will try to assess these factors with a qualitative approach. How
may these other factors inter-act with cultural factors to cause conflict? Hence,
what is the role of cultural dissimilarity as a cause of armed conflict?
76
5 A Qualitative Approach The purpose of this chapter is to address some of the methodological
challenges mentioned in Chapter 4, mainly the lack of control variables in the
analysis. The general finding of the quantitative analysis in Chapter 4 is that
cultural dissimilarity is significantly correlated with the pattern of conflict,
when controlling for the location of cities. Further, this result is even more
evident in the post-Cold War era. It is a support of Huntington’s overall
proposition; that in the post-Cold War era the primary cause of conflict is
cultural. In order to further test the validity of this proposition, I could measure
and add to the quantitative analysis relevant control variables and observe
whether the result remained evident. In the discussion of the findings, I
suggested several relevant control variables. However, this is too time-
consuming as a project for a master thesis. An alternative approach to further
testing the validity of Huntington’s theory is to investigate into the micro
foundations (Hovi & Rasch 1996) – an attempt to discover and explain
logically the mechanisms that produce the relationship posited in the
hypotheses H1 and H216. The procedure for this kind of analysis is to select
one, or a few, cases that follow the general tendency and inquire into the micro
foundations of what causes these conflicts. This will be conducted in two
stages.
In the first stage (5.1), as an introduction, I display the 10 conflict areas
in the post-Cold War era that are ranked as closest to civilizational borderlines
in the “distance” variable on Map 4 below. The purpose of this map is to
briefly discuss some cases that follow the general tendency. Precisely because
the quantitative analysis provided support for the overall claim of Huntington,
it will be interesting to apply a single-case approach to the central questions:
16 For a recent and similar approach to investigating into the micro foundations of a relationship, see Gates (2002).
77
Are these cases, in essence, civilizational conflicts? Are the cultural disputes
the primary cause of violence in these cases? The second stage (5.2 - 5 .7) is to
select one of these conflicts and go into a more profound discussion of the
same questions. For this I have chosen Bosnia. However, in the discussion on
the causes of war in Bosnia I will, in addition, address more specific questions:
Is the cultural factor (religion, ethnicity) the primary cause of this conflict?
What is the role of other causes? How do these causes inter-act, i.e. what are
the mechanisms, at a micro level, causing armed conflict in this “main-stream”
case of civilizational conflict?
5.1 The Top Ten Civilizational Conflicts
I have selected the ten conflicts that in the “distance” variable are located
closest to civilizational borders for the period 1990-2000, except for India17.
These conflicts are located almost exactly on the borderlines of the major
cultures, displayed on Map 4. Interestingly, these conflicts are also examples
that Huntington often uses. Among the ten, the war in Bosnia in the 1990s is
probably the most common example of a civilizational conflict used by
Huntington18. In this section, I will only briefly comment on the conflict areas
of Map 4, before going into a more profound discussion of the causes of the
conflict in Bosnia in section 5.2, and the rest of this chapter.
17 Since the conflicts in India all have value 0 m, there are many conflicts in India to be included in a top 10 ranking of minimum distance. As a limitation I choose to include only the conflict in Sri Lanka from this region, although this cannot compensate for letting out conflicts in India. The idea, however, is just to point out various areas of the world as examples from the variable where there is conflict very close to the civilizational borders. 18 (Huntington 1996: 28, 38, 64, 118, 126-27, 129, 138, 156, 176, 179, 184, 196, 212, 242, 251, 253-57, 261-64, 267, 269-72, 308).
78

Map 4: The 10 conflict areas 1990-2000 closest to civilizational borderlines. One of the conflict areas displayed above is the Balkans. This is an example
Huntington regularly refers to in order to show what he means by a
civilizational conflict. Historically, the Balkans is an area where Europe meets
the Orient and through which the great schism of 325 A.D. drew the borders
between the Roman and the Orthodox churches. Already before World War II
it was a war-exposed area, and some of the worst atrocities of World War II
were committed in the intense fighting between the Ustasha (radical Croats)
and the Chetnicks (radical Serbs). Throughout the Cold War, Yugoslavia
stayed peaceful, although its people were heavily suppressed by the Tito
regime. In 1991, after Slovenia had left Yugoslavia and Croatia tried to do the
same, the war broke out. This war was, to a large extent, focused on winning
territory to which the parties laid historical or ethnic/religious claim. In this
regard, it appears evident that the conflict may be labeled “cultural”, and it is
justifiably coded with a low value on the distance-variable.
79
The 1999 war in Kosovo clearly had an ethnic dimension since the
origin of the conflict was the disputes between the Kosovo-Albanians and the
Kosovo-Serb minority in Kosovo, which first gained real momentum in 1989.
NATO’s 78-day long air campaign probably had several agendas (Thorheim
2001), but in our context, the interesting point is that the West was intervening
in order to protect a Muslim population in Southern Yugoslavia from human
rights abuses committed by the Serbs. According to Huntington’s theory, the
West went in on the wrong side. Both in Kosovo and in Bosnia, the tendency is
that the Muslim population has been supported more than others by the
international efforts, which are mainly controlled by Western nations.
5.1.1 Orthodox-Muslim and Hindu-Muslim Clashes
Tajikistan has experienced three changes in government and a five-year civil
war since 1991, when it gained independence from the USSR. Moreover,
Tajikistan has had territorial disputes with Kyrgyzstan in the Fergana Valley on
the northern border. Although there is a 25% Uzbek population in Tajikistan
and some Muslim militant groups are based in the country, the vast majority
are Tajiks and Sunni Muslims (CIA World Fact Book, 2002), and the country
may be said to have a relatively high degree of cultural homogeneity compared
to neighboring areas. It is fair to say that the problems in Tajikistan before the
peace agreement in 1997 are not primarily of a cultural character; rather, it is
criminal and political violence in a country very early in its nation-building
process. Both Uzbekistan and Kyrgyzstan were annexed in the second half of
the 19th century by the Russians and gained independence in 1991. While
Uzbekistan is relatively homogeneous culturally and is concerned mostly with
insurgency from Islamic militants based in the region, Kyrgyzstan has
experienced much inter-ethnic violence. Russians make up 20% of the
population and about 75% are Muslim.
80
Kazakhstan19 is marked on the map, but has not been involved in
warfare against its neighbors. Apart from playing an important strategic role in
the region, Kazakhstan does not play a direct part in the military clashes that
involve Uzbekistan, Kyrgyzstan, and Tajikistan. Much of the fighting has taken
place in the Fergana valley. This valley is the granary of this region and has
repeatedly experienced ethnic cleansing. It is hard to tell what the primary
causes of this regional conflict are. It has many characteristics of a
civilizational conflict; the conflict in the valley was fought along ethnic lines
between Tajiks, Uzbeks, and Kyrgyz (www.IRINnews.org 3 Oct, 2002).
However, the conflict started after the collapse of the Soviet Union, perhaps as
a consequence of it. The violence may have been an indirect consequence of
economic deprivation. Moscow held back food supplies to this region already
around 1990 and the fertile Fergana valley became increasingly important for
feeding the surrounding countries’ populations. Also, territorial claims over the
valley may have been strategically important to profiting from oil pipelines
(www.rand.org/publications 2002; www.eia.doe.gov 2002).
As reviewed above, there are often other factors than cultural that seem to play
a role as well. However, it may be hard to find evidence that cultural
dissimilarity is not a primary factor causing the conflicts of e.g. Southern
Caucasus and Sri Lanka. Huntington argues forcefully: “In another Orthodox-
Muslim fault line war, the primary participants were the Armenians of the
Nagorno-Karabakh enclave and the government and people of Azerbaijan, with
the former fighting for independence from the latter. […] This war was the
latest episode in both the struggle going back centuries to those between the
Russian Empire and the Ottoman Empire for control of the Black Sea region
and the Caucasus, and the intense antagonism between Armenians and Turks
going back to the early twentieth-century massacres of the former by the
latter.” (Huntington 1996: 278).
19 Although Kazakhstan is marked as a conflict area, this does not mean that Kazakhstan has been involved in warfare. It is also puzzling that Huntington has not marked this country as Muslim on his
81
A similar fight for independence has been taking place in Sri Lanka. Sri
Lanka has a complex colonial history, and Ceylon, as it was called until 1972,
gained independence in 1948 from British colonial rule. The tensions between
the Buddhist Sinhalese majority and the Hindu Tamil separatists have erupted
in violence repeatedly, reaching a climax in the mid 1980s. The number of
casualties of this war is counted in thousands. Neighboring India experiences
many similar ethnic conflicts, among which the best known is the current crisis
in Kashmir. This area of the world is, like the Balkans and the Fergana valley, a
historic meeting place of various great cultures and civilizations. In earlier
times, this left them with wealth from trade (e.g. the Fergana valley used to be
an important part of the Silk Road, connecting Europe with Asia), but now it
seems this richness has become a burden.
5.1.2 Muslim-African Clashes
The African continent has had many, still lasting, conflicts in the 1990s (and
before). Huntington recognizes that Ethiopia could potentially be classified as a
civilization based on its historic heritage. Today, however, Ethiopia is not a
great power in Africa. The economic “motors” and leaders in broadcasting
African culture are countries like South Africa and Namibia in the South,
Kenya in the East; and Nigeria, and, to some extent, Niger and Senegal in the
West. Huntington draws a borderline between the “Muslim North” and the
“African South” right across the African continent. Conflicts of the 1990s that
are located very closely along this borderline include Somalia, Ethiopia and
Eritrea in the East, Chad in the central part, and Sierra Leone in the West.
In Somalia, the Siad Barre regime was ousted in January 1991: Turmoil,
factional fighting, and anarchy followed for nine years. The population in
Somalia is mostly Sunni Muslim, but the fighting in Somalia has generally
been among clans. This is evident since the grievances that underlie the conflict
extend back to the seizure of power by Siad, as an army general, in 1969.
map, despite all its characteristics of belonging to the Muslim civilization.
82
Although Siad’s “scientific socialism” had the aim of eradicating tribalism, he
was, at the same time, creating an inner circle based on his own clan and sub-
clan, while suppressing other clans, e.g. the southern Darod clan (Copson 1994:
49-53). Although it is a matter for debate whether clans may be labeled “ethnic
groups”, clans certainly constitute some kind of cultural identity. Thus,
although the civilizational border may act as a background cause to the conflict
through hindering a nation-building process, this conflict is not a typical
civilizational conflict where parties belong to a Muslim and a non-Muslim
faction. However, there is some cultural dimension to the conflict since it, to a
large extent, revolves around clans and clan alliances.
The term “civilizational conflict” probably applies better to the conflict
between Ethiopia and Eritrea. Both countries are religiously and ethnically
mixed. Eritrea has a long history of fighting for independence from Ethiopia,
and independence was attained with a referendum in 1993. In 1998, however, a
two-and-a-half-year border war with Eritrea erupted and lasted until December
2000. This war is perhaps not a clear-cut civilizational conflict, but it has many
of the relevant characteristics. Essentially, the struggle is about territory and the
strong cultural meaning attached to these territories. However, the strains e.g.
Ethiopia are facing internally are more of an ethnic character, not so much
religious (Copson 1994: 34). A conflict more directly affected by being
divided among the Muslim and African civilizations, it seems, is the conflict in
Chad, part of France’s African holdings until 1960. About half of Chad’s
population is Muslim, around a quarter is Christians and the last quarter is
indigenous beliefs (mostly animism). In addition, there are numerous ethnic
groups in Chad. 1990 saw the end of 30 years of ethnic warfare as well as
invasions from Libya. In 1998, however, a new rebellion broke out in northern
Chad, which continued to escalate throughout 2000. Currently, there are peace
initiatives in the country, but this peace remains very fragile.
A last example from the African continent is the West African state
Sierra Leone. Since independence from British colonial rule in 1961 there have
been five military coups. For the whole of the 1990s Sierra Leone has
83
experienced civil war. The atrocities attracted the world’s attention and the
peacekeeping force UNAMSIL was sent to Sierra Leone. Peace was finally
restored in 2002, marked by the peaceful conduct of multi-party elections.
Sierra Leone is also located on the borderline of the Muslim and African
civilization. It is mixed with about 60% Muslims and 30% Christians. There
are several ethnic groups in the country of which Mende, Temne and Limba are
the most numerous. The ethnic differences are parallel to the North-South
divide (Thorheim 2002). Interestingly, in this country, where all indicators say
that this conflict should be of a civilizational character, it is not. The conflict in
Sierra Leone does not involve religious divides between Muslims and
Christians, nor ethnic mobilization. Instead, the conflict is centered on issues
like mining resources and type of government.
Already in these introductory comments on various civilizational conflict areas
there are signs that not all these conflicts are merely “civilizational” by nature.
Although most of these conflicts have an essential cultural dimension, the
picture often seems to be more complex. The next project will be to study more
profoundly one particular case – Bosnia.
5.2 Introduction to Studying Bosnia
5.2.1 Methodology
I have chosen Bosnia for a more profound analysis, because Bosnia is a case
that clearly follows the general tendency of civilizational conflict.
Geographically, Bosnia is divided between three civilizations: the Orthodox,
the Western and the Muslim. Hence, this conflict scores a low value on the
civilizational variable in the analysis and is among the 10 conflict areas closest
to civilizational borderlines. Furthermore, Huntington claims that Bosnia is a
84
prime example of civilizational conflict; also, the war in Bosnia did not break
out until after the Cold War. Through investigating, in terms of a limited case
study, the mechanisms and background variables that caused this conflict, it
might become clearer whether, and how, the cultural divides in Bosnia were a
factor causing the tragic war 1992-1995. In addition to being a test of the
validity of the result from the quantitative analysis, this kind of case study
enriches us by providing more closeness to the matter studied, and more
understanding of the result and the mechanisms behind it. This is the strength
of combining quantitative and qualitative research.
When conducting this “shortened” case study, it is important to have in
mind the potential problems of reliability, briefly mentioned in Chapter 1. The
sources of information that I refer to in this chapter are all second-hand. They
are varied: from Bosnian epic literature, personal impressions, and
documentation by journalists, to more academic literature. I am aware of a
possible selection bias of literature. However, I also have first-hand experience
of Bosnia through working in the country for a year. In addition, I speak Serbo-
Croatian. This enabled me to communicate with Bosnians in ways that are not
possible through an interpreter. On the other hand, although I spoke to a large
number of people from all sides and specters of the community and heard their
stories, my personal experience may have biased my views. However, I tend to
believe that this first-hand experience is rather a “correction” to, and a way to
sort, the various literature and theories. Hopefully, I can combine the models
and literature into a closer description of what really caused the war in Bosnia.
5.2.2 Limitations
Before going into the discussion, I will make some comments about the
difficult limitation of discussing Bosnia separately from the rest of the Balkans
conflict(s). The most natural approach would be to study the causes of the
conflicts in the Balkans as a whole, since the conflicts are all more or less inter-
related. Without the prelude of Slovenia and Croatia claiming independence
85
from Yugoslavia, there is a possibility that the war in Bosnia had not taken
place. However, this is highly hypothetical. Certainly, the war in Bosnia cannot
be studied entirely separate from the events that occurred at the same time in
the neighboring countries. In this perspective, it would be more appropriate to
discuss the causes of the Balkan conflict. On the other side, the events in the
Balkans constitute a very wide scope of analysis with a large amount of
empirical material to select from and many various factors deciding the
outcome. Therefore, one reason to focus on Bosnia is the fact that Bosnia
provides a narrower scope. It is, thus, more eligible for an analysis of the micro
foundations of causes of (cultural) conflict. Secondly, this limits the empirical
data and factors causing the conflict. In this way, I can go to “the heart of the
matter” while having to control for fewer factors. Nevertheless, the limitation
of not seeing the Bosnia conflict entirely in the light of the rest of the Balkans
gives a somewhat biased analysis. This point is important to be aware of,
although I will, to some extent, try to include an “outside influence” factor in
the case study.
5.2.3 Background
After Tito’s death in 1980, Yugoslavia, still a one-party state, changed its
political system to an annually rotating presidency. Economic and political
matters were increasingly discussed along ethnic and nationalistic lines, whilst
the communist party never replied with other than the old slogans of
brotherhood and unity. In May 1991, a Croat was due to become the new
Yugoslav president under the scheme of rotation, but Serbia refused to accept
the change. This act shattered the last hopes for a solution through
constitutional means. In June, both Slovenia and Croatia proclaimed their
independence. Violent clashes in Slovenia ensued, involving the JNA
(Jugoslavna Narodna Armija – the Yugoslav People’s Army), but soon came to
an end. The war over territorial claims with newly proclaimed Croatia lasted
86
longer and claimed tens of thousands of lives. During 1992, the arena of open
war shifted from Croatia to Bosnia, a province split along ethnic lines.
In a plebiscite early March 1992, a majority of Bosnians voted for
independence, but the vote was split along ethnic lines, with most Serbs
opposing such a step. Many Serbs left cities like Sarajevo, and a Bosnian Serb
parliament was established. In April 1992, Bosnian Serb forces initiated a
methodical effort to seize control of as much territory as possible, especially in
the eastern part of Bosnia, as a step towards a possible union with Serbia. This
was the period in which “ethnic cleansing” became widespread, including the
extensive use of rape and the creation of concentration camps to hold Muslim
men (Mønnesland 1995). After this initial Bosnian Serb “raid” for territory, the
Muslims and the Bosnian Croats embarked on fighting over territories in
western parts of Bosnia. This “second war” started when the Bosnian Croats
shifted their alliance from the Muslims to the Bosnian Serbs. The fighting,
especially in places like Mostar, is reported to have been just as horrifying as
the initial Serb “ethnic raid”. The persistence of these reports led to escalating
commitment by the UN and numerous efforts of peace negotiations,
culminating in pledges to use NATO forces as an instrument to stop the war.
The war in Bosnia was fought along ethnic lines, which means that the war
affected nearly every town in the country. All the greater cities, with the
exception of Tuzla, experienced heavy fighting. The Bosnian Serb siege of
Sarajevo and the Bosnian Croat siege of Mostar were especially bloody. The
atrocities in Srebrenica and the ineffectiveness of UN troops attracted the
world’s attention and called for interventionist international action. The
summer of 1995 saw the climax of the civil war in Bosnia, when the warring
parties explored their options after the UN had lost all control of the events.
When the Dayton Peace Accords were signed the same year, the war had
claimed more than 250,000 lives out of a pre-war Bosnian population of 4.4
million, more than half of whom had become refugees. With the deployment of
NATO troops in accordance with the Dayton agreement, peace was effectively
restored in Bosnia.
87
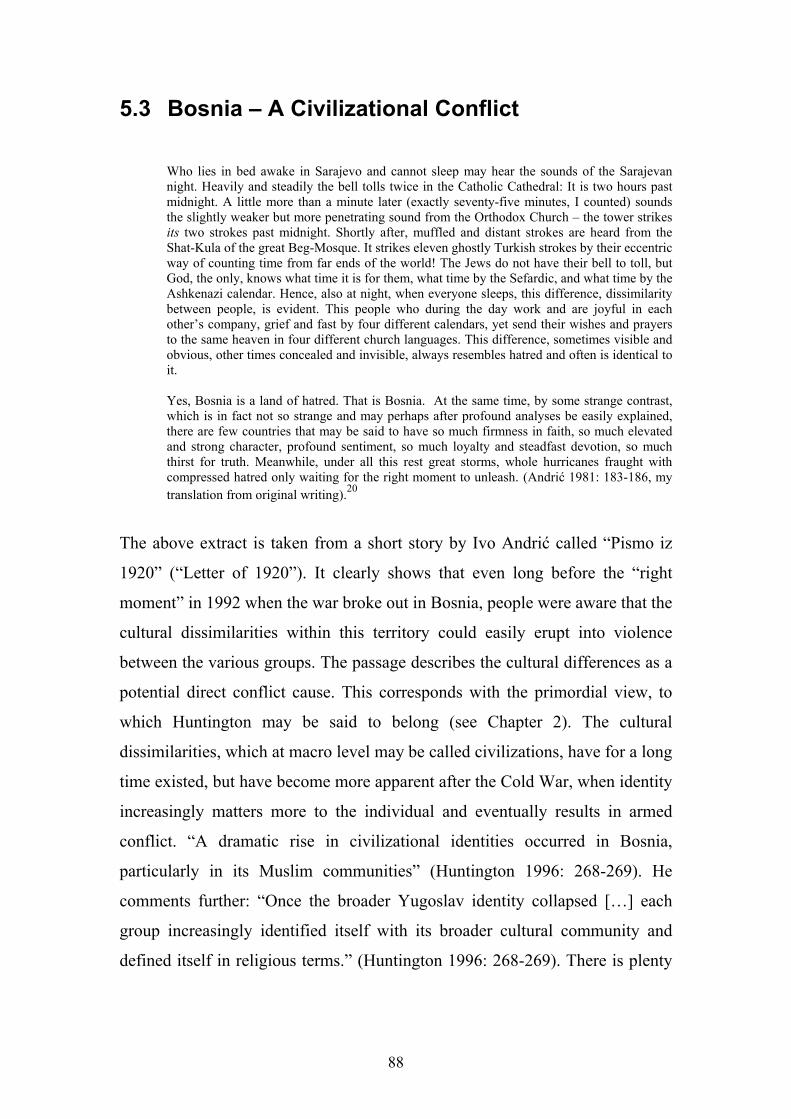
5.3 Bosnia – A Civilizational Conflict
Who lies in bed awake in Sarajevo and cannot sleep may hear the sounds of the Sarajevan night. Heavily and steadily the bell tolls twice in the Catholic Cathedral: It is two hours past midnight. A little more than a minute later (exactly seventy-five minutes, I counted) sounds the slightly weaker but more penetrating sound from the Orthodox Church – the tower strikes its two strokes past midnight. Shortly after, muffled and distant strokes are heard from the Shat-Kula of the great Beg-Mosque. It strikes eleven ghostly Turkish strokes by their eccentric way of counting time from far ends of the world! The Jews do not have their bell to toll, but God, the only, knows what time it is for them, what time by the Sefardic, and what time by the Ashkenazi calendar. Hence, also at night, when everyone sleeps, this difference, dissimilarity between people, is evident. This people who during the day work and are joyful in each other’s company, grief and fast by four different calendars, yet send their wishes and prayers to the same heaven in four different church languages. This difference, sometimes visible and obvious, other times concealed and invisible, always resembles hatred and often is identical to it.
Yes, Bosnia is a land of hatred. That is Bosnia. At the same time, by some strange contrast, which is in fact not so strange and may perhaps after profound analyses be easily explained, there are few countries that may be said to have so much firmness in faith, so much elevated and strong character, profound sentiment, so much loyalty and steadfast devotion, so much thirst for truth. Meanwhile, under all this rest great storms, whole hurricanes fraught with compressed hatred only waiting for the right moment to unleash. (Andrić 1981: 183-186, my translation from original writing).20
The above extract is taken from a short story by Ivo Andrić called “Pismo iz
1920” (“Letter of 1920”). It clearly shows that even long before the “right
moment” in 1992 when the war broke out in Bosnia, people were aware that the
cultural dissimilarities within this territory could easily erupt into violence
between the various groups. The passage describes the cultural differences as a
potential direct conflict cause. This corresponds with the primordial view, to
which Huntington may be said to belong (see Chapter 2). The cultural
dissimilarities, which at macro level may be called civilizations, have for a long
time existed, but have become more apparent after the Cold War, when identity
increasingly matters more to the individual and eventually results in armed
conflict. “A dramatic rise in civilizational identities occurred in Bosnia,
particularly in its Muslim communities” (Huntington 1996: 268-269). He
comments further: “Once the broader Yugoslav identity collapsed […] each
group increasingly identified itself with its broader cultural community and
defined itself in religious terms.” (Huntington 1996: 268-269). There is plenty
88
of evidence that can be used to support this view, not even a short background
paragraph can leave out the instrumental role ethnic differences played in the
conflict. The fact that the war in Bosnia was concentrated on territorial claims
and involved ethnic cleansing speaks for itself. Furthermore, many war acts
were purely symbolic statements in the same direction, such as the destruction
of religious monuments. Bosnia is located where three civilizations meet, or
clash: the Orthodox, the Western and the Muslim, represented by the Bosnian
Serbs, the Bosnian Croats and the Bosniacs, respectively.
Already in the 1980s, the Muslim population of Bosnia had become
more aware of its identity. The 1990 elections showed that President Alija
Izetbegović of the Party for Democratic Action (SDA) had increased his
popularity among the Muslim population. Izetbegović had previously served
time in prison for “Muslim fundamentalism”, based on his “Islamic
Declaration” (Mønnesland 1995: 288). The Bosnian Serbs were originally more
aware of their identity, although this feeling of identity was very much
reinforced by the dissolution of Yugoslavia and by the claim that Serbs should
be entitled to live in “Serb territory”. The Serbs were afraid to become citizens
of a Muslim state, and the Bosnian Muslims were equally afraid that they
would be regarded as Serbs and lose their rights if Bosnia remained in a new
Yugoslavia without Slovenia and Croatia. The last part of 1991 saw an increase
of distrust and tension among the ethnic groups in Bosnia.
Based on this presentation, it seems clear that Huntington has a strong case
when he declares Bosnia a civilizational conflict. The increased tension
between ethnic groups could eventually not be handled peacefully, and warfare
was in the end the only “exit”. This mechanism is not specific to Bosnia and is
described by Horowitz (1985) with the terms “Politics of Domination” and the
“Struggle for Preeminence”. Horowitz claims that the fear of being dominated
by ethnic strangers may be a source of increased identity and mobilization of a
20 I have not found this short story translated into English. I have cross-checked my own translation with the translation into Norwegian by Mønnesland (1995: 287).
89

second, different ethnic group. This, in effect, leads to mutual insecurity that
may again result in incessant competition of power. This security problem has a
mechanism similar to “the prisoner’s dilemma” (Lake & Rothchild 1998: 7-11).
Horowitz’s examples span from the North Nigerians fearing domination by the
Southerners, to the struggle for power between ethnic groups in Zanzibar when
it became clear that colonial rule would soon come to an end. Likewise, in Sri
Lanka, talks of deciding whether the country “belongs to” Sinhalese or the
Tamils, equally, set off such a process.
In Mauritania, Chad, and the Sudan, all of which lie, as Lebanon does, between two “worlds”, the question was similarly put: was the state to be “Arab” or “African”? And the derivate question, of course, was who would rule it, Arabs or Africans? The imminence of independence in Uganda aroused “fears of future ill-treatment” along ethnic lines. In Kenya, it was “Kikuyu domination” that was feared; in Zambia, “Bemba domination”; and, in Mauritius, “Franco-Mauritians”, Creoles and Muslims began to fear they will be overshadowed by the more populous Hindus”. Everywhere the word domination was heard. (Horowitz 1985: 188-189).
Horowitz could easily add many examples from the 1990s conflicts, which is
perhaps just what Huntington has done as a basis for his theory. This process of
“fear of domination” along ethnic lines may very well be a central feature and
explanatory factor for the conflict in Bosnia. Nevertheless, vital questions
remain unanswered. Why did the conflict erupt at that particular time? Why did
this situation in Bosnia escalate into armed warfare, whereas similar situations
of conflict are resolved peacefully, even if they are situated along the fault lines
of civilizations?
5.4 “The Puppet Masters” – the Instrumentalist Approach
Many have criticized Huntington’s explanation of the Bosnian conflict.
Mazower (2000) comments on the civilizational approach that in daily life the
distinctions between Orthodox, Catholics and Muslims were less pronounced
and that in fact Eurasian frictions brought in by outsiders were historically
blunted or defused by just shared local practices (Mazower 2000: 64).
90
Mazower focuses on how harmonically the ordinary people of different ethnic
groups have lived together in Bosnia for hundreds of years. Huntington’s
approach would be to counter this harmonic view with emphasizing the
increasing need for identity after the Cold War and its consequences. However,
instrumentalists would say that political leaders are the ones causing the
increasing identity and friction between the ethnic groups. This contesting
approach can mobilize much empirical support.
BBC correspondent John Simpson witnessed the initial stages of the
conflict and comments: “The siege of Sarajevo by the Bosnian Serbs was the
worst crime that I ever witnessed, but that doesn’t make the Bosnian
government entirely guiltless”. And he continues: “But the only side I really
sympathized with in this entire miserable war was the side that was totally
unrepresented by any of the politicians: the ordinary inhabitants of the city”
(Simpson 2001: 88). To some degree, this corresponds with the
instrumentalists’ claim that political leaders may have had personal agendas
that were not necessarily in the interest of the people they claimed to be
representing. Were, for example, the various ethnic groups as threatened as
their leaders claimed? Did the leaders really convey the true level of fear of
domination within their ethnic community, or did they in fact construct some of
this fear in order to promote their personal agendas, i.e. to gain political power
in a purely Serb, Croat or Muslim state within Bosnia? General Kukanjac, for
example, had disappointed the Bosnian Serb leaders in the initial stages of the
conflict by refusing to use the Yugoslav People’s Army (JNA) forces under his
command to partition Sarajevo. Kukanjac recalls a heated discussion on this
topic with Mr. Karađić and Mr. Izetbegović: “I said to them very roughly: that
they were playing with people’s lives, that they should sit down and talk and
that we had had enough of that nationalistic behavior. Sit down, talk, come to
an agreement. If not in your interest then in the interest of the people” (Silber &
Little 1996: 206).
The political leaders ordered the ethnic cleansing as part of their strategy
to win territories that they claimed as historical belongings of their people.
91
Bosnian Serbs were ordered by their leaders to leave their homes and settle in
the ethnically cleansed former Bosnian Croat or Muslim areas, like Zvornik21.
It was a cruel fight over territory driven by leaders who did not recognize the
worth of human beings of a different ethnic group, and who cared for their own
people merely as instruments in their siege for territory and power. The
Bosnian Croat leaders were perhaps to a greater extent than the other parties
controlled by outside forces, in this case the Croat president Franjo Tuđman.
Tuđman and his marionettes initially claimed to support the Bosnian Muslims.
Later, however, it became evident that Tuđman had a secret agreement with
Milošević to partition Bosnia between Serbia and Croatia (Mønnesland 1995).
When the Bosnian Croats suddenly switched sides, fighting between the
Bosnian Croats and the Muslims ensued, and became especially fierce in
Mostar. Not only did political leaders allow themselves to play strategic games
involving the lives of their own people, but this also demonstrates how the
agendas of the political leaders in the Bosnian conflict were much driven by
outside forces, primarily Croatia and Serbia, but also the greater powers like
Russia, USA, European states, and groups in Iran and Saudi-Arabia. Influence
of the greater powers in times of conflict is, however, often concealed and hard
to document. The main point, though, is that political leaders on all sides had
personal agendas that were often influenced by outside forces. These agendas
may not all have been in the interest of the people, but political leaders pursued
them, using “fear of domination” as a tool.
I have argued above that the instrumentalist approach does hold some truth in
the Bosnian case, and this challenges Huntington and the primordialist view.
To what extent can we say that the instrumental model is valid? Does the
validity of one model necessarily exclude the validity of the other? As
mentioned in Chapter 2, there are problems of logic in the instrumental model.
21 During my time in Bosnia I had many talks with internally displaced people. For example, the Bosnian Serbs who had moved from Sarajevo to Zvornik during the war had been told to do so by their Bosnian Serb leaders. They were not forced to leave by Bosnian Muslim militia. On the contrary, their
92
First, it is quite questionable to what extent political leaders can “construct”
ethnic divides and mobilize people to fight for these reasons. Logically, there
must be some basis for this kind of mobilization. In Bosnia, for example, if
there were no distinct cultural dissimilarities, its leaders would hardly be able
to construct such differences. Second, it is probably under certain conditions,
only or mostly, that political leaders can mislead or neglect the people in such a
way that the instrumentalist approach holds. To sum up the discussion thus far:
we cannot disregard the significance of cultural factors, such as ethnic divides,
even though the instrumentalist approach does have some explanatory power
for the Bosnia case. At the same time, we must study more closely under what
conditions are political leaders given the opportunity and room to play on
cultural divides? Such explanations may include the application of socio-
economic background variables as explanatory factors.
5.5 Constructivists – and the Relevance of Other Variables
The constructivists, as reviewed in Chapter 2, are perhaps bridging the two
perspectives discussed above, but add and integrate the relevance of political
and economic background causes of armed conflict. Provided that a society is
in a certain political and economic (crisis) condition, ethnic diversity may more
likely be a cause of conflict.
Research on the relationship between political systems and peace starts
with the observation that democratic states almost never go to war with each
other, which is originally a theoretical claim of Immanuel Kant in his work
“Perpetual Peace” (Kant 1795). There is a great deal of research showing that
democratic states are more peaceful towards each other, but not more peaceful
overall (Rummel 1995; Risse-Kappen 1995). Are democratic states more
internally peaceful? Hegre et al. (2001) show that it is the states that are not
own leaders told them that if they did not move to Zvornik, the Serbs would in the future have to live
93
quite democratic, yet not fully autocratic either, that have the highest
propensity for internal armed conflict. They find that political transitions are
hazardous22. This argument fits very well the outbreak of war in Bosnia. Tito
ruled like a dictator in Yugoslavia, and his policies often had the aim of
reducing, or even terminating, the ethnic differences, applying brutal methods.
This, however, often had an opposite effect (Mønnesland 1995). Tito favored
some kind of socialism distinct from the Soviet form of communism, and the
constitution of 1974 laid the foundation for a more open society, including
elements of federalism with much more autonomy for the regions.
Before his death in 1980, Tito, through the 1974 constitution, had given
instructions about how the country should be ruled after his death. The various
political institutions made up delegates from labor unions, interest groups and
provincial representatives. A presidential council of nine members, one from
each republic and autonomous province and one from the communist party,
headed the state. The presidency rotated among these members annually. In
1981, there was an extensive discussion on political change in Yugoslavia.
Everyone agreed that something ought to be done, but the disagreement within
the communist party and the rigid system of presidency made it impossible to
process these aspirations and steer the country in any direction. When the
USSR dissolved, Yugoslavia was fraught with great tension between liberal
forces that wanted to transform Yugoslavia into a democratic state, and the
communists, who tried to keep the existing system and who saw the dissolution
of Yugoslavia as a threat. The political system failed completely to bridge this
gap in views, and to come up with a political program to transform the country
(and it was not constructed to deal with such crises).
Economic conditions emerge as perhaps the most important explanatory factor
of armed conflict. The key issue here is the (low) level of economic
development (Hegre et al. 2001; Collier & Hoeffler 2001; Hauge & Ellingsen
under strictly Muslim rule.
94

1998). This may be indicated by a low average Gross National Product (GNP)
per capita, by a disproportionately large agricultural sector, or by a country’s
economic vulnerability to shifts in the world markets in commodities and
capital (Avery & Rapkin 1986). Combinations of lack of democratic openings
and poor economic conditions are identified as conditions under which there is
a higher propensity for armed conflict.
I have already pointed out the great deficiencies of the Yugoslav
political system, and how this, in a time of transition and change towards
democracy, may have been a cause of the conflict. The political system was not
able, due to its infrastructure, to deal with the great difficulties it was facing. In
addition to this, the economic situation had become ever more critical since the
end of the 1970s and the beginning of the 1980s. Although Bosnia, and
Yugoslavia as a whole, had mixed production and was relatively prosperous
compared to many countries of the third world, the economic decline was
dramatic; in 1989 inflation had reached 2,700%, and unemployment was
constantly rising. The political leadership was not able to agree on clear
economic policies and reforms until 1988, when the 1974 constitution was
revised in direction of a more market based economy (Mønnesland 1995: 232-
234).
In addition to the great economic problems, the provinces Slovenia and
Croatia had long claimed that they were economically exploited by Serbia.
Whereas Serbia received much of the country’s revenues, it was mainly
Croatia’s tourist industry and Slovenia’s industry and export to Western
countries that made up the revenues (Mønnesland 1995: 328-329). This may
also have been an important factor that increased the significance of the ethnic
divide during the dissolution of Yugoslavia, when it finally came about. This
also corresponds somewhat with the “relative deprivation” theory (Gurr 1994).
It is clear that as background cause the economic conditions in Yugoslavia, and
hence also in Bosnia, greatly contributed to the outbreak of conflict. There is
22 Jaggers & Gurr (1995: 477-478) mention the possibility that transition towards democracy is particularly dangerous.
95
also evidence that it was the combination of the socio-economic and cultural
factors that made it more likely for a conflict to erupt.
If we consider the constructivist model to include all these factors, we have a
model that shows how cultural differences may be a cause of conflict in a given
society where economic and political conditions are those of crisis or transition
and where political leaders play on ethnic strings to achieve their objectives.
This would, as shown in this chapter, be a fairly good model for explaining
why Bosnia collapsed into armed conflict in the beginning of the 1990s, and
how ethnic differences played a vital role in causing this conflict, along with
other political and economic factors. This model will, however, be criticized
from two sides.
From one side, the criticism is that causes of conflict range much wider
than economic, political and "cultural" factors. According to this view, other
factors are just as important, such as environmental degradation as a direct
cause of violent conflict (Homer-Dixon 1994). Nevertheless, contemporary
views stress that few conflicts today have environmental degradation as their
primary factors, such as those in Haiti and the Philippines (Smith 2000: 4-5). In
recent times, the role of demography is another factor that increasingly has
been viewed as a cause of conflict. A common argument is that an area, or
society, with huge youth bulges is more prone to conflict. This argument has
been reviewed in Chapter 4. On the far end of this criticism against the
constructivist model, one may say that every conflict is unique; hence, every
conflict has unique causes and combinations of factors as causes. Thus,
generalizing about the causes of conflict is pointless. However, this view gives
up on our endeavors to explain armed conflict as a phenomenon and, hence,
gives up on the idea that we can develop analytical tools that better prepares us
to understand and resolve, and eventually reduce, the extent of conflicts.
From the other side, many researchers believe that cultural dissimilarity
alone is not a cause of conflict. Generally, the claim is that economic and
political factors are the real causes of conflict, whereas ethnic diversity is at
96
best a catalyst. Smith (2000) distinguishes between background causes
(economic and political) and foreground factors (ethnic diversity, among
others). He does, however, emphasize that ethnic diversity may “exacerbate
conflict and increase the likelihood of serious escalation, precisely because it
offers fertile material for political mobilization. A prime example here is the
disintegration of Yugoslavia during the 1990s.” (Smith 2000: 4). For Bosnia, it
is evident that the incapability of the political system combined with the
economic crisis was an essential cause of the conflict. It is also clear that the
political leaders used the ethnic diversity for political mobilization. But this
does not undermine the fact that the ethnic diversity was a cause along with
these factors. Why was the political system so inefficient in both its actions and
its composition? It was probably because Tito had strived to keep a lid on the
ethnic conflict that was already in process and that had persisted since the
atrocities between Chetnicks and Ustasha during World War II. Tito engineered
the presidential council with the purpose of diffusing power between the
various nationalistic groups and to counter domination, or fear of domination,
among ethnic groups. Once the Cold War ended and the Berlin wall came
down, the ethnic groups, and their leaders especially, saw their windows of
opportunity. This opportunity was, of course, a result of Bosnia’s socio-
economic state. Nevertheless, had it not been for the ethnic composition and
history of the country, the political situation had also been entirely different.
On the other side, Smith clearly addresses an important case when trying to
systematize what factors are triggers, catalysts, etc., in order to understand how
conflict can be more effectively resolved.
Generally, there are many factors that combined explain a phenomenon in the
social sciences. As it is for conflict, there are many conditions that, separately,
make war more likely, but few factors can alone be said to determine war, like
a general law. Benin, for example, has all the conditions that make war likely,
but is still peaceful and changes government by democratic principles, even
though party cleavages are strictly along ethnic lines. Or Sierra Leone, where
97
“all conditions” are set for an ethnic conflict, yet the armed conflict in the
1990s has not evolved along ethnic lines23. There are some conflicts that may
seem to be caused by one factor alone. One example is the poor economic
conditions in Liberia, where warlords fight over the few surpluses. When there
is such scarcity of few resources (mostly diamonds), there is hardly any basis
for democracy, the rule of law and stability24. More examples are decades of
warfare in Angola and massacres in Burundi and Rwanda. It seems the
economic conditions alone has much explanatory power. Still, the majority of
conflicts have a complex combination as their cause, at least when it comes to
explaining the events that triggered the conflict. Thus, the vital questions that
remain unanswered are: How do we sort the causes of violent conflict? What
may explain when the war broke out, as opposed to why the war broke out, and
what made it so violent?
5.6 Triggers, Targets, Channels and Catalysts – Sorting the Causes of Armed Conflict
Dessler (1994) has attempted to sort the causes of armed conflict, in order to
distinguish between them. First, a “trigger” of violent conflict is any event or
the situation that increases the probability of conflict. Hence, to cite the trigger
is to cite an event that may explain aspects of the timing of the conflict. In the
case of Bosnia, one trigger would be the historical disputes between ethnic
groups, which increased throughout the 1980s. Other triggers were the
economic development and the political deadlock. Second, Dessler (1994)
emphasizes the “target” of a conflict. These are the objectives of the social
23 It is actually quite interesting to see how harmonically the various groups live together in Sierra Leone. As an election observer during the presidential and parliamentary election 2002 I observed several rallies. All participants stood up and all participated in first saying a Muslim prayer and thereafter a Christian prayer. Some of this I have commented in (Thorheim 2002). 24 Liberia is today ruled by anarchy, probably worse than in Afghanistan. Even experienced aid organizations cannot operate there. There is no easy solution of imposing sanctions or just removing Charles Taylor from “power”. The contemporary conditions resemble something like Hobbes’ image of the “condition of Man” that evolves to a “state of warre”, where life is “solitary, poor, nasty, brutish, and short” (Hobbes 1668: 89), and peace is hard to restore.
98
actors as they see it. To cite the target of a conflict is to understand what the
conflict is about. In Bosnia, the aim was for each ethnic group to gain control
of as much land as possible in order to create a future state for their “nationals”.
At least, this was the essential “target”, which may explain why the war
resulted in so many refugees and internally displaced persons, and why there,
still today, are so many bombed-out villages. Third, “channels” are the sources
and dynamics of shaping identities of the conflict’s participants. Dessler (1994:
105) explains: “While triggers and targets figure in the explanation of
intentional actions, […] channels figure primarily in sub-intentional
explanation and supra-intentional (why actors have the beliefs and desires they
do, […] and why individual actions have the collective or aggregative effects
they do).” The notion of channels is associated with the constructivist
explanation of the conflict. It focuses on how leaders take advantage of the
fear-of-domination mechanism to mobilize a group. The effects at the
individual level are aggregated and lead to a strong group identity – “them” and
“us”. As discussed earlier, there must be some kind of basis for such a
construction of stronger group identity, which can be a line of political, social,
economic, and/or cultural structures. Interestingly, the ethnic propaganda from
the Croats often characterized the Serbs as dumb farmers who did nothing but
drink all day, thus looting the goods generated from the prosperous Croat
economy (from the Croat tourism and off-shore industries)25. This is an
example of reinforcing ethnic cleavages with economic/political cleavages in
order to strengthen identities. Fourth, a “catalyst” is any factor that controls the
rate of intensity and duration of a conflict, once initiated. According to Smith
(2000) (see above), the ethnic diversity is a typical catalyst. Also, Ted Gurr has
observed: “cultural identities – those based on common descent, experience,
language, and belief – tend to be stronger and more enduring than most civic
and associational identities” (Gurr 2000: 66).
My analysis shows, however, among the conflicts 1979-2000, no
significant correlation between a conflict’s proximity to a civilizational border
25 See Mønnesland 1995: 328-329, or the newspapers like Vjesnik from the early 1990s.
99
and the number of battle-related deaths. The argument may still be plausible,
but there are so many other factors that may play a greater role. One example is
the tactical side of military campaigns (e.g. Kosovo 1999). For Bosnia, I think
one may easier cite the catalysts by looking at the “target” of the conflict. Since
the war was fought over borders, where the frontlines were constantly shifting,
it was hard to reach a point where all three parties were satisfied with status
quo. Also, the military tactics may, to some extent, explain the high number of
battle-related deaths. Although government soldiers raping and burning houses
is one of the gravest human rights abuses known to man, it is still a rational
tactic when the only goal is to gain control over as much territory as possible in
a short time, no matter what the consequences are. These were the tactics by
people like the psychologist and politician Radovan Karađić. To sum up, the
perspective of Dessler (1994) does provide at least some kind of tool to sort, or
to separate, the various aspects of what are the causes of armed conflicts. It is
hard to say whether this exact classification is the most fruitful imaginable, but
it does structure various arguments effectively.
5.7 An Attempt to Answer the Initial Questions
Initially in this chapter, I put forward the question of whether the case of
Bosnia is a civilizational conflict. The answer is that even though Bosnia is
Huntington’s prime example of civilizational conflict, this conflict, as many
others, can be seen from different angles and fit different types of explanations.
Nevertheless, we can say that cultural differences constitute a vital part of the
conflict – and of explaining it. The next question raised was in what way did
cultural differences contribute to the conflict in Bosnia? Through the
discussion, it became clear that the political leaders did play on those strings,
perhaps not always in the interest of the people they represented. The leaders
followed their political agendas, which were to some degree driven by outside
political forces. Nevertheless, had it not been for the economic state Bosnia
100
was in, and the political state within Bosnia and outside (the dissolution of the
east-west bi-polarity structure and Yugoslavia), the chances of such an ethnic
conflict might have been significantly reduced. The discussion gives us an idea
that it is probably a combination of these factors that is the cause of armed
conflict, although it is not inevitable that, given these conditions, armed
conflict will erupt. There is probably some mechanism, involving various
factors, that increases the likelihood of conflict. In the case of Bosnia, the
ethnic and religious dissimilarity may be said to have been at least among the
few primary factors.
A final question is, do the findings of this discussion support
Huntington’s theory? One should be very careful in generalizing from one case
to “all conflicts” or “Huntington is right or wrong”. Nevertheless, on the
background of the results in the previous chapter and this discussion, it is
evident that cultural dissimilarity and conflict are related; it is also the case for
Bosnia. Huntington does not provide a well-founded theoretical basis for
positing this kind of empirical relationship. The theory focuses almost
exclusively on cultural differences (although it is not entirely a mono-causal
explanation), and in doing so, loses the perspective of the interaction of factors
that together constitute causes of conflict, as touched upon in the case of
Bosnia. The war in Bosnia was ethnically based, but Huntington fails to answer
why and how it became an ethnic conflict, what triggered it, and why it erupted
at that particular time. A more structured argument, and explanation, may be
found in applying the notion of triggers, targets, channels, and catalysts in order
to sort the various causes of armed conflict. This thesis shows that
Huntington’s overall claim gains some empirical support, yet the theoretical
basis for this claim demands a much stronger foundation than what Huntington
provides. The natural extension of the research in this thesis is to further
inquire into the micro foundations of the finding that cultural dissimilarity is
correlated with conflict. This requires further quantitative and qualitative
research. The Dessler (1994) approach may be one direction in which to guide
the theoretical debate.
101
6 Conclusion In this thesis I have attempted to assess the validity of Huntington’s “Clash of
Civilizations” thesis concerning the causes and nature of conflicts in the post-
Cold War era. In order to do so, I have presented the theory and derived
empirical statements from it in forms of hypotheses. Next, I have drawn up the
civilizational borderline and measured for each conflict its distance to the
nearest line. This, along with other information in the PRIO/Uppsala dataset,
has enabled me to test such propositions as: Do the conflicts occur along the
fault lines of civilizations? Is this relationship more evident in the post-Cold
War era? Are fault line (civilizational) conflicts generally more “bloody” and
generally fought over territory, etc.? In addition to this, I have measured the
amount of conflict along each of the nine civilizational borders, which set the
grounds for assessing the validity of Huntington’s claims of which civilizations
are more, and which are less, exposed to conflict. In the extension of testing
these specific claims of the theory, I have aspired to assess how cultural
difference may be a cause of conflict – how does cultural dissimilarity, along
with several other factors, interact in generating this phenomenon? A case
study of the causes of conflict in Bosnia provided the basis for understanding
more of this process.
102
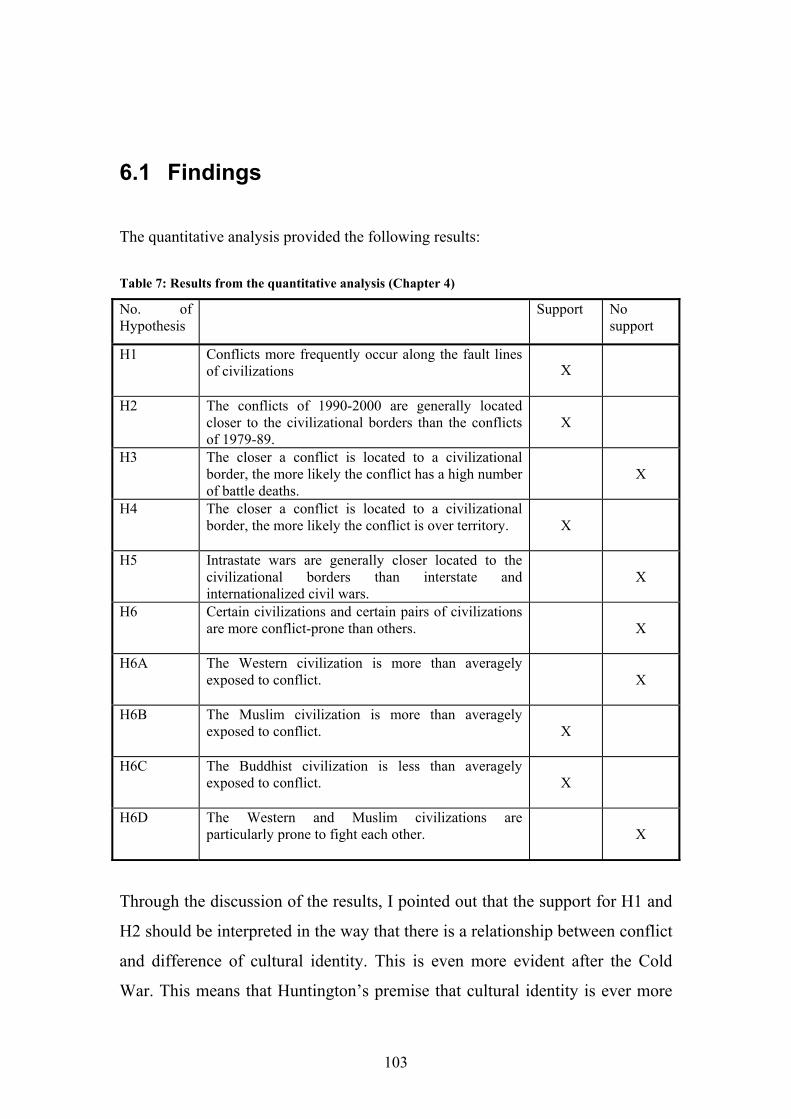
6.1 Findings
The quantitative analysis provided the following results: Table 7: Results from the quantitative analysis (Chapter 4)
No. of Hypothesis
Support No support
H1 Conflicts more frequently occur along the fault lines of civilizations
X
H2 The conflicts of 1990-2000 are generally located closer to the civilizational borders than the conflicts of 1979-89.
X
H3 The closer a conflict is located to a civilizational border, the more likely the conflict has a high number of battle deaths.
X
H4 The closer a conflict is located to a civilizational border, the more likely the conflict is over territory.
X
H5 Intrastate wars are generally closer located to the civilizational borders than interstate and internationalized civil wars.
X
H6 Certain civilizations and certain pairs of civilizations are more conflict-prone than others.
X
H6A The Western civilization is more than averagely exposed to conflict.
X
H6B The Muslim civilization is more than averagely exposed to conflict.
X
H6C The Buddhist civilization is less than averagely exposed to conflict.
X
H6D The Western and Muslim civilizations are particularly prone to fight each other.
X
Through the discussion of the results, I pointed out that the support for H1 and
H2 should be interpreted in the way that there is a relationship between conflict
and difference of cultural identity. This is even more evident after the Cold
War. This means that Huntington’s premise that cultural identity is ever more
103
important at the individual level, and consequently affects the pattern of armed
conflict, may describe some features of reality. However, it is important to keep
in mind that socio-economic background variables, or type of political regime,
which are known to correlate with conflict, are not controlled for. H4 gained
support and is an expression for cultural conflict often being fought over
territorial claims, whereas Huntington is wrong about cultural conflicts being
more violent (H3). The result of H5 may give an indication that,
methodologically, different types of conflict should perhaps not be studied
separately; perhaps they are to some extent the same phenomenon. The
discussion of H6 A-D holds that even though there may be some evidence
supporting Huntington’s overall claim (H1 & H2), his analysis of inter-
civilizational mechanisms holds very little correspondence to reality. On the
contrary, I detected many other relevant factors that may explain the variation
of exposition of conflict across civilizations just as well, or even better. I also
pointed out that an analysis of inter-civilizational relations involves so many
possible background variables that it is virtually impossible to say anything
certain about this.
As a natural extension of the results from the quantitative analysis, I first
reviewed the ten conflicts closest to civilizational borderlines as an introduction
to looking at the cases qualitatively. Next, I selected a case, the war in Bosnia
1992-95, which follows the general tendency. I attempted to assess the
mechanisms that caused the conflict. I found that even though this conflict was
fought along ethnic lines, and that ethnic-religious dissimilarity and hatred is
one of the causes of this conflict, the picture seems to be much more complex.
First, there are indications that the political leaders, on all sides, played on
ethnic strings in order to mobilize “their people” and to fight “the others”. At
the same time, it is questionable whether the objectives for which the people
were mobilized were actually in their own interest. Political leaders may have
made use of the psychology of “fear of domination” in order to gain support.
This does not, however, prove that potential ethnic tension did not exist before
104
the war. Rather, it urges us to identify what conditions give room for elites to
play on ethnic strings in a society. Much evidence points at the economic and
political crisis in which Bosnia, and its surroundings, found itself. The
transition to a new political system and the ineffectiveness in handling the
economic crisis may have swept the grounds for interest-driven politicians to
stir up ethnic tension. Lastly, I found it rather fruitful to distinguish between the
various types of causes of conflict, as suggested by Dessler (1994) (triggers,
targets, channels and catalysts).
A conclusion of my findings may be formulated, very simplified, this
way: Through the quantitative analysis I discovered that cultural dissimilarity
does play a vital role to the pattern of conflict. This supports the overall claim
of Huntington, and challenges previous attempts to test the civilizations thesis.
Through the qualitative discussion of Bosnia, however, I confirmed how
difficult it is to tell how cultural dissimilarity plays a role as a cause of conflict.
I identified other important explanatory factors, and how these may interact
with cultural factors to cause armed conflict. Thus, future studies of
Huntington’s theory should take these aspects into account.
6.2 Suggestions for Further Research
There are some interesting methodological aspects of this thesis that it may be
fruitful to follow up on, and the appendixes contain all information necessary in
order to replicate this work. One may want to link the information in the
appendixes to the current PRIO/Uppsala dataset, which is updated annually.
The statistical database, along with the detailed list of definitions from the
Uppsala Conflict Data project, is available at www.prio.no/cwp/armedconflict/.
For further research, I would first like to point out the possibility to replicate
the work with the Correlates of War (COW) data, or other data. The COW data
have a different criterion for conflict, which might affect the result, and they
contain additional variables that are relevant control variables for a second
105
analysis of this kind. One option is to run tests on: Are cultural factors
correlated with the duration of conflicts?26 Second, I have used geographical
data in the analysis. I have combined the location of conflicts with the location
of cultural borders in GIS software. This is probably only a start for research
with this approach: Further research may map out where conflicts are located in
relation to the locations of natural resources, mountains, climate zones,
demographic features, and developed/developing areas. However, for this type
of method to develop further, one needs to reach a more appropriate reference
for a random distribution of locations, than what the “Cities” variable
represents (see discussion in 4.1). This could be developed most effectively in
co-operation with geographers. The geographical approach represents a de-
aggregation of countries, which may become an important feature of future
conflict research.
Third, I use conflicts as units, as opposed to country-years. This
approach, combined with geographical data, seems far more appropriate for
testing the significance of cultural factors. Hence, variables expressing
economic level, level of democracy and other socio-economic indicators should
be measured geographically in order to fit this type of units. These measured
variables should be included as control variables in a multivariate analysis.
Although case studies can, as demonstrated in Chapter 5, shed light on the role
of the various factors that increase the likelihood of conflict, they cannot
compensate entirely for a quantitative multivariate analysis. However, with
conflicts as units, further multivariate analysis requires innovative measuring of
variables based on geographical information, using GIS software.
A different approach for a quantitative multivariate analysis is to
replicate the work of Russett et al. (2000), and add a variable measuring the
proximity of a country to the nearest civilizational borderline (as suggested in
4.1.1). However, there are several problems attached to generating this
variable, at least as a continuous variable. One could perhaps code countries
that are divided by a civilizational borderline as the closest, i.e. code them with
26 See the recent work of Walter (2002) for a similar type of analysis.
106
a low score on the proximity variable. Second closest would be those countries
that share borders with a different civilization. However, for this second
category one ought to control for how long this shared border is in relation to
the country size and where the majority of the population lives. A third
category should contain countries that are not located along civilizational
borderlines. These countries ought to be ranked by the distance to their nearest
borderline. This is problematic since it requires projecting a point that
represents the location of a whole country. This kind of proximity variable
could at least be some approximation that would be interesting to apply when
replicating Russett et al. (2000), but also for a monadic analysis.
Theoretically, I have tried to link the results from the quantitative
analysis to relevant theories on cultural causes of conflict, through the case of
Bosnia. As pointed out earlier, a much more comprehensive case study is
needed in order to find out more about the mechanisms on the individual-,
group-, and macro level that lead to war. If we are to believe that the support of
Huntington’s overall claim in this thesis is due to cultural dissimilarity being a
primary cause of conflict, we need to look at the process at the individual level.
When does an individual change preferences to using violent means to fight
“the others”, i.e. under what conditions do identity differences become lethal? I
think the categorization of causes of conflict, as done by Dessler (1994), is one
direction in which to proceed. It is this kind of “mapping” of the factors and
their roles that can eventually produce a more comprehensive picture of the
root causes of armed conflicts and the complex mechanism that triggers them.
107
Bibliography
Aftenposten October 24, 2001: 8. Aftenposten morgenutgave. Schibsted Trykk AS. [Norwegian newspaper]. Ahari, M. E., 1997. “The Clash of Civilizations: An Old Story or New Truth?”, New Perspectives Quarterly 14(2): 56–61. Ajami, Faoud, 1993. “The Summoning”, Foreign Affairs 72(4): 2–9. Anderson, Benedict, 1983. Imagined Communities: Reflections on the Origin and Spread of Nationalism. London: New Left Books. Andrić, Ivo, 1981. “Pismo iz 1920”, In Deca in the series “Complete Writings. Sarajevo 1981. Avery, William P., & David P. Rapkin, 1986. “World Markets and Political Instability within Less Developed Countries”, Cooperation and Conflict 21(2): 99-117. Bouchat, Clarence J., 1996. “A Fundamentalist Islamic Threat to the West”, Studies in Conflict and Terrorism 19:339-52. Brass, Paul, 1985. Ethnic Groups and the State. London: Croom Helm Brubacker, Rogers, 1995. “National Minorities, Nationalizing States, and External National Homelands in the New Europe”, Daedalus (Spring): 107–132. Buhaug, Halvard & Scott Gates, 2002. ”The Geography of Civil War”, Journal of Peace Research 39(4): 417-433. Carment D. B., and P. James, 1995. “Internal Constraints and Interstate Ethnic Conflict”, Journal of Conflict Resolution 39: 82-109. Chirot, D., 2001. “A Clash of Civilizations or of Paradigmes? Theorizing Progress and Social Change”, International Sociology 16(3): 341-360. CIA 2002. CIA World Fact Book. URL: http://www.cia.gov/cia/publications/factbook/ June 2002. Collier, Paul and Anke Hoeffler, 2001. ”Greed and Grievance in Civil War”. Policy Working Paper 2135, World Bank. Connor, Walker, 1994. Ethnonationalism: The Quest for Understanding. Princeton: Princeton University Press. Copson, Raymond W. 1994. Africa’s Wars and Prospects for Peace. M.E. Sharpe, Armonk, New York. London. Dessler, David, 1994. “How to Sort Causes in the Study of Environmental Change and Violent Conflict.” Nina Græger and Dan Smith (eds.). PRIO Report 2/94: 91-112.. Dominguez, Virginia, 1989. People as Subject, People as Object: Selfhood and Peoplehood in Contemporary Israel. Madison: University of Wisconsin Press. Ellingsen, Tanja 2000. “Colorful Community or Ethnic Witches’ Brew? Multiethnicity and Domestic Conflict During and After the Cold War”. Journal of Conflict Resolution Saga Publications Ltd., 44(2): 228-249. Esposito, John L., 1992. The Islamic Threat. New York: Oxford University Press.
108

Esposito, John L., and John O. Voll. 1996. Islam and Democracy. Oxford: Oxford University Press. ESRI File: Cities files from ArcView tutorial by ESRI. Files: cities.shp, cities.avl, cities.prj, cities.sbn, cities.sbx. ESRI manual on map projections. 1994 ESRI production: Appendix 36 Fox, Jonathan, 2001. “Ethnic Minorities and the Clash of Civilizations: A Quantitative Analysis of Huntington’s Thesis”. British Journal of Political Science 32(3). Fukuyama, Francis, 1992. The End of History and the Last Man. London : Hamish Hamilton, 1992. Gates, Scott, 2002. “Recruitment and Allegiance: The Microfoundations of Rebellion”, Journal of Conflict Resolution. Vol. 46, No. 1 (February 2002) Geertz, Clifford, 1963. Old Societies and New States. New York: Basic Books. Geertz, Clifford, 1973. The Interpretations of Culture. New York: Basic Books Glazer, N., & D. Moynihan 1975. Ethnicity: Theory and Experience. Cambridge, MA: Cambridge University Press. Gleditsch, Nils Petter; Peter Wallensten, Mikael Eriksson, Margareta Sollenberg & Håvard Strand, 2001. ”Armed Conflict 1946-2000: A New Dataset”, paper presented to the conference on ”Identifying Wars: Systematic Conflict Research and Its Utility in Conflict Resolution and Prevention”, Uppsala University, 8-9 June 2001 (www.pcr.uu.se). Gleditsch, Nils Petter; Peter Wallensten, Mikael Eriksson, Margareta Sollenberg & Håvard Strand, 2002. ”Armed Conflict 1946-2000: A New Dataset” Journal of Peace Research vol. 39(5): 615-628. Gleditsch, Nils Petter & Håvard Hegre, 1997. ”Peace and Democracy: Three Levels of Analysis”, Journal of Conflict Resolution 41: 283-310. Gregg, Donald P., 1997. “A Case for Continued US Engagement”, Orbis 41(3): 375–384. Gurr, Ted R., 1994. “Peoples Against the State: Ethnopolitical Conflict and the Changing World System”, International Studies Quarterly 38(3): 347–377. Gurr, Ted, 2000. Peoples Versus States: Minorities at Risk in the New Century. Washington D.C.: U.S. Institute of Peace, 2000. Harris, Robin, 1996. “War of the World Views”, National Review 48(20): 69. Hassner, Pierre, 1997. “Morally Objectionable, Politically Dangerous”, National Interest (46): 63–69. Hauge, Wenche, and Tanja Ellingsen, 1998. “Beyond Environmental Scarcity: Causal Pathways to Conflict”, Journal of Peace Research 35(3): 299-317. Hegre, Håvard, Tanja Ellingsen, Scott Gates and Nils Petter Gleditsch, 2001. ‘Towards a Democratic Civil Peace? Democracy, Political Change, and Civil War 1816-1992”, American Political Science Review 95(1): 33–48. Hellevik, Ottar 1991. Forskningsmetode i sosiologi og statsvitenskap. 5. utgave 1991. Universitetsforlaget. Henderson, Errol A., and Richard Tucker. 2001. “Clear and Present Strangers: The Clash of Civilizations and International Conflict.” International Studies Quarterly 45:317-338. Henderson, Errol A., 1997. “Culture or Contiguity: Ethnic Conflict, the Similarity States, and the Onset of War 1820–1989”, Journal of Conflict Resolution 41(5): 649–668.
109
Henderson, Errol A., 1998. “The Democratic Peace Through the Lens of Culture 1920-1989”. International Studies Quarterly 42(3): 461–484. Hobbes. Thomas 1668. Leviathan. Edited by Richard Tuck 1996. Cambridge University Press. Holsti, K. J. 1992 – 6th edition. International Politics: A Framework for Analysis. Englewood Cliffs, NJ : Prentice Hall, 1992 Homer-Dixon, Thomas, 1994. “Environmental Scarcity and Violent Conflict: Evidence from Cases” International Security 19(1): 5-40. Horowitz, Donald L., 1985. Ethnic Groups in Conflict. Berkeley: University of California Press. Hovi, Jon and Bjørn Erik Rasch 1996. Samfunnsvitenskapelige analyseprinsipper. Fagbokforlaget 1996. Huntington, Samuel P., 1993a. ‘The Clash of Civilizations?’, Foreign Affairs 72(3): 22–49. Huntington, Samuel P., 1996. The Clash of Civilizations and the Remaking of World Order. Touchstone Books. An imprint of Simon and Schuster UK Ltd: London, New York, Sydney, Tokyo, Toronto, Singapore. Huntington, Samuel P., 2000. ‘Try Again: A Reply to Russett, Oneal & Cox’, Journal of Peace Research 37(5): 609–610. Huntington, Samuel P., 2001. “The age of Muslim Wars” Newsweek Special Davos Edition, December 2001 – February 2002. Isaacs, Harold, 1975. ‘Basic Group Identity: Idols of the Tribe’, Ethnicity 1: 15–41. Jaggers, Keith, and Ted Robert Gurr, 1995. “Tracking Democracy’s Third Wave with the Polity III Data. Journal of Peace Research 32(4): 469-482. Juergensmeyer, Mark, 1993. The New Cold War? Berkeley: University of California Press. Kant, Immanuel, 1795. Political Writings. Second enlarged edition 1991.Cambridge University Press 1991. Kedourie, Elie 1994. Democracy and Arab Political Culture. London: Frank Cass. Keohane, Robert O., Joseph S. Nye, and Stanley Hoffmann, 1993. After the Cold War: International Institutions and State Strategies in Europe, 1989-1991. Cambridge, Mass: Harvard University Press. Kirkpatrick, Jeane J., 1993. “The Modernizing Imperative. Tradition and Change”, Foreign Affairs 72(4): 2–28. Kurth, James, 1994. “The Real Clash”, National Interest (37): 3–14. Lake, David A. and Donald Rothchild, 1998. “Ch.1: Spreading Fear: The Genesis of Transnational Ethnic Conflict”. The International Spread of Ethnic Conflict. Fear Diffusion, and Escalation. Princeton University Press 1998: 3-32. Marty, Martin E., & R. Scott Appleby (eds.), 1991. Fundamentalism and the State: Remaking Politics, Economies and Militancy. Chicago: University of Chicago Press. Marzower, Mark, 2000. The Balkans. Weidenfeld & Nicolson. London. Mearsheimer, John, 1990. “Back to the Future: Instability in Europe after the Cold War” International Security 15: 5-56.
110
Mearsheimer, John, 1995. “The False Promise of International Institutions”, International Security 19 (3):5-49. Midlarsky, Manus I., 1998, “Democracy and Islam: Implications for Civilizational Conflict and the Democratic Peace”. International Studies Quarterly September 42(3): 485-511. Moore, Barrington, 1966. Social Origins of Dictatorship and Democracy: Lord and Peasant in the Making of the Modern World. Boston: Beacon Press. Murphey, Dwight C., 1998. “The Clash of Civilizations”, Journal of Social, Political and Economic Studies 23(2): 215–216. Mønnesland, Svein, 1995. Før Jugoslavia og etter. 3. utgave. Sypress Forlag, Oslo. Newsweek December 2001-February 2002. Special Davos Edition, pp. 7-9 and 58-63. Norris, Pippa and Ronald Inglehart, 2002. “Islam & the West: Testing the “Clash of Civilizations” Thesis.” Harvard, John F. Kennedy School of Government and University of Michigan. Oneal John R & Bruce Russett, 1999. “The Kantian Peace. The Pacific Benefits of Democracy, Interdependence and International Organizations”, World Politics: A Quarterly Journal of International Relations 52(1):1-37. Pfaff, William E., 1998. “The Clash of Civilizations and the Remaking of World Order”, Annals of the American Academy of Political and Social Science 556: 198–199. Risse-Kappen, Thomas, 1995. ”Democratic Peace – Warlike Democracies? A Social Constructivist Interpretation of the Liberal Argument”. European Journal of International Relations 1(4): 491-517. Rokkan, Stein, 1987. Stat, nasjon, klasse: essays i politisk sosiologi. Utvalg og innledning av Bernt Hagtvet, Det blå bibliotek, Universitetsforlaget 1987. Rosencrance, Richard, 1998. “The Clash of Civilizations and the Remaking of World Order”, American Political Science Review 92(4): 978–980. Ross, Michael L., 2001. “Does Oil Hinder Democracy?”, World Politics 53(3): 325-361. Rothchild, Donald, 1986. “Interethnic Conflict and Policy Analysis in Africa”. Ethnic and Racial Studies 9(1): 66-86. Roy, Olivier, 1994. The Failure of Political Islam. Translated by Carol Volk. Cambridge, Mass.: Harvard University Press, 1994. Rummel, R.J., 1995. ”Democracies ARE Less Warlike Than Other Regimes”, European Journal of International Relations 1(4): 457-479. Russett, Bruce, John R. Oneal & Michaelene Cox, 2000. “Clash of Civilizations, or Realism and Liberalism Deja Vu? Some Evidence. Journal of Peace Research September 37(5):583-609. Rød, K. J., Gleditsch, N. P. and Buhaug, H., 2001 “Kartografisk visualisering av konflikter” Sahliyeh, Emilie, 1990. Religious Resurgence and Politics in the Contemporary World. New York: State University of New York Press. Senghaas, Dieter, 1998. “A Clash of Civilizations – An Idée Fixe?”, Journal of Peace Research 35(1): 127–132.
111
Shannon, Megan 2001. “Contending the Clash of Civilizations: An Analysis of Islam and Interstate Conflict.” Paper presented at American Political Science Association Annual Conference Aug 29th – Sept 2nd 2001, San Francisco. Shupe, Anson, 1990. “The Stubborn Persistence of Religion in the Global Arena”, in Emile Sahliyeh (ed). Religious Resurgence and Politics in the Contemporary World. New York: State University of New York Press. Silber, Laura & Little, Allan, 1995. The Death of Yugoslavia. Revised edition 1996. Penguin Books. BBC Books. Simpson, John, 2001. A Mad World My Masters. Tales from a Travellers Life. Pan Books. Macmillan 2000. Singer, David J. And David J. Small, 1994. “Correlates of War Project: International and Civil War Data, 1816-1992”, Inter-university Consortium for Political Science and Social Research: Ann Arbor, MI, codebook and computer file, ICPSR no. 9905. Singer, David J. And David J. Small, 1972. The wages of war, 1816-1965 : a statistical handbook / J. David Singer and Melvin Small. New York: Wiley, c1972. Skog, Ole Jørgen, 1998. Å forklare sosiale fenomener – En regresjonsbasert tilnærming. Ad Notam Gyldendal, Oslo. Smith, Anthony D., 1986. The Ethnic Origins of Nations. Oxford: Basil Blackwell. Smith, Dan, 2000. ”Trends and Causes of Armed Conflicts”. The Berghof Handbook for Conflict Transformation. Berghof Research Center for Constructive Conflict Management 2000 ss. 1-13. Steinberg, Stephen, 1981. The Ethnic Myth: Race, Ethnicity and Class in America. New York: Atheneum. Stinchombe, Arthur, 1968. Constructing Social Theories. Chapter 2: The Logic of Scientific Inference. Harcourt Brace Jovanovich 1968. The Economist, 2001. “The Roots of Hatred”. September 22, 2001. Thorheim, Bård L. & Ola Lesteberg, 2000. Midtens rike – Kina som kommende supermakt. NHO & NORAD publikasjon. Universitetsbiblioteket. Thorheim, Bård L., 2001. “En analyse av NATOs argumentasjon under Kosovo-krigen”. Kursoppgave hovedfag statsvitenskap. Institutt for statsvitenskap, Universitetet i Oslo. Thorheim, Bård L., 2002. “Sierra Leone: Presidential and Parliamentary Elections 2002”. NORDEM, Institutt for menneskerettigheter, Universitetet i Oslo. Urdal, Henrik, 2002. “The Devil in Demographics – The Effect of Youth Bulges on Domestic Armed Conflict, 1950-2000”. Revised edition from presented at ISA conference 2001. Väyrynen, R., 1994. Towards a Theory of Ethnic Conflicts and their Resolution. Notre Dame, IN: Joan B. Croc. Walter, Barbara F., 2002. Committing to Peace. The Successful Settlement of Civil Wars. Princeton University Press. Princeton and Oxford. Weede, Erich, 1998. “Islam and the West: How Likely is a Clash of the Civilizations?” International Review of Sociology 8(2): 183-196. www.IRINnews.org 4 October 2002. UN news. “Kyrgyzstan: Focus on Conflict Prevention in the Fergana Valley.”
112

www. rand.org/publications 3 October 2002. “Internal and Regional Threats to NATO Interests”. www.eia.doe.gov/emeu/cabs/caspconf.html3 October 2002. “Caspian Sea Region: Regional Conflicts”. Yamazaki, Masakazu, 1996. “Asia: A Civilization in the Making”, Foreign Affairs 75(4): 106–128. Yin, Robert K., (1990): Case Study Research. Design and Methods. Newbury Park : Sage publications. Young, Crawford (ed.), 1993. The Rising Tide of Cultural Pluralism. Madison: University of Wisconsin Press. Zakaria, Fareed 2001. “The Roots of Rage”, Newsweek 138(16): 14, 33.
113
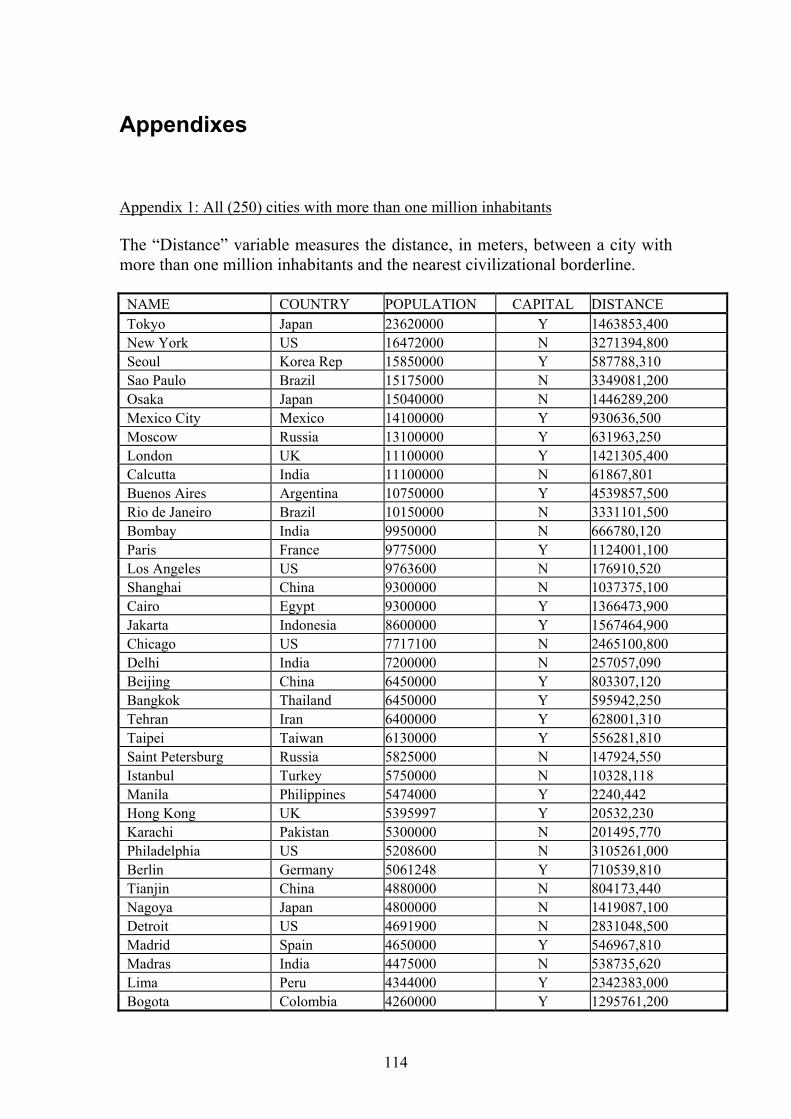
Appendixes
Appendix 1: All (250) cities with more than one million inhabitants The “Distance” variable measures the distance, in meters, between a city with more than one million inhabitants and the nearest civilizational borderline.
NAME COUNTRY POPULATION CAPITAL DISTANCE Tokyo Japan 23620000 Y 1463853,400 New York US 16472000 N 3271394,800 Seoul Korea Rep 15850000 Y 587788,310 Sao Paulo Brazil 15175000 N 3349081,200 Osaka Japan 15040000 N 1446289,200 Mexico City Mexico 14100000 Y 930636,500 Moscow Russia 13100000 Y 631963,250 London UK 11100000 Y 1421305,400 Calcutta India 11100000 N 61867,801 Buenos Aires Argentina 10750000 Y 4539857,500 Rio de Janeiro Brazil 10150000 N 3331101,500 Bombay India 9950000 N 666780,120 Paris France 9775000 Y 1124001,100 Los Angeles US 9763600 N 176910,520 Shanghai China 9300000 N 1037375,100 Cairo Egypt 9300000 Y 1366473,900 Jakarta Indonesia 8600000 Y 1567464,900 Chicago US 7717100 N 2465100,800 Delhi India 7200000 N 257057,090 Beijing China 6450000 Y 803307,120 Bangkok Thailand 6450000 Y 595942,250 Tehran Iran 6400000 Y 628001,310 Taipei Taiwan 6130000 Y 556281,810 Saint Petersburg Russia 5825000 N 147924,550 Istanbul Turkey 5750000 N 10328,118 Manila Philippines 5474000 Y 2240,442 Hong Kong UK 5395997 Y 20532,230 Karachi Pakistan 5300000 N 201495,770 Philadelphia US 5208600 N 3105261,000 Berlin Germany 5061248 Y 710539,810 Tianjin China 4880000 N 804173,440 Nagoya Japan 4800000 N 1419087,100 Detroit US 4691900 N 2831048,500 Madrid Spain 4650000 Y 546967,810 Madras India 4475000 N 538735,620 Lima Peru 4344000 Y 2342383,000 Bogota Colombia 4260000 Y 1295761,200
114

NAME COUNTRY POPULATION CAPITAL DISTANCE Santiago Chile 4100000 Y 4330123,000 San Francisco US 4053800 N 623028,560 Barcelona Spain 4040000 N 885151,620 Boston US 3971700 N 3653206,800 Essen Germany 3867000 N 995792,940 Baghdad Iraq 3841268 Y 659930,380 Shenyang China 3840000 N 447020,120 Pusan Korea Rep 3800000 N 1029325,600 Lagos Nigeria 3800000 Y 404473,880 Milano Italy 3750000 N 524408,190 Johannesburg South Africa 3650000 N 2084392,600 Caracas Venezuela 3600000 Y 699308,250 Wuhan China 3490000 N 1095106,100 Dhaka Bangladesh 3430312 Y 85896,922 Toronto Canada 3427168 N 3230013,500 Sydney Australia 3364858 N 3177353,000 Alexandria Egypt 3350000 N 1212748,200 Washington D.C. US 3221400 Y 2870554,200 Roma Italy 3175000 Y 378643,530 Ho Chi Minh City Vietnam 3100000 N 40951,496 Guangzhou China 3050000 N 108117,610 Athinai Greece 3027331 Y 340538,030 Lahore Pakistan 3025000 N 31159,811 Singapore Singapore 3025000 N 605838,310 Kinshasa Zaire 3000000 Y 1806821,400 Yokohama Japan 2992926 N 1493556,900 Bangalore India 2950000 N 505233,250 Belo Horizonte Brazil 2950000 N 2959992,800 Montreal Canada 2921357 N 3816272,800 Kiev Ukraine 2900000 Y 439492,750 Napoli Italy 2875000 N 347200,310 Melbourne Australia 2832893 N 3968178,000 Miami US 2827300 N 1518971,500 Rangoon Burma 2800000 Y 608553,380 Manchester UK 2775000 N 1656815,800 Houston US 2755100 N 507055,280 Hyderabad India 2750000 N 78822,547 Dallas US 2727300 N 713680,750 Birmingham UK 2675000 N 1578003,500 Harbin China 2670000 N 249304,810 Recife Brazil 2625000 N 2180440,200 Porto Alegre Brazil 2600000 N 4079509,500 Budapest Hungary 2565000 Y 178917,390 Algiers Algeria 2547983 Y 669546,120 Casablanca Morocco 2475000 N 320064,410 Chongqing China 2450000 N 604239,500 Ankara Turkey 2400000 Y 348181,750 Ahmadabad India 2400000 N 242905,330
115
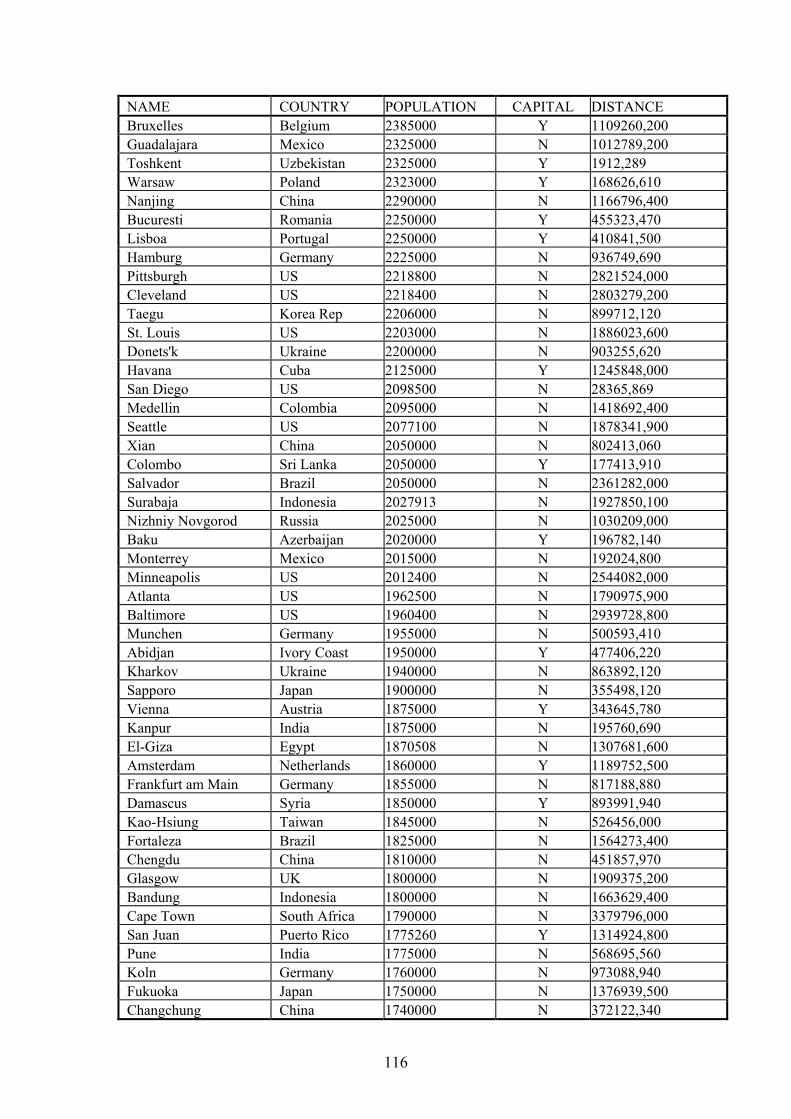
NAME COUNTRY POPULATION CAPITAL DISTANCE Bruxelles Belgium 2385000 Y 1109260,200 Guadalajara Mexico 2325000 N 1012789,200 Toshkent Uzbekistan 2325000 Y 1912,289 Warsaw Poland 2323000 Y 168626,610 Nanjing China 2290000 N 1166796,400 Bucuresti Romania 2250000 Y 455323,470 Lisboa Portugal 2250000 Y 410841,500 Hamburg Germany 2225000 N 936749,690 Pittsburgh US 2218800 N 2821524,000 Cleveland US 2218400 N 2803279,200 Taegu Korea Rep 2206000 N 899712,120 St. Louis US 2203000 N 1886023,600 Donets'k Ukraine 2200000 N 903255,620 Havana Cuba 2125000 Y 1245848,000 San Diego US 2098500 N 28365,869 Medellin Colombia 2095000 N 1418692,400 Seattle US 2077100 N 1878341,900 Xian China 2050000 N 802413,060 Colombo Sri Lanka 2050000 Y 177413,910 Salvador Brazil 2050000 N 2361282,000 Surabaja Indonesia 2027913 N 1927850,100 Nizhniy Novgorod Russia 2025000 N 1030209,000 Baku Azerbaijan 2020000 Y 196782,140 Monterrey Mexico 2015000 N 192024,800 Minneapolis US 2012400 N 2544082,000 Atlanta US 1962500 N 1790975,900 Baltimore US 1960400 N 2939728,800 Munchen Germany 1955000 N 500593,410 Abidjan Ivory Coast 1950000 Y 477406,220 Kharkov Ukraine 1940000 N 863892,120 Sapporo Japan 1900000 N 355498,120 Vienna Austria 1875000 Y 343645,780 Kanpur India 1875000 N 195760,690 El-Giza Egypt 1870508 N 1307681,600 Amsterdam Netherlands 1860000 Y 1189752,500 Frankfurt am Main Germany 1855000 N 817188,880 Damascus Syria 1850000 Y 893991,940 Kao-Hsiung Taiwan 1845000 N 526456,000 Fortaleza Brazil 1825000 N 1564273,400 Chengdu China 1810000 N 451857,970 Glasgow UK 1800000 N 1909375,200 Bandung Indonesia 1800000 N 1663629,400 Cape Town South Africa 1790000 N 3379796,000 San Juan Puerto Rico 1775260 Y 1314924,800 Pune India 1775000 N 568695,560 Koln Germany 1760000 N 973088,940 Fukuoka Japan 1750000 N 1376939,500 Changchung China 1740000 N 372122,340
116
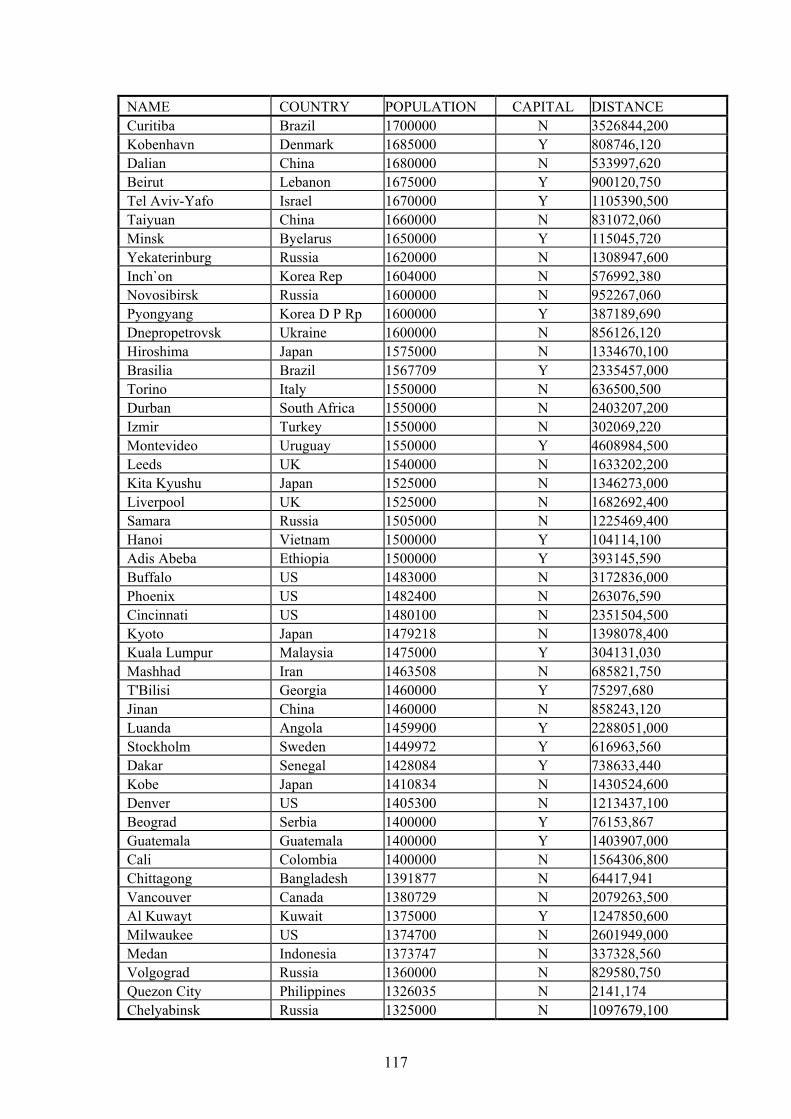
NAME COUNTRY POPULATION CAPITAL DISTANCE Curitiba Brazil 1700000 N 3526844,200 Kobenhavn Denmark 1685000 Y 808746,120 Dalian China 1680000 N 533997,620 Beirut Lebanon 1675000 Y 900120,750 Tel Aviv-Yafo Israel 1670000 Y 1105390,500 Taiyuan China 1660000 N 831072,060 Minsk Byelarus 1650000 Y 115045,720 Yekaterinburg Russia 1620000 N 1308947,600 Inch`on Korea Rep 1604000 N 576992,380 Novosibirsk Russia 1600000 N 952267,060 Pyongyang Korea D P Rp 1600000 Y 387189,690 Dnepropetrovsk Ukraine 1600000 N 856126,120 Hiroshima Japan 1575000 N 1334670,100 Brasilia Brazil 1567709 Y 2335457,000 Torino Italy 1550000 N 636500,500 Durban South Africa 1550000 N 2403207,200 Izmir Turkey 1550000 N 302069,220 Montevideo Uruguay 1550000 Y 4608984,500 Leeds UK 1540000 N 1633202,200 Kita Kyushu Japan 1525000 N 1346273,000 Liverpool UK 1525000 N 1682692,400 Samara Russia 1505000 N 1225469,400 Hanoi Vietnam 1500000 Y 104114,100 Adis Abeba Ethiopia 1500000 Y 393145,590 Buffalo US 1483000 N 3172836,000 Phoenix US 1482400 N 263076,590 Cincinnati US 1480100 N 2351504,500 Kyoto Japan 1479218 N 1398078,400 Kuala Lumpur Malaysia 1475000 Y 304131,030 Mashhad Iran 1463508 N 685821,750 T'Bilisi Georgia 1460000 Y 75297,680 Jinan China 1460000 N 858243,120 Luanda Angola 1459900 Y 2288051,000 Stockholm Sweden 1449972 Y 616963,560 Dakar Senegal 1428084 Y 738633,440 Kobe Japan 1410834 N 1430524,600 Denver US 1405300 N 1213437,100 Beograd Serbia 1400000 Y 76153,867 Guatemala Guatemala 1400000 Y 1403907,000 Cali Colombia 1400000 N 1564306,800 Chittagong Bangladesh 1391877 N 64417,941 Vancouver Canada 1380729 N 2079263,500 Al Kuwayt Kuwait 1375000 Y 1247850,600 Milwaukee US 1374700 N 2601949,000 Medan Indonesia 1373747 N 337328,560 Volgograd Russia 1360000 N 829580,750 Quezon City Philippines 1326035 N 2141,174 Chelyabinsk Russia 1325000 N 1097679,100
117
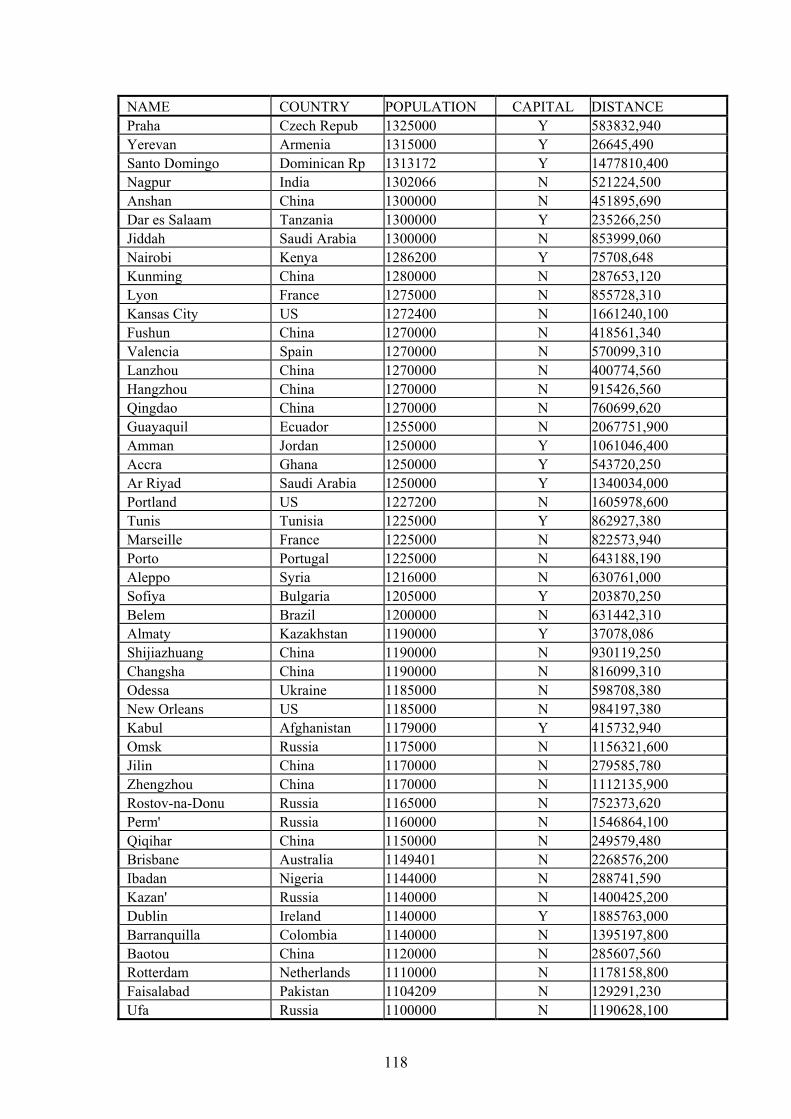
NAME COUNTRY POPULATION CAPITAL DISTANCE Praha Czech Repub 1325000 Y 583832,940 Yerevan Armenia 1315000 Y 26645,490 Santo Domingo Dominican Rp 1313172 Y 1477810,400 Nagpur India 1302066 N 521224,500 Anshan China 1300000 N 451895,690 Dar es Salaam Tanzania 1300000 Y 235266,250 Jiddah Saudi Arabia 1300000 N 853999,060 Nairobi Kenya 1286200 Y 75708,648 Kunming China 1280000 N 287653,120 Lyon France 1275000 N 855728,310 Kansas City US 1272400 N 1661240,100 Fushun China 1270000 N 418561,340 Valencia Spain 1270000 N 570099,310 Lanzhou China 1270000 N 400774,560 Hangzhou China 1270000 N 915426,560 Qingdao China 1270000 N 760699,620 Guayaquil Ecuador 1255000 N 2067751,900 Amman Jordan 1250000 Y 1061046,400 Accra Ghana 1250000 Y 543720,250 Ar Riyad Saudi Arabia 1250000 Y 1340034,000 Portland US 1227200 N 1605978,600 Tunis Tunisia 1225000 Y 862927,380 Marseille France 1225000 N 822573,940 Porto Portugal 1225000 N 643188,190 Aleppo Syria 1216000 N 630761,000 Sofiya Bulgaria 1205000 Y 203870,250 Belem Brazil 1200000 N 631442,310 Almaty Kazakhstan 1190000 Y 37078,086 Shijiazhuang China 1190000 N 930119,250 Changsha China 1190000 N 816099,310 Odessa Ukraine 1185000 N 598708,380 New Orleans US 1185000 N 984197,380 Kabul Afghanistan 1179000 Y 415732,940 Omsk Russia 1175000 N 1156321,600 Jilin China 1170000 N 279585,780 Zhengzhou China 1170000 N 1112135,900 Rostov-na-Donu Russia 1165000 N 752373,620 Perm' Russia 1160000 N 1546864,100 Qiqihar China 1150000 N 249579,480 Brisbane Australia 1149401 N 2268576,200 Ibadan Nigeria 1144000 N 288741,590 Kazan' Russia 1140000 N 1400425,200 Dublin Ireland 1140000 Y 1885763,000 Barranquilla Colombia 1140000 N 1395197,800 Baotou China 1120000 N 285607,560 Rotterdam Netherlands 1110000 N 1178158,800 Faisalabad Pakistan 1104209 N 129291,230 Ufa Russia 1100000 N 1190628,100
118
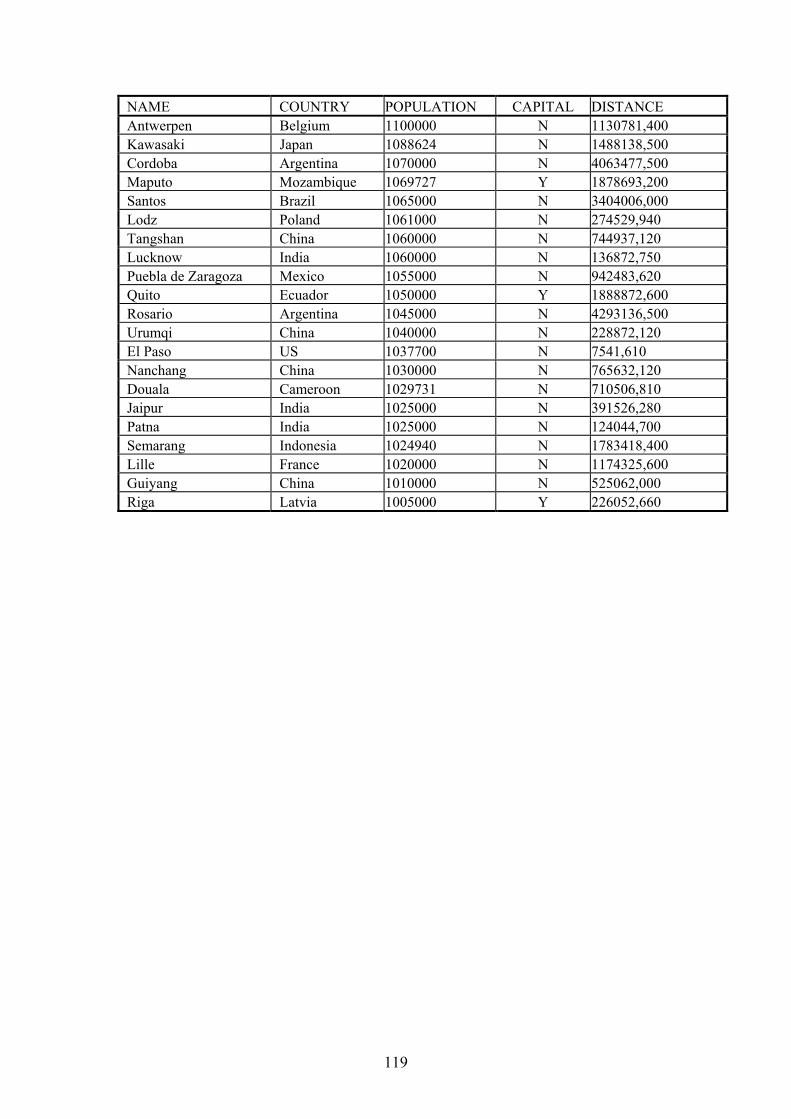
NAME COUNTRY POPULATION CAPITAL DISTANCE Antwerpen Belgium 1100000 N 1130781,400 Kawasaki Japan 1088624 N 1488138,500 Cordoba Argentina 1070000 N 4063477,500 Maputo Mozambique 1069727 Y 1878693,200 Santos Brazil 1065000 N 3404006,000 Lodz Poland 1061000 N 274529,940 Tangshan China 1060000 N 744937,120 Lucknow India 1060000 N 136872,750 Puebla de Zaragoza Mexico 1055000 N 942483,620 Quito Ecuador 1050000 Y 1888872,600 Rosario Argentina 1045000 N 4293136,500 Urumqi China 1040000 N 228872,120 El Paso US 1037700 N 7541,610 Nanchang China 1030000 N 765632,120 Douala Cameroon 1029731 N 710506,810 Jaipur India 1025000 N 391526,280 Patna India 1025000 N 124044,700 Semarang Indonesia 1024940 N 1783418,400 Lille France 1020000 N 1174325,600 Guiyang China 1010000 N 525062,000 Riga Latvia 1005000 Y 226052,660
119
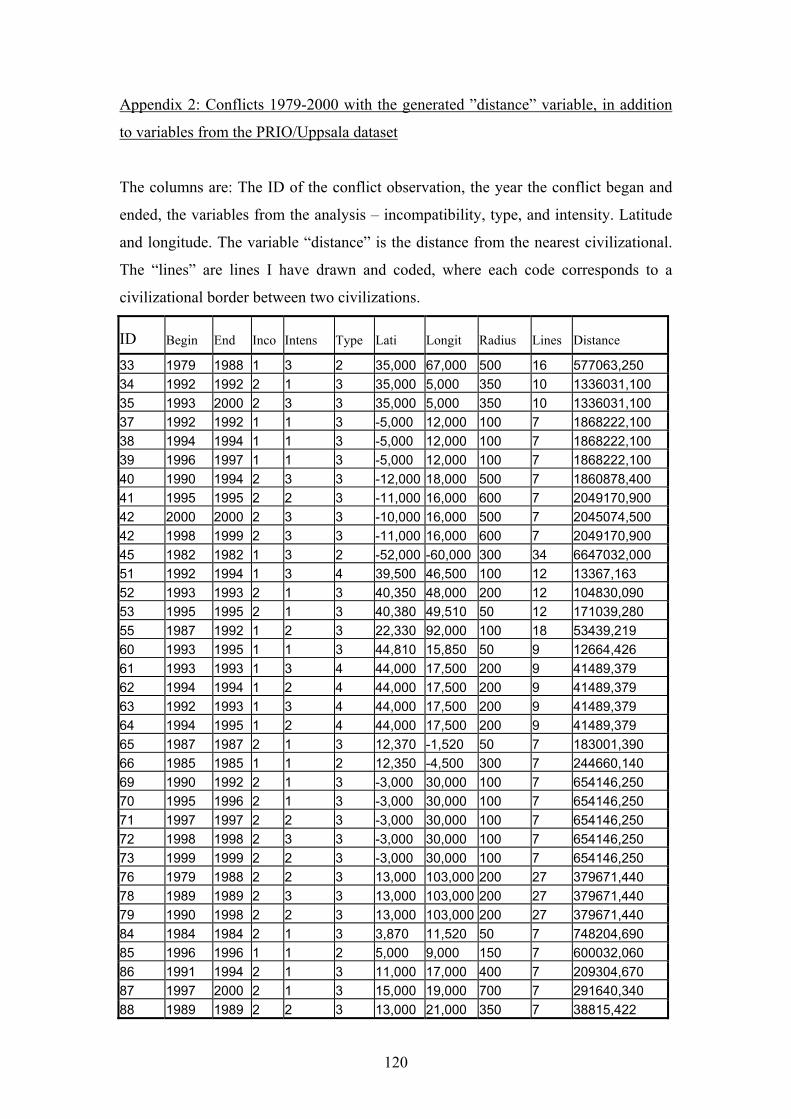
Appendix 2: Conflicts 1979-2000 with the generated ”distance” variable, in addition
to variables from the PRIO/Uppsala dataset
The columns are: The ID of the conflict observation, the year the conflict began and
ended, the variables from the analysis – incompatibility, type, and intensity. Latitude
and longitude. The variable “distance” is the distance from the nearest civilizational.
The “lines” are lines I have drawn and coded, where each code corresponds to a
civilizational border between two civilizations.
ID Begin End Inco Intens Type Lati Longit Radius Lines Distance
33 1979 1988 1 3 2 35,000 67,000 500 16 577063,250 34 1992 1992 2 1 3 35,000 5,000 350 10 1336031,100 35 1993 2000 2 3 3 35,000 5,000 350 10 1336031,100 37 1992 1992 1 1 3 -5,000 12,000 100 7 1868222,100 38 1994 1994 1 1 3 -5,000 12,000 100 7 1868222,100 39 1996 1997 1 1 3 -5,000 12,000 100 7 1868222,100 40 1990 1994 2 3 3 -12,000 18,000 500 7 1860878,400 41 1995 1995 2 2 3 -11,000 16,000 600 7 2049170,900 42 2000 2000 2 3 3 -10,000 16,000 500 7 2045074,500 42 1998 1999 2 3 3 -11,000 16,000 600 7 2049170,900 45 1982 1982 1 3 2 -52,000 -60,000 300 34 6647032,000 51 1992 1994 1 3 4 39,500 46,500 100 12 13367,163 52 1993 1993 2 1 3 40,350 48,000 200 12 104830,090 53 1995 1995 2 1 3 40,380 49,510 50 12 171039,280 55 1987 1992 1 2 3 22,330 92,000 100 18 53439,219 60 1993 1995 1 1 3 44,810 15,850 50 9 12664,426 61 1993 1993 1 3 4 44,000 17,500 200 9 41489,379 62 1994 1994 1 2 4 44,000 17,500 200 9 41489,379 63 1992 1993 1 3 4 44,000 17,500 200 9 41489,379 64 1994 1995 1 2 4 44,000 17,500 200 9 41489,379 65 1987 1987 2 1 3 12,370 -1,520 50 7 183001,390 66 1985 1985 1 1 2 12,350 -4,500 300 7 244660,140 69 1990 1992 2 1 3 -3,000 30,000 100 7 654146,250 70 1995 1996 2 1 3 -3,000 30,000 100 7 654146,250 71 1997 1997 2 2 3 -3,000 30,000 100 7 654146,250 72 1998 1998 2 3 3 -3,000 30,000 100 7 654146,250 73 1999 1999 2 2 3 -3,000 30,000 100 7 654146,250 76 1979 1988 2 2 3 13,000 103,000 200 27 379671,440 78 1989 1989 2 3 3 13,000 103,000 200 27 379671,440 79 1990 1998 2 2 3 13,000 103,000 200 27 379671,440 84 1984 1984 2 1 3 3,870 11,520 50 7 748204,690 85 1996 1996 1 1 2 5,000 9,000 150 7 600032,060 86 1991 1994 2 1 3 11,000 17,000 400 7 209304,670 87 1997 2000 2 1 3 15,000 19,000 700 7 291640,340 88 1989 1989 2 2 3 13,000 21,000 350 7 38815,422
120
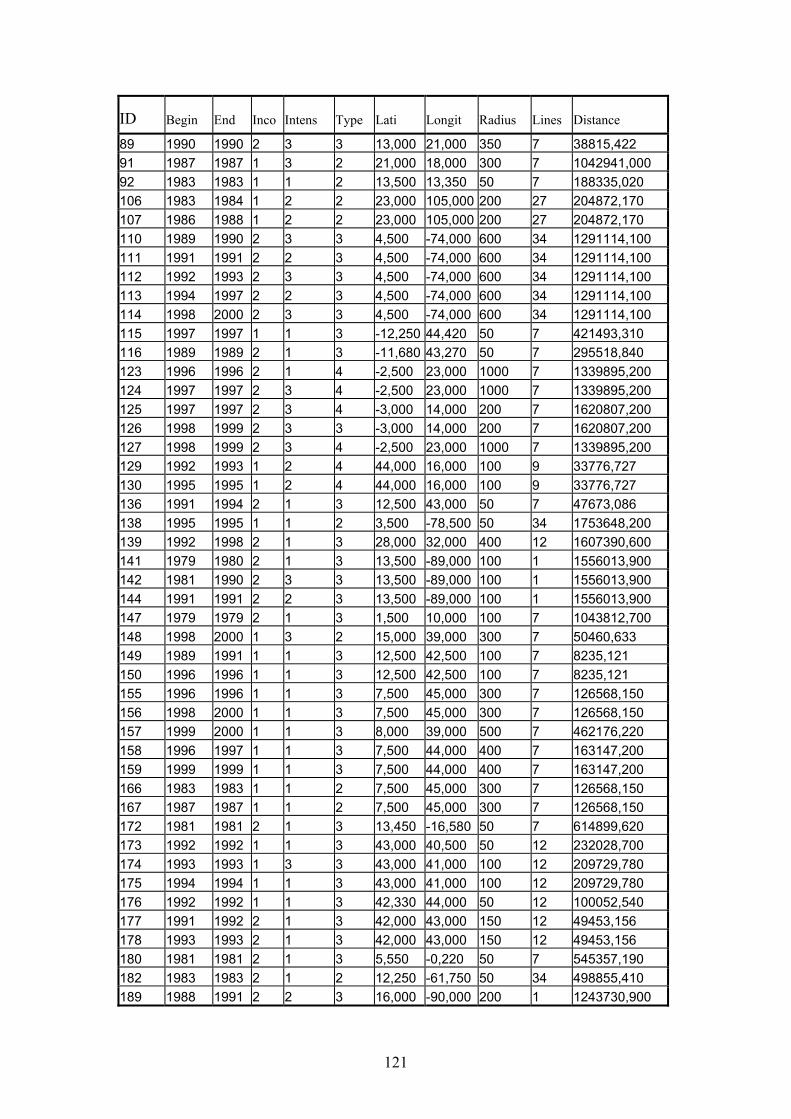
ID Begin End Inco Intens Type Lati Longit Radius Lines Distance
89 1990 1990 2 3 3 13,000 21,000 350 7 38815,422 91 1987 1987 1 3 2 21,000 18,000 300 7 1042941,000 92 1983 1983 1 1 2 13,500 13,350 50 7 188335,020 106 1983 1984 1 2 2 23,000 105,000 200 27 204872,170 107 1986 1988 1 2 2 23,000 105,000 200 27 204872,170 110 1989 1990 2 3 3 4,500 -74,000 600 34 1291114,100 111 1991 1991 2 2 3 4,500 -74,000 600 34 1291114,100 112 1992 1993 2 3 3 4,500 -74,000 600 34 1291114,100 113 1994 1997 2 2 3 4,500 -74,000 600 34 1291114,100 114 1998 2000 2 3 3 4,500 -74,000 600 34 1291114,100 115 1997 1997 1 1 3 -12,250 44,420 50 7 421493,310 116 1989 1989 2 1 3 -11,680 43,270 50 7 295518,840 123 1996 1996 2 1 4 -2,500 23,000 1000 7 1339895,200 124 1997 1997 2 3 4 -2,500 23,000 1000 7 1339895,200 125 1997 1997 2 3 4 -3,000 14,000 200 7 1620807,200 126 1998 1999 2 3 3 -3,000 14,000 200 7 1620807,200 127 1998 1999 2 3 4 -2,500 23,000 1000 7 1339895,200 129 1992 1993 1 2 4 44,000 16,000 100 9 33776,727 130 1995 1995 1 2 4 44,000 16,000 100 9 33776,727 136 1991 1994 2 1 3 12,500 43,000 50 7 47673,086 138 1995 1995 1 1 2 3,500 -78,500 50 34 1753648,200 139 1992 1998 2 1 3 28,000 32,000 400 12 1607390,600 141 1979 1980 2 1 3 13,500 -89,000 100 1 1556013,900 142 1981 1990 2 3 3 13,500 -89,000 100 1 1556013,900 144 1991 1991 2 2 3 13,500 -89,000 100 1 1556013,900 147 1979 1979 2 1 3 1,500 10,000 100 7 1043812,700 148 1998 2000 1 3 2 15,000 39,000 300 7 50460,633 149 1989 1991 1 1 3 12,500 42,500 100 7 8235,121 150 1996 1996 1 1 3 12,500 42,500 100 7 8235,121 155 1996 1996 1 1 3 7,500 45,000 300 7 126568,150 156 1998 2000 1 1 3 7,500 45,000 300 7 126568,150 157 1999 2000 1 1 3 8,000 39,000 500 7 462176,220 158 1996 1997 1 1 3 7,500 44,000 400 7 163147,200 159 1999 1999 1 1 3 7,500 44,000 400 7 163147,200 166 1983 1983 1 1 2 7,500 45,000 300 7 126568,150 167 1987 1987 1 1 2 7,500 45,000 300 7 126568,150 172 1981 1981 2 1 3 13,450 -16,580 50 7 614899,620 173 1992 1992 1 1 3 43,000 40,500 50 12 232028,700 174 1993 1993 1 3 3 43,000 41,000 100 12 209729,780 175 1994 1994 1 1 3 43,000 41,000 100 12 209729,780 176 1992 1992 1 1 3 42,330 44,000 50 12 100052,540 177 1991 1992 2 1 3 42,000 43,000 150 12 49453,156 178 1993 1993 2 1 3 42,000 43,000 150 12 49453,156 180 1981 1981 2 1 3 5,550 -0,220 50 7 545357,190 182 1983 1983 2 1 2 12,250 -61,750 50 34 498855,410 189 1988 1991 2 2 3 16,000 -90,000 200 1 1243730,900
121
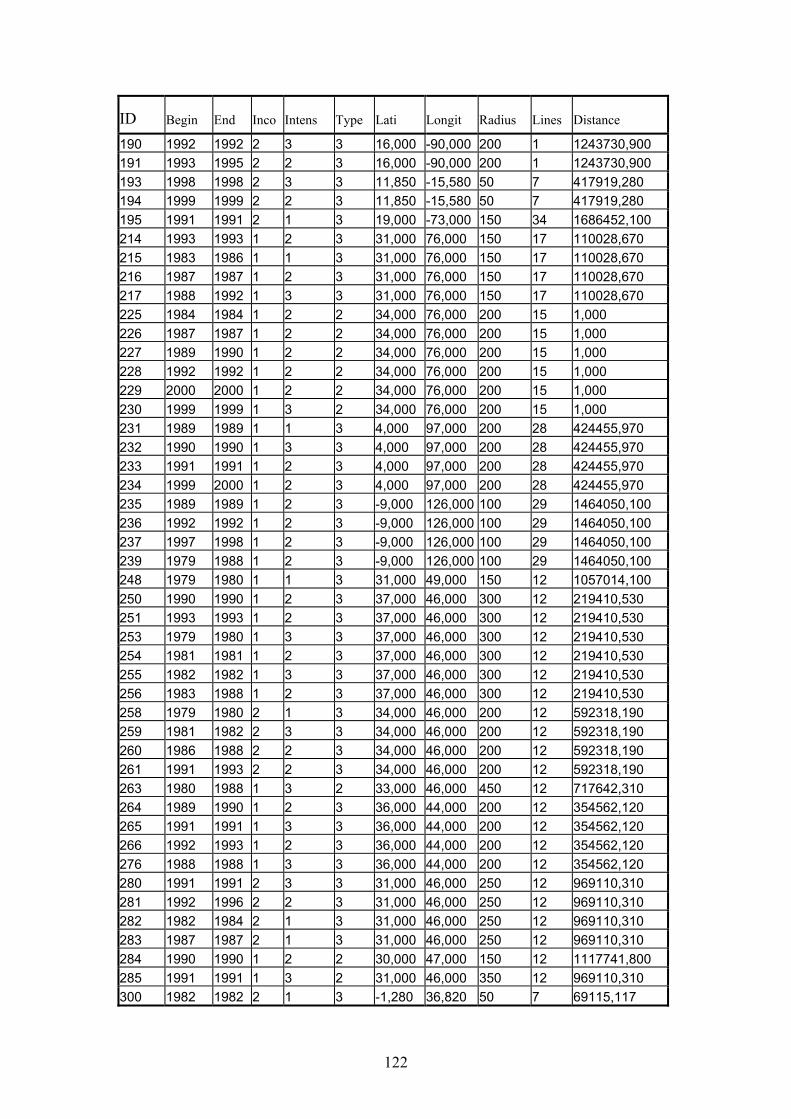
ID Begin End Inco Intens Type Lati Longit Radius Lines Distance
190 1992 1992 2 3 3 16,000 -90,000 200 1 1243730,900 191 1993 1995 2 2 3 16,000 -90,000 200 1 1243730,900 193 1998 1998 2 3 3 11,850 -15,580 50 7 417919,280 194 1999 1999 2 2 3 11,850 -15,580 50 7 417919,280 195 1991 1991 2 1 3 19,000 -73,000 150 34 1686452,100 214 1993 1993 1 2 3 31,000 76,000 150 17 110028,670 215 1983 1986 1 1 3 31,000 76,000 150 17 110028,670 216 1987 1987 1 2 3 31,000 76,000 150 17 110028,670 217 1988 1992 1 3 3 31,000 76,000 150 17 110028,670 225 1984 1984 1 2 2 34,000 76,000 200 15 1,000 226 1987 1987 1 2 2 34,000 76,000 200 15 1,000 227 1989 1990 1 2 2 34,000 76,000 200 15 1,000 228 1992 1992 1 2 2 34,000 76,000 200 15 1,000 229 2000 2000 1 2 2 34,000 76,000 200 15 1,000 230 1999 1999 1 3 2 34,000 76,000 200 15 1,000 231 1989 1989 1 1 3 4,000 97,000 200 28 424455,970 232 1990 1990 1 3 3 4,000 97,000 200 28 424455,970 233 1991 1991 1 2 3 4,000 97,000 200 28 424455,970 234 1999 2000 1 2 3 4,000 97,000 200 28 424455,970 235 1989 1989 1 2 3 -9,000 126,000 100 29 1464050,100 236 1992 1992 1 2 3 -9,000 126,000 100 29 1464050,100 237 1997 1998 1 2 3 -9,000 126,000 100 29 1464050,100 239 1979 1988 1 2 3 -9,000 126,000 100 29 1464050,100 248 1979 1980 1 1 3 31,000 49,000 150 12 1057014,100 250 1990 1990 1 2 3 37,000 46,000 300 12 219410,530 251 1993 1993 1 2 3 37,000 46,000 300 12 219410,530 253 1979 1980 1 3 3 37,000 46,000 300 12 219410,530 254 1981 1981 1 2 3 37,000 46,000 300 12 219410,530 255 1982 1982 1 3 3 37,000 46,000 300 12 219410,530 256 1983 1988 1 2 3 37,000 46,000 300 12 219410,530 258 1979 1980 2 1 3 34,000 46,000 200 12 592318,190 259 1981 1982 2 3 3 34,000 46,000 200 12 592318,190 260 1986 1988 2 2 3 34,000 46,000 200 12 592318,190 261 1991 1993 2 2 3 34,000 46,000 200 12 592318,190 263 1980 1988 1 3 2 33,000 46,000 450 12 717642,310 264 1989 1990 1 2 3 36,000 44,000 200 12 354562,120 265 1991 1991 1 3 3 36,000 44,000 200 12 354562,120 266 1992 1993 1 2 3 36,000 44,000 200 12 354562,120 276 1988 1988 1 3 3 36,000 44,000 200 12 354562,120 280 1991 1991 2 3 3 31,000 46,000 250 12 969110,310 281 1992 1996 2 2 3 31,000 46,000 250 12 969110,310 282 1982 1984 2 1 3 31,000 46,000 250 12 969110,310 283 1987 1987 2 1 3 31,000 46,000 250 12 969110,310 284 1990 1990 1 2 2 30,000 47,000 150 12 1117741,800 285 1991 1991 1 3 2 31,000 46,000 350 12 969110,310 300 1982 1982 2 1 3 -1,280 36,820 50 7 69115,117
122
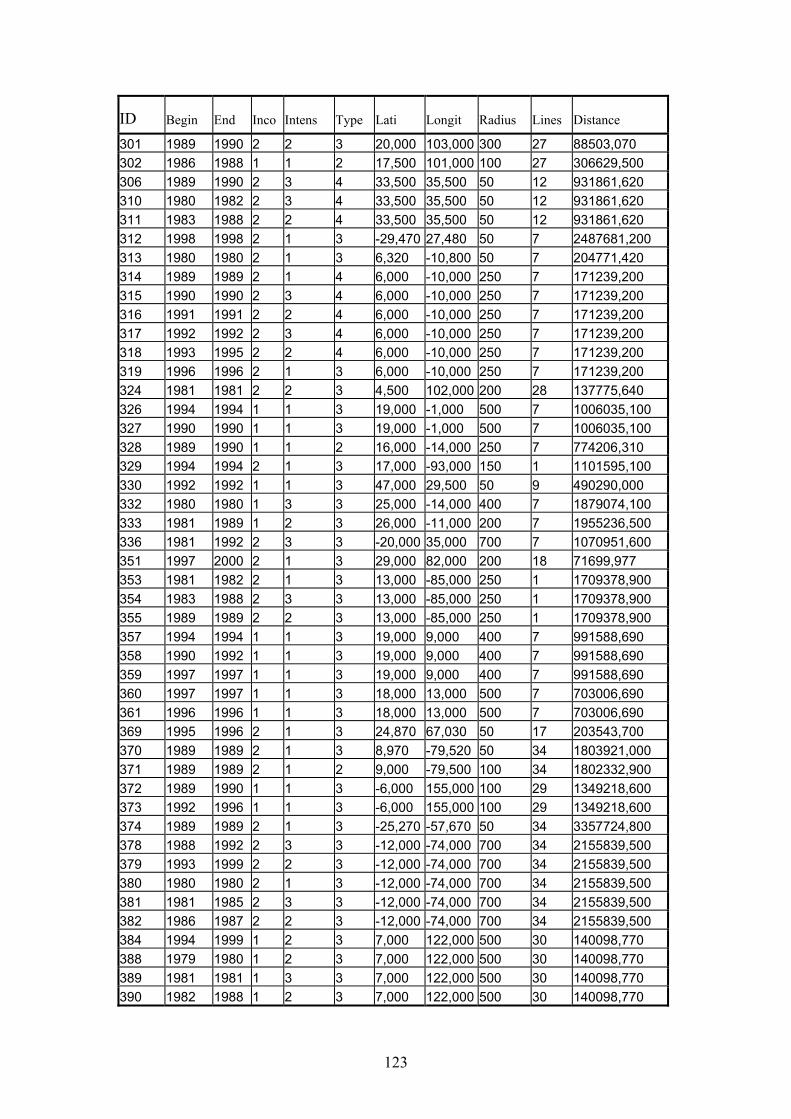
ID Begin End Inco Intens Type Lati Longit Radius Lines Distance
301 1989 2 2 3 20,000 103,000 27 88503,070 302 1986 1 1 2 17,500 101,000 27 306629,500 306 1989 2 3 4 33,500 35,500 12 931861,620 310 1980 2 3 4 33,500 35,500 12 931861,620 311 1983 2 2 4 33,500 35,500 12 931861,620 312 1998 2 1 3 -29,470 27,480 7 2487681,200 313 1980 2 1 3 6,320 -10,800 7 204771,420 314 1989 2 1 4 6,000 -10,000 7 171239,200 315 1990 2 3 4 6,000 -10,000 7 171239,200 316 1991 2 2 4 6,000 -10,000 7 171239,200 317 1992 2 3 4 6,000 -10,000 7 171239,200 318 1993 2 2 4 6,000 -10,000 7 171239,200 319 1996 2 1 3 6,000 -10,000 7 171239,200 324 1981 2 2 3 4,500 102,000 28 137775,640 326 1994 1 1 3 19,000 -1,000 7 1006035,100 327 1990 1 1 3 19,000 -1,000 7 1006035,100 328 1989 1 1 2 16,000 -14,000 7 774206,310 329 1994 2 1 3 17,000 -93,000 1 1101595,100 330 1992 1 1 3 47,000 29,500 9 490290,000 332 1980 1 3 3 25,000 -14,000 7 1879074,100 333 1981 1 2 3 26,000 -11,000 7 1955236,500 336 1981 2 3 3 -20,000 35,000 7 1070951,600 351 1997 2 1 3 29,000 82,000 18 71699,977 353 1981 2 1 3 13,000 -85,000 1 1709378,900 354 1983 2 3 3 13,000 -85,000 1 1709378,900 355 1989 2 2 3 13,000 -85,000 1 1709378,900 357 1994 1 1 3 19,000 9,000 7 991588,690 358 1990 1 1 3 19,000 9,000 7 991588,690 359 1997 1 1 3 19,000 9,000 7 991588,690 360 1997 1 1 3 18,000 13,000 7 703006,690 361 1996 1 1 3 18,000 13,000 7 703006,690 369 1995 2 1 3 24,870 67,030 17 203543,700 370 1989 2 1 3 8,970 -79,520 34 1803921,000 371 1989 2 1 2 9,000 -79,500 34 1802332,900 372 1989 1 1 3 -6,000 155,000 29 1349218,600 373 1992 1 1 3 -6,000 155,000 29 1349218,600 374 1989 2 1 3 -25,270 -57,670 34 3357724,800 378 1988 2 3 3 -12,000 -74,000 34 2155839,500 379 1993 2 2 3 -12,000 -74,000 34 2155839,500 380 1980 2 1 3 -12,000 -74,000 34 2155839,500 381 1981 2 3 3 -12,000 -74,000 34 2155839,500 382 1986 2 2 3 -12,000 -74,000 34 2155839,500 384 1994 1 2 3 7,000 122,000 30 140098,770 388 1979 1 2 3 7,000 122,000 30 140098,770 389 1981 1 3 3 7,000 122,000 30 140098,770 390 1982 1 2 3 7,000 122,000 30 140098,770
1990 300 1988 100 1990 50 1982 50 1988 50 1998 50 1980 50 1989 250 1990 250 1991 250 1992 250 1995 250 1996 250 1981 200 1994 500 1990 500 1990 250 1994 150 1992 50 1980 400 1989 200 1992 700 2000 200 1982 250 1988 250 1989 250 1994 400 1992 400 1997 400 1997 500 1996 500 1996 50 1989 50 1989 100 1990 100 1996 100 1989 50 1992 700 1999 700 1980 700 1985 700 1987 700 1999 500 1980 500 1981 500 1988 500
123
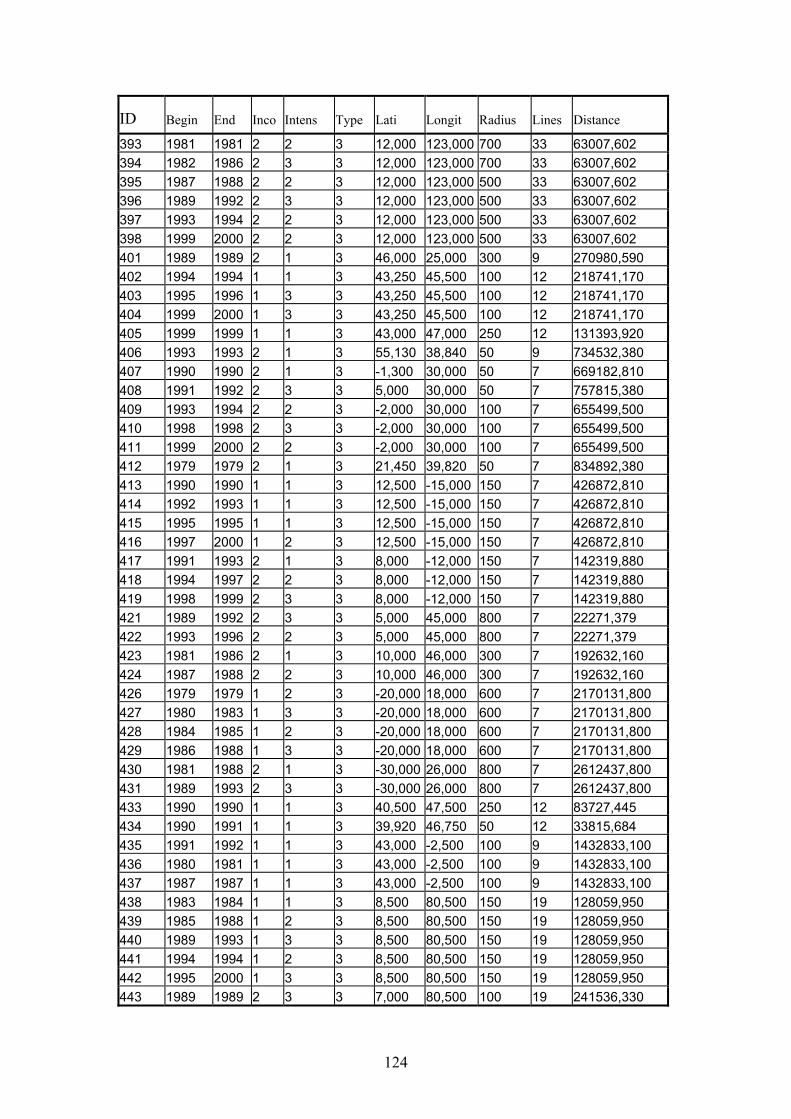
ID Begin End Inco Intens Type Lati Radius Lines Distance
393 1981 1981 2 2 3 12,000 123,000 700 33 63007,602 394 1982 1986 2 3 3 12,000 123,000 700 33 63007,602 395 1987 1988 2 2 3 12,000 123,000 500 33 63007,602 396 1989 1992 2 3 3 12,000 123,000 500 33 63007,602 397 1993 1994 2 2 3 12,000 123,000 500 33 63007,602 398 1999 2000 2 2 3 12,000 123,000 500 33 63007,602 401 1989 1989 2 1 3 46,000 25,000 300 9 270980,590 402 1994 1994 1 1 3 43,250 45,500 100 12 218741,170 403 1995 1996 1 3 3 43,250 45,500 100 12 218741,170 404 1999 2000 1 3 3 43,250 45,500 100 12 218741,170 405 1999 1999 1 1 3 43,000 47,000 250 12 131393,920 406 1993 1993 2 1 3 55,130 38,840 50 9 734532,380 407 1990 1990 2 1 3 -1,300 30,000 50 7 669182,810 408 1991 1992 2 3 3 5,000 30,000 50 7 757815,380 409 1993 1994 2 2 3 -2,000 30,000 100 7 655499,500 410 1998 1998 2 3 3 -2,000 30,000 100 7 655499,500 411 1999 2000 2 2 3 -2,000 30,000 100 7 655499,500 412 1979 1979 2 1 3 21,450 39,820 50 7 834892,380 413 1990 1990 1 1 3 12,500 -15,000 150 7 426872,810 414 1992 1993 1 1 3 12,500 -15,000 150 7 426872,810 415 1995 1995 1 1 3 12,500 -15,000 150 7 426872,810 416 1997 2000 1 2 3 12,500 -15,000 150 7 426872,810 417 1991 1993 2 1 3 8,000 -12,000 150 7 142319,880 418 1994 1997 2 3 8,000 -12,000 150 7 142319,880 419 1998 1999 2 3 3 8,000 -12,000 150 7 142319,880 421 1989 1992 2 3 3 5,000 45,000 800 7 22271,379 422 1993 1996 2 2 3 5,000 45,000 800 7 22271,379 423 1981 1986 2 1 3 10,000 46,000 300 7 192632,160 424 1987 1988 2 2 3 10,000 46,000 300 7 192632,160 426 1979 1979 1 2 3 -20,000 18,000 600 7 2170131,800 427 1980 1983 1 3 3 -20,000 18,000 600 7 2170131,800 428 1984 1985 1 2 3 -20,000 18,000 600 7 2170131,800 429 1986 1988 1 3 3 -20,000 18,000 600 7 2170131,800 430 1981 1988 2 1 3 -30,000 26,000 800 7 2612437,800 431 1989 1993 2 3 3 -30,000 26,000 800 7 2612437,800 433 1990 1990 1 1 3 40,500 47,500 250 12 83727,445 434 1990 1991 1 1 3 39,920 46,750 50 12 33815,684 435 1991 1992 1 1 3 43,000 -2,500 100 9 1432833,100 436 1980 1981 1 1 3 43,000 -2,500 100 9 1432833,100 437 1987 1987 1 1 3 43,000 -2,500 100 9 1432833,100 438 1983 1984 1 1 3 8,500 80,500 150 19 128059,950 439 1985 1988 1 2 3 8,500 80,500 150 19 128059,950 440 1989 1993 1 3 3 8,500 80,500 150 19 128059,950 441 1994 1994 1 2 3 8,500 80,500 150 19 128059,950 442 1995 2000 1 3 3 8,500 80,500 150 19 128059,950 443 1989 1989 2 3 3 7,000 80,500 100 19 241536,330
Longit
2
124
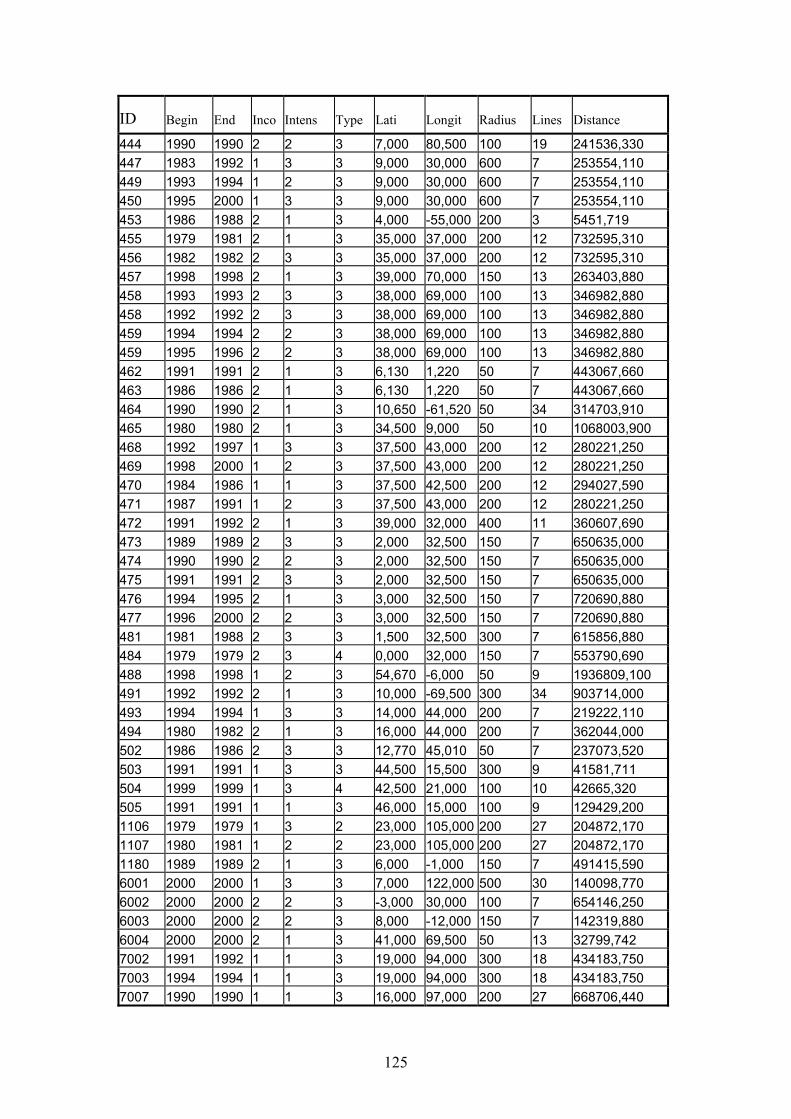
ID Begin End Inco Intens Type Lati Radius Lines Distance
444 1990 1990 2 2 3 7,000 80,500 100 19 241536,330 447 1983 1992 1 3 3 9,000 30,000 600 7 253554,110 449 1993 1994 1 2 3 9,000 30,000 600 7 253554,110 450 1995 2000 1 3 3 9,000 30,000 600 7 253554,110 453 1986 1988 2 1 3 4,000 -55,000 200 3 5451,719 455 1979 1981 2 1 3 35,000 37,000 200 12 732595,310 456 1982 1982 2 3 3 35,000 37,000 200 12 732595,310 457 1998 1998 2 1 3 39,000 70,000 150 13 263403,880 458 1993 1993 2 3 3 38,000 69,000 100 13 346982,880 458 1992 1992 2 3 3 38,000 69,000 100 13 346982,880 459 1994 1994 2 2 3 38,000 69,000 100 13 346982,880 459 1995 1996 2 2 3 38,000 69,000 100 13 346982,880 462 1991 1991 2 1 3 6,130 1,220 50 7 443067,660 463 1986 1986 2 1 3 6,130 1,220 50 7 443067,660 464 1990 1990 2 1 3 10,650 -61,520 50 34 314703,910 465 1980 1980 2 1 3 34,500 9,000 50 10 1068003,900 468 1992 1997 1 3 3 37,500 43,000 200 12 280221,250 469 1998 2000 1 2 3 37,500 43,000 200 12 280221,250 470 1984 1986 1 1 3 37,500 42,500 200 12 294027,590 471 1987 1991 1 2 3 37,500 43,000 200 12 280221,250 472 1991 1992 2 1 3 39,000 32,000 400 11 360607,690 473 1989 1989 2 3 3 2,000 32,500 150 7 650635,000 474 1990 1990 2 2 3 2,000 32,500 150 7 650635,000 475 1991 1991 2 3 3 2,000 32,500 150 7 650635,000 476 1994 1995 2 1 3 3,000 32,500 150 7 720690,880 477 1996 2000 2 2 3 3,000 32,500 150 7 720690,880 481 1981 1988 2 3 3 1,500 32,500 300 7 615856,880 484 1979 1979 2 3 4 0,000 32,000 150 7 553790,690 488 1998 1998 1 2 3 54,670 -6,000 50 9 1936809,100 491 1992 1992 2 1 3 10,000 -69,500 300 34 903714,000 493 1994 1994 1 3 3 14,000 44,000 200 7 219222,110 494 1980 1982 2 1 3 16,000 44,000 200 7 362044,000 502 1986 1986 2 3 3 12,770 45,010 50 7 237073,520 503 1991 1991 1 3 3 44,500 15,500 300 9 41581,711 504 1999 1999 1 3 4 42,500 21,000 100 10 42665,320 505 1991 1991 1 1 3 46,000 15,000 100 9 129429,200 1106 1979 1979 1 3 2 23,000 105,000 200 27 204872,170 1107 1980 1981 1 2 2 23,000 105,000 200 27 204872,170 1180 1989 1989 2 1 3 6,000 -1,000 150 7 491415,590 6001 2000 2000 1 3 3 7,000 122,000 500 30 140098,770 6002 2000 2000 2 2 3 -3,000 30,000 100 7 654146,250 6003 2000 2000 2 2 3 8,000 -12,000 150 7 142319,880 6004 2000 2000 2 1 3 41,000 69,500 50 13 32799,742 7002 1991 1992 1 1 3 19,000 94,000 300 18 434183,750 7003 1994 1994 1 1 3 19,000 94,000 300 18 434183,750 7007 1990 1990 1 1 3 16,000 97,000 200 27 668706,440
Longit
125
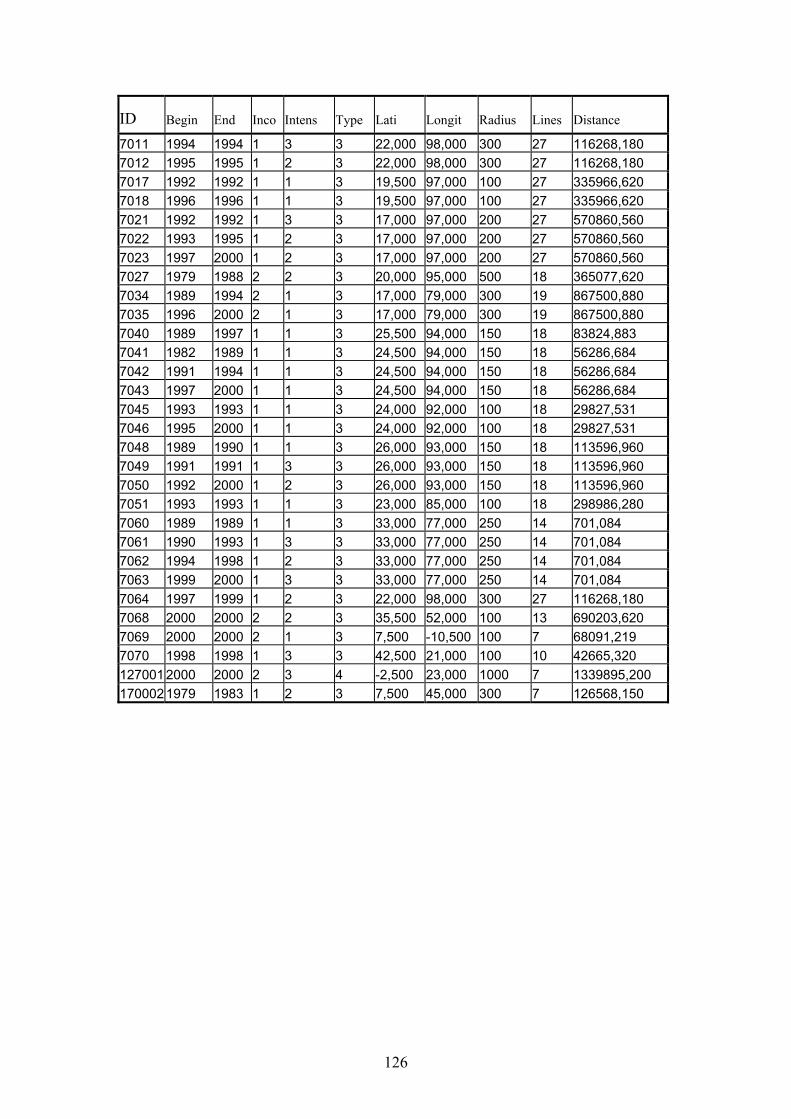
ID Begin End Inco Intens Type Lati Radius Lines Distance
7011 1994 1994 1 3 3 22,000 98,000 300 27 116268,180 7012 1995 1995 1 2 3 22,000 98,000 300 27 116268,180 7017 1992 1992 1 1 3 19,500 97,000 100 27 335966,620 7018 1996 1996 1 1 3 19,500 97,000 100 27 335966,620 7021 1992 1992 1 3 3 17,000 97,000 200 27 570860,560 7022 1993 1995 1 2 3 17,000 97,000 200 27 570860,560 7023 1997 2000 1 2 3 17,000 97,000 200 27 570860,560 7027 1979 1988 2 2 3 20,000 95,000 500 18 365077,620 7034 1989 1994 2 1 3 17,000 79,000 300 19 867500,880 7035 1996 2000 2 1 3 17,000 79,000 300 19 867500,880 7040 1989 1997 1 1 3 25,500 94,000 150 18 83824,883 7041 1982 1989 1 1 3 24,500 94,000 150 18 56286,684 7042 1991 1994 1 1 3 24,500 94,000 150 18 56286,684 7043 1997 2000 1 1 3 24,500 94,000 150 18 56286,684 7045 1993 1993 1 1 3 24,000 92,000 100 18 29827,531 7046 1995 2000 1 1 3 24,000 92,000 100 18 29827,531 7048 1989 1990 1 1 3 26,000 93,000 150 18 113596,960 7049 1991 1991 1 3 3 26,000 93,000 150 18 113596,960 7050 1992 2000 1 2 3 26,000 93,000 150 18 113596,960 7051 1993 1993 1 1 3 23,000 85,000 100 18 298986,280 7060 1989 1989 1 1 3 33,000 77,000 250 14 701,084 7061 1990 1993 1 3 3 33,000 77,000 250 14 701,084 7062 1994 1998 1 2 3 33,000 77,000 250 14 701,084 7063 1999 2000 1 3 3 33,000 77,000 250 14 701,084 7064 1997 1999 1 2 3 22,000 98,000 300 27 116268,180 7068 2000 2000 2 2 3 35,500 52,000 100 13 690203,620 7069 2000 2000 2 1 3 7,500 -10,500 100 7 68091,219 7070 1998 1998 1 3 3 42,500 21,000 100 10 42665,320 127001 2000 2000 2 3 4 -2,500 23,000 1000 7 1339895,200 170002 1979 1983 1 2 3 7,500 45,000 300 7 126568,150
Longit
126

Appendix 3: The geographical locations of all cities with more than one million inhabitants The dots are cities, and the red lines are civilizational borderlines.
All 250 cities with more than one million inhabitants and civilizational borderlines.
127

Appendix 4: Visual comparison of location of conflicts in relation to civilizational borders 1990-2000 and 1979-89: 1990-2000:
Conflicts 1990-2000 and civilizational borders with a buffer zone.
128
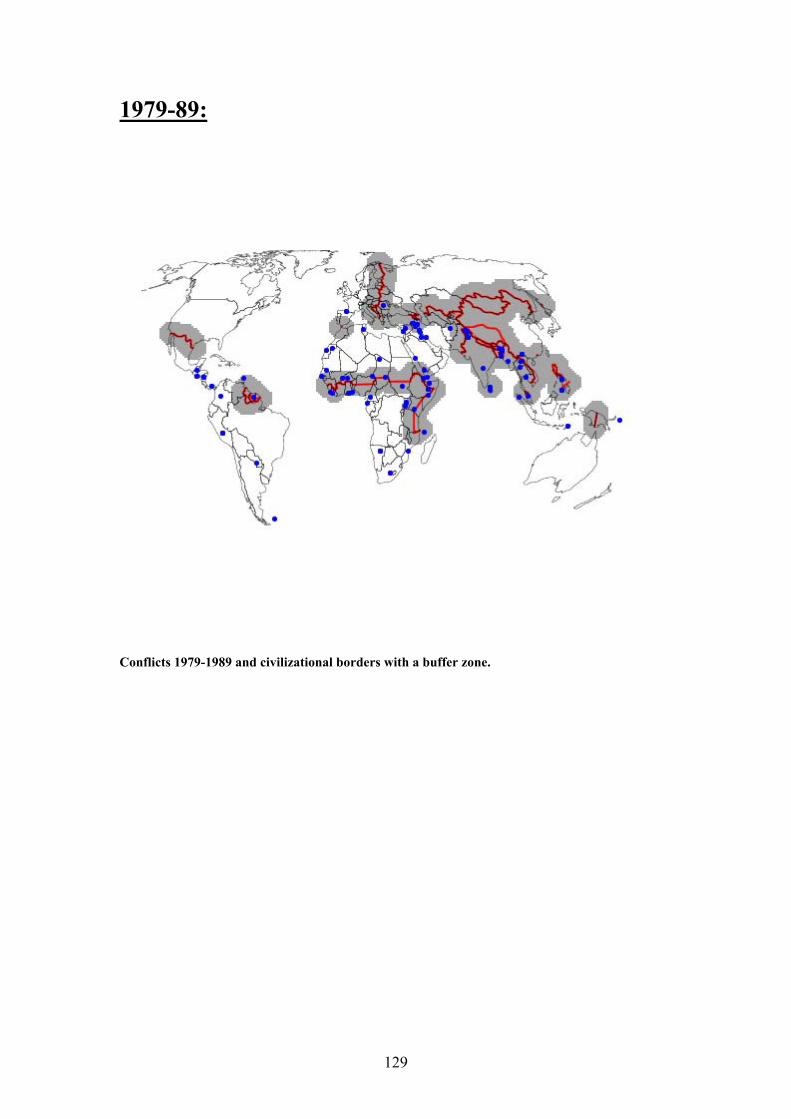
1979-89:
Conflicts 1979-1989 and civilizational borders with a buffer zone.
129

Appendix 5
130
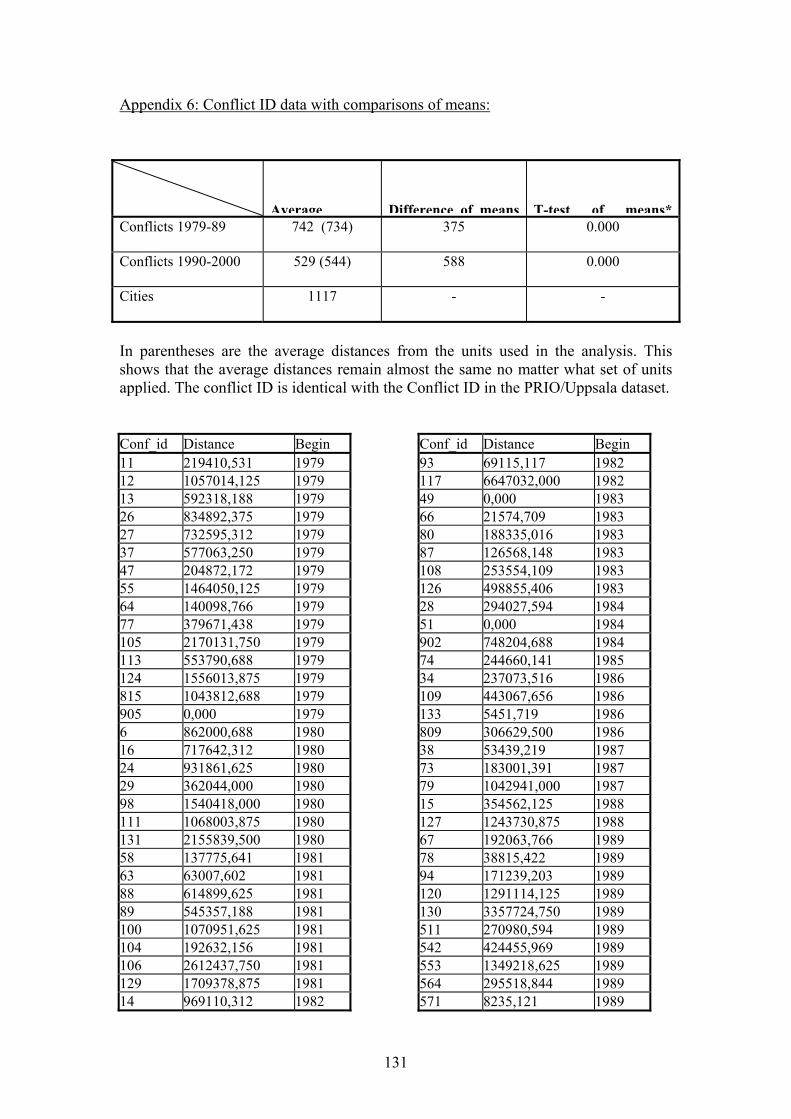
Appendix 6: Conflict ID data with comparisons of means:
Average Difference of means T-test of means*Conflicts 1979-89 742 (734) 375 0.000
Conflicts 1990-2000 529 (544) 588 0.000
Cities 1117 - -
In parentheses are the average distances from the units used in the analysis. This shows that the average distances remain almost the same no matter what set of units applied. The conflict ID is identical with the Conflict ID in the PRIO/Uppsala dataset. Conf_id Distance Begin 11 219410,531 1979 12 1057014,125 1979 13 592318,188 1979 26 834892,375 1979 27 732595,312 1979 37 577063,250 1979 47 204872,172 1979 55 1464050,125 1979 64 140098,766 1979 77 379671,438 1979 105 2170131,750 1979 113 553790,688 1979 124 1556013,875 1979 815 1043812,688 1979 905 0,000 1979 6 862000,688 1980 16 717642,312 1980 24 931861,625 1980 29 362044,000 1980 98 1540418,000 1980 111 1068003,875 1980 131 2155839,500 1980 58 137775,641 1981 63 63007,602 1981 88 614899,625 1981 89 545357,188 1981 100 1070951,625 1981 104 192632,156 1981 106 2612437,750 1981 129 1709378,875 1981 14 969110,312 1982
Conf_id Distance Begin 93 69115,117 1982 117 6647032,000 1982 49 0,000 1983 66 21574,709 1983 80 188335,016 1983 87 126568,148 1983 108 253554,109 1983 126 498855,406 1983 28 294027,594 1984 51 0,000 1984 902 748204,688 1984 74 244660,141 1985 34 237073,516 1986 109 443067,656 1986 133 5451,719 1986 809 306629,500 1986 38 53439,219 1987 73 183001,391 1987 79 1042941,000 1987 15 354562,125 1988 127 1243730,875 1988 67 192063,766 1989 78 38815,422 1989 94 171239,203 1989 120 1291114,125 1989 130 3357724,750 1989 511 270980,594 1989 542 424455,969 1989 553 1349218,625 1989 564 295518,844 1989 571 8235,121 1989
131
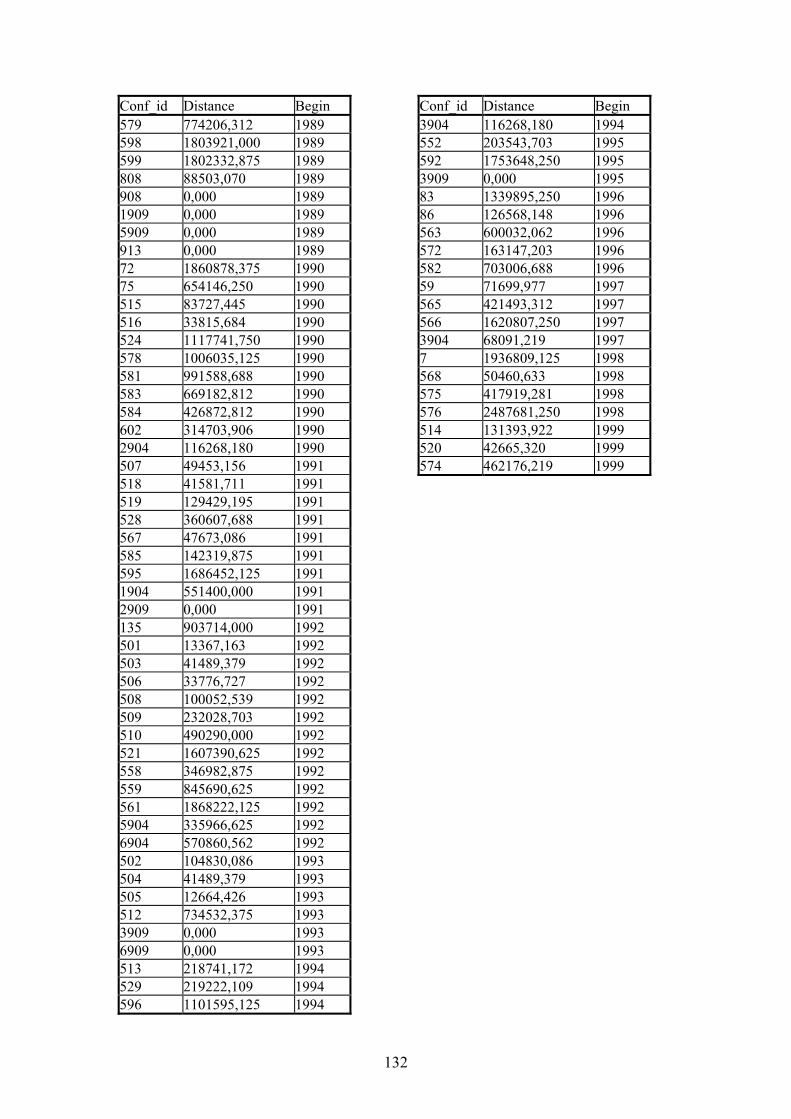
Conf_id Distance Begin 579 774206,312 1989 598 1803921,000 1989 599 1802332,875 1989 808 88503,070 1989 908 0,000 1989 1909 0,000 1989 5909 0,000 1989 913 0,000 1989 72 1860878,375 1990 75 654146,250 1990 515 83727,445 1990 516 33815,684 1990 524 1117741,750 1990 578 1006035,125 1990 581 991588,688 1990 583 669182,812 1990 584 426872,812 1990 602 314703,906 1990 2904 116268,180 1990 507 49453,156 1991 518 41581,711 1991 519 129429,195 1991 528 360607,688 1991 567 47673,086 1991 585 142319,875 1991 595 1686452,125 1991 1904 551400,000 1991 2909 0,000 1991 135 903714,000 1992 501 13367,163 1992 503 41489,379 1992 506 33776,727 1992 508 100052,539 1992 509 232028,703 1992 510 490290,000 1992 521 1607390,625 1992 558 346982,875 1992 559 845690,625 1992 561 1868222,125 1992 5904 335966,625 1992 6904 570860,562 1992 502 104830,086 1993 504 41489,379 1993 505 12664,426 1993 512 734532,375 1993 3909 0,000 1993 6909 0,000 1993 513 218741,172 1994 529 219222,109 1994 596 1101595,125 1994
3904 116268,180 1994 552 203543,703 1995 592 1753648,250 1995 3909 0,000 1995 83 1339895,250 1996 86 126568,148 1996 563 600032,062 1996 572 163147,203 1996 582 703006,688 1996 59 71699,977 1997 565 421493,312 1997 566 1620807,250 1997 3904 68091,219 1997 7 1936809,125 1998 568 50460,633 1998 575 417919,281 1998 576 2487681,250 1998 514 131393,922 1999 520 42665,320 1999 574 462176,219 1999
Conf_id Distance Begin
132