a portable infrasonic sensor calibrator down to at …
TRANSCRIPT

A PORTABLE INFRASONIC SENSOR CALIBRATOR DOWN TO AT LEAST 8 HZ
Kris Walker, Matthew Dzieciuch, Mark Zumberge, and Scott DeWolf
Institute of Geophysics and Planetary Physics and University of California, San Diego
Sponsored by Army Space and Missile Defense Command
Contract No. W9113M-06-1-0002 Proposal No. BAA06-41
ABSTRACT An optical fiber infrasound sensor (OFIS) is a long compliant tube wrapped with two optical fibers that integrate pressure variation along the length of the tube at the speed of light via laser interferometry. Here we only present the initial results of research conducted under this contract due to delays in the construction of the Camp Elliott OFIS array. All the field work has been completed, but the remainder of the data analysis will be completed in the next two months and presented in the associated poster. In this paper, we show that M-sequences transmitted via an array of 18-inch subwoofers comprise a portable infrasound sensor calibrator, which also permits in situ evaluation of wind noise reduction filters. For example, a comparison of a 60-m OFIS with a Brüel & Kjær (B&K) microphone at a signal frequency of 50 Hz for a source ~240 m away shows that the OFIS reduced wind and other types of undesirable noise by 18 dB over the B&K microphone with a standard sponge wind screen. An 8-subwoofer array at a range of ~240 m yields a reliable calibration signal that smoothly decreases in power by a rate of 2.5 dB/Hz with decreasing frequency to 8 Hz, which is fairly remarkable given the 20 Hz rolloff frequency of the amplifier and speakers.
2008 Monitoring Research Review: Ground-Based Nuclear Explosion Monitoring Technologies
902

Report Documentation Page Form ApprovedOMB No. 0704-0188
Public reporting burden for the collection of information is estimated to average 1 hour per response, including the time for reviewing instructions, searching existing data sources, gathering andmaintaining the data needed, and completing and reviewing the collection of information. Send comments regarding this burden estimate or any other aspect of this collection of information,including suggestions for reducing this burden, to Washington Headquarters Services, Directorate for Information Operations and Reports, 1215 Jefferson Davis Highway, Suite 1204, ArlingtonVA 22202-4302. Respondents should be aware that notwithstanding any other provision of law, no person shall be subject to a penalty for failing to comply with a collection of information if itdoes not display a currently valid OMB control number.
1. REPORT DATE SEP 2008 2. REPORT TYPE
3. DATES COVERED 00-00-2008 to 00-00-2008
4. TITLE AND SUBTITLE A Portable Infrasonic Sensor Calibrator Down to at Least 8 HZ
5a. CONTRACT NUMBER
5b. GRANT NUMBER
5c. PROGRAM ELEMENT NUMBER
6. AUTHOR(S) 5d. PROJECT NUMBER
5e. TASK NUMBER
5f. WORK UNIT NUMBER
7. PERFORMING ORGANIZATION NAME(S) AND ADDRESS(ES) University of California, San Diego,9500 Gilman Dr,La Jolla,CA,92093
8. PERFORMING ORGANIZATIONREPORT NUMBER
9. SPONSORING/MONITORING AGENCY NAME(S) AND ADDRESS(ES) 10. SPONSOR/MONITOR’S ACRONYM(S)
11. SPONSOR/MONITOR’S REPORT NUMBER(S)
12. DISTRIBUTION/AVAILABILITY STATEMENT Approved for public release; distribution unlimited
13. SUPPLEMENTARY NOTES Proceedings of the 30th Monitoring Research Review: Ground-Based Nuclear Explosion MonitoringTechnologies, 23-25 Sep 2008, Portsmouth, VA sponsored by the National Nuclear Security Administration(NNSA) and the Air Force Research Laboratory (AFRL)
14. ABSTRACT see report
15. SUBJECT TERMS
16. SECURITY CLASSIFICATION OF: 17. LIMITATION OF ABSTRACT Same as
Report (SAR)
18. NUMBEROF PAGES
10
19a. NAME OFRESPONSIBLE PERSON
a. REPORT unclassified
b. ABSTRACT unclassified
c. THIS PAGE unclassified
Standard Form 298 (Rev. 8-98) Prescribed by ANSI Std Z39-18

OBJECTIVES
It is difficult to accurately calibrate infrasound sensors because of the difficulty in generating repeatable infrasound with small devices. Standard subwoofers are designed to have flat impulse responses down to ~20 Hz. Propane cannons or impulsive devices have difficulty generating infrasound below 5 Hz. A rotary speaker attached to a small building or covered truck may be an effective solution to this problem. The objective of this research is to develop an alternative calibration tool using commercially available subwoofers. Ideally, we seek a calibrator that can produce a signal in the 100-s to 20-Hz range. An array of subwoofers provides a larger source area, which can theoretically generate a lower-frequency signal. Furthermore, M-sequence technologies can be used to create a calibration signal at various frequencies where the energy transmitted by the source is power limited. Our objective is to develop and evaluate, with an OFIS sensor and collocated B&K microphone, an array of subwoofers that transmits M-sequences for infrasound sensor calibration.
The second objective of the research to be conducted under this contract is to develop a near real-time OFIS array infrasound signal tracking system with which we can directly compare, as a test, with a real-time sky video in the tracking of large aircraft.
RESEARCH ACCOMPLISHED
The objectives to be completed under this research were partially dependent on the construction of the Camp Elliott OFIS array (funded by another source). The construction of the Camp Elliott OFIS array experienced a number of delays, including the discovery of sensor sensitivity to temperature in early 2007 (Walker et al., 2007) and the San Diego county firestorms and subsequent rains in late 2007. The array went online in April of 2008. Due to these delays, the calibrator and real-time tracking research are not yet complete. It is expected that they will be completed in the next two months and results included in the associated poster. However, some results are reported below for the calibrator part of this research.
OFIS Sensor
The OFIS is a silicone tube wrapped with two fibers that integrates the pressure variation along the length of the tube in an effort to average out spatially incoherent wind noise (Figure 1; Zumberge et al., 2003). Because the pressure variation is averaged along the length of the tube, the instrument response is a function of the orientation of the OFIS, relative to the orientation of the signal wavefront, in a similar way as the variation of the response of a rosette wind filter as a function of elevation angle.
Figure 1. Schematic of an OFIS.
2008 Monitoring Research Review: Ground-Based Nuclear Explosion Monitoring Technologies
903

Camp Elliott OFIS Array
We installed five, 60-m OFIS arms at Camp Elliott (CEL), in north San Diego county near Miramar Marine Corps Air Station in early 2008. A sixth circular OFIS with a 7-m diameter was also installed at the center of the array. Each OFIS is buried beneath 6 inches of ¾-inch gravel. A Vaisala weather station, a 5-megapixel internet video camera, and a B&K microphone with sponge wind filter were also installed. Data from these sensors are streaming to our labs at the Institute of Geophysics and Planetary Physics (IGPP) in near real time (less than 2-s latency). A website displays filtered data at http://sail.ucsd.edu/~ofis/CEL/RT/. CSS3.0 data from this array will be archived daily at the RDSS beginning later in 2008.
Figure 2. Camp Elliott OFIS array (online April 2008).
M-Sequences
An M-sequence is a random series of binary digits that has been extensively used in communication and imaging systems during the last 50 years. M-codes are periodic and can be generated with the use of a bit register and feedback law, often using modulo-2 addition of the last two bits in the register, shifting all values in the register by 1, and feeding that summed value to the front of the register (Figure 3a; Golomb, 1967). The period of an M-sequence is 2N –1, where N is the length of the bit register (e.g., Figure 3b for N = 4). We then upsample the sequence (Figure 3c), scale it to –1/1 (Figure 3d), and use that “phase” function to modulate a sinusoid of a frequency fc (Figure 3e). Specifically, in Figure 3 we use a 4-bit register to generate the 15-bit sequence, which is used to modulate a 5-Hz signal at a rate of four carrier cycles per bit (Q = 4) to get a 12-s-long pseudo-random M-sequence. In practice, one can determine the calibration signal power or signal-to-noise (SNR) by matched phase filtering. This demodulation technique is similar to cross-correlation and spiking deconvolution but yields better timing precision than the cross-correlation approach and is more stable than deconvolution. However, conceptually we can think of cross-correlation as the approach. If one transmits the input M-sequence calibration voltage to a recording system, one can cross-correlate that with the sensor recording. The maximum peak comes at some delay time that corresponds to the time it takes the signal to go from the source to the receiver (assuming timing on both recording systems is accurate). As an example, we calculate the autocorrelation of the M-sequence (Figure 3f). The SNR is calculated with SNR = 20log10 max(autocorrelation) /noise(autocorrelation)( ) . The noise level can be obtained in a number of ways. We obtain it by taking the median of the absolute value of the autocorrelation function. The SNR for this 4-bit M-sequence is 29 dB. The SNR would be near infinite if the phase jumps used in this example were not precisely 180°. In our field experiments, the phase jumps are tuned to attenuate these side lobes. Furthermore, in the results shown below, the reference signal that we use in the phase-only filtering
2008 Monitoring Research Review: Ground-Based Nuclear Explosion Monitoring Technologies
904

is mathematically calculated rather than recorded at the source. Consequently, the time at which the peak in correlation occurs does not represent the travel time between source and receiver but represents the difference in time between the time the M-sequence generator was initiated at the source to the time it took the sequence generator to begin the next whole M-sequence period (pertinent to Figures 4–6). In other words, the program ignores the first transmitted fraction of the M-sequence when the reference signal is not used (since relative timing is not known).
Figure 3. M-code example from a 4-bit register to a pseudo signal-to-noise ratio (not using cross-correlation, but autocorrelation).
Hardware and Setup
In May 2007, we performed several M-sequence experiments with a single Yamaha 16-inch, 8-ohm subwoofer at a range of about 240 m from a 60-m OFIS and approximately collocated B&K microphone. The line between the center of the OFIS and the speaker array was at an angle of about 4° from the OFIS perpendicular. The subwoofer was connected to a Techron DC-coupled amplifier. An M-sequence circuit provided the input signal to the amplifier. Power was provided by a 3200-watt portable gasoline generator. The resulting input voltage to the subwoofer was
2008 Monitoring Research Review: Ground-Based Nuclear Explosion Monitoring Technologies
905

16.5 Vrms (33 watts) for frequencies between 5 and 50 Hz. These results were also discussed in Walker et al. (2007).
In August 2007, we performed several M-sequence experiments with an array composed of four Yorkville Elite Series cabinets located at the same position as in the earlier experiments. Each cabinet had two 1200-Watt, 4-ohm subwoofers for a total of eight subwoofers in the array. The cabinets did not have internal passive electronics. The subwoofers were connected to an American Audio V5000 Plus stereo amplifier in “subwoof mode,” which has a theoretically flat response down to 20 Hz. An M-sequence circuit provided the input signal to the amplifier. Power was provided by a 3.2-kW portable gasoline generator. The subwoofers were tuned for peak performance by increasing the volume until the one of the limiting factors was encountered: (1) the breaker inside the cabinet was tripped or (2) the breaker inside the generator was tripped or the overload circuit protection system in the amplifier alarmed. There were three array configurations that we experimented with at a site located about 240 m away from a 60-m OFIS: (1) a horizontal line array, (2) a square array, and (3) a square array folded inward toward the sensors by about 45° and covered by ¾-inch plywood. Unfortunately, the B&K microphone was not available at the time of this experiment. However, we used an MB2000 and connected it to a 4-m porous hose that was pointing toward the array. The MB2000 was connected via a 300-m RG58 cable to a 16-bit digitizer. We calibrated and tested the MB2000 by pressing on the porous hose, and a large amplitude signal was observed. The MB2000 was first about 20 m in front of the speakers and subsequently moved to the previous location of the B&K microphone.
Results
May 2007
These experiments were implemented using a single subwoofer with a collocated OFIS and a B&K microphone with a sponge wind filter. The azimuth from the subwoofer to the OFIS center was 4º from the OFIS perpendicular, which means the signal wavefronts were approximately plane waves that impacted the entire 60-m OFIS and microphone simultaneously. Both sensors were sampled at 200 Hz. The 4-minute-long coded signal was impossible to observe by inspection in the 1-Hz, high-passed B&K microphone time series but is observed with a visual signal-to-noise ratio (SNR) of 5 dB in the OFIS recording (Figure 4a). The spectrograms for both sensors show that the signal was observed. The signal peak corresponding to the first arrival has an SNR of 34 dB for the B&K and 46 dB for the OFIS (Figure 4d; 12-dB difference). Due to the 4° azimuth deviation in the speaker array from the OFIS perpendicular, there is significant attenuation of a 50-Hz signal by the OFIS. Correction for this attenuation leads to a total SNR difference of 18 dB, which confirms that a 60-m OFIS is exceptionally sensitive to low-frequency sound and well attenuates wind noise and other sources of low-frequency sound that come from different directions that are not perpendicular to the length of the OFIS.
One application of this technique is to analyze each of the 24 coded signals separately and to measure the demodulated power and travel time of these signals. Since we hold the power input into the subwoofer constant, any demodulated power or travel-time fluctuations result from a change in the impulse response of the environment. Therefore, one can measure the coherence time of the atmosphere, changes in the velocity profile with time, or changes in the wind noise with time. We find a considerable degree of variability in the demodulated B&K signal power (Figure 4e), and a smoother variability for the OFIS recordings (Figure 4f). We performed the same experiment at fc = 20, 10, 5, and 1 Hz. We observed the coded signal for only the 50- and 20-Hz cases, running into the expected subwoofer rolloff at subaudible frequencies.
2008 Monitoring Research Review: Ground-Based Nuclear Explosion Monitoring Technologies
906

Figure 4. M-sequence calibration technique using a 12-inch subwoofer at a 270-m distance from a tuned OFIS and a B&K microphone with sponge wind filter.
August 2007
These experiments yielded much more information, although some of them were not ideal because the time windows were cut short because of breaker tripping. There were three speaker array configurations that we experimented with: (1) a horizontal line array, (2) a square array, and (3) a square array folded inward toward the source by 45,° with a ¾-in plywood covering the top. The output power of the array was measured by the MB2000 located 20 m in front of the array (20 Hz–0.02 Pa, 15 Hz 0.1 Pa, 10 Hz–0.008 Pa). The MB2000 theoretically has a high frequency rolloff of 27 Hz (3-dB attenuation point). There is only a 1-dB attenuation predicted between 15 and 20 Hz. The reason the 15-Hz frequency has a higher amplitude than the 20-Hz is likely related to the speaker and/or cabinet response.
2008 Monitoring Research Review: Ground-Based Nuclear Explosion Monitoring Technologies
907

Figure 5. Decrease in recorded calibration signal power with frequency for a square array (top) and other array configurations (middle and bottom). The signal power in this case is with respect to 1 rad2 in OFIS interferometer units (subtract 28 dB with respect to 1 Pa2).
We ensonified the 60-m OFIS with a series of 5-min M-sequence time windows at different frequencies transmitted during the daytime by the square array (Figure 5). We found a decrease in the SNR by 2.5 dB per Hz between 10 and 16 Hz. Repeating this experiment on different array configurations did not significantly affect the recorded signal power, although the flat square seemed to give the best SNR for most frequencies.
2008 Monitoring Research Review: Ground-Based Nuclear Explosion Monitoring Technologies
908
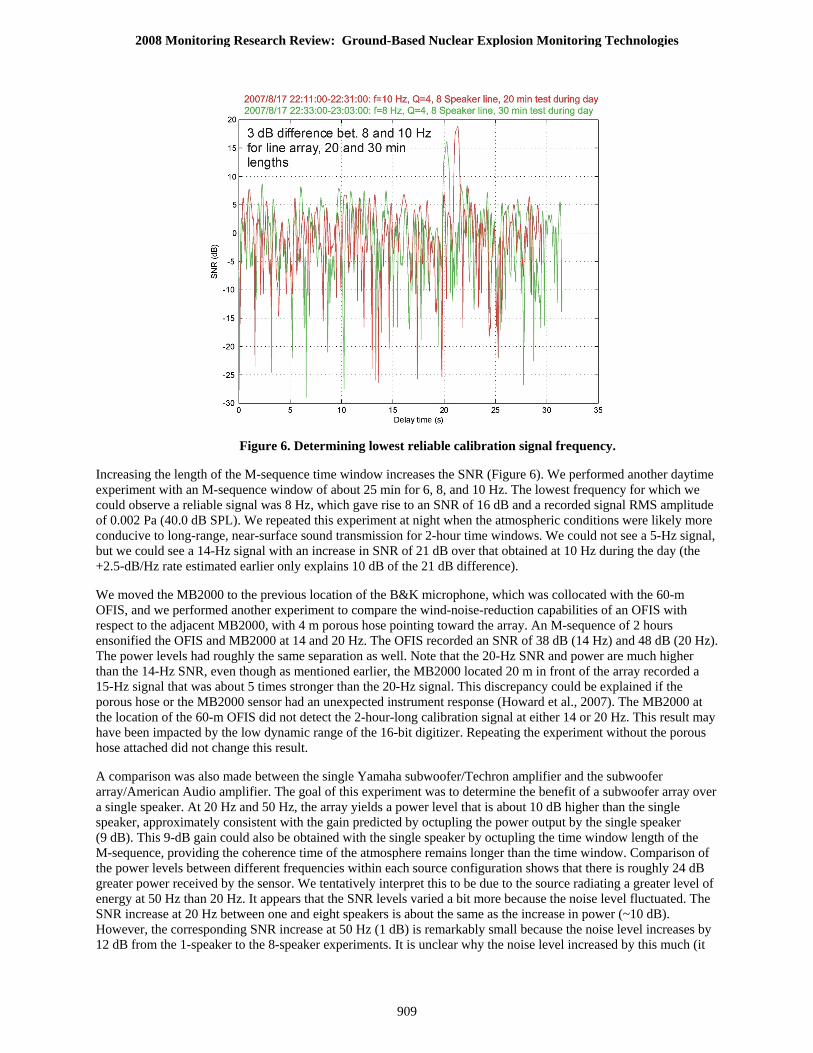
Figure 6. Determining lowest reliable calibration signal frequency.
Increasing the length of the M-sequence time window increases the SNR (Figure 6). We performed another daytime experiment with an M-sequence window of about 25 min for 6, 8, and 10 Hz. The lowest frequency for which we could observe a reliable signal was 8 Hz, which gave rise to an SNR of 16 dB and a recorded signal RMS amplitude of 0.002 Pa (40.0 dB SPL). We repeated this experiment at night when the atmospheric conditions were likely more conducive to long-range, near-surface sound transmission for 2-hour time windows. We could not see a 5-Hz signal, but we could see a 14-Hz signal with an increase in SNR of 21 dB over that obtained at 10 Hz during the day (the +2.5-dB/Hz rate estimated earlier only explains 10 dB of the 21 dB difference).
We moved the MB2000 to the previous location of the B&K microphone, which was collocated with the 60-m OFIS, and we performed another experiment to compare the wind-noise-reduction capabilities of an OFIS with respect to the adjacent MB2000, with 4 m porous hose pointing toward the array. An M-sequence of 2 hours ensonified the OFIS and MB2000 at 14 and 20 Hz. The OFIS recorded an SNR of 38 dB (14 Hz) and 48 dB (20 Hz). The power levels had roughly the same separation as well. Note that the 20-Hz SNR and power are much higher than the 14-Hz SNR, even though as mentioned earlier, the MB2000 located 20 m in front of the array recorded a 15-Hz signal that was about 5 times stronger than the 20-Hz signal. This discrepancy could be explained if the porous hose or the MB2000 sensor had an unexpected instrument response (Howard et al., 2007). The MB2000 at the location of the 60-m OFIS did not detect the 2-hour-long calibration signal at either 14 or 20 Hz. This result may have been impacted by the low dynamic range of the 16-bit digitizer. Repeating the experiment without the porous hose attached did not change this result.
A comparison was also made between the single Yamaha subwoofer/Techron amplifier and the subwoofer array/American Audio amplifier. The goal of this experiment was to determine the benefit of a subwoofer array over a single speaker. At 20 Hz and 50 Hz, the array yields a power level that is about 10 dB higher than the single speaker, approximately consistent with the gain predicted by octupling the power output by the single speaker (9 dB). This 9-dB gain could also be obtained with the single speaker by octupling the time window length of the M-sequence, providing the coherence time of the atmosphere remains longer than the time window. Comparison of the power levels between different frequencies within each source configuration shows that there is roughly 24 dB greater power received by the sensor. We tentatively interpret this to be due to the source radiating a greater level of energy at 50 Hz than 20 Hz. It appears that the SNR levels varied a bit more because the noise level fluctuated. The SNR increase at 20 Hz between one and eight speakers is about the same as the increase in power (~10 dB). However, the corresponding SNR increase at 50 Hz (1 dB) is remarkably small because the noise level increases by 12 dB from the 1-speaker to the 8-speaker experiments. It is unclear why the noise level increased by this much (it
2008 Monitoring Research Review: Ground-Based Nuclear Explosion Monitoring Technologies
909

was expected to have increased by only 4 to 5 dB). The timing of this noise correlates with the appearance of a secondary 20 dB (SNR) peak located 2.0 s after the first 50 dB (SNR) peak. This secondary peak could be explained by a reflection from the top of a 700-m-high atmospheric surface layer. However, at an SNR of 20 dB, the peak should have been observed in the single-speaker 50 Hz experiment 5 minutes prior to this time window, especially considering the noise for that single-speaker experiment was 12 dB less. Furthermore, there is no evidence of a burst of noise or airplane activity during this time window, which could have raised the noise floor. Our tentative conclusion is that there is some nonlinearity in the Yorkville eight-speaker array during our 50-Hz experiments that was not accounted for in our algorithm that calculated the M-sequence reference signal.
Figure 7. OFIS recorded calibration SNR and power for a single-speaker and eight-speaker array for 5-minute M-sequence time windows during the late afternoon.
CONCLUSIONS AND RECOMMENDATIONS
The final analyses will be completed during the following months leading up to the MRR and will be presented on the associated poster.
Our results so far suggest that a single speaker has difficulty generating infrasound below 20 Hz with M-sequences at a range of at least 240 m. However, a square array of similar subwoofers that transmit M-sequences in phase is capable of generating infrasound down to at least 8 Hz in a predictable and repeatable manner at the same range. The technique can be used to calibrate infrasound sensors in situ (with or without large wind-noise-reduction filters). There are several techniques on how one can demodulate the M-sequence from the recording. Phase-only filtering is an optimum technique for this task because of its relatively good stability and temporal resolution.
Tests show that a 60-m OFIS records a 50-Hz calibration signal with an 18-dB improvement in SNR over that provided by a collocated B&K microphone with standard sponge wind screen. In terms of 1/n reduction in light wind noise, this means that a 60-m OFIS is equivalent to roughly 60 equally spaced microphones, or 1 microphone per OFIS meter.
2008 Monitoring Research Review: Ground-Based Nuclear Explosion Monitoring Technologies
910

REFERENCES
Golomb, S. W. (1967) Shift Register Sequences. San Francisco: Holden-Day, Inc.
Howard, W., K. Dillion, and F. D. Shields (2007). Acoustical properties of porous hose wind noise filters, J. Acoust. Soc. Am. 122: 2985 [abstract].
Walker, K., M. Zumberge, and M. Dzieciuch (2007). OFIS experiments at Camp Elliott: Paving the way to infrasonic radar and a portable infrasonic sensor calibrator, these Proceedings.
Zumberge, M. A., J. Berger, M. A. H. Hedlin, E. Husmann, and S. Nooner (2003). An optical fiber infrasound sensor: A new lower limit on atmospheric pressure noise between 1 and 10 Hz, J. Acoust. Soc. Am. 113: 2474.
2008 Monitoring Research Review: Ground-Based Nuclear Explosion Monitoring Technologies
911