a population subjected to only density-independent factors...
TRANSCRIPT


A population subjected to only
density-independent factors can
not persist over a long period of
time – eventually go to extinction
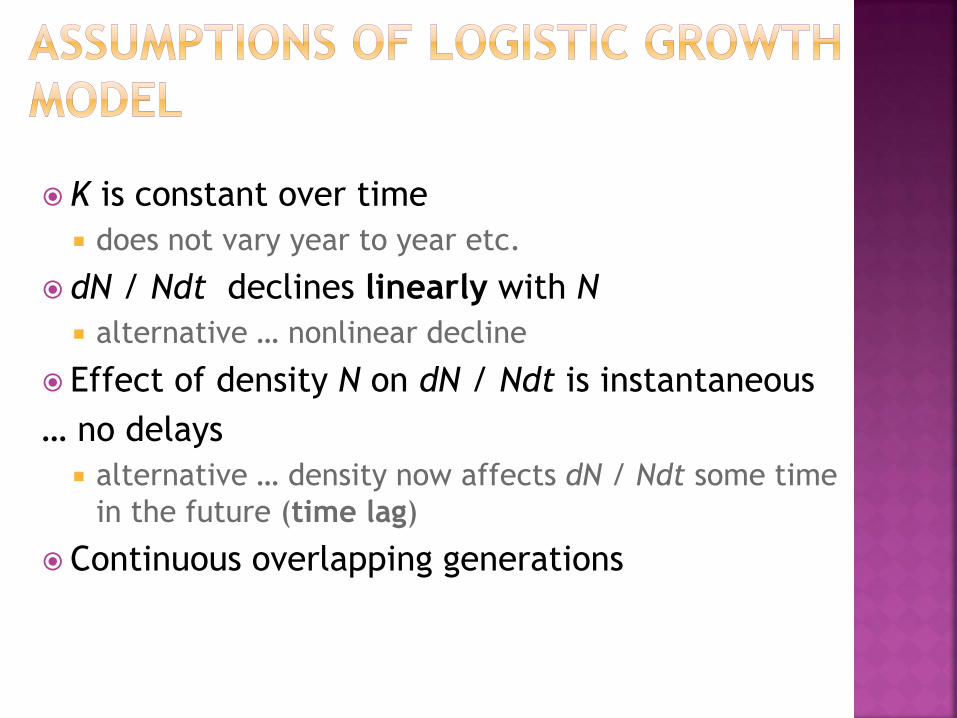
K is constant over time
does not vary year to year etc.
dN / Ndt declines linearly with N
alternative … nonlinear decline
Effect of density N on dN / Ndt is instantaneous
… no delays
alternative … density now affects dN / Ndt some time
in the future (time lag)
Continuous overlapping generations

Laboratory population of
Drosophila melanogaster
Laboratory
populations of
Paramecium aurelia
&
Paramecium
caudatum

Cycles most common in higher latitudes
Tundra
3-4 year cycles
Predators – Arctic fox, snowy owl, Rough-legged Hawk
Prey – lemmings
Taiga
8-10 year cycles
Predators – Lynx
Prey – Snowshoe Hare, Ruffed Grouse
Temperate Grasslands
3-4 year
Predators - mustelids??
Prey - voles, Prairie Chickens?
Tropics
Probably not ??

2 major cycles identified
voles, lemmings, and grouse –3-4 year period
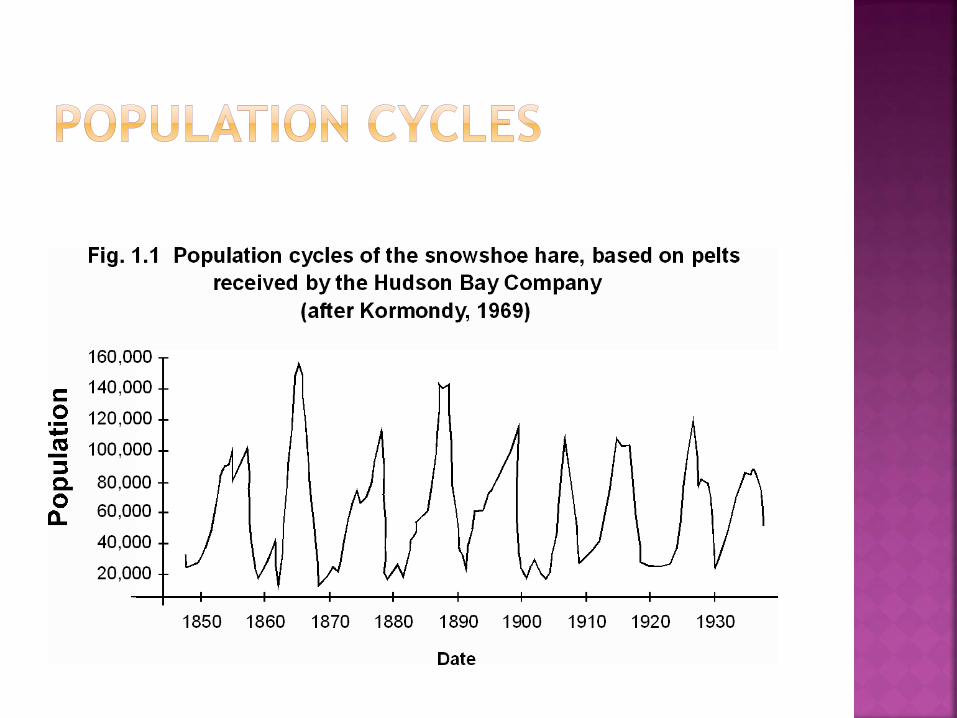
Snowshoe Hares – 8-10 year

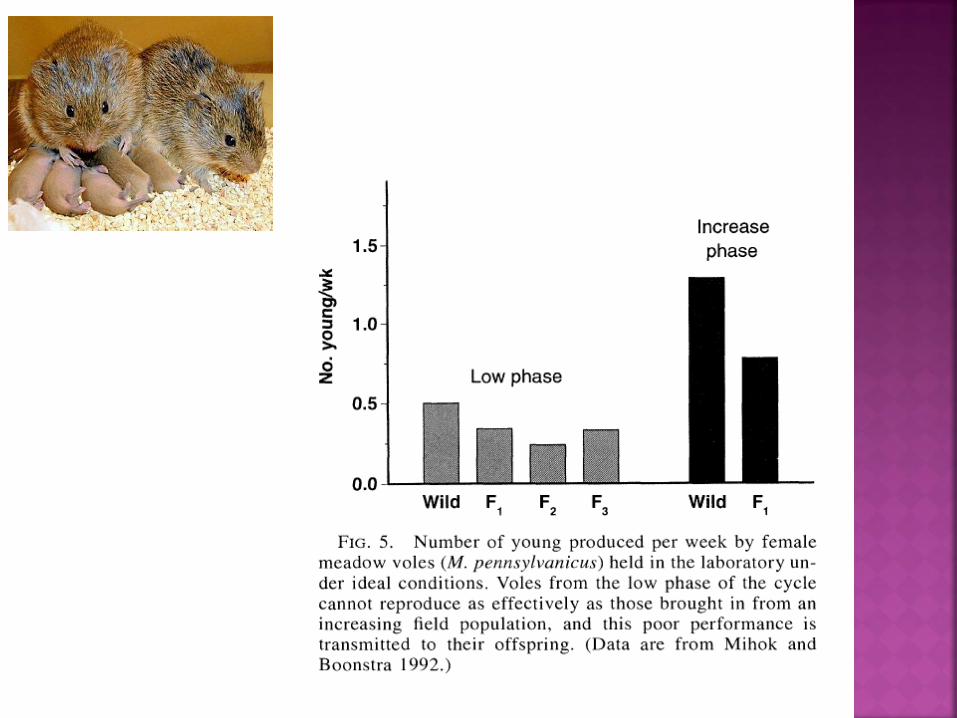
Current research has been concentrated on low
phase -
Voles and hares as small mammals have a
tremendous capacity for growth during increase
phase
Microtines 8-22 fold increase in 6months

What prevents population growth
during low phase of cycle?
2 broad categories of hypotheses
1. Classical Model
Something is wrong with the environment
• Food supplies damaged by overgrazing at
population peak
• Predators sufficiently abundant to prevent
recovery
• Disease or parasites
• Or…interaction

Food Hypothesis
Seems unlikely, numerous food supplement experiments have failed
to prevent low cycle
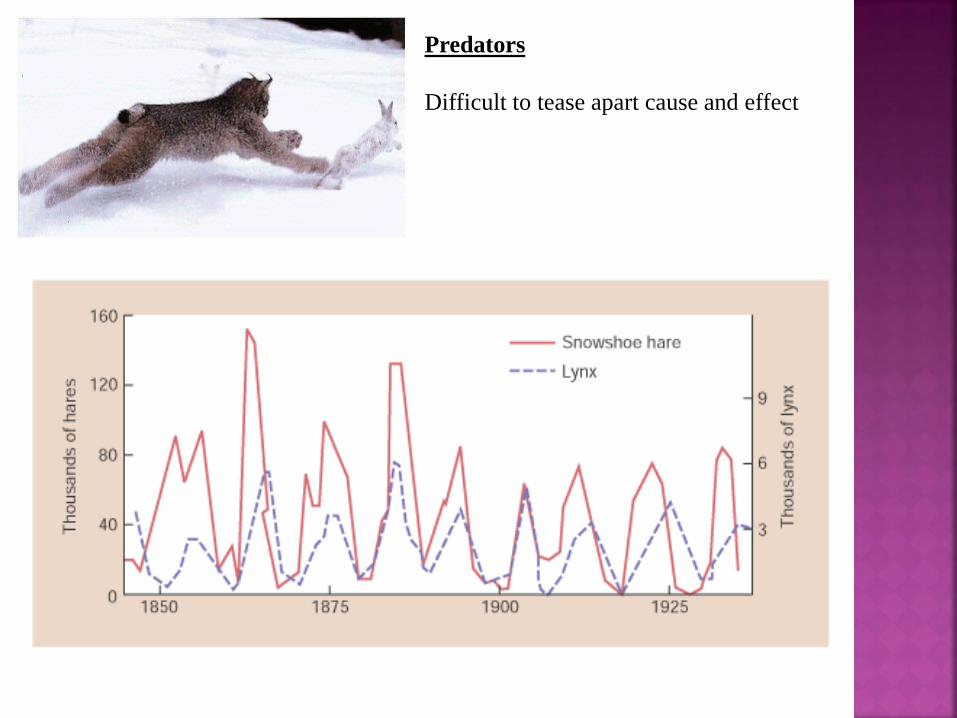
Predators
Difficult to tease apart cause and effect

2 Possibilites
a. predators simply follow changes in prey
abundance and thus have little consequence on
prey demography
b. predators drive cycles and are cause of cycles
Lows would be caused by predators that keep prey
# depressed for extended period following the
decline

Snowshoe hares – decline directly related to intense
predation
Low and increase phase --- 23% population disappeared
overwinter (50% due to predation)
Decline phase ---50-77% disappeared overwinter (70% due
to predation).
Decline phase in Yukon --<1% survived entire year (83%
predation)
Thus predation is a major factor in the decline phase but
seems not to have an effect during the low phase.
Same for microtines

Indirect effects Hypothesis
Response of prey to risk of predation may affect
reproductive fitness and ultimately cause the low phase.
Decline - Snowshoe hares minimize risk to predation by
altering foraging to areas of dense cover.
The correlate of good cover is poor food quality
Trade-off reproduction for survival
Shift to dense spruce stands which results in poorer
nutrition, lower mass of female, reduced fecundity.
This causes chronic stress with long term consequences.
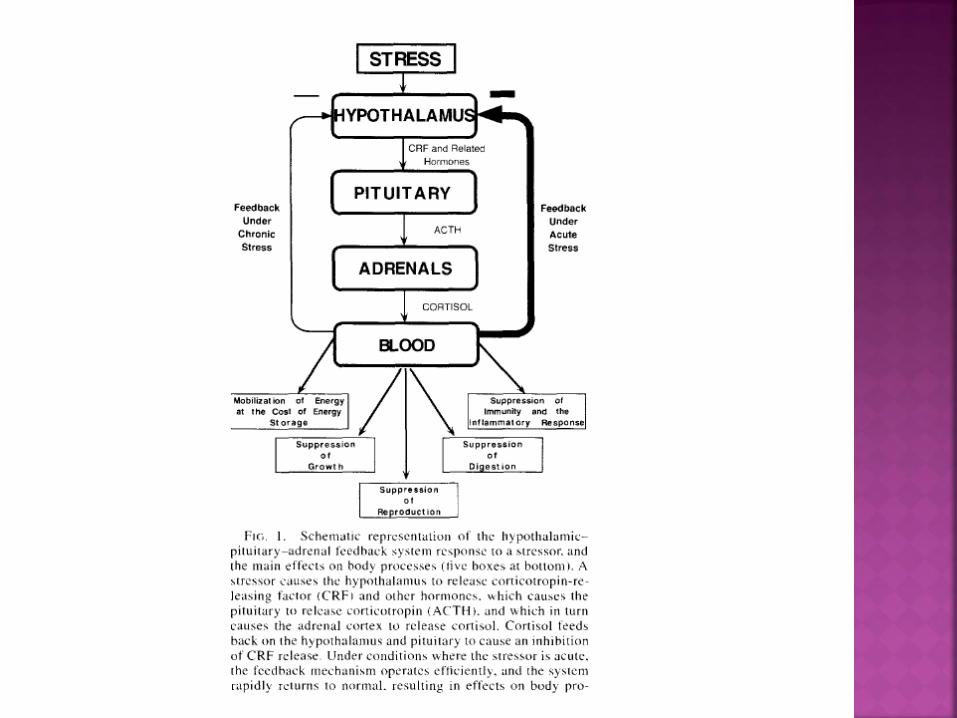

All physiol measurements associated with stress
response (immune system, mass loss, reprod
hormone response, hypothalamic-pituitary-
adrenal response) all were severely affected
during the hare decline phase. They did improve
remarkably after predators had declined.
Low phase is thus a lag caused by indirect effects
of predation
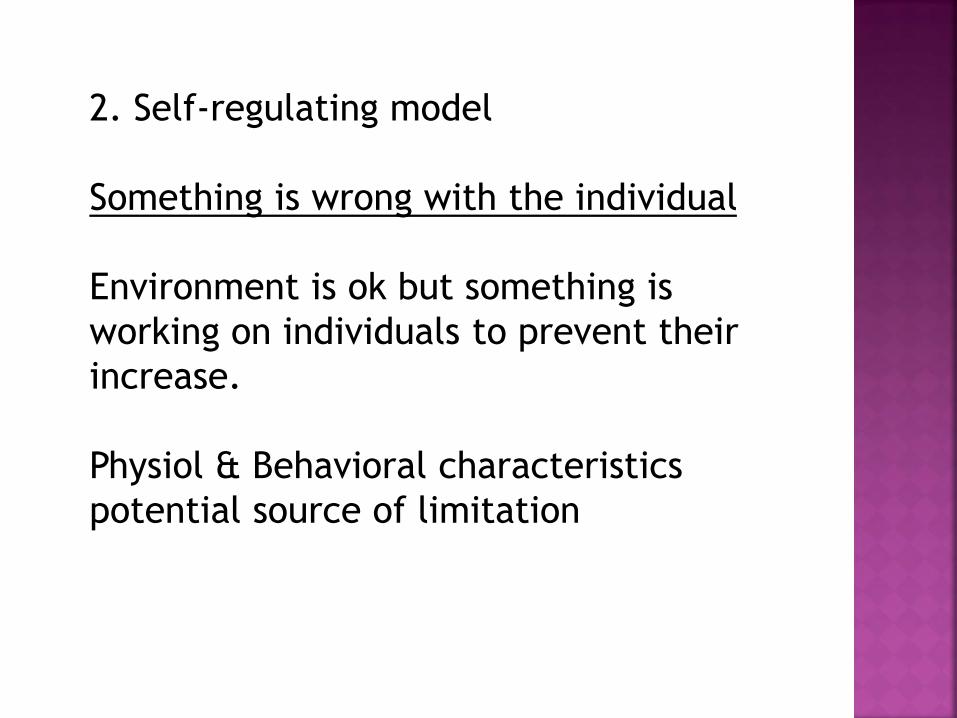
2. Self-regulating model
Something is wrong with the individual
Environment is ok but something is
working on individuals to prevent their
increase.
Physiol & Behavioral characteristics
potential source of limitation

Population Cycles – Continued
2. Self-regulating model
Anecdotal evidence supports hypothesis

Population Cycles – Continued
2. Self-regulating model
Maternal Effects Hypothesis
Change in maternal quality occurs
during peak phase and carries over to
decline and low phase

Maternal Effects Hypothesis
Produced through d-d social inhibition
of maturation in peak years

The use of a resource by two or more different
individuals, or the interference by one individual
with the resource use by others

Exploitation – competition in which 2 or more
individuals consume the same limited
resource
Interference – competition in which one
organism prevents the other from having
access to a limiting resource. Active
inhibition is used to deny others the resource
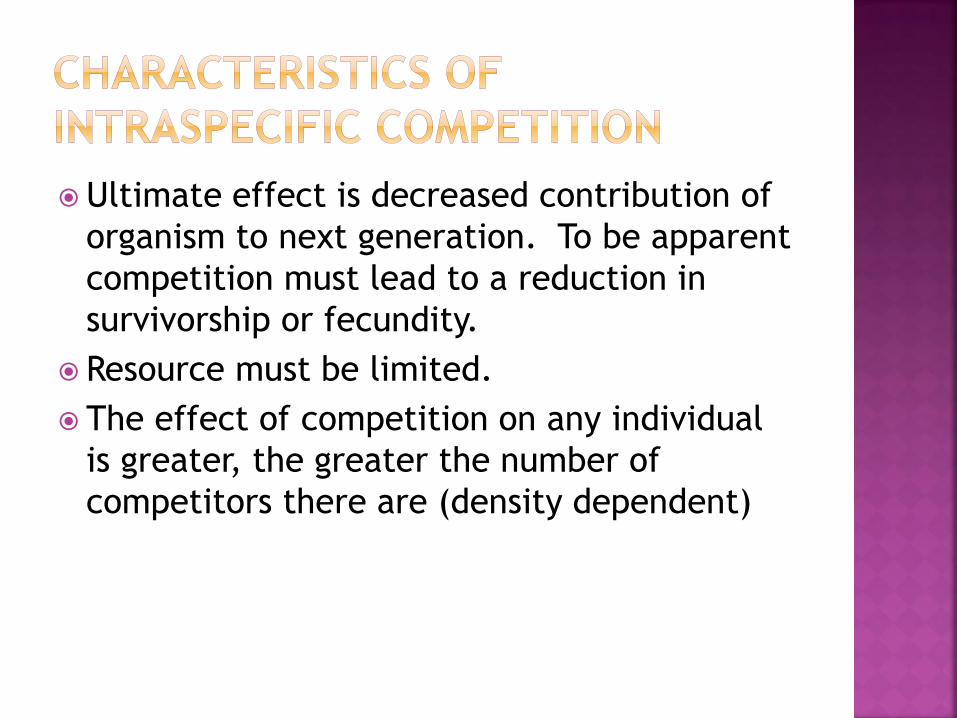
Ultimate effect is decreased contribution of
organism to next generation. To be apparent
competition must lead to a reduction in
survivorship or fecundity.
Resource must be limited.
The effect of competition on any individual
is greater, the greater the number of
competitors there are (density dependent)

• 11 young/year
• 27% adults survive
• 6% of young
Does intraspecific competition
limit population size of Great
Tits?
Over 4 years
• removed 60% of young (4 young/year)
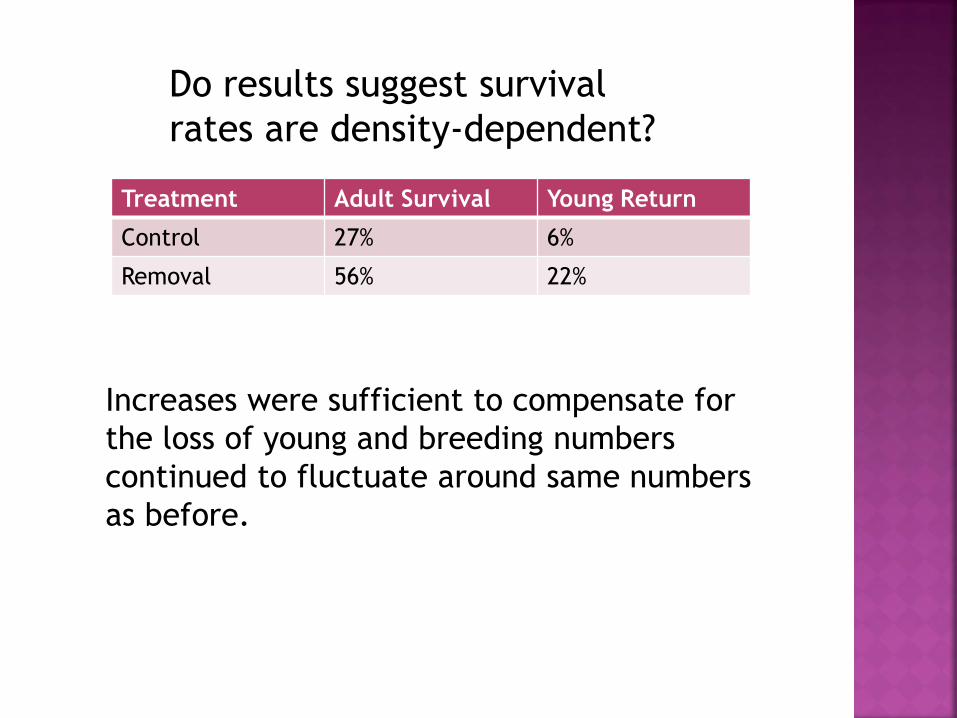
Treatment Adult Survival Young Return
Control 27% 6%
Removal 56% 22%
Do results suggest survival
rates are density-dependent?
Increases were sufficient to compensate for
the loss of young and breeding numbers
continued to fluctuate around same numbers
as before.
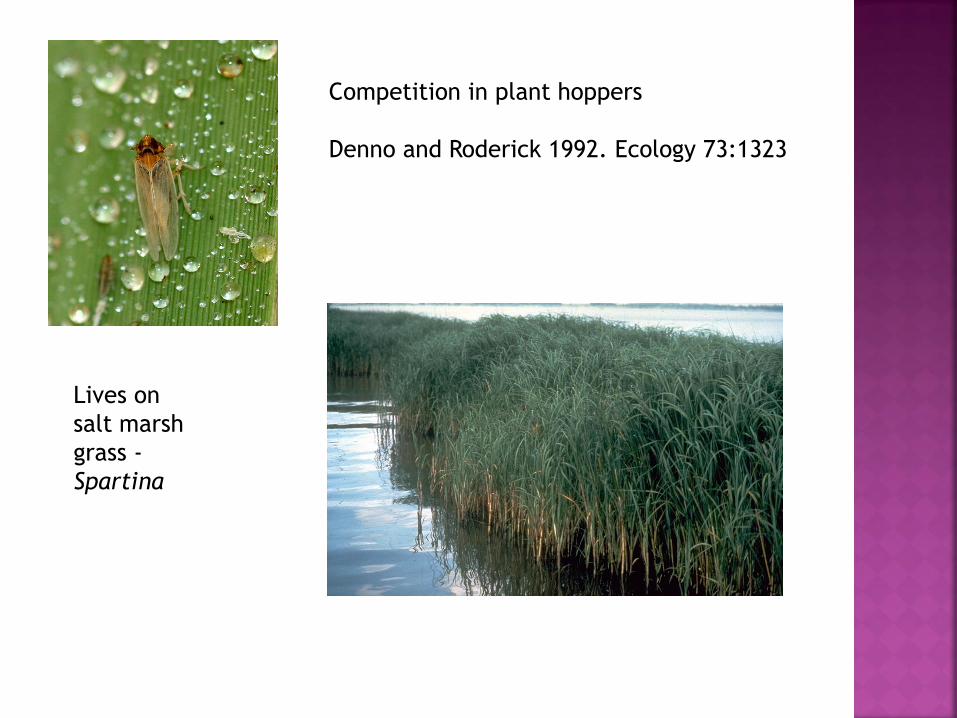
Competition in plant hoppers
Denno and Roderick 1992. Ecology 73:1323
Lives on
salt marsh
grass -
Spartina

Density controlled by enclosing
insects with Spartina seedlings
3, 11, 40

Results
-survivorship
-development
-Body length
- % Macropterous
females
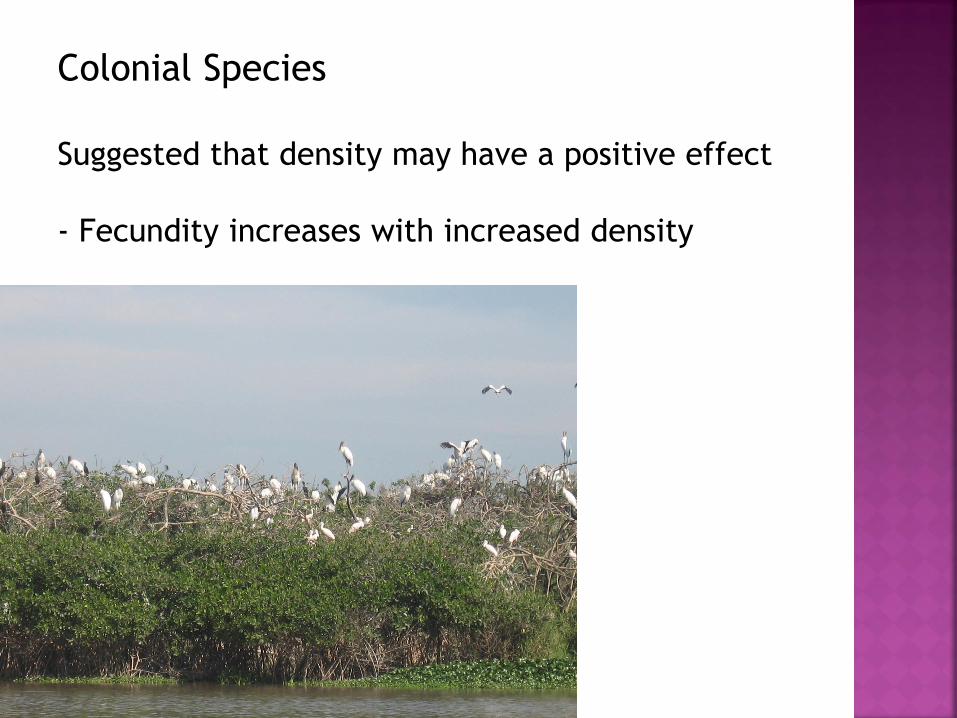
Colonial Species
Suggested that density may have a positive effect
- Fecundity increases with increased density

Common Guillemot
• Breed in subcolonies
of different densities
• Females lay 1 egg
• Subcolonies with
higher densities had
higher reproductive
success
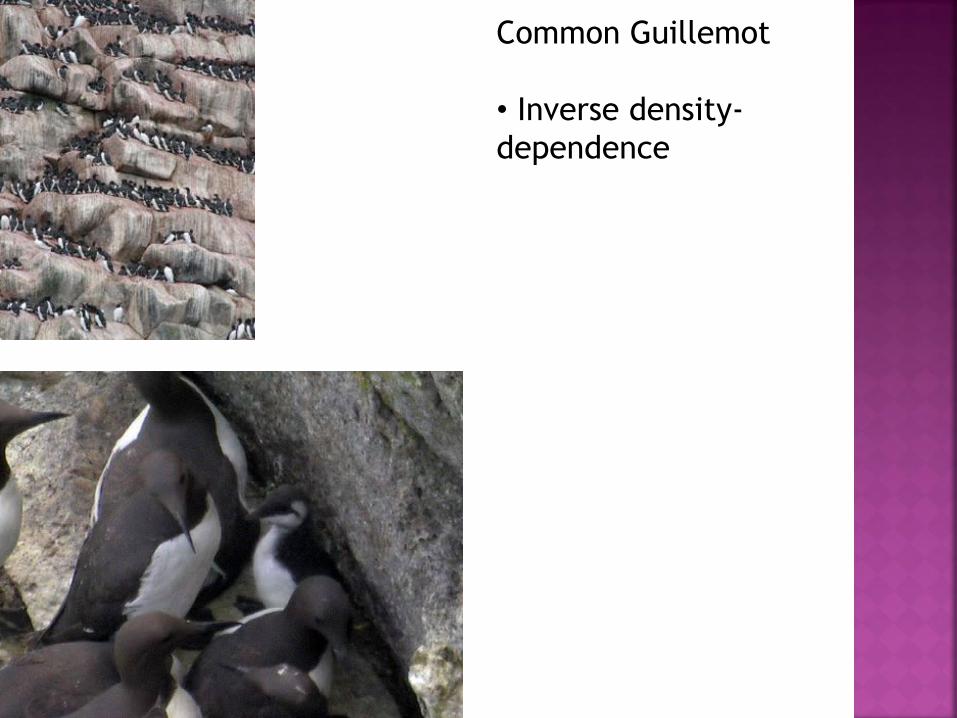
Common Guillemot
• Inverse density-
dependence
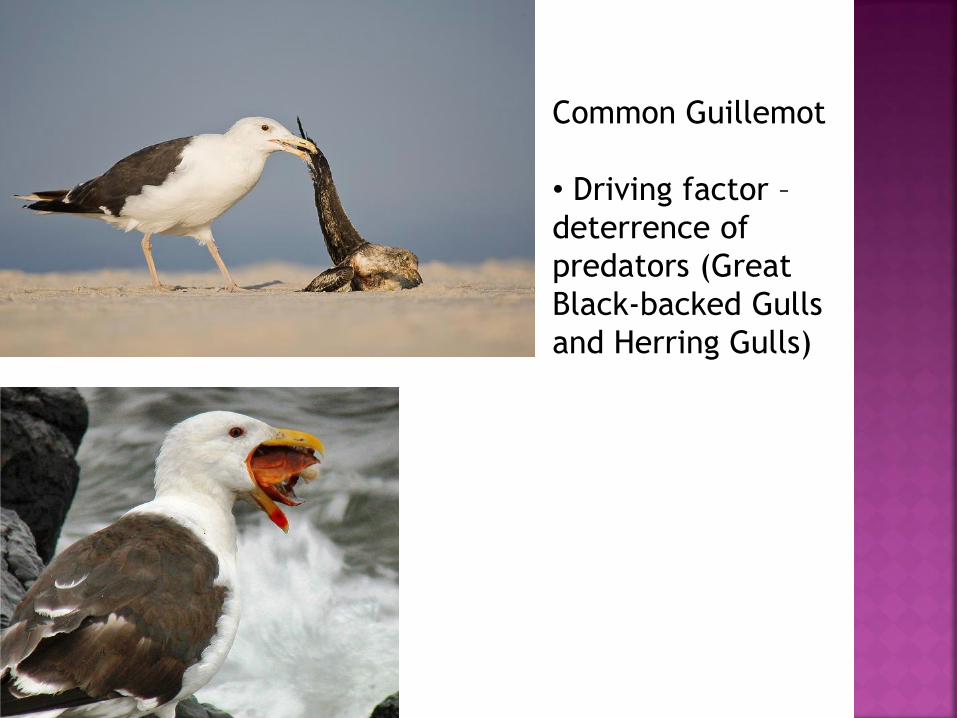
Common Guillemot
• Driving factor –
deterrence of
predators (Great
Black-backed Gulls
and Herring Gulls)

Tendency for destabilizing effect – as birth
rates rise with increased density, death rates
remain the same
Large populations get larger
Small populations get smaller
Other Mechanisms of Allee Effects
• predator dilution/swamping
• antipredator vigilance
• social thermoregulation
• reduction of inbreeding
• genetic drift
• antipredator aggression
• social facilitation of reproduction


Too simplistic to think environmental
conditions are equally favorable everywhere
an organism exists

Pro
du
cti
vit
y
Population Source
Excess young produced
Population Sink
Productivity not sufficient to
balance mortality

What level of nesting success is
needed to sustain a “healthy
population”?

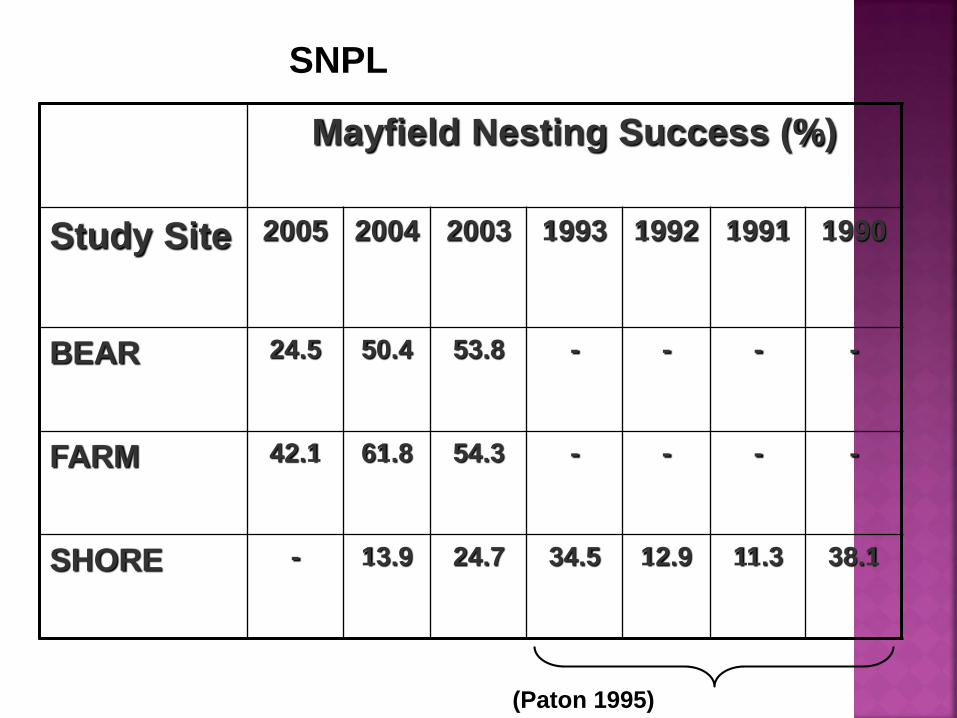
Mayfield Nesting Success (%)
Study Site 2005 2004 2003 1993 1992 1991 1990
BEAR 24.5 50.4 53.8 - - - -
FARM 42.1 61.8 54.3 - - - -
SHORE - 13.9 24.7 34.5 12.9 11.3 38.1
(Paton 1995)
SNPL

CALCULATION OF LAMBDA (finite population growth rate)
SNPL
= PA + PJ where,
PA = annual adult survival (set to 74% or 50% based on Paton 1994 and Nur et al. 1999);
PJ = juvenile survival from fledging to the following breeding season (set to 50% based on Nur et al. 1999)
= mean annual production (calculated from this study, Paton 1995, Nur et al. 1999)

λ = PA + PJ β
λ > 1 Population Source
λ < 1 Population Sink

Nest Success
0.0 0.1 0.2 0.3 0.4 0.5 0.6 0.7
0.6
0.8
1.0
1.2
1.4
1.6
1.8
SNPLOptimisticEstimate
ConservativeEstimate
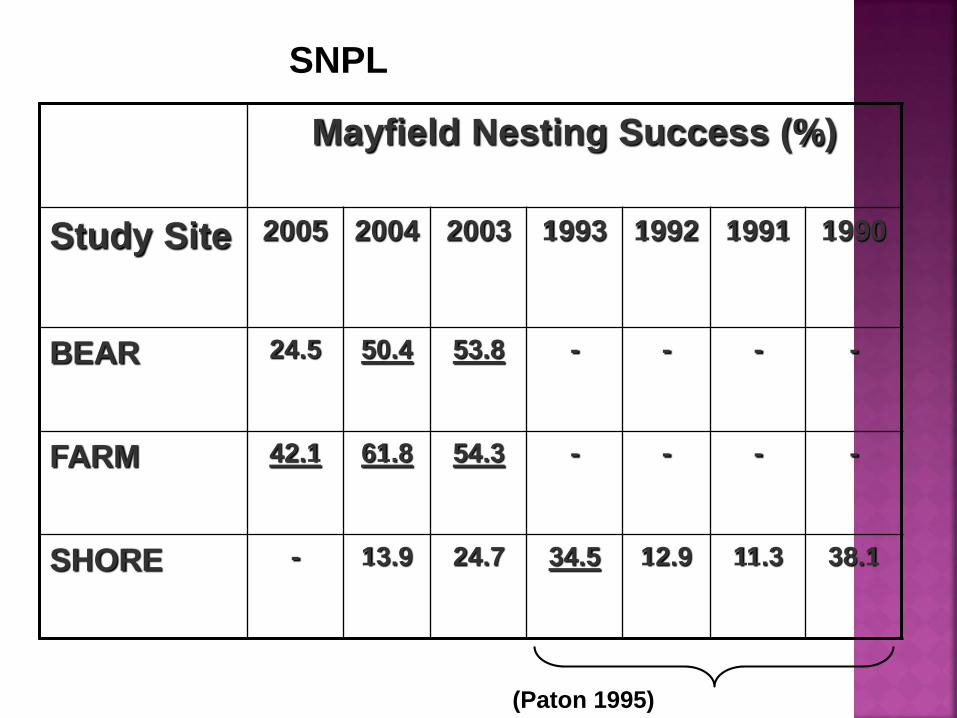
Mayfield Nesting Success (%)
Study Site 2005 2004 2003 1993 1992 1991 1990
BEAR 24.5 50.4 53.8 - - - -
FARM 42.1 61.8 54.3 - - - -
SHORE - 13.9 24.7 34.5 12.9 11.3 38.1
(Paton 1995)
SNPL


A ‘metapopulation’ is a “population of
populations” (Levins 1969,1970); in which
distinct subpopulations (local populations)
occupy spatially separated patches of
habitat.

A metapopulation exists when dispersal rates are “low-
moderate”, meaning that an individual will move from one patch
to another at a rate high enough to maintain some interaction
among subpopulations but low enough that those subpopulations
remain distinct.

High rates of dispersal lead to the unification of patches into a
single large, patchy population. All “patchy” populations are not
necessarily metapopulations.
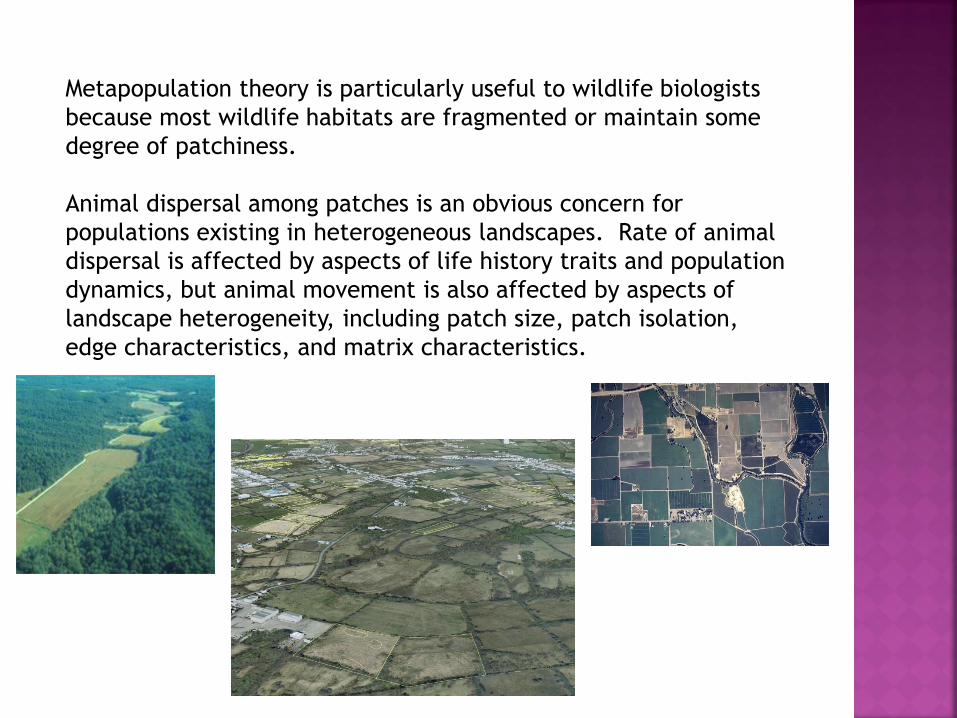
Metapopulation theory is particularly useful to wildlife biologists
because most wildlife habitats are fragmented or maintain some
degree of patchiness.
Animal dispersal among patches is an obvious concern for
populations existing in heterogeneous landscapes. Rate of animal
dispersal is affected by aspects of life history traits and population
dynamics, but animal movement is also affected by aspects of
landscape heterogeneity, including patch size, patch isolation,
edge characteristics, and matrix characteristics.


Life History Theory
A. Defined
Definition – Set of evolved strategies including
behavioral, physiological, and anatomical
adaptations that influence survival and
reproductive success directly
Everything we know about NS indicates that
those individuals with fecundity and
survivorship schedules most suited to
maximize fitness will be favored.

• Teleology is the idea that purpose
exists in evolution in the same sense
that it does for human intention. Evolution has no predesigned or intentional goal

“Strategy” does not imply a conscious choice
by the organism.
• Adaptive strategy does not mean
the best possible. Like all adaptations, life history strategy is
subject to constraints and needs only to be good
enough.
Optimal life history strategy means the best of
those existing in a certain population under
certain environmental conditions.

Crucial aspects of these schedules represent
LH Strategies
1. Age and size reproduction begins
2. Relative effort devoted to growth,
reproduction, and survival
3. The apportionment of reproductive effort
between many small or few large offspring
4. Distribution of reproductive effort over
lifetime

Investment in each
life history trait has
a benefit and a cost
to the organism.
Investment beyond
that optimum
reduces fitness by
limiting energy
available for other
important functions.

B. Trade-offs
Hypothetical Organism
-Reproduces immediately after birth
- Large number of Large offspring
- Lavishes parental Care
- Reproduces repeatedly throughout a long
life
TE = G+M+R(c+f)
For real organisms, its LH Strategy must be a
compromise or a trade-off

C. Cost of Reproduction
Individuals devoting considerable energy to
one aspect of its strategy must pay for it
by reducing investments in another.
Is there a cost to reproduction?
Nur Journal of Animal Ecology 53:479:496


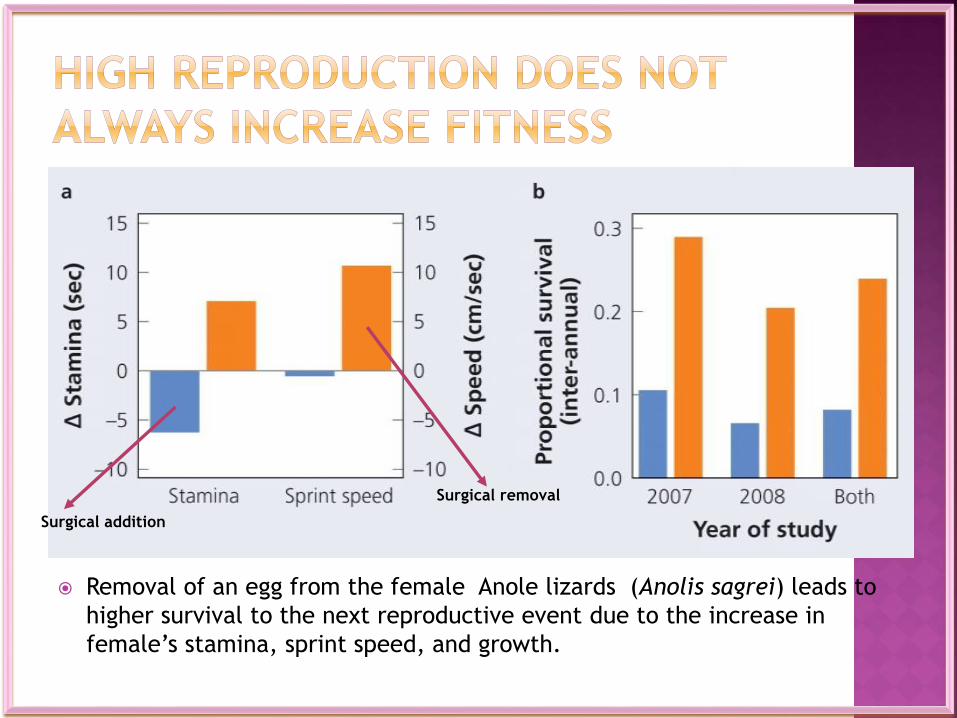
Removal of an egg from the female Anole lizards (Anolis sagrei) leads to
higher survival to the next reproductive event due to the increase in
female’s stamina, sprint speed, and growth.
Surgical removal
Surgical addition

The collared
lemming
(Dicrostonyx
groenlandicus):
the weaning
weight of
individuals in large
litters is less than
that in small
litters.


Average clutch size in birds increases with the latitude
A study of nest predation in Venezuelan cloud
forest.
Hypothesis: High predation rates in the tropics
select for smaller nests and thus smaller clutch
sizes.
Prediction 1: Nest predation rates increase with
nest size.
Prediction 2: Clutch size increases with nest
size.
Prediction 3: Nests in the tropics are smaller
than nests at higher latitudes.
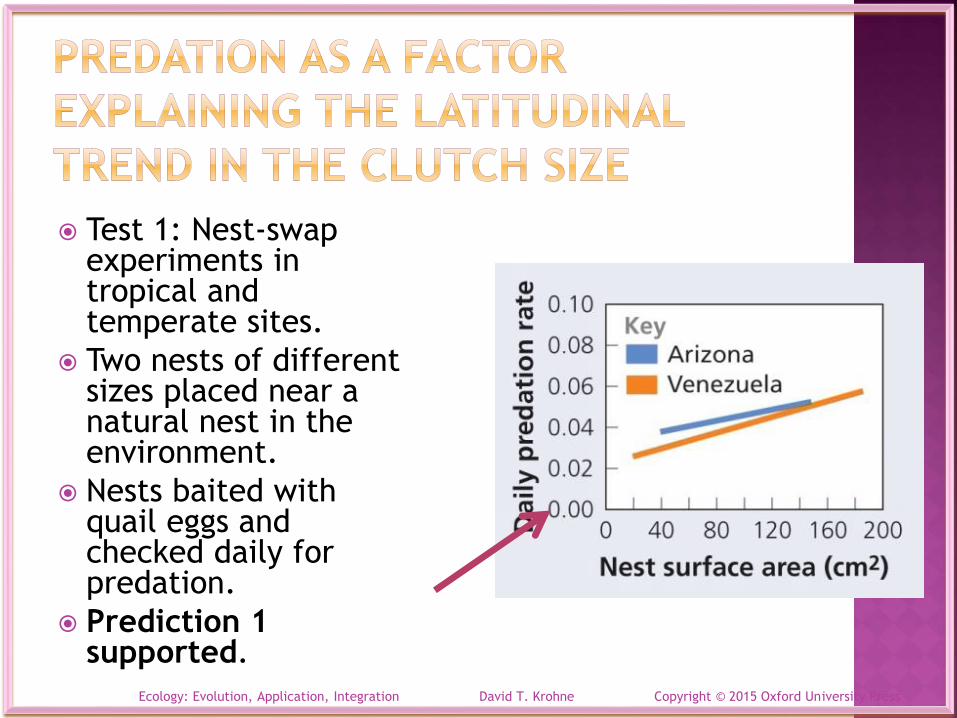
Test 1: Nest-swap experiments in tropical and temperate sites.
Two nests of different sizes placed near a natural nest in the environment.
Nests baited with quail eggs and checked daily for predation.
Prediction 1 supported.
Ecology: Evolution, Application, Integration David T. Krohne Copyright © 2015 Oxford University Press

When the nest size was
adjusted for body size, there
was no increase in clutch size
in large nests.
Prediction 2 not supported.
Tropical nests were not
smaller relative to body size
in the tropics than at higher
latitude.
Prediction 3 not supported.
Ecology: Evolution, Application, Integration David T. Krohne Copyright © 2015 Oxford University Press