a population assessment and creel survey of lake … · a population assessment and creel survey of...
TRANSCRIPT

1
A Population Assessment and Creel Survey of Lake Sturgeon in Yellow Lake,
Burnett County, Wisconsin 2005-2008
(MWIBC: 2675200)
Jamison Wendel and Larry Damman
Wisconsin Department of Natural Resources
Northern District – Spooner
November, 2011

2
Executive Summary
Due to the importance of lake sturgeon both locally and regionally, an intensive
survey of the Yellow Lake lake sturgeon population was conducted from 2005 through
2008. The goals of this survey were to assess angler effort, catch, and harvest directed
towards lake sturgeon, estimate lake sturgeon abundance, and assess population
demographics.
A total of 380 lake sturgeon were captured during this survey ranging in length
from 15 -75 in (Total length). The average length of lake sturgeon sampled was 50.9 in
and 63.8 in for males and females, respectively. Lake sturgeon abundance in Yellow
Lake was estimated at 2,007 (1,628 for fish > 45 in). [Note: Due to concerns with
recapture methods, it is not recommended that this estimate be used for exploitation
calculations or to set harvest quotas.]
The age structure of lake sturgeon from Yellow Lake was broad (3-74 years) with
consistent year classes present in recent years. Lake sturgeon growth rates were
similar to other populations in Wisconsin. However, lake sturgeon in Yellow Lake are
not achieving their maximum size potential due to a lack of fish greater than 60 years of
age in the population. This is likely due to poor recruitment and/or over harvesting from
the 1920s through 1960. Total annual mortality was very low (3.2%).
Anglers directed an estimated 4,104 hours toward lake sturgeon during the 2008
season on Yellow Lake. The projected catch of lake sturgeon was 430 fish (0.10
fish/hr). Although an estimated 26 fish of legal harvest length were captured on Yellow
Lake in 2008, no lake sturgeon were harvested by sport anglers.
The lake sturgeon population of Yellow Lake is showing signs of recovery. With
continued low mortality and consistent recruitment, the population should continue
expanding. Efforts to protect, enhance, and expand available habitat should continue.
In particular, reconnecting the Yellow Lake and St. Croix lake sturgeon populations

3
should be evaluated. Also, future close monitoring of exploitation and population
demographics need to continue to insure full recovery of the lake sturgeon fishery on
Yellow Lake.

4
Introduction
Lake sturgeon Acipenser fulvescens are considered threatened throughout much
of their historic range due to overharvest, habitat loss and fragmentation by dams
(WSCS 2005). The waters of Wisconsin collectively possess one of the largest self-
sustaining populations of lake sturgeon in the world (WDNR 2000).
With a life strategy of slow growth and late maturation, lake sturgeon are
particularly sensitive to stressors such as environmental change, barriers to fish
passage, and over-exploitation. Female lake sturgeon become sexually mature at
approximately 25 years and 55 in (Becker 1983). Once reaching maturity, females will
typically spawn every 4-6 years. Male lake sturgeon typically reach sexual maturity at
approximately 45 in and then spawn every year or every other year.
Wisconsin’s lake sturgeon management plan (WDNR 2000) recommends
managing for densities of Age 2+ fish at 250 fish/mile in inland rivers and 1.5 fish/acre in
lake systems (combination in flowages). It also recommends populations should be
ideally represented by males up to 40 years of age and females up to 70 years of age.
Yellow Lake is a large, hard water drainage lake in west central Burnett County
(Figure 1). Yellow Lake is 2,287 acres with a maximum depth of 31 feet and mean
depth of 19 feet. Water clarity is poor, with average summer secchi disk readings of five
feet (WDNR (online) 2010). The shoreline is primarily privately owned and heavily
developed. A water control structure on the Danbury Flowage maintains the lake level.
This structure serves as a barrier to fish movement from the St. Croix River. Due to this
barrier, lake sturgeon on Yellow Lake have been isolated from the St. Croix River
sturgeon since the 1930s (Johannes 1988).
The Yellow River is a tributary of the St. Croix River than flows through Yellow
Lake. The Yellow River originates as Crystal Brook and Beaver Brook in Washburn
County. Upstream of Yellow Lake, the watershed of Yellow River is 206.4 square miles.

5
The portion of the Yellow River in this study included the area immediately above Yellow
Lake upstream to Conners Bridge, a distance of 6.7 river miles (Figure 1).
Little information was known about the Yellow Lake lake sturgeon population until
anglers caught two world record (hook and line) lake sturgeon from Yellow Lake in 1979
(Johannes 1988). Due to the publicity of these world records, angler effort increased
dramatically in the following years. In response to this increased effort, a study of lake
sturgeon in Yellow Lake was initiated in 1980 (Johannes 1988). That study found the
lake sturgeon population in early stages of recovery, with most fish sampled less than 20
years of age.
Yellow Lake supports both a tribal and angler sport fishery. Tribal harvest is
managed by a quota system, with a maximum of 5% of the estimated adult population
(>45 in) available for annual harvest. The minimum length limit for sport anglers is
currently 60 in (Table 1). Since 1983, a mandatory tagging and registration system has
been in effect for all lake sturgeon harvested by sport anglers in Wisconsin. From 1983-
2008, the number of lake sturgeon registered from Yellow Lake has ranged from 0-21
fish, with an average annual sport harvest of 9.3 fish (Figure 2). A total of 11 lake
sturgeon were harvested by tribal spearers between 2000-2008, primarily from 2006-
2008.
This study was initiated to evaluate the current status of the lake sturgeon
population in Yellow Lake and Yellow River and provide additional information for
making management decisions. The specific objectives were to (1) determine lake
sturgeon population abundance, (2) assess angler effort, catch, and harvest for lake
sturgeon, and (3) document age, growth, exploitation and size structure of the lake
sturgeon population.
6
Methods
Between 2005-2008, lake sturgeon were captured in the Yellow River by a
variety of methods, including pulsed DC electrofishing, block nets, and dips nets.
Sampling coincided with spring lake sturgeon spawning runs. Each sturgeon captured
was measured to the nearest 0.1 in and sexed. All sturgeon were tagged with an
individually number Carlin disc dangler tag at the base of the dorsal fin. Beginning in
2006, lake sturgeon were marked with both a Carlin disc dangler tag and a passive
integrated transponder (PIT) tag that was injected near the base of the pectoral fin.
In addition to the spring sampling, creel survey data were collected during the
sturgeon hook and line season in September 2007 and 2008. In 2007, DNR staff tagged
angler released sturgeon. The goal of this tagging effort was to increase the number of
marked fish, particularly juveniles, for a population estimate. In 2008, a random stratified
roving access creel survey was conducted for all fish species on Yellow Lake following
Wisconsin DNR protocol (Cichosz 2010). Starting 6 September, additional creel clerks
were stationed at the lake to survey lake sturgeon anglers. The creel clerks working the
supplemental shifts worked the am or pm weekend/holiday shift not worked by the
regular creel clerk as well as a randomly selected am or pm weekday shift on the two
weekdays not worked by the regular creel clerk. Instantaneous counts of anglers
targeting lake sturgeon were conducted by creel clerks working both the regular and
supplemental shifts. Only interviews of anglers targeting lake sturgeon were included in
this assessment.
Abundance estimates for Yellow Lake sturgeon were calculated using fish tagged
during spring surveys from 2005-2008 and angler caught fish in 2007 as the marked
sample. No adjustments to marked fish at large were made for tag loss as that variable
was not quantified. Known mortalities or harvested fish were removed from the marked
sample and added back to the final population estimates. Lake sturgeon captured
7
during the creel survey in 2008 were used as the recapture sample. Population
estimates were then calculated using the Chapman modification of the Petersen
Estimator using the equation:
N = (M+1)(C+1) (R+1)
Where N is the population estimate, M is the number of fish marked, C is the total
number of fish captured in the recapture, and R is the number of marked fish captured in
the recapture. Separate population estimates were calculated for lake sturgeon < 45 in
and > 45 in. These population estimates were summed to calculate the total population
estimate.
Lake sturgeon were aged by removing a section of pectoral fin spine similar to
methods described by Rossiter et al. (1995). Fin rays were allowed to dry before a thin
cross section was cut using a Buehler low speed Isomet saw (Buehler LTD). A
compound microscope at 4-10X magnification was used to estimate age. Following the
recommendation of Bruch et al. (2009), a power function was applied to estimated ages
of lake sturgeon greater than 14 years of age using the following equation:
(true age = [estimated age]^1.054796)
Mean length at age was used to assess growth using the following von
Bertalanffy equation:
lt = L∞(1-e-K(t+to))
Where lt is length at time t, L∞ is asymptotic length, K is a growth parameter, t is
age in years, and t0 is the age at which lt is zero (Van den Avyle and Hayward 1999).
Assuming dimorphic separation of length at age (Bruch 2008), growth equations were
calculated separately for male and female lake sturgeon.
To assess relative body condition of lake sturgeon in Yellow Lake, Fulton’s
condition factor was applied using the following equation:

8
K = (W/L3) X 100,000
Where K is Fulton’s condition factor, W is weight in grams, and L is length in mm
(Anderson and Neuman 1996). To eliminate potentially biased weights of fish sampled
during spawning, only lake sturgeon captured during the hook and line season in 2007
and 2008 were assessed for condition factor.
Catch curve analysis was used to determine lake sturgeon mortality. The
descending limb of a catch curve regression was used to estimate total annual mortality
(Ricker 1975). As aging materials were not taken for all fish, an age-length key was
used to assign a sample age distribution. Since the age-length key assigned ages for
some fish, age analysis was performed by age group rather than year class. Use of this
method assumed that recruitment and survival did not vary at age over time. Lake
sturgeon age classes 19-46 provided the strongest predictive power (r2) and were
included in the catch curve regression.
Results
A total of 380 lake sturgeon were sampled during this survey (including fish
captured during spring spawning runs and by anglers), ranging in length from 15-75 in
(Figure 3). Lake sturgeon from 45-55 in were captured in much greater proportion by
anglers than fish sampled during spring spawning assessments (Figure 4). The average
length of all lake sturgeon greater than or equal to 45 in was 57.7 (S.D. 7.5, N = 130)
and 52.6 (S.D. 5.8, N = 128) in for spawning surveys and angler caught fish,
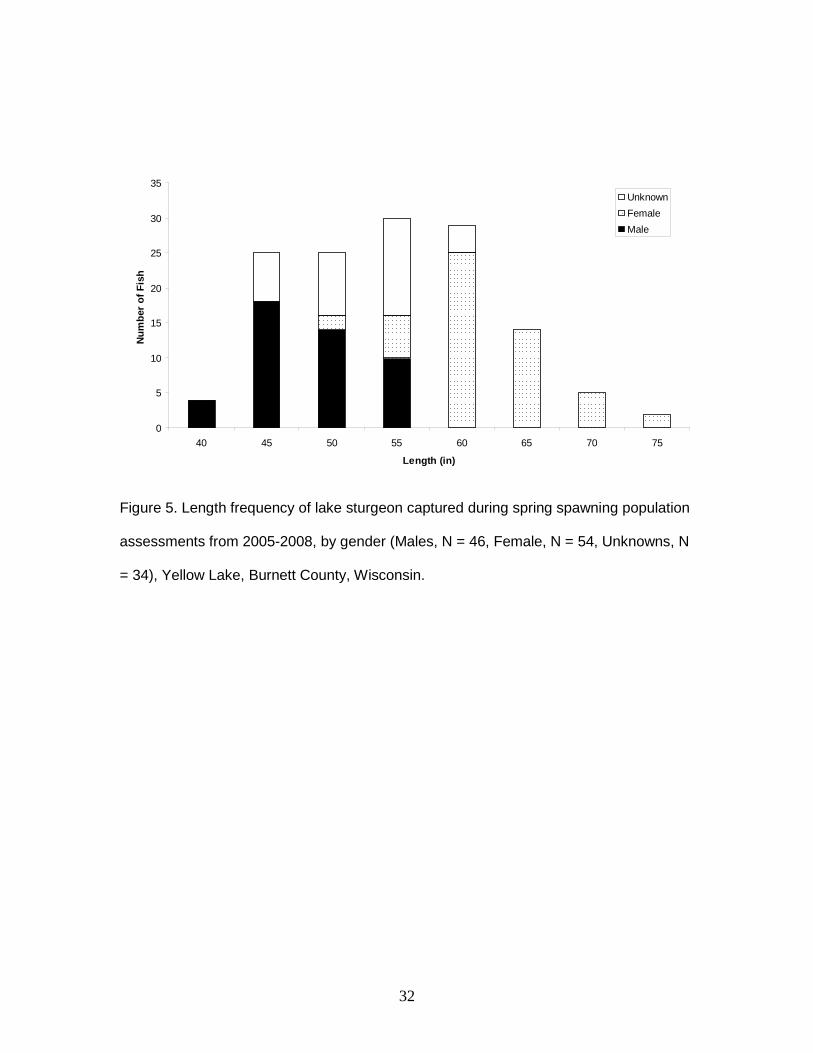
respectively. During spring spawning assessments, male lake sturgeon lengths ranged
from 43.5-59.5 in (mean 50.9, S.D. = 4.3, N = 46) while females ranged from 54.0-77.0
in (mean 63.8, S.D. = 5.0, N = 54; Figure 5).
Population abundance of lake sturgeon in 2008 greater than or equal to 45 in
was 1,628 (95% C.I. 753-2,509, C.V. 0.28; Table 2). This estimate was substantially

9
higher than the 1986 estimate of 288 fish greater than or equal to 45 in (95% C.I. 143-
630, C.V. 0.28). The estimated number of lake sturgeon less than 45 in was 379 (95%
C.I. 145-718, C.V. 0.34), for a total population estimate of 2,059 (95% C.I. 1,135-2,982,
C.V. 0.23) or 0.88 fish/acre. Due to the broad range of ages present in the population,
estimates by age class were not calculated.
Of the 43 angler caught lake sturgeon marked in September 2007, 10 were
recaptured by anglers in September 2008 (R/M=0.23). However, of the 134 lake
sturgeon marked during spring spawning assessments, four were recaptured by anglers
in September 2008 (R/M=0.03).
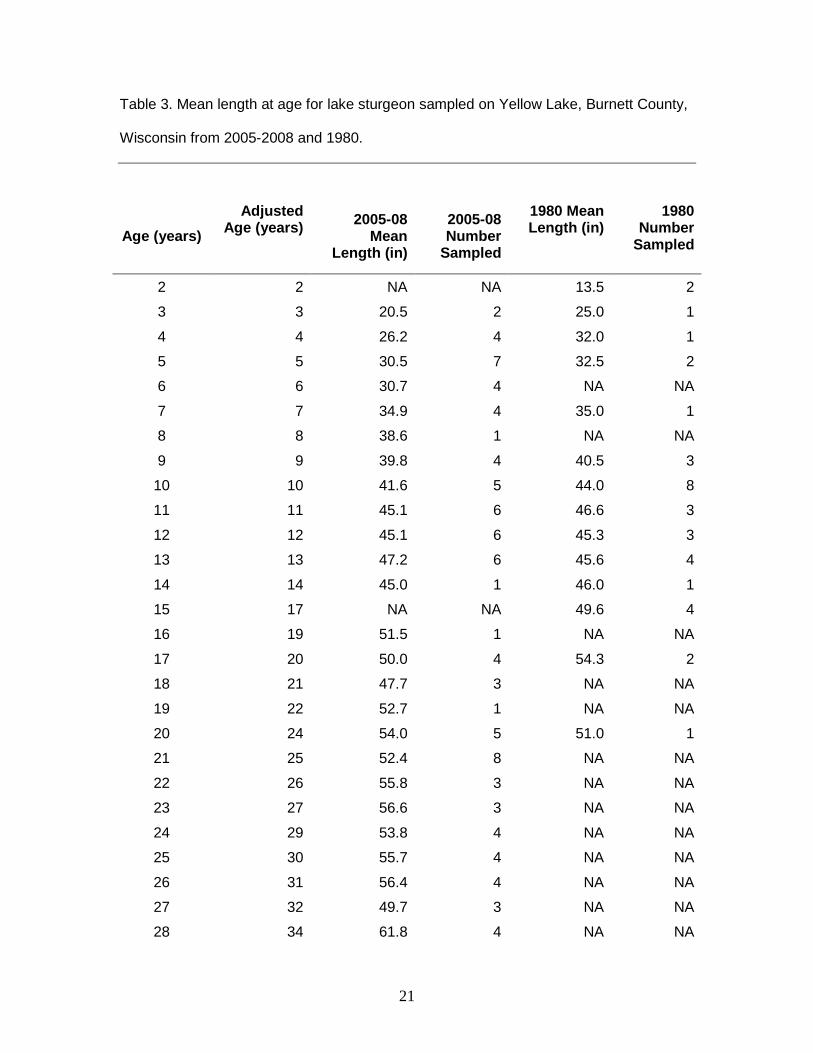
Age was determined on a total of 146 lake sturgeon and ranged from age 3 to 74
years (Table 3). The mean of mean lengths for ages 23-27 was established by Fortin et
al. (1996) to compare lake sturgeon growth rates for populations in Canada and USA.
The Yellow Lake lake sturgeon population mean of mean lengths for ages 23-27 was
54.4 in. Values from the von Bertalanffy growth equation indicate male and female lake
sturgeon in Yellow Lake have slower growth than their Lake Winnebago counterparts
(Table 4; Figure 6). However, values for the Yellow Lake population are likely biased by
a lack of older and larger fish. The von Bertalanffy growth curve for all lake sturgeon
assessed from Yellow Lake was similar to other populations (Figure 7).
Fulton’s condition factor was assessed for 55 lake sturgeon captured by anglers
in 2007-2008. Condition factors ranged from 0.43 to 0.85 with a mean of 0.63 (95% C.I.
0.44-1.07). Condition factor was slightly positively correlated with total length (r2=0.30;
Figure 8). Mean condition factor was similar to other reported populations (Table 5).
Total instantaneous mortality (Z) for age classes 19-46 was 0.0328 (r2=0.77;
Figure 9). Total annual mortality (A) for lake sturgeon was calculated to be 3.2%, with
annual survival of 96.8%. This estimate of mortality was lower than reports from other
surveys (Table 6).

10
Anglers directed an estimated 4,104 hours of effort (1.8 hours/acre) towards lake
sturgeon during the open season in September, 2008. This amount of effort is much
higher compared to creel surveys conducted on Yellow Lake in the 1980s (2.257-2,830
hrs; Table 7), even though the length of the season was shorter in 2008. Lake sturgeon
catch rates and projected catch were also higher in the 2008 survey than any of the
surveys from the 1980s (Table 7). Catch rate in 2008 was estimated at 0.10 fish/hr
compared to 0.05 – 0.09 fish/hr from 1980 to 1986. Similarly, lake sturgeon catch in
2008 was estimated at 430 fish compared to 73-175 fish during the 1980s surveys. No
lake sturgeon were registered as harvested from Yellow Lake in 2008.
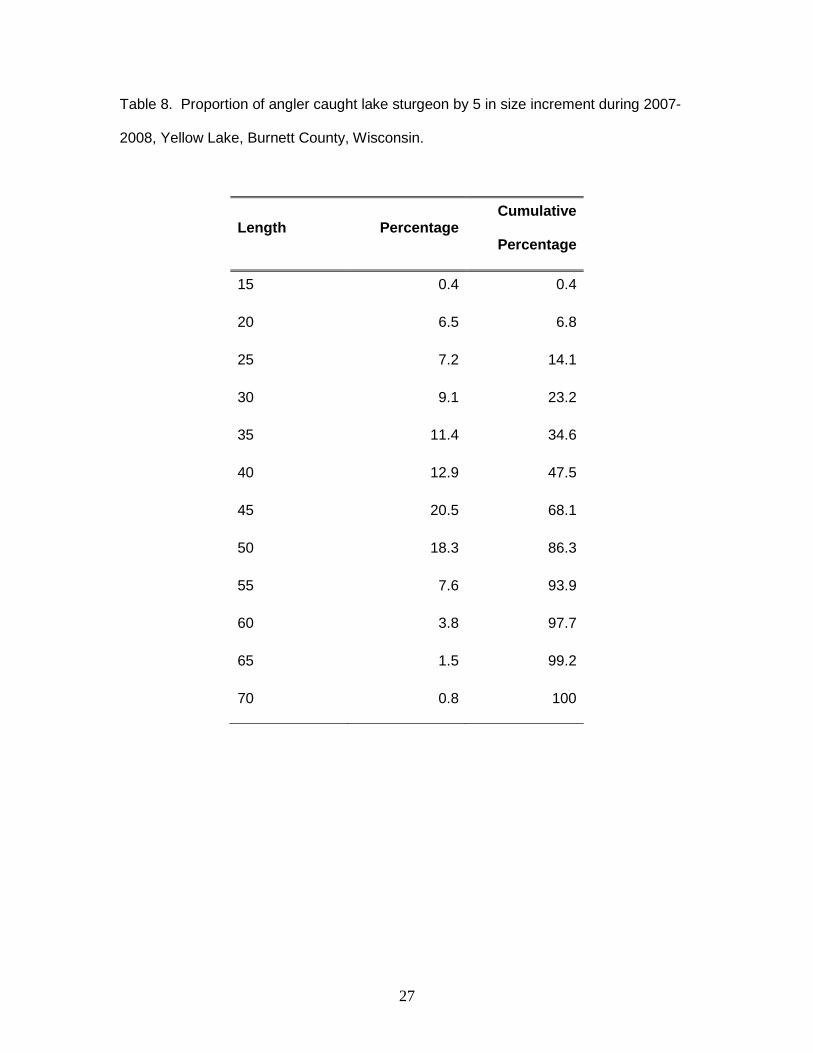
The mean length of lake sturgeon caught by anglers on Yellow Lake in 2007-
2008 was 43.9 in (N = 263, S.D. = 11.3), with a range of 16.0-71.2 inches (Figure 10).
During the two years where angler lake sturgeon catch was examined, 93.9% of the fish
were below the legal length limit of 60 in (Table 8). Applying this percentage to the
overall estimated catch rates from the 2008 creel survey yields a value of .0061 legal
lake sturgeon caught per hour (164 hours/fish) and a projected catch of 26 legal length
lake sturgeon.
Discussion
The lake sturgeon population in Yellow Lake shows no signs of overexploitation.
Total annual mortality was estimated to be 3.4%, below the 5% exploitation
recommended by the Wisconsin lake sturgeon management plan (WDNR 2000). Lake
sturgeon harvest has averaged 9.7 fish per year since 1983. Harvest has remained
relatively low due to the catch and release ethic of lake sturgeon anglers on Yellow
Lake. For example, in 2008, sport angler harvest was zero, though an estimated 26
legal size lake sturgeon were caught.
11
The current 60 in minimum length limit focuses most lake sturgeon harvest on
adult females as the largest male lake sturgeon sampled was 59.5 in. The Wisconsin
lake sturgeon management plan recommends average annual exploitation of
populations remains at or near 5%. Although calculating population estimates by gender
would be very difficult, attempts should be made to ensure exploitation of female lake
sturgeon does not exceed 5%.
Based on the recommendations of Wisconsin’s lake sturgeon management plan
(WDNR 2000), the lake sturgeon population of Yellow Lake is still in recovery phase.
The estimated population of lake sturgeon in Yellow Lake (0.88 fish/acre) is well below
the 1.5 fish/acre recommended by the management plan for lake systems. The age
structure of the Yellow Lake population is close to or exceeding the management plan’s
recommendations of males up to 40 years and females up to 70 years of age. Adjusted
ages of four males were greater than 40 years. Only one fish was aged at greater than
70 years.
The age structure of lake sturgeon in Yellow Lake has improved since the
previous survey (Johannes 1988). In 1980, the lake sturgeon population was dominated
by fish less than 20 years of age (Table 5). This lack of fish between 21-60 years of age
(one 35 year old fish) suggests significant recruitment failures and/or over-exploitation
occurred from the 1920s through 1950s on Yellow Lake. The lake sturgeon age
structure in this survey was much broader, with many fish older than 30 years of age.
Recruitment has also been very consistent in recent years, with few missing year
classes under 45 years of age. This indicates the population is much more stable now
than in 1980 and progressing towards full recovery.
Lake sturgeon on Yellow Lake do not appear to have reached their maximum
length potential. The von Bertalanffy growth curve for female lake sturgeon was very
close to linear, with a very high L∞, suggesting more maximum length potential. There
12
was a lack of fish aged over 60 years in this study which would correspond to fish
closest to achieving their maximum length. This would correspond to fish hatched from
the 1920s through the 1940s. Fish hatched in those years were also poorly represented
in the 1980 survey (Johannes 1988). As more fish are able to survive past 60 years of
age, the lake sturgeon population should have more fish attaining their maximum size.
Lake sturgeon growth rates for the Yellow Lake population appear to exceed
regional averages. The Yellow Lake population’s mean of mean lengths for ages 23-27
value of 54.7 in exceeded 29 of 32 populations reported by Fortin et al. (1996).
However, Yellow Lake is located at a more southern latitude than many of these surveys
and some of the variation in lake sturgeon size can be explained by latitude (Power and
McKinley 1997).
Numerous challenges unique to lake sturgeon make calculating an accurate
population estimate difficult. Lake sturgeon are highly vulnerable to sampling gear
during spring spawning migrations up the relatively shallow Yellow River. However,
periodicity of lake sturgeon spawning (Becker 1983) makes the objective of sampling the
entire population unachievable at that time. Therefore, numerous years of sampling are
required to assess an entire adult population but none could be used as a recapture
sample as only a fraction of the population would be vulnerable.
In this study, the fall angling season was used as the recapture event. However,
lake sturgeon captured by anglers in 2007 were much more likely to be recaptured by
anglers in 2008 (R/M = 0.23) than fish marked during spring surveys (R/M = 0.03).
These differences in recapture ratios may have been caused by anglers targeting
specific segments of the population, lower catchability for mature fish, or very high rates
of tag loss for adult lake sturgeon. Also, using fall angling as the recapture may bias the
adult population estimate as immature sturgeon greater than 45 in would not be
vulnerable to spring sampling assessments but may be part of the recapture sample.

13
Another possible source of error in generating a population estimate for this
survey was that unmarked fish sampled during the 2008 recapture were not tagged.
Therefore, if an unmarked fish were captured more than once, each time it was captured
would be included in the population estimate. Given the high probability of lake
sturgeon marked in 2007 to be recaptured in 2008 (R/M=0.23), it is likely that some fish
were captured more than once during the 2008 angler survey. This potentially could
bias the recapture ratio and inflate the population estimate. With the bias and
uncertainty in these estimates, we do not recommend calculating harvest quotas based
off of these estimates.
Future work should focus on obtaining annual estimates of the male and female
lake sturgeon population using tag and recapture data from spring surveys only. This
would require the use of an open population model such as the Jolly Seber method
outlined by Bruch (2008) for the Lake Winnebago sturgeon population. Due to the
spawning periodicity of adult lake sturgeon, Bruch (2008) recommended not using the
Jolly Seber model for the first two and last two years of surveys for females and first and
last years of surveys for males. As such, no population estimates were calculated from
data included in this report.
Conclusions and Management Recommendations
1. Although the population of lake sturgeon is showing many positive signs toward
recovery, it is recommended that it still be considered a recovering population.
While there is a strong base of fish aged at 30-38 years, only four fish were >40
years old.
2. The lake sturgeon population of Yellow Lake has been isolated from the St. Croix
population since the dam was created on the Danbury Flowage in the 1930s.
Lake sturgeon have shown resilience to genetic impacts due to their long
14
generation time (Wozney et al. 2011). However, reconnecting the Yellow Lake
population to the St. Croix River population would insure maintenance of genetic
diversity as well as link critical habitat for both populations. Efforts to allow fish
passage at the Danbury Flowage dam should be evaluated.
3. No signs of over-exploitation have been exhibited to date. Close monitoring of
sport and tribal harvest of lake sturgeon needs to continue. Any signs of over-
exploitation need to be addressed through regulation changes or quota
modifications.
4. Continued monitoring of age, growth, and density is needed to document any
population changes. Methods to assess lake sturgeon recruitment are lacking.
Wading and haul-seine surveys have proven effective to sample age-0 lake
sturgeon in areas characterized by low current velocity and high water clarity
(Benson et al. 2005). Use of these methods for the Yellow Lake system should
be explored.
5. Critical lake sturgeon habitat, both in the Yellow River and Yellow Lake, need to
be protected and enhanced where possible. Efforts should be made to work with
the Yellow Lakes and River Association and lake sturgeon anglers stressing the
importance of protecting critical lake sturgeon habitat.
6. Outreach to sturgeon anglers and local lake and river groups should continue.
Opportunities to educate the public about this unique fish are critical to lake
sturgeon recovery.
Acknowledgements
We would like to thank Phil Stromberg and family for generously allowing us to
access the Yellow River from their property. Also, we would like to thank Kent Bass,
Misty Rood and the other biologists and technicians of the Wisconsin Department of

15
Natural Resources who conducted and field work, aged fish, and entered data during
this study. Ron Bruch provided valuable lake strurgeon insight. Terry Margeneau
provided a critical review of the manuscript.

16
Literature Cited
Adams, W.E. Jr., L.W. Kallemeyn, and D.W. Willis. 2006. Lake sturgeon population
characteristics in Rainy Lake, Minnesota and Ontario. Journal of Applied
Ichthyology 22:97-102.
Anderson, R.O. and R.M. Neumann. 1996. Length, weight, and associated structural
Indices. Pages 447-482 in B.R. Murphy and D.W. Willis, editors. Fisheries
techniques, 2nd edition. American Fisheries Society, Bethesda, Maryland.
Becker, G.C. 1983. Fishes of Wisconsin. University of Wisconsin Press, Madison.
Benson, A.C., T.M. Sutton, R.F. Elliott, and T.G. Meronek. 2005. Evaluation of
sampling techniques for age-0 lake sturgeon in a Lake Michigan tributary. North
American Journal of Fisheries Management 25:1378-1385.
Bruch, R.M. 2008. Modeling the population dynamics and sustainability of lake
sturgeon in the Winnebago system, Wisconsin. Dissertation Ph.D. University of
Wisconsin-Milwaukee pp 269.
Bruch, R.M., S.E. Campana, S.L. Davis-Foust, M.J. Hansen, and J. Janssen. 2009.
Lake sturgeon age validation using bomb radiocarbon and known-age fish.
Transactions of the American Fisheries Society 138:361-372.
Cichosz, T.A. 2010. 2007-2008 Ceded territory fishery assessment report. Wisconsin
Department of Natural Resources. Administrative Report 65, Madison.
Dieterman, D.J., J. Frank, N. Painovich, and D.F. Staples. 2010. Lake sturgeon
population status and demography in the Kettle River, Minnesota, 1992-2007.
North American Journal of Fisheries Management 30:337-351.
Fortin, R., P. Dumont, and S. Guenette. 1996. Determinants of growth and body
condition of lake sturgeon (Acipenser fulvescens). Canadian Journal of Fisheries
and Aquatic Sciences 53:1150-1156.

17
Johannes, S.J. 1988. Lake sturgeon report – Yellow Lake, Burnett county project (FM-
860). Wisconsin Department of Natural Resources, Internal Fisheries
Management Report. Spooner Field Office.
Power, M., and R.S. McKinley. 1997. Latitudinal variation in lake sturgeon size as
related to the thermal opportunity for growth. Transactions of the American
Fisheries Society 126:549-558.
Ricker, W.E. 1975. Computation and interpretation of biological statistics of fish
populations. Bulletin. Fisheries Research Board of Canada 191. 382p.
Rossiter, A., D.L.G. Noakes, and F.W.H. Beamish. 1995. Validation of age estimation
for the lake sturgeon. Transactions of the American Fisheries Society 124:777-
781.
Smith, K.M., and E.A. Baker. 2005. Characteristics of spawning lake sturgeon in the
Upper Black River, Michigan. North American Journal of Fisheries Management
25:301-307.
Solomon, L., and C. Baljko. 2011. A population assessment of lake sturgeon in
Sturgeon Lake, Quetico Provincial Park: 2008-2010. Quetico Provincial Park.
Completion Report.
Stewig, J.D. 2005. A population assessment of the lake sturgeon in Lake of the Woods
and the Rainy River, 2004. Minnesota Department of Natural Resources. Area
F111.
Thomas, M.V., and R.C. Haas. 2004. Abundance, age structure, and spatial distribution
of lake sturgeon Acipenser fulvescens in the St. Claire system. Michigan
Department of Natural Resources. Report 2076, Harrison.
Van den Avyle, M.J. and Hayward, R.S. 1999. Dynamics of exploited fish populations.
Pages 127-166 in C.C. Kohler and W.A. Hubert, editors. Inland fisheries

18
management in North America, 2nd edition. American Fisheries Society,
Bethesda, Maryland.
WDNR (online) 2010. Citizen monitoring lake water quality database. Available from:
http://dnr.wi.gov/lakes/CLMN/about.html.
WDNR 2000. Wisconsin’s lake sturgeon management plan. Wisconsin Department of
Natural Resources, Bureau of Fisheries Management and Habitat Protection.
Wozney, K.M., T.J. Haxton, S. Kjartanson, C.C. Wilson. 2011. Genetic assessment of
lake sturgeon population structure in the Ottawa River. Environmental Biology of
Fishes 90:183-195.
WSCS 2005. Ramsar declaration on global sturgeon conservation: A document
prepared by the ISS5 participants and jointly published by WSCS, and the ISS5
organizers.

19
Table 1. Recent history of angling regulation on Yellow Lake, Burnett County,
Wisconsin.
Years Season
Limit/Angler Size Limit
Length of
Season
1980-1990 1 45 in minimum
First Saturday
in September-
10/15
1991-2006 1 50 in minimum
First Saturday
in September-
10/15
2007-Present 1 60 in minimum
First Saturday
in September-
9/30

20
Table 2. Summary of lake sturgeon population estimate for Yellow Lake, Burnett
County, Wisconsin from 2005-2008. Three marked lake sturgeon > 45 in were
harvested during this study. These fish were removed from the marked sample and
added to the population estimate. Note: Population estimates are not recommended for
use in calculating exploitation or setting harvest quotas.
Parameter M C R Estimate Lower
Bound
Upper
Bound
C.V.
< 45 in total length 29 99 6 429 145 718 0.34
> 45 in total length 148 120 10 1,642 758 2,526 0.28
Total Population 176 219 16 2,071 1,143 3,002 0.23
21
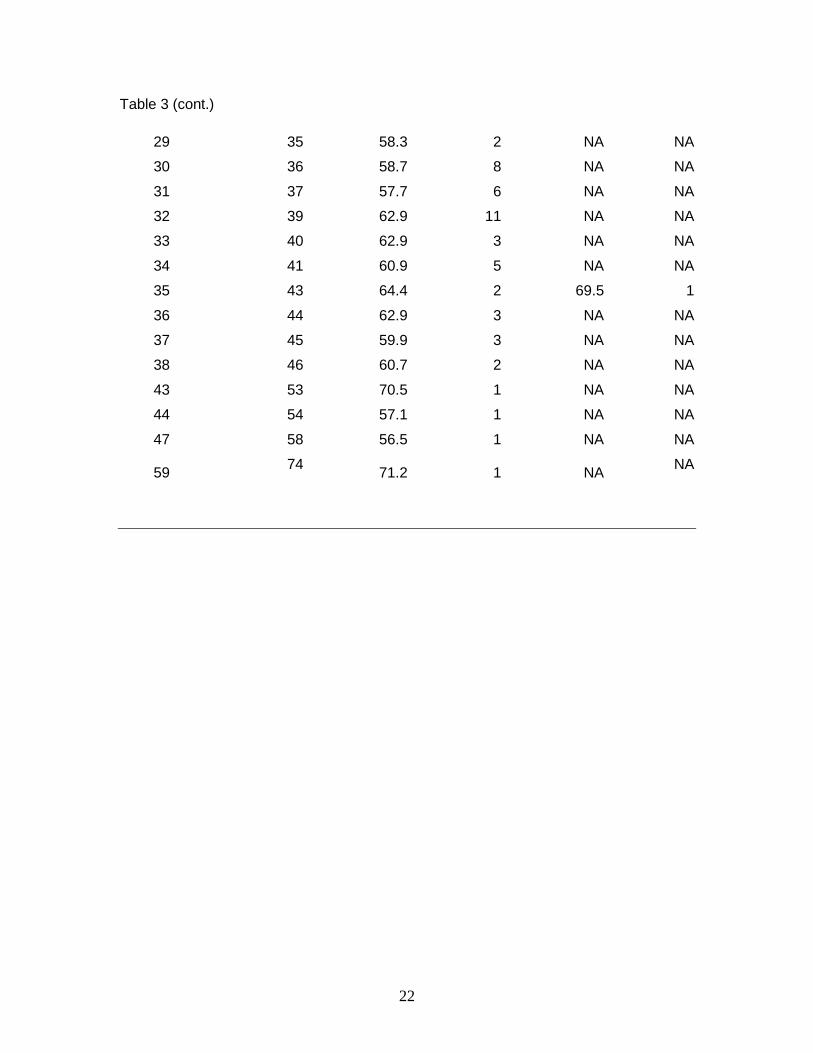
Table 3. Mean length at age for lake sturgeon sampled on Yellow Lake, Burnett County,
Wisconsin from 2005-2008 and 1980.
Age (years) Adjusted
Age (years) 2005-08 Mean
Length (in)
2005-08 Number
Sampled
1980 Mean Length (in)
1980 Number
Sampled
2 2 NA NA 13.5 2
3 3 20.5 2 25.0 1
4 4 26.2 4 32.0 1
5 5 30.5 7 32.5 2
6 6 30.7 4 NA NA
7 7 34.9 4 35.0 1
8 8 38.6 1 NA NA
9 9 39.8 4 40.5 3
10 10 41.6 5 44.0 8
11 11 45.1 6 46.6 3
12 12 45.1 6 45.3 3
13 13 47.2 6 45.6 4
14 14 45.0 1 46.0 1
15 17 NA NA 49.6 4
16 19 51.5 1 NA NA
17 20 50.0 4 54.3 2
18 21 47.7 3 NA NA
19 22 52.7 1 NA NA
20 24 54.0 5 51.0 1
21 25 52.4 8 NA NA
22 26 55.8 3 NA NA
23 27 56.6 3 NA NA
24 29 53.8 4 NA NA
25 30 55.7 4 NA NA
26 31 56.4 4 NA NA
27 32 49.7 3 NA NA
28 34 61.8 4 NA NA
22
Table 3 (cont.)
29 35 58.3 2 NA NA
30 36 58.7 8 NA NA
31 37 57.7 6 NA NA
32 39 62.9 11 NA NA
33 40 62.9 3 NA NA
34 41 60.9 5 NA NA
35 43 64.4 2 69.5 1
36 44 62.9 3 NA NA
37 45 59.9 3 NA NA
38 46 60.7 2 NA NA
43 53 70.5 1 NA NA
44 54 57.1 1 NA NA
47 58 56.5 1 NA NA
59 74 71.2 1 NA NA

23
Table 4. von Bertalanffy growth parameters for male and female lake sturgeon from
Yellow Lake (current study), Burnett County, Wisconsin, and Lake Winnebago (Bruch
2008).
Parameter All Fish
(Yellow Lake)
Males
(Yellow
Lake)
Males
(Winnebago)
Females
(Yellow
Lake)
Females
(Winnebago)
L∞ (in) 63.86 63.54 65.51 105.80 74.38
K .066 .028 .052 .011 .045
T0 -4.6 -30.6 -4.5 -41.5 -2.5

24
Table 5. Fulton’s condition factor values for the lake sturgeon population on Yellow
Lake, Burnett County, Wisconsin, and compared to other populations.
Population and Source Mean condition
factor (K) Range (K)
Yellow Lake (Present Study) 0.63 0.43-0.85
Lake of the Woods, MN (Stewig 2005) 0.674 0.07-1.14
Sturgeon Lake (Solomon and Baljko 2011) 0.56 0.42-0.75

25
Table 6. Lake sturgeon mortality rates estimated on Yellow Lake, Burnett County,
Wisconsin, and compared to other populations. Age classes for the present study on
Yellow Lake were adjusted based on the power function developed by Bruch et al.
(2009).
Population and Source Age Classes
Assessed A r2
Yellow Lake (Present Study) 19-46 0.03 0.77
Lake of the Woods, MN (Stewig 2005) 20-31 0.12 0.77
Kettle River, MN (Dieterman et al. 2010) 11-35 0.20 NA
Lake St. Claire, MI (Thomas and Haas 2004) NA 0.09 0.85
Rainy Lake, MN (Adams et al. 2006) 20-39 0.05 0.65

26
Table 7. Summary of lake sturgeon creel statistics for Yellow Lake, Burnett County,
Wisconsin.
Variable 1980 1981 1982 1983 1986 2008
Projected Total Effort
During Sturgeon
Season (hrs)
4,810 7,218 6,198 6,753 5,195 7,423
Directed Lake
Sturgeon Effort (hrs) 2,612 2,830 2,257 2,636 791 4,104
Lake Sturgeon Catch
Rate (fish/hr) .07 .05 .07 .07 .09 .10
Projected Number of
Lake Sturgeon Caught 175 150 158 174 73 430
27
Table 8. Proportion of angler caught lake sturgeon by 5 in size increment during 2007-
2008, Yellow Lake, Burnett County, Wisconsin.
Length Percentage Cumulative
Percentage
15 0.4 0.4
20 6.5 6.8
25 7.2 14.1
30 9.1 23.2
35 11.4 34.6
40 12.9 47.5
45 20.5 68.1
50 18.3 86.3
55 7.6 93.9
60 3.8 97.7
65 1.5 99.2
70 0.8 100

28
Figure 1. Map of study area, including Yellow Lake and Yellow River upstream to
Conners Bridge, Burnett County, Wisconsin. Map created with Terrain Navigator
software (Maptech 2001).
Conners Bridge, boundary of study area.

29
0
5
10
15
20
25
1983 1985 1987 1989 1991 1993 1995 1997 1999 2001 2003 2005 2007
Year
Num
ber o
f Lak
e St
urge
on H
arve
sted
40
45
50
55
60
65
Mea
n Le
ngth
of H
arve
sted
Lak
e St
urge
on
Tribal HarvestSport HarvestMean Length
Figure 2. Sport and tribal lake sturgeon harvest on Yellow Lake, Burnett County,
Wisconsin.

30
0
10
20
30
40
50
60
70
80
90
15 20 25 30 35 40 45 50 55 60 65 70 75
Length (in)
Lake
Stu
rgeo
n Ca
ptur
ed
Figure 3. Length frequency of all lake sturgeon captured (N = 380) in Yellow Lake,
Burnett County, Wisconsin from 2005-2008.

31
0
0.05
0.1
0.15
0.2
0.25
0.3
0.35
0.4
0.45
45 50 55 60 65 70 75
Length (in)
Prop
ortio
n of
Lak
e St
urge
on C
aptu
red
SpringAngling
Figure 4. Proportion of lake sturgeon greater than or equal to 45 in captured by angling
and during spring spawning (N = 258) in Yellow Lake, Burnett County, Wisconsin. Solid
bars represent fish captured during spring spawning assessments from 2005-2008.
Dotted bars represent fish captured by anglers during the 2007 and 2008 fall hook and
line seasons.
32
0
5
10
15
20
25
30
35
40 45 50 55 60 65 70 75
Length (in)
Num
ber o
f Fis
h
UnknownFemaleMale
Figure 5. Length frequency of lake sturgeon captured during spring spawning population
assessments from 2005-2008, by gender (Males, N = 46, Female, N = 54, Unknowns, N
= 34), Yellow Lake, Burnett County, Wisconsin.

33
22
27
32
37
42
47
52
57
62
67
72
0 10 20 30 40 50 60 70 80
Age
Leng
th (i
n)
Male Female Male vonB Female vonB
Figure 6. Length at age for male and female lake sturgeon sampled from 2005-2008 in
Yellow Lake, Burnett County, Wisconsin. Age classes were adjusted based on the
power function developed by Bruch et al. (2009).

34
0
10
20
30
40
50
60
70
80
5 10 15 20 25 30 35 40 45
Age (Years)
Leng
th (i
n) Yellow Lake (current study)
Lake of the Woods (Stewig 2005
Black Lake (Smith and Baker2005)Rainy Lake (Adams et al. 2006)
Figure 7. von Bertalanffy growth curves for Yellow Lake, Burnett County, Wisconsin
compared to other populations. Growth curves include males, females, and unknown
sex fish.

35
y = 0.0041x + 0.4548r2 = 0.2993
0
0.1
0.2
0.3
0.4
0.5
0.6
0.7
0.8
0.9
0 10 20 30 40 50 60 70 80
Length (in)
Cond
ition
Fac
tor
Figure 8. Fulton’s condition factor for lake sturgeon sampled from Yellow Lake, Burnett
County, Wisconsin.

36
0
0.5
1
1.5
2
2.5
3
3.5
4
4.5
5
19 20 21 22 24 25 26 27 29 30 31 32 33 34 35 36 37 38 39 40 41 42 43 44 45 46
Age (Years)
Log
(Num
ber)
Figure 9. Catch curve for lake sturgeon sampled from Yellow Lake, Burnett County,
Wisconsin. Age classes were adjusted based on the power function developed by Bruch
et al. (2009).

37
0
10
20
30
40
50
60
15 20 25 30 35 40 45 50 55 60 65 70 75
Length (in)
Num
ber o
f Fis
h
Figure 10. Length frequency of angler caught lake sturgeon (N = 263) in Yellow Lake,
Burnett County, Wisconsin in 2007-2008.