a policymaker's primer on education research: how to ... · education research: how to...
TRANSCRIPT

A Policymaker’s Primer on Education Research: How to Understand, Evaluate and Use It
Written by PATRICIA A. LAUER Mid-continent Research for Education and Learning (McREL)
A joint effort of Mid-continent Research for Education and Learning and the Education Commission of the States
February 2004

© 2004 Mid-continent Research for Education and Learning. All rights reserved.
These materials were developed with federal funds from the U.S. Department of Education under McREL’s Regional Educational Laboratory contract number ED-01-CO-0006 and under a grant to the Education Commission of the States from the U.S. Department of Education’s Fund for the Improvement of Education, award number R215U000010.
The content of this document does not necessarily reflect the views or policies of the Department of Education nor does the mention of trade names, commercial products or organizations imply endorsement by the U.S. Government.

i
Table of Contents Foreword.............................................................................................................................................................ii
Acknowledgments.............................................................................................................................................iii
About the Primer ...............................................................................................................................................1
How Do I Know What the Research Says?...................................................................................................6
How Do I Know if the Research Is Trustworthy? .....................................................................................16
How Do I Know if the Research Warrants Policy Changes? ...................................................................34
Understanding Statistics Tutorial...................................................................................................................37
Searching ERIC Tutorial ................................................................................................................................49
Glossary of Education Research Terms .......................................................................................................51
Appendix A: A Research Typology............................................................................................................ A-1
Appendix B: NRC’s Principles of Scientific Research .............................................................................B-1

ii
Foreword As part of our ongoing efforts to enhance the ability of our constituents and friends to make good use of the research in education in crafting policy alternatives, the Education Commission of the States (ECS) and Mid-continent Research for Education and Learning (McREL) are pleased to make available this Policymaker’s Primer on Education Research. Funded by the U.S. Department of Education, the Primer was originally conceived by ECS as part of a larger project that seeks to improve the connection between research and policy and includes several reports on the state of research in education. The first of those reports has been now published as Eight Questions on Teacher Preparation: What Does the Research Say? and two others will follow.
The Primer is intended not only to illuminate further some of the technical statistical and scientific concepts touched upon in these reports but, more importantly, to stand on its own as a useful reference for those who would like to gain a deeper understanding of education research methodology. In addition to providing a deeper understanding, we want the Primer to serve the real-world needs of those who want to incorporate the findings of research in policy decisions, and so the Primer includes some practical “tools” we hope will serve that purpose. We’ve also worked hard to make this online version of the Primer user-friendly and highly interactive, with innovative graphics and other features that take full advantage of the Web-based medium.
Ultimately, the success of the Primer in making very technical material more accessible is to be attributed to the exceptional efforts of its author, Patricia Lauer, Principal Researcher at McREL, and the guidance of our own Michael Allen, ECS Program Director. And we, of course, owe a debt of gratitude to the U.S. Department of Education for funding this publication.
We hope this Primer becomes a useful, even indispensable resource in the effort to increase the role of research in crafting education policy.
Ted Sanders President Education Commission of the States

iii
Acknowledgments This Primer is a joint effort of Mid-continent Research for Education and Learning (McREL) and the Education Commission of the States (ECS) to help make education research more accessible to policymakers. ECS provided the original impetus for the project and the Web design, and McREL provided the technical expertise, primarily through the Primer’s author, Patricia A. Lauer.
While the yeoman’s work for the Primer was accomplished by its author, several other people also deserve acknowledgment for their efforts. Michael Allen, of ECS, provided ongoing guidance and served as principal editor. Zoe Barley and Lou Cicchinelli, of McREL, also provided helpful guidance and suggestions. Rick Griffith, of o2 Group, engineered the Primer’s graphic design and Web functionality. Additional editorial review was provided by Barbara Gaddy and Mya Martin-Glenn, of McREL, and Dale DeCesare and Josie Canales, of ECS.
Funding was provided by the U.S. Department of Education, under McREL’s Regional Educational Laboratory contract and through a grant to ECS from the Fund for the Improvement of Education. Particular thanks go to Thelma Leenhouts, program officer for the ECS grant, for her patience and support.

A Policymaker’s Primer on Education Research 1
About the Primer
Goal of the Primer
The goal of this Policymaker’s Primer on Education Research is to help policymakers and other interested individuals answer three big questions:
1. What does the research say?
2. Is the research trustworthy?
3. How can the research be used to guide policy?
Answering these questions will help policymakers:
• Make evidenced-based decisions about education policies
• Gain a better understanding of research methods
• Become more informed consumers of research.
Primer Components
The Applied Quick Primer enables the user to gain a quick, basic appreciation for many of the key concepts in education research in the process of assessing the usefulness of a research study. For the busy policymaker or other individual who would rather “learn by doing,” the Quick Primer provides that opportunity although it will not give the same depth of understanding as reading the complete Primer.
How Do I Know What the Research Says? How Do I Know If the Research Is Trustworthy? How Do I Know If the Research Warrants Policy Changes? At the heart of the Primer are these questions. The discussion in these sections is meant to provide a basic understanding of education research and its relation to policy.
The Understanding Statistics Tutorial explains basic statistical concepts commonly used in education research. It includes several dynamic components intended to give the reader a more graphic understanding of the concepts discussed.
The Searching ERIC Tutorial shows the user how to locate research studies and other publications listed in the U.S. Department of Education’s ERIC database. ERIC, which stands for Educational Resources Information Center, is one of the most powerful and comprehensive sources available for locating education-related literature that can be useful to policymakers and others.
The Glossary is an alphabetical list of terms used in education research that provides user-friendly definitions. The glossary terms are placed in italics throughout the Primer.
The Appendices include discussions of concepts included in the main body of the Primer but covered here in more detail.
A Policymaker’s Primer on Education Research 2
• A Research Typology explains different kinds of methods education researchers use and the relationships among the various methods
• NRC’s Principles of Scientific Research in Education is a discussion of the six principles the National Research Council (NRC) believes should guide education research. The NRC is one of the most highly respected scientific institutions in the United States, and its statement of the six principles is widely recognized by researchers.
Please note that the primer was designed to serve as an interactive tool. The online version contains additional features and graphics, including animated charts and an interactive “analyzing research flowchart” not contained in this print version. Online versions of the printer can be accessed at www.mcrel.org/primer or www.ecs.org/researchprimer.
Using the Primer
The Primer is intended specifically for the user who knows nothing about education research. It does not require an understanding of science or sophisticated mathematical skills. The only prerequisite for using the Primer is some familiarity with using computers and the Internet.
The Primer is designed so that any part of it may be used independently. It is not necessary to read the “How Do I Know” sections of the Primer in sequence or to read those sections before using the glossary, the tutorials or any of the other Primer tools. On the other hand, reading the “How Do I Know” sections in sequence, and prior to using the other components, is likely to be beneficial, especially for users new to education research.
For those individuals who want an abbreviated but logically and practically sequenced introduction to the material in the Primer, the Applied Quick Primer will prove useful.
Why a Research Primer?
An understanding of research can help policymakers make evidence-based decisions about education. Information from research is more reliable than information from other sources such as stories, personal experiences, opinions or logical arguments because research is based on systematic gathering of empirical information. For example, how should a legislator decide whether state funds should be used to reduce the size of classes in K-12 schools?
A legislator might make this decision based on the following:
• An anecdote about how a neighbor’s child performed better after transferring to a school with smaller class sizes
• A perception that the legislator’s own performance was better in smaller classes
• A school board member’s opinion that smaller class sizes are better for student learning
• The logical argument that smaller classes are better for student achievement because students can receive more attention in smaller classes

A Policymaker’s Primer on Education Research 3
• A research study showing that students in small classes make larger gains on achievement tests than students in large classes.
Without access to information from research about education practices, policymakers are more likely to make decisions that are ineffective or even harmful.
Because not all research is created equal, policymakers can become better consumers of research by understanding research methods and principles. For example, which of the following research studies provides better support for a decision about reducing class size?
• A study of student achievement in small classes compared to large classes in one urban school district
• A study of student achievement in small classes compared to large classes in 10 rural school districts.
The context of a research study (e.g., urban vs. rural) is one factor to consider. Also important, however, is how the study was conducted. More specifically:
• How were students assigned to the small and large classes?
• Did teachers cover the same curriculum in the small and large classes?
• How was student achievement measured?
In answering these questions, it helps to know:
• The best ways to assign students to different types of classes in a research study
• The importance of measuring what and how teachers instruct in different types of classrooms
• The most effective ways to measure student outcomes in a research study.
Understanding more about research can help policymakers judge the accuracy of information from different studies and evaluate research that researchers or developers claim as scientific support for their points of view or products. In other words, policymakers can better determine whether there is scientific evidence that an education program, intervention or practice is effective.
A Policymaker’s Primer on Education Research 4
Applied Quick Primer
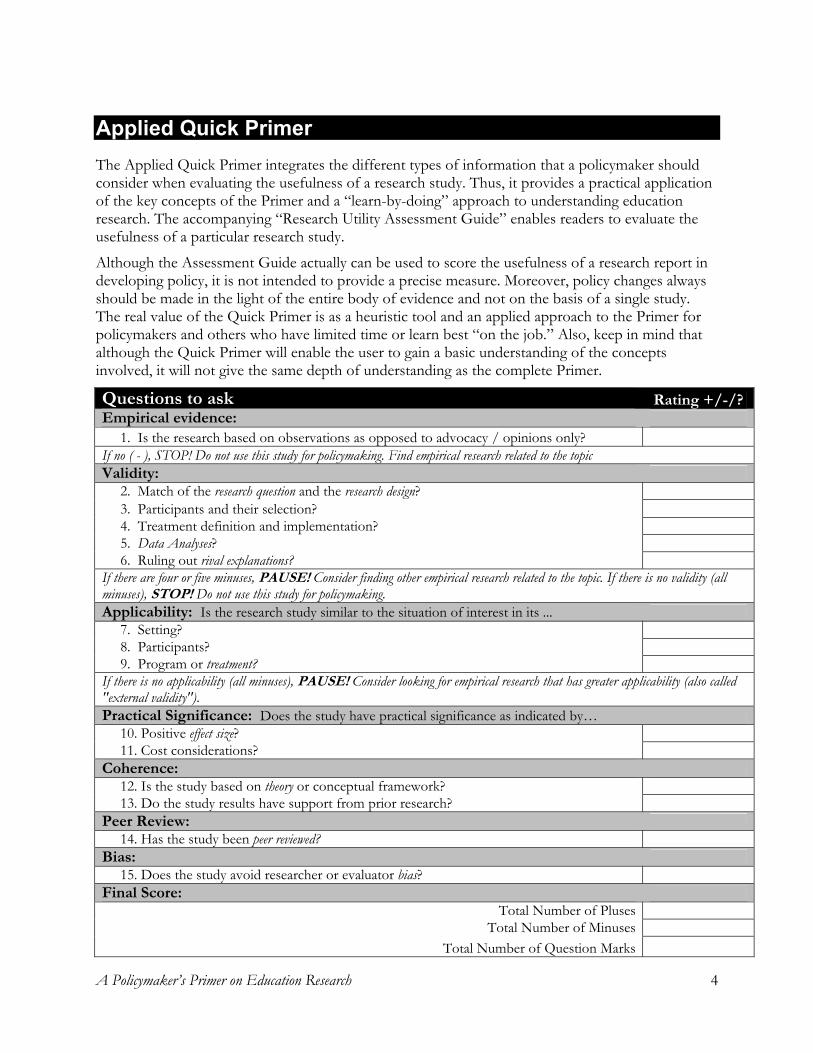
The Applied Quick Primer integrates the different types of information that a policymaker should consider when evaluating the usefulness of a research study. Thus, it provides a practical application of the key concepts of the Primer and a “learn-by-doing” approach to understanding education research. The accompanying “Research Utility Assessment Guide” enables readers to evaluate the usefulness of a particular research study.
Although the Assessment Guide actually can be used to score the usefulness of a research report in developing policy, it is not intended to provide a precise measure. Moreover, policy changes always should be made in the light of the entire body of evidence and not on the basis of a single study. The real value of the Quick Primer is as a heuristic tool and an applied approach to the Primer for policymakers and others who have limited time or learn best “on the job.” Also, keep in mind that although the Quick Primer will enable the user to gain a basic understanding of the concepts involved, it will not give the same depth of understanding as the complete Primer.
Questions to ask Rating +/-/?Empirical evidence: 1. Is the research based on observations as opposed to advocacy / opinions only? If no ( - ), STOP! Do not use this study for policymaking. Find empirical research related to the topic Validity: 2. Match of the research question and the research design? 3. Participants and their selection? 4. Treatment definition and implementation? 5. Data Analyses? 6. Ruling out rival explanations? If there are four or five minuses, PAUSE! Consider finding other empirical research related to the topic. If there is no validity (all minuses), STOP! Do not use this study for policymaking. Applicability: Is the research study similar to the situation of interest in its ... 7. Setting? 8. Participants? 9. Program or treatment? If there is no applicability (all minuses), PAUSE! Consider looking for empirical research that has greater applicability (also called "external validity"). Practical Significance: Does the study have practical significance as indicated by… 10. Positive effect size? 11. Cost considerations? Coherence: 12. Is the study based on theory or conceptual framework? 13. Do the study results have support from prior research? Peer Review: 14. Has the study been peer reviewed? Bias: 15. Does the study avoid researcher or evaluator bias? Final Score:
Total Number of Pluses Total Number of Minuses
Total Number of Question Marks

A Policymaker’s Primer on Education Research 5
Assessment Guide Scoring Directions Answer the questions in numerical order. For each numbered question, if the answer is yes, score a plus (+) in the right-hand column. If the answer is no, score a minus (-) in the right-hand column. If uncertain about how to answer the question, indicate a question mark (?) in the right-hand column.
All pluses — This study is highly useful for making policy decisions.
Majority pluses — This study is useful for making policy decisions. Examine the characteristics that received the fewest pluses. Consider how the lack of those characteristics could affect the study’s usefulness.
Equal pluses and minuses — This study has limited usefulness for making policy decisions. Examine the characteristics that received minuses. Consider how the lack of those characteristics could affect the study’s usefulness.
Majority minuses — This study is not useful for making policy decisions. Look for other empirical research related to the topic before using this study.
Majority question marks — If the question marks are due to a lack of information provided in the study, consider contacting the researcher for that information. If the question marks are due to a lack of understanding about the study characteristics and/or an inability to judge their presence in the study, consult this Primer, other resources on education research or seek the help of an education researcher.
A Policymaker’s Primer on Education Research 6
How Do I Know What the Research Says?
What is Research?
The word “research” is used in many different ways. For example, people talk about “doing research” on which car to buy. They go to the library to “research” a particular topic such as a law or historical event.
In education, when people refer to research they may mean either empirical or non-empirical studies. Examples of non-empirical studies are studies that research the history of a practice, institution or individual, explore what a thinker or a number of thinkers have said about a specific topic, or use other written sources to compare educational practices in one country with those in another. Empirical research seeks information about something that can be observed in the real world or in the laboratory — what effect a certain kind of professional development has on a teacher’s ability to teach, what impact socioeconomic factors have on student performance, whether a particular curriculum improves students’ performance in mathematics, etc.
This Primer is concerned primarily with empirical research, which involves systematically gathering empirical information on questions related to education.
Education research differs along several dimensions. In general, there are two main types, descriptive and experimental. Descriptive research answers questions about what, how, or why something is happening. Experimental research answers questions about whether something causes an effect. Research data are quantitative, qualitative or a combination of the two. Depending upon the kinds of questions a research study seeks to answer and the kinds of data it intends to collect, it employs a particular plan for gathering data, called the research design. For more information on dimensions of education research, see Appendix A: A Research Typology.
Scientifically-based research The No Child Left Behind Act of 2001 (NCLB) makes more than 100 references to scientifically-based research in education.
For example:
• Districts with low-performing Title I schools should develop improvement plans that build on scientifically-based research.
• States seeking funds from the Reading First Initiative must contract with an entity that conducts scientifically-based reading research.
According to NCLB, scientifically-based research is rigorous, systematic, objective, empirical, peer reviewed and relies on multiple measurements and observations, preferably through experimental or quasi-experimental methods.
The U.S. Department of Education’s Institute of Education Sciences has released a publication that elaborates the concept of scientifically-based research. It is titled Identifying and Implementing Educational Practices Supported by Rigorous Evidence: A User Friendly Guide and can be viewed on the Web at

A Policymaker’s Primer on Education Research 7
http://www.ed.gov/rschstat/research/pubs/rigorousevid/index.html or downloaded at http://www.ed.gov/rschstat/research/pubs/rigorousevid/rigorousevid.pdf. For more information about the Institute of Education Sciences, go to their Web site at www.ed.gov/about/offices/list/ies/index.html?src=oc.
While NCLB’s definition emphasizes the importance of research method, the National Research Council (NRC) (www.nationalacademies.org/nrc/) has explained the importance of other aspects of scientific research. According to NRC’s 2002 publication, Scientific Research in Education, the scientific quality of a research study is determined by the degree to which the study follows the principles that underlie science. NRC identified six guiding principles for scientific research:
1. Pose significant questions that can be investigated empirically
2. Link research to relevant theory
3. Use methods that permit direct investigation of the question
4. Provide a coherent and explicit chain of reasoning
5. Replicate and generalize across studies
6. Disclose research to encourage professional scrutiny and critique.
NRC’s comprehensive analysis of what constitutes scientific research in education has received support from both research and policy communities. This Primer incorporates NRC’s recommendations.
For more details and a list of related guiding questions, see Appendix B: NRC’s Principles of Scientific Research in Education.
Sources of Education Research
A primary source is a report of an original research study. A primary source usually provides enough details to replicate the research study. Primary sources are written by the researcher(s) or evaluator(s) who conducted the study. The main formats of primary sources are journal articles, technical reports from research institutions or education organizations, and reports on presentations at conferences.
A secondary source is a description and summary of one or more prior research studies. Secondary sources usually do not include enough details to replicate the original studies being described. Examples of secondary sources are literature reviews and books. Although newspaper articles also can be secondary sources, they often do not have enough information to help readers form a solid judgment about the research. Essays by education experts can be secondary sources of education research, but essays can be overly biased toward the views of the writer.
Caution: Secondary sources have the potential to distort original research findings and can lead to conclusions that are based more on interpretation and opinion than on fact. Many debates about education topics arise because secondary sources draw conclusions that the original research does not warrant. When in doubt, always consult the original research study.

A Policymaker’s Primer on Education Research 8
Use primary sources when it is important to know the details of a study and its results. Use secondary sources to obtain an overview of the research on a particular topic and reference information for original research studies (see also McMillan, 2000).
Example: To research the topic of professional development schools for teacher preparation, start with a secondary source such as the Handbook of Research on Teacher Education (Sikula, Buttery and Guyton, 1996). This book has chapters written by education researchers on various topics related to teacher education. Then consult the primary sources cited in the chapter on professional development schools.
Reading Education Research
Reports on education research tend to follow similar formats. There are some noteworthy differences, however, depending on whether the report concerns a research study, an evaluation study or a literature review.
A research study, as the term is used in this Primer, systematically gathers empirical information to answer one or more questions related to education.
Example: A researcher wants to know whether math teachers with master’s degrees in their field are more effective than math teachers with only an undergraduate mathematics major. The researcher observes the teaching of a number of math teachers, some of whom have master’s degrees and some of whom only have undergraduate majors. The researcher also examines students’ mathematics test scores of students to determine if the scores of those whose teachers have a master’s degree are higher than those whose teachers have only an undergraduate major.
For more information, see the guide to Reading Reports on Research Studies (p. 12).
An evaluation study is designed to judge the effectiveness of an education program. Evaluation studies use some of the same research designs that research studies employ.
Example: A school district hires an evaluator to conduct a study on the effectiveness of an after-school tutoring program. The evaluator collects data about the student participants, their achievement before and after tutoring, the type and amount of tutoring that occurred, and the characteristics of the tutors. The evaluator also collects achievement data from a comparison group of students who applied too late to receive tutoring. The evaluation results include data about changes in student achievement, as well as data about whether the program was implemented as planned.
For more information, see the guide to Reading Evaluation Studies (p. 13).
A literature review is a comprehensive and systematic summary of past empirical research and/or evaluation studies on a specific topic. Another term commonly used for a literature review is research synthesis. For more information, see the guide to Reading Literature Reviews (p. 14).
A Policymaker’s Primer on Education Research 9
Finding Education Research
The Educational Resources Clearing Center (ERIC) ERIC is a federally funded national system that provides access to education-related literature. Though currently in the process of significant revision, ERIC continues to provide a wealth of information for researchers, practitioners and policymakers. To appreciate fully what ERIC has to offer, spend some time exploring the ERIC Web site at http://www.eric.ed.gov.
For information about searching the ERIC database to find articles and other literature, see the brief Searching ERIC Tutorial in this Primer (p. 49).
Other online databases Although ERIC is probably the largest online database of education research, there are other online databases that are resources for finding education-related research. Libraries of institutions of higher education usually subscribe to these databases, and members of the institution have access to them. Often members of the general public with proper identification can use the libraries of their state-supported institutions of higher education.
Other databases that have citations for education research include the following:
• PsycInfo – Citations for the research in psychology and related areas such as education
• Dissertation Abstracts – Abstracts of dissertations completed in the United States and in some foreign countries
• Education Index – Citations of education-related articles from over 600 sources, with access to full-text articles at some libraries.
Searching the World Wide Web Many articles on education research exist as online documents on the World Wide Web. Success in searching for such documents depends on Internet searching skills.
Example:
1. To conduct a search for articles on teacher preparation research, go to the Yahoo search engine at http://search.yahoo.com/search/options?p=
2. Enter “teacher preparation research” into the “exact phrase” window
3. Click on SEARCH
4. The result will be a very large list of Web sites with information related to teacher preparation research.
Hint: Help with Internet searching techniques is available at the following Web sites: http://library.albany.edu/internet, http://www.sc.edu/beaufort/library/bones.html.
A Policymaker’s Primer on Education Research 10
Caution: The requirements for posting articles on Web sites of organizations vary greatly. Some articles undergo a peer review that is similar to the review required for articles submitted to journals for publication. Other articles, however, are posted because the research supports the organization’s views. Always evaluate the quality of the research that is reported in online articles.
Electronic journals Some education research journals exist online, such as Education Policy Analysis Archives, available at http://epaa.asu.edu/epaa/. With an electronic journal, it is possible to download and print full-text articles on education research.
U.S. Department of Education Web Site An important online source for education research is the Web site of the U.S. Department of Education (ED). Search for education research at http://www.ed.gov/index.jsp, which provides access to more than 200 ED-sponsored Web sites and more than 150 other federal agencies. An ED search can result in thousands of citations; for help with searching techniques, go to http://www.ed.gov/search/searchhelp.jsp.
Hint: For access to a wide range of education statistics, see the Web site of the National Center for Education Statistics (NCES) at http://nces.ed.gov/index.html. NCES produces hundreds of reports based on its many data-collection efforts, including reports on the National Assessment of Educational Progress (NAEP) and on the Schools and Staffing Survey (SASS).
What Works Clearinghouse The U.S. Department of Education’s Institute of Education Sciences established the What Works Clearinghouse (WWC) in 2002 to provide an independent source of evidence on what works in education. The WWC intends to provide policymakers and educators the information needed to make decisions about education programs and interventions based on high-quality scientific research. Consult the WWC Web site for more details: http://www.w-w-c.org/about.html.
Manual searches It is possible to conduct manual searches for education research by using the print versions of indexes for journals and abstracts. These indexes are available at most higher education libraries. Two examples of relevant indexes are the Current Index to Journals in Education, published by ERIC, and Psychological Abstracts, published by the American Psychological Association.
Some of the principles used for computer searches apply to manual searches. For example, it is important to determine the terms or descriptors used to identify articles related to a particular topic. Often a thesaurus that helps identify keywords to use in searches on different topics accompanies the index. With manual searches, it is generally a good idea to start with the most recent index because recent studies provide citations on prior research, which shortens the search process (see also McMillan, 2000).

A Policymaker’s Primer on Education Research 11
References and Resources
Cooper, H. (1998). Synthesizing research: A guide for literature reviews (3rd ed.). Thousand Oaks, CA: Sage Publications.
Cooper, H., Charlton, K., Valentine, J.C., and Muhlenbruck, L. (2000). "Making the most of summer school: A meta-analytic and narrative review." Monographs of the Society for Research in Child Development, Serial No. 260, 65(1).
Institute of Education Sciences. Identifying and implementing educational practices supported by rigorous evidence: A user friendly guide. Washington, DC: U.S. Department of Education.
McMillan, J.H. (2000). Educational research: Fundamentals for the consumer (3rd ed.). New York: Addison Wesley Longman.
National Research Council (2002). Scientific research in education. Committee on Scientific Principles for Education Research. Shavelson, R.J., and Towne, L. (Eds.). Center for Education. Division of Behavioral and Social Sciences and Education. Washington, DC: National Academy Press.
Sikula, J., Buttery, T.J. and Guyton, E. (Eds.) (1996). Handbook of research on teacher education. New York: Simon & Schuster Macmillan.
Weiss, C.H. (1998). Evaluation: Methods for studying programs and policies (2nd ed.). Upper SaddleRiver, NJ: Prentice Hall.

A Policymaker’s Primer on Education Research 12
Additional Information: Reading Reports on Research Studies
Most reports that are primary sources on education research studies follow a common organization.
1. Abstract or Executive Summary – Gives a brief but comprehensive summary of the research report, including the research problem, the research method, the results and conclusions.
Hint: Always read the abstract or executive summary first because it is designed to organize the reader’s thoughts about the content of the report.
2. Introduction – Describes the research problem, the background of the problem, related prior research, and the purpose and rationale for the study. It also gives a brief overview of the method used. The introduction usually concludes with specific research questions and sometimes with the research hypothesis.
Caution: In reports on research studies, the author describes in the introduction how the study relates to prior research on the topic. Sometimes the author refers to this description as a literature review. Because, however, the purpose is to provide a context for the study and not to produce new conclusions based on past research, this description is not a literature review as defined in this Primer, as a stand-alone synthesis.
3. Method – Provides information on how the study was conducted, ideally with enough details so the study can be repeated. Typically, the method section describes the following (not necessarily in this order):
• Research design or plan for gathering the data
• Characteristics of the study participants and how the researcher selected the sample of participants
• Procedure or implementation steps used by the researcher
• Materials (e.g., a reading curriculum) and data-collection instrument used in the study.
4. Results/Findings – Describes the results or findings of the research study. The format of the results section depends on the type of research questions the study addressed and the type of research design the study used. The results section usually begins with a description of the data-analysis plan, although sometimes this is explained in the method section. The results section ends with a summary of the results or findings. As might be expected, the results section for a quantitative research study reports many numbers and statistics. The results section for a qualitative research study primarily reports narrative descriptions of the findings.
Hint: If the results section seems overwhelming, read the summary of the results first. The summary provides the most important information about the findings without getting bogged down with technical details. When there is no summary at the end of the results section, look for one at the beginning of the discussion section.

A Policymaker’s Primer on Education Research 13
5. Discussion/Conclusions – Summarizes the results and relates them to the research questions and hypotheses described in the introduction. In the discussion, the researcher provides the rationale for why the results support or do not support a particular conclusion. The researcher also discusses rival explanations and limitations of the study. The discussion section often ends with suggestions for future research that might clarify or extend the study findings.
Caution: The conclusions an author gives often go beyond what is really justified by the research results or findings and may involve the author’s own subjective interpretations. The conclusions of a research study thus generally should be carefully scrutinized to see if they truly follow from the findings.
6. References – Lists a bibliographic reference for every citation that occurs in the report. The references section is a good source for finding other research reports related to the topic of the study.
Reading Evaluation Studies
Reports on evaluation studies are less rigid in structure than research reports because the format of evaluation reports depends on the audience. Evaluation reports published in academic journals are more likely to resemble research reports than those that are unpublished or published in other formats, such as technical reports for school districts.
Most reports that are primary sources on evaluation studies follow a common organization (see also Weiss, 1998).
1. Executive Summary – Gives a comprehensive summary of the report, including a program description, evaluation questions, method, findings and recommendations.
Hint: Always read the executive summary first because it provides an overview and enough details to understand the evaluation outcomes.
2. Program Description – Describes the education program that is being evaluated, including program goals, activities, participants and staff. Also provides context such as the history of the program and its relationship to the community.
3. Evaluation Description – Describes the evaluation questions and the evaluation design. Also briefly describes the methods used to collect data, but technical details, such as data-collection instruments, are discussed in an appendix to the evaluation report.
4. Results/Findings – Presents the main findings of the evaluation study. Each finding is accompanied by supporting evidence from statistics and/or narrative descriptions. More detailed results are described in an appendix.
5. Conclusions – Presents the evaluator’s interpretation of the findings, including limitations of the evaluation study.

A Policymaker’s Primer on Education Research 14
Caution: The conclusions an author gives often go beyond what is really justified by the evaluation results or findings and may involve the author’s own subjective interpretations. The conclusions of an evaluation study thus generally should be carefully scrutinized to see if they truly follow from the findings.
6. Recommendations – Suggests recommendations about the program based on evaluation results. (Whether or not recommendations are included in an evaluation report depends on the goals of the evaluation study.)
Caution: The recommendations an author gives necessarily involve the author’s own interpretations and values and thus always go somewhat beyond the study’s results and findings. Recommendations should not be considered matters of fact.
7. Appendices – Provides additional information and technical details about the program being evaluated, the evaluation method, the data-collection instruments and the results.
Reading Literature Reviews (or Research Syntheses)
Literature reviews are secondary sources on research. Literature reviews describe and summarize past reports on research and/or evaluation studies. The purpose of a literature review is to provide new conclusions about the body of prior research related to a specific topic, such as the effects of summer school on student achievement. (Another term for a literature review is research synthesis.) Literature reviews vary in method and scope, so the structure of literature reviews varies as well. Most literature reviews, however, have certain standard components.
Caution: In the introduction of a report on a research study, the author usually describes how the study relates to prior research on the topic and may refer to that as a “literature review.” Because, however, the purpose is to provide a context for the study and not to produce new conclusions based on past research, this description usually is not a literature review in the sense defined here, as a stand-alone synthesis.
1. Abstract or Executive Summary – Summarizes the purpose, method, findings, and conclusions of the literature review.
Caution: Abstracts and executive summaries of literature reviews sometimes are misleading. Results from a literature review depend on how the reviewer analyzed reports on prior research. To better understand and evaluate the results and conclusions of a literature review, always read the sections in the review that explain the process used to select and analyze research studies.
2. Introduction – Describes the topic and purpose of the literature review. Sometimes a research question is posed. For example, “Based on past research, does summer school improve student achievement?”
3. Background – Provides background information related to the topic. The reviewer usually discusses the history behind the topic and why the topic is important in the current

A Policymaker’s Primer on Education Research 15
educational context. The reviewer also indicates how the terms in the topic are defined for purposes of the review. For example, a review of research on teacher mentoring should define what constitutes teacher mentoring.
4. Method – Describes the method used to search for, select and analyze past research studies. The method is a critical component of a literature review because the results and conclusions depend on the scope of the search for past studies, the criteria used to include or exclude studies, and the method used to analyze the studies.
There are two general methods of analysis used for literature review: narrative review and meta-analysis. In a narrative review (also called a qualitative review), the reviewer interprets the studies by describing, comparing, and contrasting the studies and their results. In a meta-analysis (also called a quantitative review), the reviewer uses statistics, primarily effect sizes, to summarize the results of different studies. (See the literature review on summer school by Cooper, Charlton, Valentine and Muhlenbruck [2000] for an example that uses both narrative review and meta-analysis.)
5. Results – Provides the results of the literature review. The results section often includes a table that lists the citations for the reviewed studies and briefly describes the methods and findings of each study. In a narrative review, the author usually organizes results based on a particular aspect of the topic. For example, in a narrative review of research on summer school, the reviewer might discuss the results from studies of summer mathematics programs and of summer reading programs separately. In a meta-analysis, the reviewer also might organize results by subtopic and indicate effect sizes for the subtopics.
6. Conclusions – Summarizes the results of the review and presents conclusions. The author usually discusses limitations of the review based on either the method used to review the studies or the characteristics of the studies themselves.
Hint: The validity of the conclusions of a literature review depend on whether the reviewed studies are of adequate research quality. Look for whether reviewed studies are examined for their research quality.

How Do I Know if the Research Is Trustworthy? When researchers discuss whether findings and conclusions from research can be trusted, they are referring to validity. Researchers have proposed different frameworks for examining validity and have different terms to describe different types of validity. The terms, however, are not as important as understanding what makes research conclusions valid and knowing what questions to ask about the research.
Hint: As Shadish, Cook and Campbell (2002) point out, validity means the approximate truth of an inference or conclusion. Thus, in the Primer, the term “research validity” means the validity of the researcher’s conclusions.
Unpacking a Research Study
Judging the validity of a research study requires some detective work. When a crime is committed, the prosecuting attorney makes arguments to support the conclusion that a person is guilty. The defense attorney presents arguments to support the conclusion that the person is not guilty. Each attorney dissects and analyzes the criminal case.
Policymakers and educators who are judging research and evaluation studies need to be like prosecuting attorneys. They need to take apart and analyze studies for possible errors – the “crimes” against research validity. The researchers are like the defense attorneys. They need to provide evidence they did not commit research crimes.
Unpacking a research study involves asking four questions:
1. What is the research question?
2. Does the research design match the research question?
3. How was the study conducted?
4. Are there rival explanations for the results?
Hint: Although education research studies and evaluation studies have different goals, procedures, and reporting formats, their conclusions should be assessed using the same criteria for validity.
Step 1: What is the research question? In the introduction to most research reports, the purpose of the study is presented in a research question or in a research hypothesis. Sometimes the questions are not explicit. Regardless of how a question is phrased, it is important to determine whether the research question is descriptive or causal. For the research to be valid, it must be designed to answer the type of question asked.
Descriptive Research asks these types of questions:
• What is happening?
A Policymaker’s Primer on Education Research 17
• How is something happening?
• Why is something happening?
The following examples illustrate how descriptive research questions might be stated in a report. Note that research questions are sometimes contained in the form of a statement:
• We hypothesized that teacher professional development has a positive association with student achievement.
• We were interested in what types of teacher professional development occur in high-performing schools.
• Do high-performing schools provide teachers with more professional development than low-performing schools?
• How do high-performing schools design professional development?
Causal Research (or Experimental Research) asks this type of question:
• Does something cause an effect?
The following examples illustrate how causal research questions might be stated in a report. Note that in many reports the word “cause” is not explicit. If the statement or question implies, however, that an effect (e.g., higher student achievement) will result from something that is varied (e.g., the effect of more versus less teacher professional development), then the research question is a causal question. Also note, again, that questions are sometimes given in the form of statements:
We hypothesized that increasing the amount of professional development teachers received would increase student achievement.
We were interested in whether teacher professional development in language arts increases student achievement more than teacher professional development in general teaching strategies.
Does providing teachers with professional development in teaching reading cause their students to have higher achievement in reading?
As the two sets of examples of causal and descriptive research questions show, sometimes questions in descriptive research appear to seek a causal connection. Descriptive research, however, lacks the random assignment and manipulation of a treatment present in experimental research. In the absence of these two elements, the most that descriptive research can uncover is the correlation or association of factors; it cannot reveal an actual causal relationship.
Correlation only indicates that two or more factors occur in association with one another; it does not indicate whether one factor causes another. For example, the correlation of poverty with low student achievement does not mean that poverty causes low achievement. There are other factors possibly associated with poverty that might be causing low achievement such as the lack of a consistent caregiver.

A Policymaker’s Primer on Education Research 18
Step 2: Does the research design match the research question? After determining the type of research question that the study addresses, the next step is to examine the research design. For research to be valid, the research design must match the research question. Descriptive research questions require descriptive research designs. Causal research questions require experimental research designs.
For more information about research design, see Appendix A: A Research Typology.
Step 3: How was the study conducted? Step 3 concerns the research method, which refers to how the study was conducted and how the research design was implemented. A research report should provide enough details about the method so the study can be repeated. Without these details, it is difficult and sometimes impossible to judge the validity of the research. Four key components of the research method influence research validity:
1. Participants: Who were the participants in the study? How were they selected? The research report should describe the number of participants in the study, as well as their characteristics. This includes not only the characteristics of persons, but also those of entities such as schools and districts. In addition, the report should describe how the study’s participants were chosen and how participants were assigned (if they were) to the different comparison groups in the study. For a more thorough discussion on this component, see Participant Considerations (p. 26).
2. Treatment: How is the treatment defined and described in the study? How was it implemented? Most education research studies concern a particular education treatment or intervention, for example, a reading program, a type of teacher preparation or a mathematics curriculum. A good researcher will define the treatment carefully and implement it consistently. A more thorough discussion can be read about Treatment Considerations (p. 27).
3. Data Collection: What data were collected, and how were they collected? Most education research studies attempt to connect a treatment to a result. This result is called the dependent variable and refers to what is being measured in a research study. Data make up the body of information produced by these measures. Student achievement and teacher classroom practices are examples of dependent variables in education research. Data-collection procedures refer to how and when the data were collected. The procedures used to collect data can influence research validity.
The most commonly used data-collection instruments in education research are the following:
• Tests
• Scaled Questionnaires
• Surveys
• Interviews
• Observations.

A Policymaker’s Primer on Education Research 19
It is critical that data-collection instruments have both validity and reliability. For a more thorough discussion, see Data-Collection Considerations (p. 28).
4. Data Analysis – How were the data analyzed? When determining whether or not a particular study did a good job of analyzing the data it produced, it is important to distinguish between quantitative data and qualitative data (see also Creswell, 2002). Researchers analyze quantitative data through statistics. The computation of inferential statistics is the primary basis for research conclusions about a treatment effect. In qualitative research, the data consist of narrative descriptions and observations. Although statistics are not used, qualitative data analyses need to be systematic to support valid research conclusions. In most qualitative research studies, large amounts of descriptive information are organized into categories and themes through coding in order facilitate interpretations of the findings. A more thorough discussion can be read about Data-Analysis Considerations on p. 31. For a deeper understanding of key statistical concepts, see the Understanding Statistics Tutorial on p. 37.
Step 4: Are there rival explanations for the results? At the end of a research report, the researcher presents conclusions based on the results that were obtained through the study. To judge whether a conclusion can be trusted, always ask this question: Could there be an explanation for the results other than the conclusion reached? Researchers refer to these rival explanations as threats to validity because they threaten the validity of the research conclusion (Shadish et al., 2002). It is the job of the researcher to rule out rival explanations by demonstrating they do not apply to the study.
Quantitative research It is especially important to identify or rule out rival explanations when the researcher concludes that a treatment (e.g., an education program or intervention) has an effect – in other words, that something works. Research studies that examine the effects of a treatment usually collect quantitative data and employ a treatment group and a control group.
Several factors can account for rival explanations in quantitative studies of the effectiveness of an intervention:
Selection bias concerns how the study participants are assigned to comparison groups in a study. Random assignment is the best way to ensure student and teacher characteristics that might influence outcomes do not systematically favor the treatment or the control group. Random assignment of students and teachers sometimes is not feasible, however. To rule out a rival explanation due to selection bias, the researcher should describe the characteristics of both groups of teachers and their students (i.e., in the control group and the treatment group) and either show how the comparison groups are similar or conduct data analyses that statistically control for individual student characteristics (e.g., socioeconomic status) and teacher characteristics (e.g., teaching experience).
Sample attrition (also called mortality) can be a rival explanation. If more participants (e.g., teachers and/or students) leave the treatment group than the control group (or vice versa), the results could be due to differences in characteristics between the groups at the posttest that did not exist at the pretest. To rule out a rival explanation based on sample attrition, the researcher should document who left the study and why. Sample attrition is a particular concern in longitudinal research studies

A Policymaker’s Primer on Education Research 20
where the same participants are studied over a long time span. The participants who remain in the study could have different characteristics than those who left.
Treatment diffusion or spillover, another rival explanation, can occur when participants who are in different comparison groups operate in the same environment such as teachers in the same school. Teachers in the control group might overhear treatment teachers discussing the intervention, or control teachers might gain access to materials being used for the intervention. The researcher should ask participants in each group about their interactions and document their responses.
History effects can be a problem in research studies that occur over a long span time, such as a year or more. For example, there might be a change in school leadership. To rule out rival explanations based on history effects, the researcher needs to monitor all possible occurrences and demonstrate they do not influence the results of the treatment and control groups differently.
Practice effects refer to a rival explanation that results from repeated measures of the same individuals. In any research study where participants are tested or measured more than once, there is a possibility that the participants’ responses on the second and subsequent tests are affected by practice on the pretest. Practice effects are less likely to occur when there are longer time spans between the pretest and posttest. The researcher should determine whether participants practiced for the posttest and especially whether practice occurred more in the treatment group compared to the control group. (Test practice by students for state assessments has become commonplace.)
Regression toward the mean is a rival explanation that can occur when participants have extremely low or extremely high scores on a pretest. Extreme scores tend to move toward the average or mean score when a test is repeated. This means that extreme scorers will score less extremely on posttests, even without a treatment. To rule out this rival explanation, the researcher should demonstrate, for example, that the students of the treatment and control teachers do not differ in the proportion of extreme scorers.
Qualitative research In qualitative research, it is also important to rule out rival explanations for the results. This occurs through procedures such as:
• Checking back with study participants to confirm that the researcher’s interpretation of their responses, in an interview, for example, is correct.
• The use of multiple sources of data. When data from several different sources, such as documents, interviews and observations, converge on the same conclusions, there can be greater confidence in the validity of these conclusions than if only one data source informs conclusions.
• A search for disconfirming evidence in which the researcher examines all the data for any evidence that might indicate the conclusions are wrong.
• Generation of specific rival explanations for the conclusions and a demonstration of how they do not apply based on the data and the methods used.

A Policymaker’s Primer on Education Research 21
Summary: Assessing research validity The following table lists the components of a research study and summarizes the important questions to ask regarding each component in order to be able to assess the study’s validity.
Summary: Questions to ask about research validity Research question and design Does the research design match the research question? Participants What was the basis for selecting the participants? How were the participants assigned to groups? Do participant selection and assignment follow the research design? Are the results influenced by extraneous characteristics of participants and contexts? Treatment What is the operational definition of the treatment? Is the definition valid? Was the treatment implemented as planned? Data collection What is the operational definition of the dependent variable? Why were the data selected? Was there pilot testing or field testing of the instruments? Are the data-collection instruments valid and reliable? Was there training for data collectors? What was the response rate for questionnaires? Data analysis Quantitative: Were non-significant results (i.e., p > .05) discussed as if they were significant? How did sample size influence the results? How did variability in the scores influence the results? Was an effect size reported? Qualitative: How were the data coded? What procedures were used to verify the coding? Rival explanations Did any of the following occur that might have affected the results and were not ruled out? Conclusions about score gains from a treatment without a pretest? Conclusions about score gains from a treatment without a control or comparison group? Bias in assigning participants to different comparison groups? Loss of participants from the study sample? Spillover of the treatment into the control or comparison group? Influences from an event that occurred between a pretest and posttest? Effects from participant practice on the measuring instrument? Extreme scores that could become less extreme on the posttest regardless of treatment?
A Policymaker’s Primer on Education Research 22
Unpacking a Research Synthesis (or Literature Review)
A research synthesis reviews and integrates the findings from prior empirical research studies. The purpose of a research synthesis (or literature review) is to generate conclusions about a particular topic based on the body of prior research related to the topic.
Unpacking a research synthesis involves asking five questions:
1. What is the research question?
2. How comprehensive and systematic was the search for past research literature?
3. What were the criteria for including and excluding research studies?
4. How were the results of past research studies analyzed and summarized?
5. What is the validity of the conclusions?
Step 1: What is the research question? In a research synthesis, the researcher poses a question that the synthesis will address. For example: “What is the influence of tutoring on student achievement in reading?”
Operational definitions of the terms in the research question influence the scope of the prior research that will be examined. For example, tutoring could be defined as one-on-one instruction of a student by an adult, a peer or both. Students could be elementary, secondary or both. Finally, student achievement could be defined as test scores, grades or both. Broader definitions are likely to provide more information related to the research question than are narrower definitions. As a result, conclusions will be more trustworthy with broader definitions. For example, tutoring might have different influences on elementary students compared to secondary students. Failure to include studies on both types of students might lead to erroneous conclusions about the overall effect of tutoring on student achievement.
Step 2: Was there a comprehensive and systematic search for past research? The methods used to search for past research studies are critical to a research synthesis. A comprehensive literature search requires an examination of all potential sources of research literature on a topic. A systematic literature search requires the consistent use of terms in searching for research studies in databases such as ERIC. For example, searching for both “tutoring” and “peer-tutoring” in one database and searching only for “tutoring” in another database would not be a systematic literature search and would overlook potentially informative studies.
Step 3: What were the criteria for including and excluding research studies? Most reviewers employ criteria for selecting studies for the synthesis from among the studies produced by the literature search. These criteria and the rationale for their use need to be clearly specified. One common reason to include or exclude studies is their relevance to the research

A Policymaker’s Primer on Education Research 23
question. For example, for a research question that concerns student achievement in reading, studies that measure only mathematics achievement would be excluded. Another reason to exclude a study is the type of method used to conduct the study. Depending on the research question, some methods would not provide trustworthy results for inclusion. For example, a reviewer might decide to include studies on the effectiveness of tutoring only if they used a comparison group of students who did not receive tutoring. Another criterion concerns whether studies have been published in journals or books. Although published studies are more likely to have undergone peer review, journals tend not to publish studies that report negative or no effects of an intervention. Consequently, a reviewer who examines only published studies risks making erroneous conclusions about intervention effectiveness.
Inclusion and exclusion criteria should be established prior to the literature search and should be applied consistently to all the studies that the search produces. Otherwise, there could be reviewer bias in selecting studies that have particular results. In addition, the reviewer should describe the number and characteristics of excluded studies.
Step 4: How were the results of research studies analyzed and summarized? There are different methods for conducting research syntheses.
Narrative review is a qualitative method that involves summarizing the results of studies through narrative description. Sometimes narrative reviews report the number of positive and negative findings among the studies.
Meta-analysis is a quantitative method that involves summarizing the results based on their means and standard deviations. The result of a meta-analysis is an effect size, which indicates the overall impact of the intervention being studied.
Meta-analyses use standardized procedures, and syntheses results can be replicated. Narrative reviews are less systematic than meta-analyses, and they depend more on reviewer judgment, which makes the syntheses results difficult to replicate. Meta-analyses, however, tend to combine studies together into categories (e.g., all tutoring studies of elementary students) so that differences in study details (e.g., the nature of the tutoring) are obscured. Additionally, meta-analysis is useful only with quantitative research studies.
Step 5: Do the conclusions have validity? The validity of conclusions from a research synthesis depends on:
• A comprehensive and systematic literature search
• The consistent application of inclusion criteria that are backed by a rationale for their use
• A method of data analysis that is systematic and appropriate to the research question and the type of studies being synthesized
A Policymaker’s Primer on Education Research 24
• Reviewer interpretation of the results.
The interpretation of synthesis results depends on reviewer judgment. Reviewers should judge results based on the synthesis method and the nature of the studies reviewed. The conclusions should reflect any limitations to the synthesis. For example, the conclusions of a synthesis that examines only published qualitative studies of an intervention can be made only in reference to that body of studies. A synthesis of other types of studies might reach different conclusions. Similarly, reviewers should consider the research quality of the studies in the synthesis when drawing conclusions. If the individual research studies in the synthesis are not valid, then a conclusion based on a synthesis of these studies is unlikely to be valid.
A Policymaker’s Primer on Education Research 25
References and Resources
Cooper, H. (1998). Synthesizing research: A guide for literature reviews (3rd ed.). Thousand Oaks, CA: Sage Publications.
Creswell, J.W. (2002). Research design: Qualitative, quantitative and mixed method approaches. Thousand Oaks, CA: Sage Publications.
Shadish, W.R., Cook, T.D., and Campbell, D.T. (2002). Experimental and quasi-experimental designs for causal inference. Boston: Houghton Mifflin.
Shanahan, T. (2000). "Research synthesis: Making sense of the accumulation of knowledge in reading." In M.L. Kamil, P.B. Mosenthal, P.D. Pearson, and R. Barr (Eds.), Handbook of reading research, volume III (pp. 209-226). Mahwah, NJ: Lawrence Erlbaum and Associates.

A Policymaker’s Primer on Education Research 26
Additional Information: Participant Considerations
Who were the participants in the study? How were they selected?
The research report should describe the number of participants in the study, as well as their characteristics. This includes not only the characteristics of persons, but also those of entities such as schools and districts. Look for characteristics that could influence the results such as the following:
• Student characteristics – Grade level, gender, socioeconomic status, ethnicity, language status (e.g., second language learner), prior student achievement
• Teacher (classroom) characteristics – Experience, grade level, class size, subject area, preparation, certification status
• School characteristics – Number of students, teachers, paraprofessionals, administrators and other certified staff; location; grade levels; socioeconomic status; ethnicity of students; mean student achievement data
• District characteristics – Number and grade levels of schools; number of students; number and types of teachers, administrators and other certified staff; location; community characteristics.
The study should describe how the participants were selected for the study sample. Most researchers do not have the luxury of selecting a random sample from a population of participants. An exception is the U.S. Department of Education, which conducts random sampling to collect education survey data. If the sample is not random, then conclusions about the population based on the sample can be erroneous. Valid conclusions can be made only about the sample of participants in the study.
A related issue is how participants were assigned to the different comparison groups in the study. Without random assignment, selection bias can occur. For example, if a researcher selected teachers to participate in one of two types of professional development based on school location, the results could be influenced by characteristics of the schools rather than the professional development.
Here are some examples of studies with and without random assignment:
Example of a study with random assignment: A researcher uses an experimental research design to study whether teacher professional development increases student achievement. Prior to the beginning of the school year, half the 4th-grade teachers in a school district are randomly assigned to receive professional development in reading and the other half are randomly assigned to receive no professional development in reading. At the end of the school year, the achievement gains in reading by the students of the two groups of teachers are compared. It is assumed that because teachers were randomly assigned to the two groups, teacher characteristics that might influence reading achievement favor neither the treatment group nor the control group.
Example of a study without random assignment: A researcher uses a quasi-experimental research design to study whether teacher professional development increases student achievement. The researcher assigns teachers in School A to the treatment

A Policymaker’s Primer on Education Research 27
group. For the control group, the researcher finds a school with school and teacher characteristics similar to those of School A (e.g., similar student achievement, similar teacher qualifications). When matching is used, the researcher should report how the groups were matched and the degree to which matching was successful (i.e., the similarity of the matched groups).
Example of a comparative descriptive study: A researcher conducts a study to determine whether teacher professional development is related to increased student achievement. The researcher examines the achievement gains in reading by students of teachers in two schools. In one school the teachers had participated in professional development in reading, while in another school the teachers had no professional development. This type of comparative descriptive study is called ex post facto because the research started after the fact – that is, after the professional development occurred.
On face value, this descriptive comparative study seems very similar to an experiment. The researchers, however, did not select teachers to participate in the two groups. In addition, the researchers did not implement the treatment (the professional development). While this study might be informative, a conclusion that professional development increased student achievement scores would be invalid. In a descriptive study, due to selection bias and the absence of treatment manipulation, the only conclusion that can be justified is about association, not causation.
Good education research also seeks to limit the impact of extraneous variables regarding study participants. Extraneous variables are characteristics of participants and aspects of the study that are not intended to influence the results. Look for studies that use random assignment, matching or statistical controls, or that keep characteristics constant (e.g., using teachers with the same amount of experience), as ways to control extraneous factors.
Treatment Considerations
How is the treatment defined and described in the study? How was it implemented?
Most education research studies concern a particular education treatment or intervention, for example, a reading program, a type of teacher preparation or a mathematics curriculum designed to improve practices or conditions. (In experimental research, the treatment is called the independent variable.) Researchers should provide the operational definition of the treatment being studied. In addition, the definition should have construct validity.
Caution: Always determine the operational definition of the treatment in a study. Many research claims are invalid because the actual treatment in the study has been mislabeled.
As an example of an operational definition, consider a study of the effects of teacher professional development on student achievement. The treatment in this study is professional development. An operational definition of professional development could be a class in literacy instruction that teachers attend after school two times each week. Most educators would probably agree that this treatment is a valid example of professional development. If the operational definition were that teachers go out to lunch twice a week, most educators would object to calling this professional development. The treatment should be defined in a way that is a valid example or representation of the treatment being studied, in this case, professional development.

A Policymaker’s Primer on Education Research 28
Some treatments in education are particularly difficult to define. For example, researchers define teacher content knowledge (e.g., knowledge of mathematics) in various ways, such as the number of college courses the teacher completed in a subject area, whether the teacher earned a college major or minor in a subject and the teacher’s scores on teacher licensing tests. All these measures are proxy measures for the actual knowledge teachers have about a particular content area. When a proxy measure is used, valid conclusions can be made only about the measure and not about the construct the measure represents (in this case, actual knowledge).
In addition to a valid definition, the treatment must be implemented consistently. Researchers should report measures that demonstrate treatment fidelity. Did the treatment occur as planned?
If the treatment, for example, is a professional development class in literacy instruction, the researcher should report information and measures that demonstrate the class occurred as planned. This information might include participant attendance, content of the instruction, class schedule and class activities. In addition, if any event occurred during the treatment that might influence the results, for example, a literacy conference that some of the teachers attended during the study, it should be reported. The literacy conference might interact with the professional development, making the treatment appear to be more effective than it was.
Data-collection Considerations
What data were collected, and how were they collected? Most education research studies attempt to connect a treatment to a result. This result is called the dependent variable and refers to what is being measured in a research study. Data make up the body of information produced by these measures. Student achievement and teacher classroom practices are examples of dependent variables in education research. The researcher should provide operational definitions for all dependent variables in the study. Valid conclusions can be made only about the dependent variables that are measured in the study. For example, if the dependent variable is type of instruction, then a conclusion about student achievement is invalid.
Data-collection procedures refer to how and when the data were collected. The procedures used to collect data can influence research validity. For example, whether or not participants were guaranteed anonymity affects whether participants are honest in their responses to surveys. The time and frequency of classroom observations influence the type of data obtained from the observations. A classroom observation conducted the day before spring break is unlikely to provide valid data about a teacher’s instruction.
The most commonly used data-collection instruments in education research are the following:
• Tests
• Scaled Questionnaires
• Surveys
• Interviews
• Observations.
A Policymaker’s Primer on Education Research 29
It is critical that data-collection instruments have both validity and reliability. In general, instruments have validity when they measure what they are designed to measure. For example, results for 9th graders on a test of algebraic ability should be similar to their results on other tests of algebraic ability (e.g., test items on the Third International Mathematics and Science Study). Instruments are reliable if repeating a measurement within a short time span produces the same result. It is the responsibility of the researcher to report data on the validity and reliability of the instruments used for data collection in a study.
Caution: Do not be fooled into thinking that because an instrument has a name, it is a valid measure of what is named. For example, an instrument called a “Test of Teacher Content Knowledge” is not necessarily a test that actually measures teacher content knowledge.
Hint: Because there are so many things that can vary during a research study, a pilot test or a field test can increase the probability that measures are appropriate and that conclusions will be valid. Both types of tests refer to trial runs of all or some parts of a study. Data-collection instruments frequently undergo field testing to establish their validity and reliability. For example, prior to publishing a test, commercial-test developers conduct extensive field testing to demonstrate that the test is valid for its designed use and that test results are reliable.
Tests With the current emphasis on accountability in education, tests (also known as assessments) are common data-collection instruments in education research. Most standardized tests are produced by commercial test developers who administer them to large samples of participants. The developers then analyze the results to determine the tests’ validity and reliability. Researchers who use a commercial test for a study should either summarize the information on validity and reliability or direct the reader to a source for obtaining it. To judge the validity of conclusions about test results, it is also necessary to know whether the test is norm-referenced or criterion-referenced. In addition, it is important to know for what uses a test was developed. A test that is a valid measure of algebraic ability might not be a valid measure of the ability to teach algebra.
Scaled Questionnaires Scaled questionnaires (also called attitude scales) are often used to measure attitudes and beliefs. Most scaled questionnaires use a Likert Scale in which respondents are given choices reflecting varying degrees of intensity. For example, researchers have developed scaled questionnaires to measure school culture using items such as the following:
In this school, staff members are recognized when they do a task well. Choose one: Strongly Disagree, Disagree, Agree, Strongly Agree
Scaled questionnaires have the same validity and reliability requirements as tests. For example, what is the evidence that a school culture scale is actually measuring school culture and not some other property or characteristic of the school, such as material wealth? How a scaled questionnaire is used in a study also affects research validity. A scaled questionnaire developed to measure school culture might not have any relationship to leadership or student achievement, yet sometimes a researcher will make such unwarranted conclusions. The conclusions of a research study can be invalid despite the use of a valid data-collection instrument if the conclusions extend beyond the limits of what was measured.

A Policymaker’s Primer on Education Research 30
Here’s an example of how scaled questionnaires are developed:
A scaled questionnaire designed to measure school culture might ask teachers and administrators questions such as the following:
In this school, staff members are recognized when they do a task well. Choose one: Strongly Disagree, Disagree, Agree, Strongly Agree
I feel comfortable about discussing my concerns in this school. Choose one: Strongly Disagree, Disagree, Agree, Strongly Agree
To develop a scaled questionnaire (also called an attitude scale), a researcher asks a large sample of participants to respond to a large number of items the researcher has judged to have content validity with regard to a particular concept. For example, the researcher might verify with practitioners and other researchers that the items concern aspects of school culture. Next, the researcher often reduces the number of questionnaire items through a statistical procedure called factor analysis, which results in a small number of factors that relate to school culture. The researcher might call one factor “staff relations” because it consists of eight items that have to do with staff interactions. In studies where factor analysis has been used, it is important to identify the actual questionnaire items that make up a factor. Sometimes the name that the researcher gives to the factor might not reflect what was asked of participants. For example, questionnaire items for “staff relations” might ask participants only about interactions with the principal and not about interactions with teachers. It also is important to examine the reliability coefficient for each factor to determine how strongly the questionnaire items that represent a factor are related to one another. A low reliability coefficient (e.g., less than .50) means that the factor is not representative of the questionnaire items.
Surveys Surveys are widely used in education research, particularly in descriptive research studies. The key to a good survey is its design. The survey items should be carefully chosen to produce the data needed to answer the research questions. Survey items should be clear and should not bias a respondent toward particular answers (such as socially desirable responses). When the survey is the main data-collection instrument in a study, the researcher should include the survey in an appendix or make it available upon request. When a survey is mailed as a questionnaire rather than administered in person, a frequent problem is low response rate. Studies that use mailed questionnaires should always report the response rate and discuss the implications if it is low (i.e., less than 75%). If the response rate is low, the results might not be representative of the group of persons to whom the questionnaire was mailed. It is particularly important to know in a comparative descriptive study whether the response rates were different for the different groups.
Interviews Interviews are surveys that are administered verbally, either individually or in groups. An interview protocol can be structured or unstructured. Interviews are more reactive measures than are paper-and-pencil questionnaires. For this reason, interviewers should have training in conducting the interview. This is especially true when more than one interviewer is gathering data. If the interviewers are not asking the questions in the same way, comparisons of data across different interviewees will be invalid. The researcher should describe the interviewer training in the research report and should include the interview protocol in an appendix or provide it upon request.
A Policymaker’s Primer on Education Research 31
Hint: A focus group is a group of participants who are interviewed together and encouraged to share their opinions on a specific topic, which is the focus of the interview. The interviewer (also called the moderator) should have training in conducting this type of interview because adequately and accurately capturing the discussion is not a simple matter.
Observations Observation protocols are instruments used to document observations, usually in classrooms. A good observation protocol has clear operational definitions of the behaviors to be observed, as well as guidelines for recording the frequency of each behavior. For example, an observation protocol for a study of teachers’ instructional practices should list the various expected teaching behaviors (e.g., small-group discussion), provide operational definitions of each behavior (e.g., three to six students discussing problems), and indicate the length of each observational period (e.g., two hours) as well as the frequency of the observations (e.g., two times each week for four weeks). The researcher should provide information about the inter-rater reliability of the observation protocol. If multiple observers are used in a study and the observers do not agree on what they are observing, conclusions about the observational data will be invalid.
Data-analysis Considerations
How were the data analyzed? When determining whether or not a particular study did a good job of analyzing the data it produced, it is important to distinguish between quantitative data and qualitative data (see also Creswell, 2002).
Quantitative data analysis Researchers analyze quantitative data through statistics. The wide availability of statistical software programs makes it easy for researchers to analyze data, but also makes it easy to use statistics incorrectly, leading to invalid research conclusions.
The computation of inferential statistics is the primary basis for research conclusions about a treatment effect — that is, that a treatment or intervention worked. A statistically significant effect at the .05 level means that there is a 5% or less probability that the result occurred by chance. By convention, social scientists have chosen this percentage as the cut-off point (although other percentages are sometimes chosen). Thus, when there is statistical significance, the researcher concludes that the treatment effect did not occur by chance.
Caution: Researchers should not discuss non-significant results — results with a probability of occurrence that is greater than 5% — as if they indicate real treatment effects or group differences.
The probability of detecting a statistically significant effect increases with the size of the sample. There are two consequences of this relationship. First, a treatment effect might not be detected in a research study with a small sample size (e.g., less than 30 participants). As a result, the researcher’s conclusion that the treatment has no effect might be invalid. Second, with a large sample size, a very
A Policymaker’s Primer on Education Research 32
small treatment effect can be statistically significant, but the practical significance of the treatment might be limited. For this reason, the researcher should report the effect size of the treatment.
The concept of error is at the heart of inferential statistics. The more error that occurs in a study, the more the scores will vary. The more variability there is, the less likely it is that a treatment effect will be detected. Think of error and variability as background noise and the treatment as a sound. When there is too much noise, some sounds cannot be detected. Error in a research study can occur due to small sample sizes, unsystematic treatment implementation and unreliable measurement. The researcher should report the efforts made to standardize the treatment and the measurement (such as pilot-testing the treatment and training the data collectors).
For a deeper understanding of these statistical concepts, see the Understanding Statistics Tutorial (p. 37).
Qualitative data analysis In qualitative research, the data consist of narrative descriptions and observations. Although statistics are not used, qualitative data analyses need to be systematic to support valid research conclusions. Organization is at the heart of qualitative data analyses. In most qualitative research studies, large amounts of descriptive information are organized into categories and themes through coding. Coding is designed to reduce the information in ways that facilitate interpretations of the findings. A report on qualitative research should give detailed descriptions of the codes and the coding procedures.
Here is an example of coding qualitative data:
A researcher interviews the principals of 10 elementary schools to answer the following research question: “What challenges do schools face when adopting a comprehensive reform model?” The researcher reads the transcriptions of the interviews and lists all the topics that the 10 interviews addressed. Next the researcher groups similar topics into categories such as “parent approval,” “teacher collaboration” and “time issues.” The researcher uses these categories to code each interview and then assembles the information for each coded category across the 10 interviews. The researcher can then describe, for example, the degree to which parent approval was a challenge for the interviewed principals.
Qualitative researchers use verification methods to support their conclusions. For example, through triangulation of results, information from different measures in the study, such as interviews and documents, converges to support an interpretation. Member checking involves reporting the results of data analyses (i.e., the categories and themes) to the participants to verify that the researcher’s interpretations are correct. A researcher also can verify findings by conducting a deliberate search for disconfirming evidence, which is information that does not fit the categories, themes and interpretations.
The concept of error also is applicable to qualitative research studies. To minimize error, qualitative researchers need to maintain careful records of their field notes and observations. For this reason, interviews are often tape-recorded and transcribed.

A Policymaker’s Primer on Education Research 33
Examples of Rival Explanations Question:
A researcher wants to conduct a study to determine whether a teacher professional development program increases student achievement. Which of the following studies is most likely to result in valid conclusions?
Study 1: The 4th-grade teachers in a school district receive professional development in reading during the school year. At the end of the school year, student achievement scores are examined.
Study 2: The 4th-grade teachers in a school district receive professional development in reading during the school year. The students of the teachers take an achievement test at the beginning and at the end of the school year.
Study 3: Prior to the beginning of the school year, half of the 4th-grade teachers in a school district are randomly assigned to receive professional development in reading during the year, and the other half are assigned to receive no professional development in reading. At the end of the school year, student achievement scores for the two groups are examined.
Study 4: Prior to the beginning of the school year, half of the 4th-grade teachers in a school district are randomly assigned to receive professional development in reading during the year, and the other half are assigned to receive no professional development in reading. The students of the teachers take an achievement test at the beginning and at the end of the school year.
Answer: Study 1: Without a pretest, it is impossible to know whether the students made gains. Without a control group of teachers who were randomly assigned to receive no professional development, it is impossible to know whether the students’ scores were influenced by the professional development that their teachers experienced, so many rival explanations are possible here.
Study 2: The pretest makes it possible to measure student gains in reading. There could be many reasons, however, for gains other than the teacher professional development program. Without a control group of teachers who were randomly assigned to receive no professional development, it is impossible to know whether the students’ scores were influenced by the professional development that their teachers experienced or as a result of the normal instruction that students received in the school.
Study 3: This study compares a treatment group (teachers who receive professional development) with a control group (teachers who do not receive professional development). The teachers have been randomly assigned to the two groups. Without a pretest, however, it is impossible to know whether the students in the treatment made gains compared to the control group. Perhaps the treatment students were higher in achievement than the control students before the study began.
Study 4: This study uses a pretest-posttest data-collection strategy. It compares a treatment group with a control group, and the teachers have been randomly assigned to the two groups. The pretest makes it possible to measure student gains in reading. Study 4 is most likely to result in valid conclusions.
A Policymaker’s Primer on Education Research 34
How Do I Know if the Research Warrants Policy Changes?
Assessing the Research
After reading education research and making a judgment about whether the results and conclusions can be trusted, policymakers need to decide whether and how the research should be used to influence education policy. State or local factors, including the cost of implementation, are obvious influences on policy decisions. In addition, the quality, coherence, applicability and educational significance of the research should be considered.
Research quality The quality of education research is influenced by whether the research is:
• Valid — High-quality education research studies have conclusions that can be trusted. Research designs match research questions, and data collection and analyses follow accepted technical standards.
• Connected to prior research — High-quality education research studies build on prior research studies and conclusions. Research reports indicate how the studies contribute to the current knowledge base on education.
• Ethical — High-quality education research studies follow established rules of research ethics. Procedures are used to avoid researcher bias.
• Peer reviewed — High-quality education research studies are reviewed by other education researchers before the findings and conclusions are communicated broadly.
Research coherence The coherence of education research is influenced by whether the research findings:
• Are based on a theory or conceptual framework — A theory provides the rationale for the research design and guides the interpretation of the results. Because theories propose explanations for observations, theory-driven research gives policymakers the reasons behind particular findings on a policy issue.
• Have been replicated — Findings that have been replicated in several studies provide a stronger basis for making policy changes than those from only one study.
• Are part of a body of research — A body of research on an education program or policy provides conclusions about an issue or program from different studies in various settings and with various participants. A body of research is more informative to policymakers than are a few disconnected studies. (For an example of a body of research, see the literature review by Cooper et al., [2000] on summer school.)

A Policymaker’s Primer on Education Research 35
Research applicability An important factor that influences whether an education research study should be used to guide policymaking is the degree to which the findings of the study apply to the situation of interest to the policymaker. Researchers call this the external validity of the research.
Setting One consideration that influences applicability is the comparability of the setting of the research study and the setting of interest. For example, research on a teacher professional development program in urban school districts might not be applicable to a state in which rural schools are the norm, particularly if teacher collaboration between schools is an important feature of the program. The distances between rural schools could make teacher collaboration extremely difficult.
Participants A second consideration is the comparability of the participants. There is a lack of research, for example, on curricula and instruction for students from ethnic minorities. Participants in most education research studies are White, which calls into question whether the results apply to participants from ethnic minority backgrounds.
Yet another example is that many research studies on the effectiveness of education programs and practices do not disaggregate results for low-achieving and/or at-risk students. A program that facilitates learning for average students might not help struggling learners. The No Child Left Behind Act requires that states disaggregate state test results for subgroups of students. This requirement will likely result in more research on what can help low-achieving students meet state standards. (See Barley et al. [2002] for a research synthesis on classroom strategies to assist at-risk students.)
Program or treatment A third consideration is the comparability of the program or treatment. Unless the treatment or program described in the research study is fundamentally similar to that of the situation of interest, there can be no expectation that the results of the treatment in the situation of interest will be similar to those observed in the research study. For example, if the research study involved giving students laptop computers to take home as part of their language arts curriculum, using the same curriculum but without the laptop computers may not have the same effect.
Education practitioners can help policymakers determine whether a research study or group of studies is applicable to a particular local context. Practitioner knowledge, also referred to as professional wisdom, is an important source of information about the realities of classrooms and schools and the influences of local circumstances. If research settings do not match local contexts (e.g., research on urban schools applied to a rural state), then policymakers must determine the likelihood that the same results will be obtained in their schools. Practitioners can be of great assistance in this instance.
Educational significance An important question for policymakers and practitioners to ask about research is, “What is the educational significance of these findings?” In other words, what difference will it make to education if a policy or practice is changed or adopted based on research results? Without knowing the

A Policymaker’s Primer on Education Research 36
educational significance of a research finding, it is difficult, if not impossible, to estimate the costs and benefits of policy changes. One indicator of educational significance in a research study is the effect size of a program or practice. (Researchers refer to effect size as the practical significance of a result, in contrast to its statistical significance.)
There are some limitations to effect sizes. Their calculation requires quantitative data. In addition, effect sizes that are reported in individual research studies indicate the educational significance of a program or practice only for the specific participants and settings in that study. In other words, effect sizes might not apply to the local context in which the program or practice is implemented. For example, an effect size for a program designed for elementary students might be lower if the program is implemented with middle school students.
A meta-analysis reports an average effect size across several studies of an education program or practice. For this reason, a meta-analysis is a more informative tool for making determinations about educational significance than a single research study.
A Balancing Act
In the end, it is a matter of balancing all the criteria of usefulness in a way that reflects the local circumstances involved in a particular policy decision. First, it is necessary to determine if the research is empirical and the researcher's conclusions are valid. Next, policymakers must decide how much weight to give to the other criteria of research usefulness. The costs of policy decisions and potentially harmful effects are factors that should always be considered in addition to the information provided by the research. When there is little or no useful research on an education topic related to a policy decision, and a change is needed or mandated, then policymakers should find ways to fund the necessary research. In the long run, a policy decision that is informed by research might be far less costly than one that is uninformed.
To see how all of the pieces fit together in assessing the usefulness of research, or to assess the utility of a particular research study, consult the "Research Utility Assessment Guide" in the Applied Quick Primer (p. 4) The guide can be downloaded and printed out to serve as an informal score sheet.
References and Resources
Barley, Z., Lauer, P.A., Arens, S.A., Apthorp, H.S., Englert, K.S., Snow, D., and Akiba, M. (2002). Helping at-risk students meet standards: A synthesis of evidence-based classroom practices (REL deliverable #2002-20). Aurora, CO: Mid-continent Research for Education and Learning.
Cooper, H., Charlton, K., Valentine, J.C., and Muhlenbruck, L. (2000). "Making the most of summer school: A meta-analytic and narrative review." Monographs of the Society for Research in Child Development, Serial No. 260, 65(1).

A Policymaker’s Primer on Education Research 37
Understanding Statistics Tutorial
Overview
Statistics refers to methods and rules for organizing and interpreting quantitative observations. The purpose of this tutorial is to explain basic statistical concepts commonly used in education research. The goal is to help readers understand the results reported in quantitative education research.
Descriptive Statistics
Descriptive statistics are used to describe sets of numbers such as test scores. Researchers organize sets of scores into tables and graphs called frequency distributions.
Example 1 The following numbers represent students’ scores on a reading test: 19, 23, 17, 27, 21, 20, 17, 22, 19, 17, 25, 21, 29, 24. In Example 1, three students achieved a score of 17.
Reading Score Frequency Percent Percentile 17 3 21.4 21.4 19 2 14.3 35.7 20 1 7.1 42.9 21 2 14.3 57.1 22 1 7.1 64.3 23 1 7.1 71.4 24 1 7.1 78.6 25 1 7.1 85.7 27 1 7.1 92.9 29 1 7.1 100
TOTALS 14 100
A frequency table shows the distribution or number of students who achieved a particular score on the reading test.

A Policymaker’s Primer on Education Research 38
The following are the most common statistics used to describe frequency distributions:
N – the number of scores in a population
n – the number of scores in a sample
Percent – the proportion of students in a frequency distribution who had a particular score. In Example 1, 21% of the students achieved a score of 17.
Percentile – The percent of students in a frequency distribution who scored at or below a particular score (also referred to as percentile rank). In Example 1, 79% of the students achieved a score of 24 or lower, so a score of 24 is at the 79th percentile.
Mean – The average score in a frequency distribution. In Example 1, the mean score is 21.5. (Abbreviations for the mean are M if the scores are from a sample of participants and µ if the scores are from a population of participants.)
Median – The score in the middle of frequency distribution, or the score at the 50th percentile. In Example 1, the median score is 21.
Mode – The score that occurs most frequently in the distribution. In Example 1, the mode is 17.
Range – The difference between the highest and lowest score in the distribution. In Example 1, the range is 12.
Standard Deviation – A measure of how much the scores vary from the mean. In the sample, the standard deviation is 3.76, indicating that the average difference between the scores and mean is around 4 points. The higher the standard deviation, the more different the scores are from one another and from the mean. (Abbreviations for the standard deviation are SD if the scores are from a sample and Σ if the scores are from a population.)
The mean, median and mode are called measures of central tendency because they identify a single score as typical or representative of all the scores in a frequency distribution.
When a frequency distribution has a high standard deviation, the mean is not a good measure of central tendency as in the following set of scores:
Example 2 Scores = 1,4,3,4,2,7,18,3,7,2,4,3 Mean = 5 Median = 3.5 Standard Deviation = 4.53
The standard deviation in Example 2 indicates that the average difference between each score and the mean is around 4.5 points. Only one score (18), however, is 4.5 or more points different from the mean. In this example, the one extreme score (18) overly influences the mean. The median (3.5) is a better measure of central tendency because extreme scores do not influence the median.

A Policymaker’s Primer on Education Research 39
Standard Score – Specifies the location of an original score or raw score within a frequency distribution, based on standard deviation units. Standard scores also are known as z-scores and are calculated as follows:
z = (Raw Score – Mean)/Standard Deviation.
In Example 1, a raw score of 27 has a standard score of +1.46 (27 – 21.5 / 3.76). This indicates that a score of 27 is 1.46 standard deviation units above the mean. A raw score of 19 has a standard score of –.66, indicating that it is .66 standard deviation units below the mean.
Standard scores make it possible to compare scores on different tests that have different means and standard deviations. For example, the following table shows a student’s raw scores and standard scores on four different tests.
Subject Raw Score Standard Score Mathematics 31 +.75
Language Arts 71 -1.10
Science 42 -.25
Social Studies 42 +.56
On which test did this student perform best in comparison to the rest of the students in the class? Numerically, the student’s highest score was on the language arts test, but the standard score for language arts indicates that the student performed worst on this test because the score was 1.1 standard deviation units below the mean. The student’s best performance was on the mathematics test in which the student scored .75 standard deviation units above the mean. Note that although the student had the same score of 42 on the science and social studies tests, the score was above the mean in social studies but below the mean in science.
Inferential Statistics
Researchers use inferential statistics to make inferences about a population of study participants based on a sample of these participants. For example, a researcher might attempt to conclude something about a population of students (e.g., all 4th graders in a school district) by studying a sample of these students. Based on inferential statistics, the researcher infers that the results from the sample of 4th graders are also true of the population of 4th graders. Inferential statistics also are used to make inferences about the differences between two or more groups of observations.
Example 3 A researcher randomly selects participants from a population of 4th-grade students and randomly assigns them to two groups. Students in Group A participate in Reading Program A. Students in Group B participate in Reading Program B. Based on their reading test scores, which program resulted in better reading performance?

A Policymaker’s Primer on Education Research 40
Program A: Scores = 14, 11, 15, 15, 16, 16, 18, 18, 17, 18, 14, 17, 12, 15, 16, 14, 15, 13 n = 18 M = 15.22 SD = 2.02
Program B: Scores = 15, 22, 19, 20, 22, 20, 21, 14, 20, 21, 19, 19, 16, 12, 18, 17, 20, 18 n = 18 M = 18.5 SD = 2.77
Reading Scores Frequency Percent Percentile
Program A 11 1 5.6 5.6 12 1 5.6 11.1 13 1 5.6 16.7 14 3 16.7 33.3 15 4 22.2 55.6 16 3 16.7 33.3 17 2 11.1 83.3 18 3 16.7 100.0 Program B 12 1 5.6 5.6 14 1 5.6 11.1 15 1 5.6 16.7 16 1 5.6 22.2 17 1 5.6 27.8 18 2 11.1 38.9 19 3 16.7 55.6 20 4 22.2 77.8 21 2 11.1 89.9 22 2 11.1 100.0
According to the descriptive statistics and the frequency graph, Program B resulted in better reading performance because students in Group B achieved a higher mean test score than students in Group A. Is this difference however of 3.28 between the means of the two groups due to Program B, or could this difference simply be due to chance factors? To answer this question requires the use of inferential statistics.

A Policymaker’s Primer on Education Research 41
Statistical significance The research design of the study determines the type of inferential statistic used. All inferential statistics however answer the same question:
Could these findings occur by chance or are these findings too unlikely to occur by chance and therefore the findings reflect a real effect of what is being studied?
The most common inferential statistics are the t-test and the F-test (also known as analysis of variance). The t statistic is used when there are two groups of participants in the research study. The F statistic is used when there are more than two groups in the research study. Usually, the researcher uses a computer program to calculate the inferential test statistic and the probability of obtaining a particular statistical value if there is no real difference between the groups.
In Example 3, the t statistic is 4.06. The researcher would report this result as follows: Students in Group B performed significantly better than students in Group A, t = 4.06 (34) p < .001. What does this mean?
Simply put, the probability of this result occurring by chance is less than one time out of 1,000. Therefore, the researcher can be very confident that the difference between the two groups reflects an actual difference. [Note: The number 34 in parentheses is called the degrees of freedom and reflects the size of the samples. For a two-sample t-test, the degrees of freedom are calculated as (n – 1) + (n –1). Degrees of freedom are used in the calculation of inferential statistics, and it is conventional to report them.]
The term statistically significant is used to describe results for which there is a 5% or less probability that the results occurred by chance. Why 5%? By convention, social scientists have chosen this percentage as the cut-off point (although other percentages are sometimes chosen). Therefore, any result that has a probability of occurring by chance more than five times out of 100 (designated by convention as p > .05) is reported as not significant. Researchers should not discuss nonsignificant results as if they indicate actual differences between groups.
Sometimes researchers also report the confidence interval for the results of a t-test. In Example 2, the 95% confidence interval for the mean difference between Programs A and B is between 1.63 and 4.92. This means that if the entire population of 4th-grade students participated in the two reading programs, there is a 95% probability that the mean difference in reading achievement between Programs A and B would be between 1.63 and 4.92 points. The confidence interval provides an estimate of population measurements based on sample measurements.
There is an important relationship between the size of the sample and statistical significance. As the sample size increases, the probability increases that significant differences will be detected. This is a concept called statistical power.
Consider results from the following studies:
Example 4 Program X: n = 10, Mean achievement = 30.5 Program Y: n = 10, Mean achievement = 31.5

A Policymaker’s Primer on Education Research 42
t = 2.15, p > .05 The difference between Program X and Program Y is not statistically significant.
Example 5 Program X: n = 100, Mean achievement = 30.5 Program Y: n = 100, Mean achievement = 31.5 t = 2.15, p < .05 The difference between Program A and Program B is statistically significant.
The same numerical difference of 1.5 points between the two groups is statistically significant in the study with large sample sizes (and more statistical power) but not in the study with small sample sizes. In studies with very large sample sizes (e.g., 1,000), even small numerical differences can be statistically significant. For this reason, it is important to examine what is known as the effect size of a statistically significant difference.
Practical significance In addition to measures of statistical significance, researchers frequently calculate and report measures of practical significance, known as the effect size. The effect size helps policymakers and educators decide whether a statistically significant difference between programs translates into enough of a difference to justify adoption of a program.
There are different ways to measure effect sizes. One commonly used measure is called Cohen’s d, which measures effect sizes in standard deviation units. In Example 3, Cohen’s d = 1.34 standard deviation units. Social scientists commonly interpret d as follows (although interpretation also depends on the intervention and the dependent variable):
• Small effect sizes: d = .2 to .5
• Medium effect sizes: d = .5 to .8
• Large effect sizes: d = .8 and higher
Thus, in Example 3, the effect size of d = 1.34 is “large,” but what does “large” mean in terms of reading achievement?
A simple way to understand effect sizes is to translate d into percentile gains. An effect size of d = 1.34 translates into a percentile gain of 41 percentile points (based on the normal curve, as described in the next section). This means that the reading score of the average student who participates in Reading Program B will be 41 percentile points higher than the average student who participates in Reading Program A. The bottom line: Program B is a more effective reading program than Program A.
The normal curve and effect sizes Another way to understand effect sizes is to examine the normal curve. The normal curve refers to a frequency distribution in which the graph of scores resembles a bell — hence, the famous bell-shaped curve. Many human traits such as intelligence, personality scores and student achievement have normal distributions.

A Policymaker’s Primer on Education Research 43
Example 6 If all adults in the state of Colorado were given a general intelligence test, the frequency distribution of the scores would resemble the following bell-shaped curve.
The normal distribution has an important characteristic. The mean, median and mode are the same score (a score of 100 in Example 6) because a normal distribution, is symmetrical. The score with the highest frequency occurs in the middle of the distribution and exactly half of the scores occur above the middle and half of the scores occur below. Most of the scores occur around the middle of the distribution or the mean. Very high and very low scores occur infrequently and are therefore considered rare.
In a normal distribution, 34.1 % of the scores occur between the mean and one standard deviation above the mean. In Example 6, the standard deviation is 10. The result is that 34.1% of adults in Colorado scored between 100 and 110. (Conversely, 34.1% of adults in Colorado scored between 100 and 90.) A score of 120 is two standard deviations above the mean. In a normal distribution, 47.5% of the scores occur between the mean and two standard deviations above or below the mean. Thus, two standard deviations above and below the mean include 95% of all scores.
Scores in a normal distribution also can be described as percentiles. The score that is the mean (and also the median and mode) is the score at the 50th percentile because 50% of the scores are at that score or below. In the example, a score of 100 is at the 50th percentile. A score of 110 is one standard deviation above the mean and therefore at the 84th percentile (50% + 34.1%). Finally, a score of 120 is two standard deviations above the mean and is therefore at the 97th percentile (50% + 47.5%).
Hint: Sometimes percentile scores on tests are converted into normal curve equivalent (NCE) scores because NCE scores are easier to manipulate arithmetically and statistically than are percentiles.
How do effect sizes relate to the normal curve? Because Cohen’s d is measured in standard deviation units, an effect size of d = 1.0 is equal to one standard deviation above the mean.
Example 7 A researcher discovers a special herb that increases adult intelligence, with an effect size of d = 1.0. The average adult in Colorado (with an intelligence score of 100) who takes this herb can expect to have an intelligence score of 110, an increase in percentile rank from the 50th percentile to the 84th percentile. This researcher stands to make a lot of money!

A Policymaker’s Primer on Education Research 44
Effect sizes also apply to scores on student achievement tests because these tests are designed to be normally distributed. For example, an effect size of d = 1.0 for a reading program means that the reading program increased the reading score of the average student to one standard deviation above the mean. An effect size of d = .5 means that the reading score of the average student in the program increased to .5 standard deviation above the mean. (If the standard deviation equals 8, the average student’s score would increase by 8 points with d = 1.0, and would increase by 4 points with d = .5.)
Caution: Effect sizes also can be negative, which means that scores are lowered by the effect of the program in the study. For example, an effect size of d = –1.0 means that the average score was decreased by one standard deviation.
Correlation
Correlation refers to a technique used to measure the relationship between two or more variables.
Example 8 In the following example, the first variable is the number of students in 4th-grade classes in a school district. The second variable is the mean reading score of each class.
VVAARRIIAABBLLEE 11: Class Size VVAARRIIAABBLLEE 22:: Mean Reading Score
25 70
20 80
25 60
25 72
30 58
22 71
28 68
20 75
19 72
29 61
Pearson r is a statistic that is commonly used to calculate bivariate correlations. In Example 8, Pearson r = -.80, p < .01. What does this mean?
To interpret correlations, four pieces of information are necessary.
1. The numerical value of the correlation coefficient. Correlation coefficients can vary numerically between 0.0 and 1.0. The closer the correlation is to 1.0, the stronger the relationship between the two variables. A
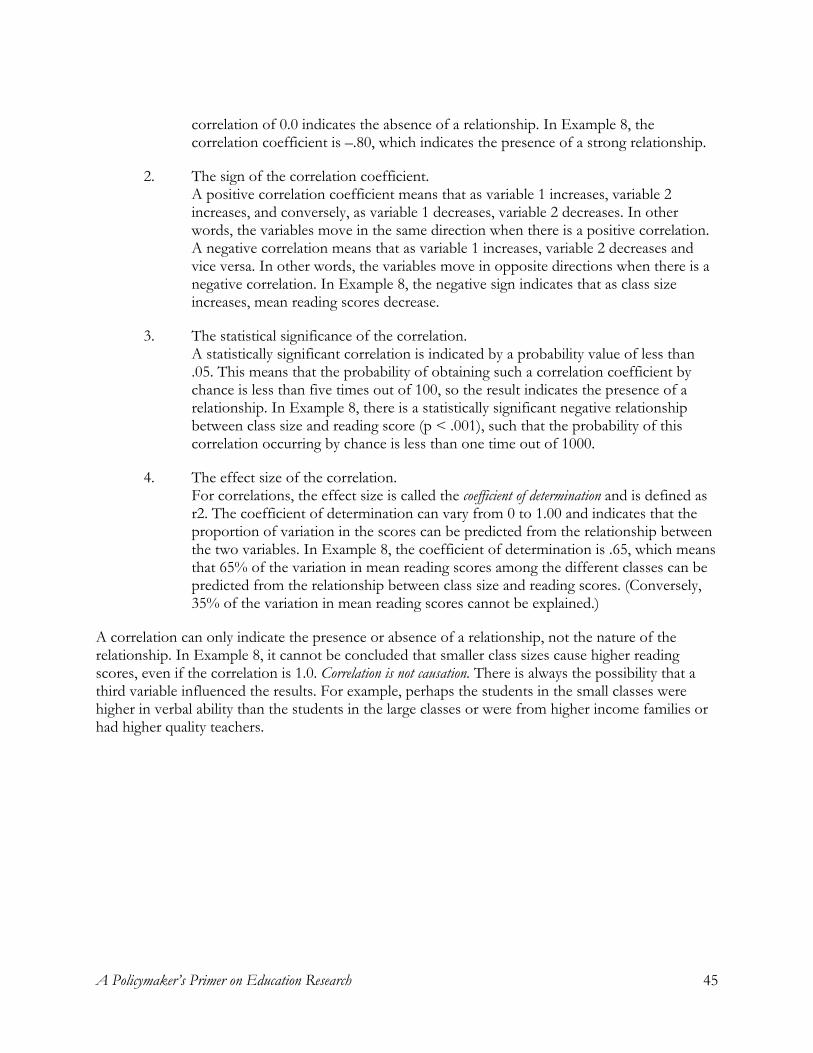
A Policymaker’s Primer on Education Research 45
correlation of 0.0 indicates the absence of a relationship. In Example 8, the correlation coefficient is –.80, which indicates the presence of a strong relationship.
2. The sign of the correlation coefficient. A positive correlation coefficient means that as variable 1 increases, variable 2 increases, and conversely, as variable 1 decreases, variable 2 decreases. In other words, the variables move in the same direction when there is a positive correlation. A negative correlation means that as variable 1 increases, variable 2 decreases and vice versa. In other words, the variables move in opposite directions when there is a negative correlation. In Example 8, the negative sign indicates that as class size increases, mean reading scores decrease.
3. The statistical significance of the correlation. A statistically significant correlation is indicated by a probability value of less than .05. This means that the probability of obtaining such a correlation coefficient by chance is less than five times out of 100, so the result indicates the presence of a relationship. In Example 8, there is a statistically significant negative relationship between class size and reading score (p < .001), such that the probability of this correlation occurring by chance is less than one time out of 1000.
4. The effect size of the correlation. For correlations, the effect size is called the coefficient of determination and is defined as r2. The coefficient of determination can vary from 0 to 1.00 and indicates that the proportion of variation in the scores can be predicted from the relationship between the two variables. In Example 8, the coefficient of determination is .65, which means that 65% of the variation in mean reading scores among the different classes can be predicted from the relationship between class size and reading scores. (Conversely, 35% of the variation in mean reading scores cannot be explained.)
A correlation can only indicate the presence or absence of a relationship, not the nature of the relationship. In Example 8, it cannot be concluded that smaller class sizes cause higher reading scores, even if the correlation is 1.0. Correlation is not causation. There is always the possibility that a third variable influenced the results. For example, perhaps the students in the small classes were higher in verbal ability than the students in the large classes or were from higher income families or had higher quality teachers.

A Policymaker’s Primer on Education Research 46
Correlation and prediction Another use of correlation is prediction. A mathematical technique called regression analysis uses the correlation between two variables to predict the values for variable 2 (the dependent or criterion variable) based on the values for variable 1 (the predictor variable). The following graph indicates a
linear relationship between variable 1 and variable 2 from Example 8.
A regression analysis can identify the equation that best describes the linear relationship between class size and reading score in the graph. This equation can then be used to estimate mean reading scores based on class sizes. Unless there is a perfect correlation between two variables (i.e., r = ± 1.00), the prediction based on regression analysis will be imperfect. The standard error of estimate indicates how accurately the equation can predict values of a variable. In the example, the standard error of estimate is 4.44, which is the average distance between the line in a graph of the regression equation and the actual data points for the mean reading score.
A simple way to think about prediction error is that the smaller the numerical value of the correlation, the smaller the coefficient of determination, and the more error there will be when using the correlation for prediction.
Correlation with multiple variables When there is more than one predictor variable, the technique of multiple regression analysis combines the predictor variables to produce a multiple correlation coefficient called R. For example, in addition to class size, a researcher might use students’ mean verbal ability scores and socioeconomic status to predict reading scores. A multiple correlation coefficient of R = .71 would indicate the degree of the combined correlation of the predictor variables with mean reading scores. The squared

A Policymaker’s Primer on Education Research 47
multiple correlation coefficient of R2 = .49 would indicate that 49% of the variation among mean reading scores of the different 4th-grade classes can be predicted by the relationship between reading scores and the combination of class size, verbal ability and socioeconomic status. (Conversely, 51% of the variation in mean reading scores cannot be explained.)
Although the technique of multiple regression provides more information than bivariate correlation, it cannot be concluded that variables caused other variables to occur in certain ways.
Structural equation modeling Like multiple regression, structural equation modeling (SEM) also examines linear relationships among a set of variables. With SEM however, the researcher hypothesizes a model for how the variables that are measured in a study are related to one another as well as how the measured variables influence and are influenced by unobserved variables called latent variables. For example, student motivation might be a latent variable that influences student achievement and class size might influence student motivation. In SEM, the statistics that are of primary interest are goodness-of-fit statistics that evaluate how well the data fit the researcher’s proposed model for the interrelationships among the variables.
Caution: Structural equation modeling is sometimes referred to as causal path modeling. Despite the use of the word “causal,” this technique is correlational and does not support conclusions about cause and effect.
Hierarchical linear modeling Hierarchical Linear Modeling (HLM) is statistical technique used when the data are from participants who exist within different levels of a hierarchical structure (Osborne, 2000). For example, students exist within a hierarchical structure that includes family, classroom, grade, school, district and state. Student achievement is considered nested data because it reflects influences from each of these levels (e.g., influences from family characteristics; the classroom teacher; the grade level; and school, district and state policies).
With HLM, the researcher first measures the influence of one or more predictor variables (e.g., student socioeconomic status and prior achievement) on an outcome (student reading achievement) at level one. Next the researcher measures the relationship of level two predictor variables (e.g., teacher professional development and experience) on the level one relationship. For example, through HLM, a researcher might find that student socioeconomic status and prior achievement are negatively related to reading achievement, but that this relationship is less strong with increasing teacher professional development. In other words, the more professional development teachers have, the weaker the correlation of these other factors is with their students’ achievement.

A Policymaker’s Primer on Education Research 48
References and Resources
Osborne, J. W. (2000). Advantages of hierarchical liner modeling. ERIC/AE Digest. (ERIC Document Reproduction Service No. ED447198)
Gravetter, F. J. & Wallnau, L. B. (1988). Statistics for the behavioral sciences (2nd ed.). St. Paul: West Publishing.
Grimm, L. G. & Yarnold, P. R. (Eds.). (1995). Reading and understanding multivariate statistics. Washington DC: American Psychological Association.
Maruyama, G. M. (1998). Basics of structural equation modeling. Thousand Oaks: Sage Publications

A Policymaker’s Primer on Education Research 49
Searching ERIC Tutorial Because ERIC is undergoing reorganization, some of the resources that were once on the site to provide search assistance are either no longer there or are difficult to locate. To learn how to search ERIC and to conduct an actual ERIC search, we recommend going to the “Educator’s Reference Desk” Web site, maintained by Syracuse University. At www.eduref.org, there is not only information about searching the ERIC database, but also access to a number of other resources once part of the AskERIC database, which is no longer available through ERIC.
Before actually beginning an ERIC search, it is important to understand that every journal article and document entered into the ERIC database is assigned several ERIC “descriptors,” which are terms with standard definitions. The trick is to determine which ERIC descriptors have been assigned to a particular topic or set of documents of interest. Fortunately, there is an ERIC Thesaurus that operates much like a standard thesaurus. By looking up terms in the ERIC Thesaurus related to a topic, it is possible to identify the ERIC descriptors used to index ERIC citations. These descriptors can then be used to conduct a search for the citations in the ERIC database.
Begin the search by going to the Educator’s Reference Desk “Search ERIC Database” page, at www.eduref.org/Eric. There you will find a number of options for search assistance and for conducting an ERIC search. To identify the appropriate ERIC descriptors needed for the search, select the “ERIC Thesaurus” option in the box on the left, which leads to the actual ERIC Thesaurus. In the “Keywords” box, enter the term or phrase (in single quotes) associated with the topic of interest. Enter it in all capital letters to avoid problems with case-sensitive words or phrases. After entering a keyword, it is sometimes possible to narrow the search a little more by adding one of the terms in the “Category” window. Then click on “Search” to see what Thesaurus descriptors show up.
Example: If the topic concerns programs for students at risk of academic failure, go to the Thesaurus and enter AT-RISK at the prompt for Keywords. The following three ERIC descriptors will appear: AT-RISK PERSONS; HIGH RISK PERSONS (1982 1990) ; RISK POPULATIONS. Click on AT-RISK PERSONS to obtain a Thesaurus entry that lists broader, narrower and related terms. Click on the narrower term of HIGH RISK STUDENTS to obtain yet another Thesaurus entry that lists related terms such as COMPENSATORY EDUCATION.
It may be necessary to try several different keywords before finding appropriate descriptors. Alternatively, click on the “Browse” button to see the entire list of Thesaurus descriptors and choose from among those.
Note that in addition to descriptors for subject topics, the ERIC Thesaurus also includes descriptors for different types of citations. For example, LITERATURE REVIEW is a descriptor in the ERIC Thesaurus.
After choosing the descriptors, make a note of them and exit the ERIC Thesaurus by closing the window, which will lead back to the “Search ERIC Database” page on the Educator’s Reference Desk Web site. Now, either begin a search on ERIC or obtain more information about conducting
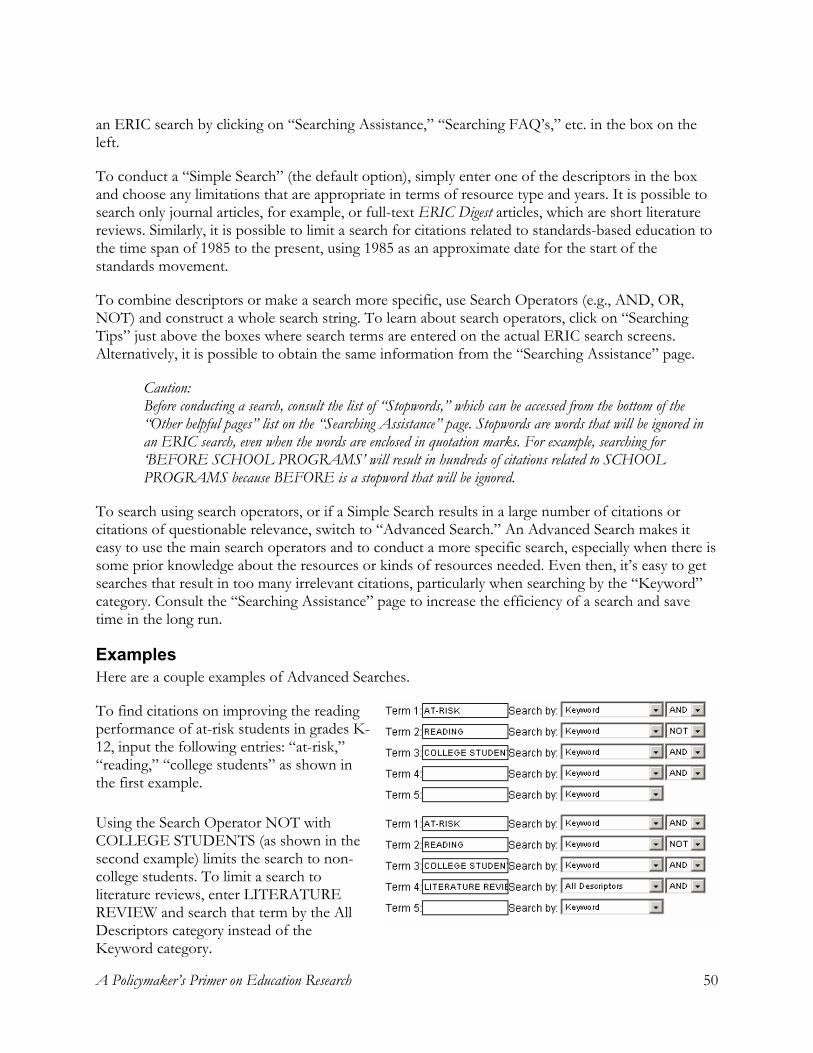
A Policymaker’s Primer on Education Research 50
an ERIC search by clicking on “Searching Assistance,” “Searching FAQ’s,” etc. in the box on the left.
To conduct a “Simple Search” (the default option), simply enter one of the descriptors in the box and choose any limitations that are appropriate in terms of resource type and years. It is possible to search only journal articles, for example, or full-text ERIC Digest articles, which are short literature reviews. Similarly, it is possible to limit a search for citations related to standards-based education to the time span of 1985 to the present, using 1985 as an approximate date for the start of the standards movement.
To combine descriptors or make a search more specific, use Search Operators (e.g., AND, OR, NOT) and construct a whole search string. To learn about search operators, click on “Searching Tips” just above the boxes where search terms are entered on the actual ERIC search screens. Alternatively, it is possible to obtain the same information from the “Searching Assistance” page.
Caution: Before conducting a search, consult the list of “Stopwords,” which can be accessed from the bottom of the “Other helpful pages” list on the “Searching Assistance” page. Stopwords are words that will be ignored in an ERIC search, even when the words are enclosed in quotation marks. For example, searching for ‘BEFORE SCHOOL PROGRAMS’ will result in hundreds of citations related to SCHOOL PROGRAMS because BEFORE is a stopword that will be ignored.
To search using search operators, or if a Simple Search results in a large number of citations or citations of questionable relevance, switch to “Advanced Search.” An Advanced Search makes it easy to use the main search operators and to conduct a more specific search, especially when there is some prior knowledge about the resources or kinds of resources needed. Even then, it’s easy to get searches that result in too many irrelevant citations, particularly when searching by the “Keyword” category. Consult the “Searching Assistance” page to increase the efficiency of a search and save time in the long run.
Examples Here are a couple examples of Advanced Searches.
To find citations on improving the reading performance of at-risk students in grades K-12, input the following entries: “at-risk,” “reading,” “college students” as shown in the first example.
Using the Search Operator NOT with COLLEGE STUDENTS (as shown in the second example) limits the search to non-college students. To limit a search to literature reviews, enter LITERATURE REVIEW and search that term by the All Descriptors category instead of the Keyword category.

A Policymaker’s Primer on Education Research 51
Glossary of Education Research Terms abstract: A brief, comprehensive summary of a research report that includes the research problem, a description of the participants, and an overview of the method, results and conclusions.
aggregated data: Data for which individual scores on a measure have been combined into a single group summary score.
Example: In education research, it is common to aggregate individual student scores on an achievement test into a mean score for each school. Researchers then use the aggregate school achievement score for data analyses. Aggregating data reduces the sample size and obscures differences among individual scores.
analysis of variance (ANOVA): A statistical technique used to test for statistically significant differences between two or more different groups of observations. An ANOVA produces F, an inferential test statistic.
attitude scale: A questionnaire that gathers information about participants’ attitudes or beliefs concerning a particular topic based on the degree of intensity that they indicate in their responses.
bivariate correlation: A statistical correlation between two variables.
case study: A data collection method in which a single person, entity or phenomenon is studied in depth over a sustained period of time and through a variety of data.
Example: A researcher conducts a yearlong case study of a school district that was awarded a grant to improve teacher quality. The researcher documents the processes used to implement the grant, interviews teachers and administrators, observes staff development, and measures student achievement before and after the grant was awarded.
central tendency: A score in a set of scores or a frequency distribution that is typical or representative of all the scores. Measures of central tendency are the mean, median and mode.
coding: In qualitative research, the process used to reduce information into categories or themes for data analysis and interpretation.

A Policymaker’s Primer on Education Research 52
coefficient of determination: For bivariate correlations, the coefficient of determination is defined as r2, which is interpreted as the proportion of variation in the scores that is explained by the relationship between the variables. Note: Correlations indicate statistical, not causal, relationships.
Example: A researcher finds a correlation of r = .60 between years of teaching experience and student achievement. The coefficient of determination of r2 = .36 means that 36% of the variation in achievement scores can be explained by the relationship between the two variables. (Conversely, 64% of the variation in achievement scores cannot be explained by the relationship.)
comparative descriptive research design: A research design in which data are collected to describe and compare two or more groups of participants or entities.
Example: A researcher identifies high-poverty schools in the state that have either high or low student achievement. The researcher describes the alignment or match between each school’s curriculum and state standards and compares the high- versus the low-achieving schools to determine whether the degree of alignment is different.
comparison groups: The groups of participants who are being compared in a study, either based on different group characteristics or on having different treatments.
confidence interval: A range of values that indicates the confidence or probability of observing a particular score or value in a population, usually expressed as standard deviation units above and below the mean. The wider the interval, the greater the confidence or probability that a particular value will be observed.
Example: Based on a random sample of 4th-grade reading scores, a researcher calculates the following 90% confidence interval for the mean of the population of 4th-grade reading scores: 67 ± 3.2. This indicates there is a 90% probability that the mean reading score of the population is between 63.8 and 70.2.
construct validity: The degree to which variables in a research study are considered by the education and research communities as acceptable representations of the constructs that the study concerns.
Example: One-on-one instruction is a valid representation of the construct of tutoring, while whole-class instruction would not be considered valid. Student scores on a standardized mathematics test are a valid representation of the construct of student achievement, while student scores on a survey about attitudes toward school would not be considered valid.
content validity: The degree to which the items on a measuring instrument (e.g., test or questionnaire) adequately cover the content that the instrument is designed to measure.

A Policymaker’s Primer on Education Research 53
control: The strategy used in scientific research to regulate the effects of variables in a study that are not intended to influence the results or conclusions.
Example: A researcher conducts a study of two different teacher preparation courses on how to teach mathematics. The researcher controls for differences among preservice students by randomly assigning the students to one of the two courses. The researcher controls for differences among course instructors by having a single instructor teach both courses.
control group: The group of participants in an experiment who do not receive the treatment that is being studied.
convenience sample: A sample of participants selected for a research study based on their availability.
Example: A teacher educator conducts a research study of the preservice students enrolled in the traditional and alternative teacher preparation programs at the institution where the teacher educator is a faculty member. The sample is one of convenience because the preservice students are selected for the study based on their availability to participate.
correlation coefficient: A number that indicates the strength and direction of the statistical association between two or more variables. Correlation coefficients vary between –1.00 and +1.00. The higher the numerical value, the stronger the association. A correlation of 0.00 indicates the absence of an association. A positive sign means that as one variable increases, so does the other. A negative sign means that as one variable increases, the other variable decreases.
Example: A correlation coefficient of +.63 between the number of education courses and teacher test scores means that the more education courses that a teacher candidate completed, the higher the test score. A correlation of –.63 means that the more education courses that a teacher candidate completed, the lower the test score. Neither correlation coefficient, however, can support the existence of a causal relationship between courses and test scores because correlation is not causation.
correlational research: A type of research that seeks to establish an association or correlation between two or more variables. The fact that two or more variables are associated does not necessarily mean that one is a cause of the other(s).
correlational research design: A research design in which data are collected to describe the statistical association between two or more variables.
Example: Bivariate correlation:

A Policymaker’s Primer on Education Research 54
In School District X, a researcher collects data on beginning teachers’ scores on the state licensing test (variable 1) and data on the achievement gains of each teacher’s students (variable 2). The researcher then uses correlational statistics to measure the association between the two variables.
Multivariate correlation (also referred to as multiple regression): In School District X, a researcher collects data on beginning teachers’ scores on the state licensing test (variable 1), the number of college courses that each teacher completed in mathematics (variable 2), the amount of time that each teacher spent in school-based field experiences prior to certification (variable 3), and the achievement gains in mathematics by each teacher’s students (dependent variable). The researcher uses multiple regression statistics to measure the association between the three teacher variables and student achievement gains and to estimate student achievement gains based on the contribution of each of the teacher variables to that association.
covariate: A variable that is correlated with another variable, such that when there is a change in one variable, there is a corresponding change in the other variable. Analysis of covariance is a statistical method that controls for the influence of covariates on the dependent variable in a research study.
Example: A researcher conducts a study on the influence of teacher professional development on principals’ ratings of teacher performance. The researcher designates teaching experience as a covariate to statistically control its influences on principal ratings.
criterion variable: The dependent variable that is being predicted in a regression analysis.
criterion-referenced test: A test for which a score is interpreted by comparing it to levels of performance established for the test by professionals in the field that the test addresses.
Example: Scores on the Colorado Student Assessment Program are assigned to the following categories based on the proficiency that students demonstrate in relation to state content standards: unsatisfactory, partially proficient, proficient and advanced.
cross-sectional research: A data-collection strategy in which data are collected at one point in time from participants who are at different developmental or grade levels. The purpose is to draw conclusions about differences between developmental groups.
Example: A researcher conducts a study of a new standards-based mathematics curriculum to determine whether the curriculum benefits students differently depending on their grade levels. The researcher compares gains in mathematics achievement by 2nd, 4th and 6th graders after their school adopts the new curriculum.
data: Factual information gathered as evidence for a research study.

A Policymaker’s Primer on Education Research 55
data-analysis plan: The plan for analyzing data in a research study. In a quantitative research study, the data-analysis plan provides details on statistical procedures. In a qualitative research study, the data-analysis plan provides details on coding procedures.
data-collection instrument: A tool used to collect data in a research study such as a test, observation protocol or questionnaire.
degrees of freedom (df): In statistics, the number of scores in a sample that are free to vary, calculated as sample size minus one ( n – 1). The degrees of freedom are used in the calculation of inferential statistics.
dependent variable: The variable that is measured in a study. In an experimental research study, the dependent variable is affected by the independent variable. In a correlational research study, the dependent variable is associated with one or more other variables.
Example: Experimental research study: A researcher randomly assigns teachers in a large elementary school to receive one of three types of professional development: (1) a class on instructional strategies, (2) a training program on how to increase student motivation or (3) a teacher discussion group. The researcher measures the differences in achievement gains among the students of the three teachers. The dependent variable is student achievement gains. Correlational research study: A researcher collects data on beginning teachers’ scores on the state licensing test (variable 1) and data on the achievement gains of each teacher’s students (variable 2). The researcher then uses the association between the two variables to estimate student achievement gains. The dependent variable is student achievement gains.
descriptive research: A type of research that has the goal of describing what, how or why something is happening.
descriptive statistics: Statistics used to describe, organize and summarize data.
Example: Commonly used descriptive statistics include the mean, median, and standard deviation.

A Policymaker’s Primer on Education Research 56
disaggregated data: Aggregated or grouped data that have been separated into individual component scores.
Example: The No Child Left Behind Act requires schools to disaggregate student achievement data into the scores obtained by subgroups of students based on race/ethnicity, disability, socioeconomic level, gender, migrant status and English language proficiency.
disconfirming evidence: A method used to verify the accuracy of data analyses in qualitative research by searching for evidence that negates the themes and categories that the researcher used to code and analyze the data.
education research: The systematic gathering of empirical information to answer questions related to education.
effect size: The degree to which a practice, program or policy has an effect based on research results, measured in standard deviation units. (Effect size is also referred to as practical significance.) A statistic commonly used to measure effect size is Cohen’s d, which social scientists interpret as the following: d = .2, small; d = .5 to .8, medium; and d = .8 and higher, large.
Example: A researcher finds an effect size of d = .5 for the effect of an after-school tutoring program on reading achievement. This means (provided that the research study is valid) that the average student who participates in the tutoring program will achieve one-half standard deviation above the average student who does not participate. If the standard deviation is eight points, then the effect size translates into four additional points, which might increase a student’s ranking on the test.
empirical information: Information based on something that can be observed. Students’ test scores, observations of teachers’ classroom instruction, principals’ interview responses and school dropout rates are examples of empirical information in education research.
empirical research: Research that seeks systematic information about something that can be observed in the real world or in the laboratory.
ERIC: The Educational Resources Information Center, a federally funded source for literature on education research, including a searchable online database. (See http://www.eric.ed.gov)
error: Inaccuracies in implementing a research study, including during sampling, treatment delivery, data
A Policymaker’s Primer on Education Research 57
recording or data analysis. Errors increase the variability of the data and threaten the validity of research conclusions.
ethnography: A data-collection method in which information is collected about a group of individuals in their natural setting, primarily through observations.
Example: A researcher uses ethnography to study the challenges that face three beginning teachers at one elementary school. The researcher observes and documents the teachers in their classrooms, on the playground, in the teachers’ lounge, at staff meetings, at parent conferences and in staff development sessions.
evaluation design: The plan for how data will be collected in an evaluation study. The evaluation design should be appropriate for the evaluation questions that the study addresses.
evaluation question: The question(s) that an evaluation seeks to answer about a program. Evaluation questions can address program processes, program outcomes, links between the processes and outcomes, and explanations for the outcomes.
evaluation study: A study designed to judge the effectiveness of an education program. Evaluation studies use some of the same research designs that research studies employ.
Example: A school district hires an evaluator to conduct a study on the effectiveness of an after-school tutoring program. The evaluator collects data about the student participants, their achievement before and after tutoring, the type and amount of tutoring that occurred, and the characteristics of the tutors. The evaluator also collects achievement data from a comparison group of students who applied too late to receive tutoring. The evaluation results include data about changes in student achievement as well as data about whether the program was implemented as planned.
experimental research: A type of research that has the goal of determining whether something causes an effect.
experimental (true) research design: A research design in which (1) an independent variable is directly manipulated to measure its effect on a dependent variable, and (2) participants are randomly assigned to different groups that receive different amounts of the independent variable. (Also referred to as randomized field trials or randomized controlled trials.)
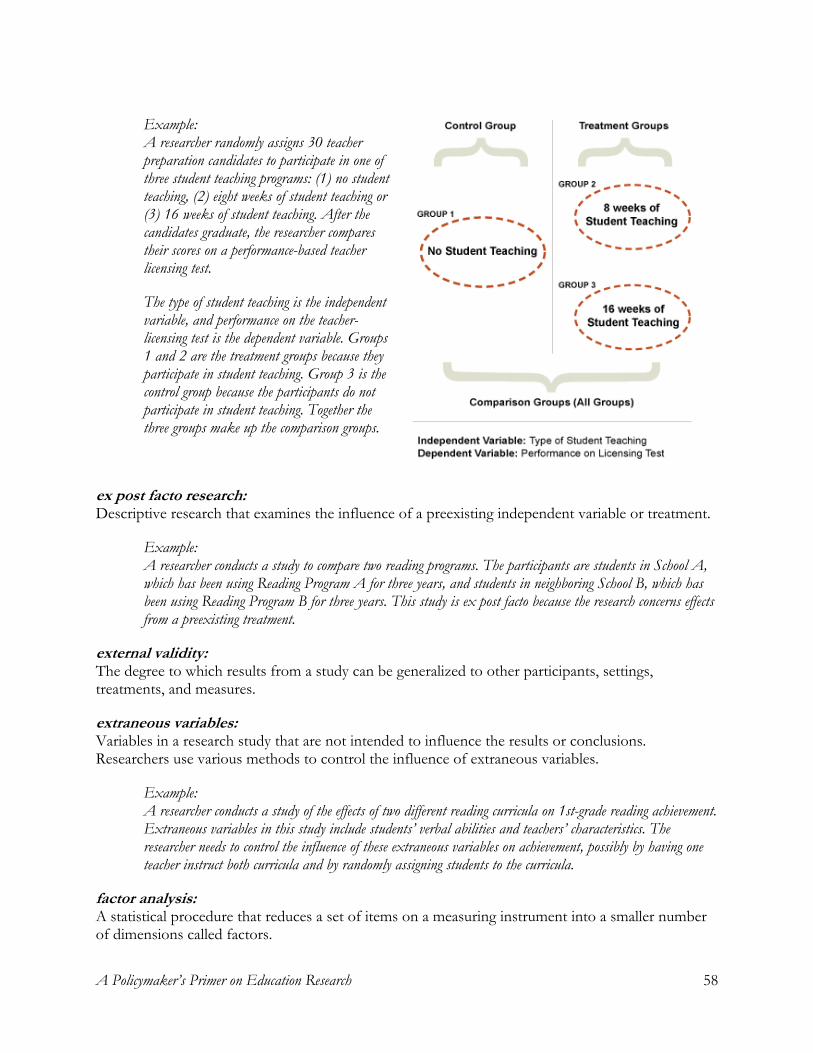
A Policymaker’s Primer on Education Research 58
Example: A researcher randomly assigns 30 teacher preparation candidates to participate in one of three student teaching programs: (1) no student teaching, (2) eight weeks of student teaching or (3) 16 weeks of student teaching. After the candidates graduate, the researcher compares their scores on a performance-based teacher licensing test.
The type of student teaching is the independent variable, and performance on the teacher-licensing test is the dependent variable. Groups 1 and 2 are the treatment groups because they participate in student teaching. Group 3 is the control group because the participants do not participate in student teaching. Together the three groups make up the comparison groups.
ex post facto research: Descriptive research that examines the influence of a preexisting independent variable or treatment.
Example: A researcher conducts a study to compare two reading programs. The participants are students in School A, which has been using Reading Program A for three years, and students in neighboring School B, which has been using Reading Program B for three years. This study is ex post facto because the research concerns effects from a preexisting treatment.
external validity: The degree to which results from a study can be generalized to other participants, settings, treatments, and measures.
extraneous variables: Variables in a research study that are not intended to influence the results or conclusions. Researchers use various methods to control the influence of extraneous variables.
Example: A researcher conducts a study of the effects of two different reading curricula on 1st-grade reading achievement. Extraneous variables in this study include students’ verbal abilities and teachers’ characteristics. The researcher needs to control the influence of these extraneous variables on achievement, possibly by having one teacher instruct both curricula and by randomly assigning students to the curricula.
factor analysis: A statistical procedure that reduces a set of items on a measuring instrument into a smaller number of dimensions called factors.
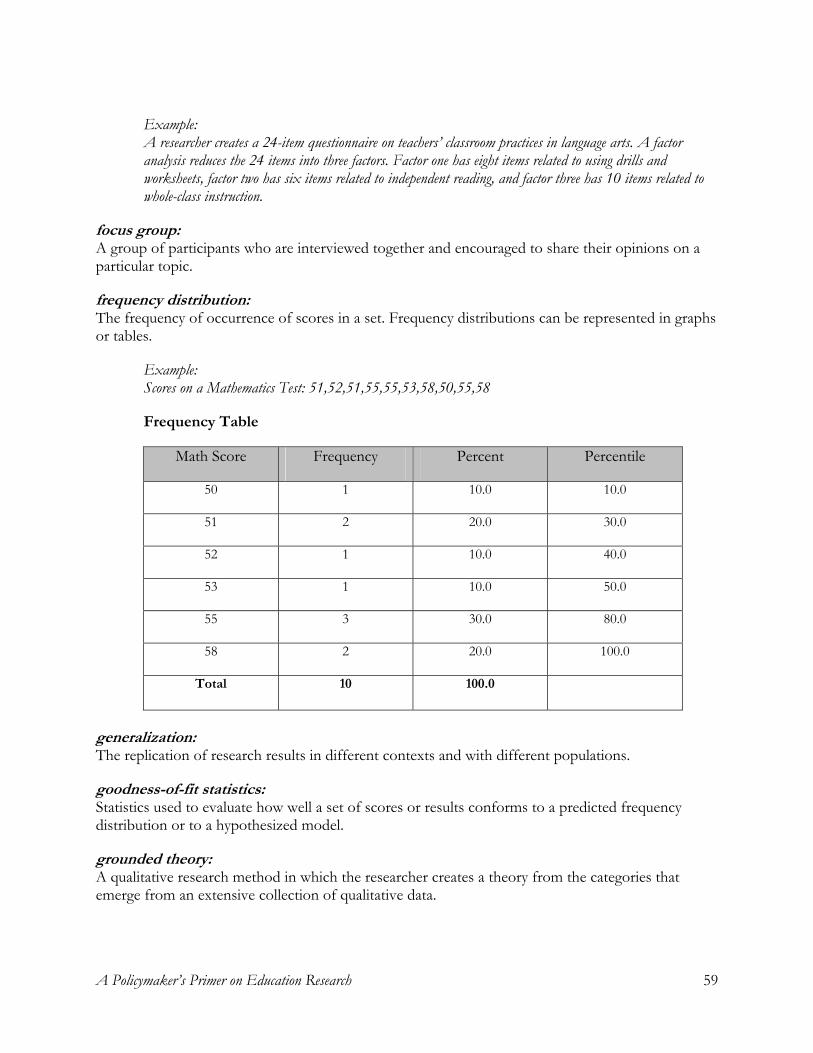
A Policymaker’s Primer on Education Research 59
Example: A researcher creates a 24-item questionnaire on teachers’ classroom practices in language arts. A factor analysis reduces the 24 items into three factors. Factor one has eight items related to using drills and worksheets, factor two has six items related to independent reading, and factor three has 10 items related to whole-class instruction.
focus group: A group of participants who are interviewed together and encouraged to share their opinions on a particular topic.
frequency distribution: The frequency of occurrence of scores in a set. Frequency distributions can be represented in graphs or tables.
Example: Scores on a Mathematics Test: 51,52,51,55,55,53,58,50,55,58
Frequency Table
MMaatthh SSccoorree FFrreeqquueennccyy PPeerrcceenntt PPeerrcceennttiillee
50 1 10.0 10.0
51 2 20.0 30.0
52 1 10.0 40.0
53 1 10.0 50.0
55 3 30.0 80.0
58 2 20.0 100.0
Total 10 100.0
generalization: The replication of research results in different contexts and with different populations.
goodness-of-fit statistics: Statistics used to evaluate how well a set of scores or results conforms to a predicted frequency distribution or to a hypothesized model.
grounded theory: A qualitative research method in which the researcher creates a theory from the categories that emerge from an extensive collection of qualitative data.

A Policymaker’s Primer on Education Research 60
hierarchical linear modeling (HLM): A statistical technique used to analyze data from participants who exist within different levels of a hierarchical structure.
Example: Student achievement data reflect influences from the family, classroom, grade, school, district, and state. Through HLM, the influences of these different levels on student achievement can be estimated.
history effect: A threat to the validity of research conclusions due to events that occur in the time between a pretest and a posttest. The longer the time span between a pretest and posttest, the more likely the occurrence of history effects.
Example: A researcher randomly assigns eight elementary schools to participate in Reform Model A and eight elementary schools to participate in Reform Model B. The researcher measures student achievement prior to implementation of the reform models (the pretest). After one school year, the researcher measures student achievement again (the posttest). Events that occur between the pretest and posttest can influence the results. For example, perhaps a large number of teachers in B schools enroll in graduate school, which improves their teaching.
hypothesis, null: A statement that an independent variable or treatment will have no effect. Researchers attempt to demonstrate through data that the null hypothesis is false.
hypothesis, research: A statement about the researcher’s expectations concerning the results of a study.
Example: Directional research hypothesis: A new standards-based mathematics curriculum will benefit elementary students at all grade levels.
Non-directional research hypothesis: A new standards-based mathematics curriculum will have different effects on elementary students depending on grade level.
independent variable: In experimental research, the variable that the researcher varies or manipulates to determine whether it has an effect on the dependent variable.
Example: As part of an experiment, a researcher randomly assigns teachers in a large elementary school to receive one of three types of professional development: (1) a class on instructional strategies, (2) a training program on how to increase student motivation, or (3) a teacher discussion group. The researcher measures the differences in achievement gains among the students of the three teachers. The independent variable is professional development.
inferential statistics: Statistics used to make inferences about a population based on the scores obtained from a sample.

A Policymaker’s Primer on Education Research 61
Inferential statistics are based on the mathematics of probability theory. Commonly used inferential statistics include t, F and Chi Square.
internal validity: The degree to which the conclusions of a research study are supported by evidence and can be trusted.
inter-rater reliability: The degree of agreement in the ratings that two or more observers assign to the same behavior or observation.
intervening variable: An unmeasured variable that is assumed to intervene between a treatment or independent variable and a behavior or dependent variable. Most intervening variables are internal and cannot be observed. Their existence is inferred based on external measures.
Example: Learning is an intervening variable because it cannot be observed but is assumed to occur between instruction and performance based on measures such as tests.
intervention: A procedure, technique or strategy that is designed to modify an ongoing process. In research studies, the intervention also is referred to as a treatment. Most interventions in education are designed to modify directly or indirectly the student-learning process.
interview: A data-collection method in which the researcher asks questions of individuals or groups and records the participants' answers. The interviewer usually asks the questions orally in a face-to-face interaction or over the telephone, but electronic interviews administered through e-mail also are possible.
interview protocol: The planned questions and accompanying probes asked during an interview. Structured interview protocols ask specific objective questions in a predetermined order. Unstructured interview protocols ask open-ended questions and the order depends on interviewees’ answers.
latent variable: An unobserved and unmeasured variable that is hypothesized to have an influence on a dependent variable. Latent variables can be analyzed through the statistical technique of structural equation modeling (SEM).
Likert Scale: A response scale in which participants respond to questionnaire items about their beliefs and attitudes by indicating varying degrees of intensity between two extremes such as like/dislike and agree/disagree.
A Policymaker’s Primer on Education Research 62
literature review: A comprehensive and systematic summary of past empirical research and/or evaluation studies on a specific topic. (Another term for a literature review is research synthesis.)
longitudinal research: A data-collection strategy in which data are collected from the same participants at different points in time. The purpose is to draw conclusions about individual change over time.
Example: A researcher studies the mathematics achievement of students who were taught a new standards-based mathematics curriculum when they were in 6th grade. The researcher compares students’ performances in mathematics achievement in grades 7, 8, and 9 to the performances of another group of students at each of those grade levels who were not taught the new curriculum in 6th grade. The purpose of the research is to determine whether change in mathematics performance over time is related the type of 6th-grade mathematics curriculum.
matching: A procedure used to select participants for comparison groups based on participant characteristics that are related to the dependent variable. Matching is frequently used in quasi-experimental studies when random assignment to groups is not feasible.
Example: A researcher assigns 15 teacher preparation candidates who have a seminar on Wednesdays to participate in eight weeks of student teaching. The researcher finds a group of 15 teacher preparation candidates who have a seminar on a different day and who are similar to the Wednesday group in the number and type of courses completed. The researcher assigns this second group of candidates to participate in 16 weeks of student teaching.
mean: In general, the average score in a set of scores or frequency distribution, calculated as the sum of the scores divided by the number of scores.
Example: The mean of the following set of five scores is 11: 9, 10, 10, 12, 14
median: The middle score in a set of scores or frequency distribution such that 50% of the scores are at or below the median score.
Example: The median of the following set of five scores is 10: 9, 10, 10, 12, 14.
member checking: A method used to verify the accuracy of data analyses in qualitative research by asking participants

A Policymaker’s Primer on Education Research 63
to review the findings and comment on the accuracy of the themes and categories that the researcher identified.
meta-analysis: A comprehensive, systematic, quantitative review of past empirical research studies on a specific topic. Most meta-analyses examine only quantitative studies. Effect-size statistics are calculated to produce an overall conclusion about the various studies on the topic.
Example: A researcher conducts a meta-analysis of computer-assisted instruction in reading. The researcher examines 40 studies and calculates an overall effect size of d = .25, indicating a small positive effect of computer-assisted instruction on reading achievement.
mixed methods: The use of both quantitative and qualitative data-collection strategies in the same study. By providing more and different types of information related to the same research question, this approach can increase the reliability and applicability of research conclusions.
mode: The most frequent score in a set of scores or a frequency distribution.
Example: The mode for the following set of five scores is 10: 9, 10, 10, 12, 14.
mortality: A threat to the validity of research conclusions due to the loss of participants from a study sample (also referred to as sample attrition).
multiple methods: The use of more than one research method in a single research study, such as an experimental research study that includes descriptive research to verify that a treatment was implemented correctly.
Example: A researcher conducts an eight-week study of the effects of cooperative learning on student achievement. The researcher randomly assigns half of a teacher’s students to participate in cooperative learning groups and the other half to participate in small-group instruction. To verify treatment implementation, the researcher conducts systematic observations of both the cooperative learning and the small-group instruction groups. This study uses both experimental and descriptive research methods.
multiple regression analysis: A statistical technique that determines the linear association between a set of predictor variables and a dependent variable and identifies the combination of predictor variables that best estimates the dependent variable (also referred to as the criterion variable).
Example: In School District X, a researcher collects data on beginning teachers’ scores on the state licensing test

A Policymaker’s Primer on Education Research 64
(predictor 1), the number of college courses in mathematics that each teacher completed (predictor 2), the amount of time spent in school-based field experiences prior to certification (predictor 3), and the achievement gains in mathematics by each teacher’s students (criterion variable). The researcher uses multiple regression statistics to measure the association between the three teacher variables and student achievement gains and to estimate student achievement gains based on the contribution of each of the teacher variables to that association.
N (n): The number of scores in a population (N) or a sample (n) of scores.
narrative descriptions: Verbal descriptions of the information obtained from qualitative research such as descriptions of interview results.
narrative review: A type of literature review in which research studies and their results are interpreted through narrative descriptions and qualitative comparisons.
normal curve: The bell-shaped curve that results from the graph of a normal frequency distribution.
normal curve equivalent (NCE) scores: Percentile scores from a normal frequency distribution that have been converted so there is an equal interval between each NCE score.
normal distribution: A symmetrical frequency distribution in which the scores form a bell-shaped curve, and the mean, median and mode have the same value, as shown in the figure to the right.
norm-referenced test: A test for which a score is interpreted by comparing it to the scores of a comparison or norming group of persons who took the test. The similarity of an individual to the persons in the comparison group influences the accuracy of interpretation.
Example: The SAT, which students take to gain admission to institutions of higher education, is a norm-referenced test. A score on the SAT is interpreted with reference to the scores of other students who took the test. A score of 500 on the SAT is considered average because that is the average score of the comparison or norming group of students.
observation: The collection of data by documenting the occurrence of events in a setting. Observation is a common method of data collection in qualitative research.
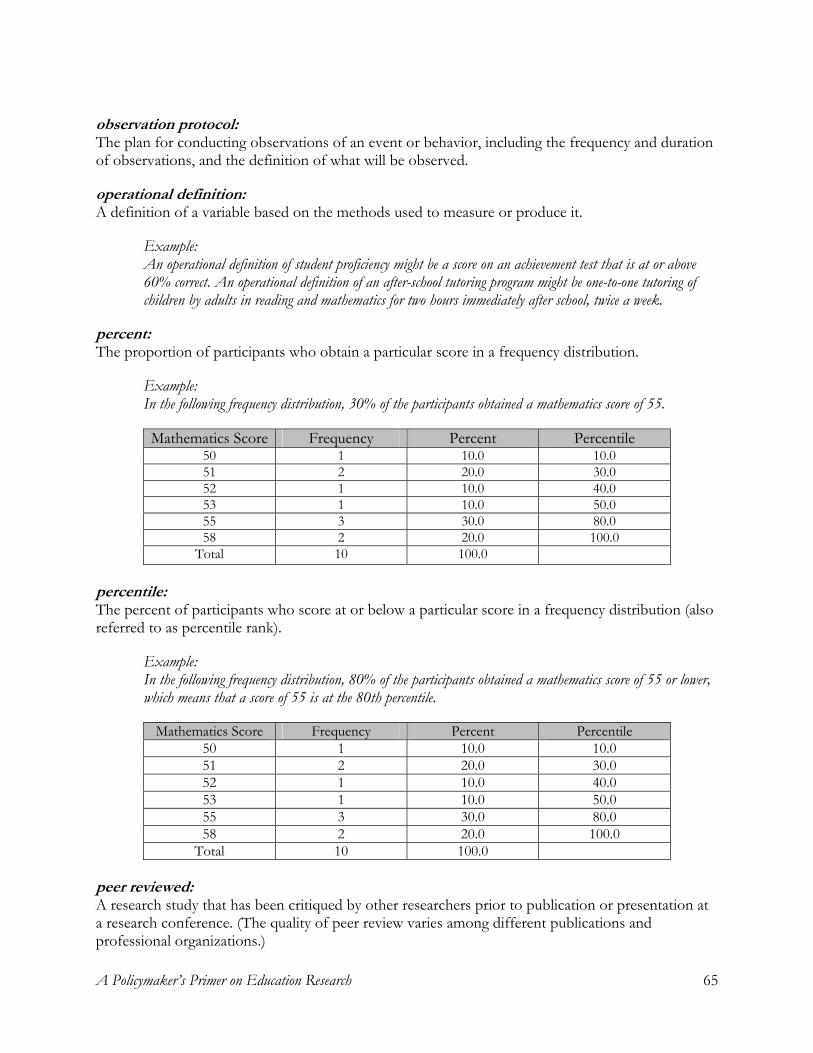
A Policymaker’s Primer on Education Research 65
observation protocol: The plan for conducting observations of an event or behavior, including the frequency and duration of observations, and the definition of what will be observed.
operational definition: A definition of a variable based on the methods used to measure or produce it.
Example: An operational definition of student proficiency might be a score on an achievement test that is at or above 60% correct. An operational definition of an after-school tutoring program might be one-to-one tutoring of children by adults in reading and mathematics for two hours immediately after school, twice a week.
percent: The proportion of participants who obtain a particular score in a frequency distribution.
Example: In the following frequency distribution, 30% of the participants obtained a mathematics score of 55.
MMaatthheemmaattiiccss SSccoorree FFrreeqquueennccyy PPeerrcceenntt PPeerrcceennttiillee 50 1 10.0 10.0 51 2 20.0 30.0 52 1 10.0 40.0 53 1 10.0 50.0 55 3 30.0 80.0 58 2 20.0 100.0
Total 10 100.0 percentile: The percent of participants who score at or below a particular score in a frequency distribution (also referred to as percentile rank).
Example: In the following frequency distribution, 80% of the participants obtained a mathematics score of 55 or lower, which means that a score of 55 is at the 80th percentile.
MMaatthheemmaattiiccss SSccoorree FFrreeqquueennccyy PPeerrcceenntt PPeerrcceennttiillee 50 1 10.0 10.0 51 2 20.0 30.0 52 1 10.0 40.0 53 1 10.0 50.0 55 3 30.0 80.0 58 2 20.0 100.0
Total 10 100.0 peer reviewed: A research study that has been critiqued by other researchers prior to publication or presentation at a research conference. (The quality of peer review varies among different publications and professional organizations.)

A Policymaker’s Primer on Education Research 66
phenomenological study: A qualitative research method in which the researcher conducts an in-depth and extensive study of participants’ experiences of an event or situation from the participants’ perspectives.
pilot test: A trial run of all or some parts of a research study. Researchers often pilot test their data-collection procedures and instruments.
population: All individuals or entities belonging to the group that is being studied.
Example: Examples of populations are all elementary school teachers in the United States, all schools in the Midwest, all 4th-grade students in Colorado, and all high school teachers in School District X.
practical significance: The degree to which a practice, program or policy has enough of an effect to justify its adoption. Practical significance usually is measured with statistics that calculate effect sizes.
predictor variable: The variable in a regression analysis used to predict the value of a dependent variable.
pretest-posttest research: Research in which participants take a pretest that measures the dependent variable prior to the administration of a treatment and a posttest that measures the dependent variable after the treatment is completed. The most valid approach to implementing pretest-posttest research is to randomly assign participants to two or more groups, one of which receives the treatment. The pretest-posttest difference scores are then compared for the groups.
Example: A researcher randomly assigns middle school students to participate in either an inquiry-based science unit or a traditional science unit. The students complete a test on problem solving before and after the unit. Because the problem-solving skills of the students in the inquiry-based group improved more than those of the students in the traditional group, the researcher concludes that inquiry-based units facilitate problem-solving skills.
primary source: A report on an original research study, usually written by the researcher(s), which includes details about the method and results.
procedure: The specific steps that are taken to implement a research study.
professional wisdom: The judgment that individuals acquire through experience, including the ability to incorporate local circumstances into practices and policies.

A Policymaker’s Primer on Education Research 67
proxy: A measure used to approximate the data sought when it is difficult to obtain a more precise measure due to constraints involving data collection or time.
Example: Average passing rate on state licensing tests by teacher candidates is a proxy measure for the quality of teacher preparation delivered by teacher education institutions.
purposive sample: A sample of participants selected for a research or evaluation study based on the information that they can provide related to the study.
Example: A researcher conducts case studies of four teacher preparation programs that received recognition for their effectiveness in preparing teacher candidates. The sample is purposive because the programs were chosen based on their recognition.
qualitative data: Narrative descriptions or observations.
qualitative research: Research in which the data are narrative descriptions or observations. In most qualitative research, there is an emphasis on the influence of context.
Example: A researcher observes how teachers deliver instruction related to different reading curricula in two different schools. The researcher also interviews the teachers to understand their approaches to the different curricula and how their approaches might be influenced by school characteristics.
quantitative data: Numbers and measurements.
quantitative research: Research in which the data are numbers and measurements. In quantitative research, there is an emphasis on control of the variables in the study.
Example: A researcher randomly assigns students to different reading curricula. At the end of the school year, the researcher examines the students’ scores on a reading achievement test to determine whether the different curricula had different effects on reading.
quasi-experimental research design: A research design in which (1) an independent variable is manipulated to measure its effects on a dependent variable, and (2) participants are not randomly assigned to comparison groups.
Example: A researcher assigns 15 teacher preparation candidates who have a seminar on Wednesdays to participate in eight weeks of student teaching. The researcher assigns 15 teacher preparation candidates who have a seminar

A Policymaker’s Primer on Education Research 68
on Tuesdays to participate in 16 weeks of student teaching. After the candidates graduate, the researcher compares their scores on a performance-based teacher-licensing test. The amount of student teaching is the independent variable, and candidate performance on the teacher-licensing test is the dependent variable. The researcher does not randomly assign candidates to the comparison groups. As a result, differences between the groups’ performance on the test could be due to the amount of student teaching or due to other characteristics of the teacher candidates. The researcher should demonstrate that the candidates in the two groups do not differ in characteristics that are related to teaching performance.
random assignment: The assignment of participants to comparison groups using chance procedures so that every participant has the same probability of being selected to a group.
random sample: A sample that is randomly drawn from a population so that each member of the population has an equal probability of being chosen for the sample
randomized trials: A “true experimental” research design in which (1) an independent variable is directly manipulated to measure its effect on a dependent variable (i.e., the treatment trial), and (2) participants are randomly assigned to different groups that receive different amounts of the independent variable (i.e., the treatment). (Also referred to as randomized field trials and randomized controlled trials.)
range: The difference between the highest and lowest score in a set of scores or frequency distribution.
Example: The range for the following set of five scores is 5: 9, 10, 10, 12, 14.
raw score: An original score on a test or other measuring instrument prior to any score transformations.
reactive measure: A measure toward which a participant is likely to react due to interactions with the researcher or the participant’s assumption that certain responses are desirable.
Example: Interview questions are reactive measures because participants respond to actions by the interviewer that indicate approval or disapproval of their answers.
regression analysis: A statistical technique that uses the relationship between two variables, X and Y, to predict the value of X based on observations of Y.
regression toward the mean: The tendency for extreme scores to move toward the average or mean score when a test or other measure is repeated. Regression effects threaten the validity of research conclusions in studies in which participants are chosen because of their extreme scores on a measure.

A Policymaker’s Primer on Education Research 69
Example: Researchers often study schools in which students have extremely low achievement scores. If these students improve their achievement following a treatment or intervention, the improvement could be due to regression effects instead of treatment effects. In such studies, it is important to have comparison schools of students who also have extremely low achievement scores but who do not receive the treatment.
reliability (of a measuring instrument): The extent to which a measuring instrument produces consistent results when it is administered again under similar conditions.
Example: A reading test is reliable if students obtain similar scores when they take alternate but equivalent forms of the test within a short time span.
reliability coefficient: A correlation coefficient that indicates the degree of relationship between two sets of scores that result from persons taking a test again under similar conditions. Reliability coefficients also indicate the degree of relationship among a set of items on a questionnaire or test.
Example: A test-retest reliability coefficient of .91 for a mathematics achievement test indicates that the test produces consistent results. A reliability coefficient of .51 for the internal consistency of an attitude questionnaire indicates that the questionnaire items have only a moderate relationship to one another.
repeated measures: A research study in which participants are measured two more times on the same dependent variable.
Example: A researcher conducts a study of the effects of an inquiry-based science unit on students’ problem-solving skills. The researcher tests the students three times in the month following the unit to examine the duration of the effects.
replicate: To repeat a research study using the same method and similar participants. A successful replication obtains the same results as the original study.
representative sample: A subset of a population used in a research study whose characteristics are generally reflective of the characteristics of the larger population that the sample is taken to represent. If a sample is not representative of the larger population, then any conclusions based on the sample might not hold for the larger population.
Example: To find out whether senior boys in a high school have different academic interests than senior girls, a researcher interviews 10% of the senior boys and girls. If this 10% does not have roughly the same proportion

A Policymaker’s Primer on Education Research 70
of white and minority students as the entire class, however, any conclusions the researcher draws from the sample might not reflect the interests of all of the senior boys and girls.
research design: The plan for how data will be collected in a research study. The research design should be appropriate for the research question that the study addresses. Research designs include simple descriptive, comparative descriptive, correlational, experimental and quasi-experimental.
research ethics: The system of moral values established for the conduct of research and codified by professional associations and the United States Federal Government.
research method: In a research report, the details on how a research study was conducted, including the research design, the data-collection instruments, and the procedure.
research problem: The purpose of the research study, usually described in more general terms than research questions.
Example: A researcher conducts a study of a new standards-based mathematics curriculum to determine whether the curriculum benefits students at different grade levels differently. The research problem is whether the new mathematics curriculum has different effects at different grade levels.
research question: The question that a research study is designed to answer. Research questions include: What is happening? How is it happening? Why is it happening? Is something causing an effect?
research synthesis: A comprehensive and systematic summary and review of past empirical research and/or evaluation studies on a specific topic. (Another term for a research synthesis is literature review.) Research syntheses can be quantitative or qualitative. Meta-analysis is the term used for a quantitative synthesis, and narrative review is the term used for a qualitative synthesis.
researcher bias: Errors in the results of a research or evaluation study due to influences from the researcher’s or evaluator’s expectancies concerning study outcomes.
Example: A curriculum developer designs a new mathematics program for middle school students. If the developer conducts research on the effectiveness of the curriculum, the developer’s expectancies could produce a positive bias in the results. To avoid researcher bias, persons and agencies that are external and independent from program developers should conduct the research.
response rate: The proportion of participants in a study who respond to a data-collection instrument; typically refers to the number of persons who complete and return a mailed questionnaire.

A Policymaker’s Primer on Education Research 71
rival explanation: An alternate explanation for research results that rivals the researcher’s conclusions.
Example: A researcher randomly assigns eight elementary schools to participate in Reform Model A and eight elementary schools to participate in Reform Model B. The researcher measures student achievement prior to implementation of the reform models (the pretest). After one school year, the researcher measures student achievement again (the posttest). Because the students in the schools that used Reform Model B experienced achievement gains that were significantly higher than the students in schools that used Reform Model A, the researcher concludes that Model B caused greater achievement gains. The main rival explanation is that events that occurred between the pretest and posttest could have influenced the results. For example, perhaps a large number of teachers in Model B schools enrolled in graduate school, which improved their teaching. The researcher should demonstrate that historical events did not influence the results for either of the comparison groups.
sample: A subset of individuals or entities from a population.
Example: For the population of all 4th-grade students in Kansas, the 4th-grade students in the eastern half of the state would constitute a sample of the population (but not a random sample).
sample attrition: A threat to the validity of research conclusions due to the loss of participants from a study sample (also referred to as mortality).
Example: A researcher conducts a study of an after-school reading program on achievement gains. Twenty percent of the children drop out of the program. Conclusions about the effectiveness of the program are threatened by sample attrition because the students who remained could have special characteristics, for example, more motivation than those who left. Program effectiveness could be due to these individual characteristics and not the program characteristics.
sample size: The number of participants (e.g., students) or entities (e.g., schools) in a study sample. Large samples are preferred because, if randomly selected, they are more representative of the population than small samples.
scaled questionnaire: A data-collection instrument that gathers information about participants’ attitudes or beliefs concerning a particular topic based on the degree of intensity that they indicate in their responses. (Also called an attitude scale.)
Example: A scaled questionnaire on high school students’ attitudes toward school might include a response scale and items such as the following: Response Scale – Strongly Disagree, Disagree, Agree, Strongly Agree;

A Policymaker’s Primer on Education Research 72
Item 1 – Teachers at my school are happy that I am in their classes; Item 2 – I look forward to attending school each day.
scientifically-based research: According to the No Child Left Behind Act, research that is rigorous, systematic, objective, empirical, peer reviewed, and relies on multiple measurements and observations, preferably through experimental or quasi-experimental methods. According to the National Research Council (2000), six principles underlie all scientific research:
• Pose significant questions that can be investigated empirically
• Link research to relevant theory
• Use methods that permit direct investigation of the question
• Provide a coherent and explicit chain of reasoning
• Replicate and generalize across studies
• Disclose research to encourage professional scrutiny and critique.
secondary source: A description and/or summary of one or more prior research studies.
selection bias: Systematic effects on the dependent variable that occur due to characteristics of the study participants.
Example: A researcher conducts a study on the influence of student teaching on teaching performance. The researcher assigns 20 teacher preparation candidates who attend college during the day to participate in 16 weeks of student teaching. The researcher assigns 20 candidates who are night students to eight weeks of student teaching. Selection bias in this study is likely because the characteristics of day and night students, such as age and motivation, might be different. The results could be due to these differences instead of the amount of student teaching.
simple descriptive research design: A research design in which data are collected to describe persons, organizations, settings or phenomena.
Example: A researcher surveys administrators of 10 alternative teacher preparation programs in order to describe the characteristics of the different programs.
standard deviation: A measure of the variability of the scores in a set of scores or a frequency distribution, equivalent to the average distance of the scores from the mean.
Example: The mean for the following set of five score is 11 and the standard deviation is 2:
A Policymaker’s Primer on Education Research 73
9, 10, 10, 12, 14. The scores vary on average about two points from the mean. For the following set of five scores, the mean is 10 and the standard deviation is 0: 10, 10, 10, 10, 10. There is no variation among the scores.
standard error of estimate: In a graph of the relationship between two variables, a measure equivalent to the average distance between the actual data points and the regression line.
standard score: A score that transforms an original or raw score into standard deviation units in order to locate the score’s position within a frequency distribution. Standard scores also are known as z-scores and are calculated as: z = Raw Score – Mean /Standard Deviation. The sign of a standard score (plus or minus) indicates whether it is above or below the mean.
Example: For the following set of five scores, the mean is 11 and the standard deviation is 2: 9, 10, 10, 12, 14. The score of 12 has a standard score of +.50. The score of 9 has a standard score of –1.00.
standardized test: A test that has standard items and standard procedures for administration and scoring. Standardized tests are prepared by commercial test developers who establish the validity and reliability of the tests.
Example: The tests that are administered as part of the National Assessment of Educational Progress (NAEP) are standardized tests (see http://nces.ed.gov/nationsreportcard/).
statistical control: The use of statistics to isolate the effects of an extraneous variable on the dependent variable in a research study.
Example: A researcher conducts a correlational study of the relationship of student achievement in mathematics to the amount of time spent on whole-class instruction. To statistically control for the influence of students’ prior achievement, the researcher uses a multiple regression analysis in which the predictor variables are prior achievement and instructional time, making it possible to estimate the separate effects of each variable on student mathematics achievement, the dependent variable.
statistical power: The likelihood that an inferential statistical test (e.g., t-test, Analysis of Variance) will detect a statistically significant result when an actual treatment effect exists. The power of a statistical test increases as the sample size increases.
statistically significant: A result that has a low probability (e.g., 5 %) of occurring by chance. Because it is unlikely that a
A Policymaker’s Primer on Education Research 74
statistically significant result has occurred by chance, the result is said to reflect non-chance factors in the study, such as the effects of a treatment.
statistics: Methods and rules for organizing and interpreting quantitative observations.
stratified random sample: A sample of research participants that is randomly selected from different groups or strata in the population. The groups are defined based on one or more characteristics that might influence research results.
Example: In a study of the influence of state standards on mathematics achievement, a researcher divides the state’s population of middle school students into males and females. The researcher randomly selects participants for the study from within each group. The proportion of male and female participants selected for the sample reflects the proportion of males and females in the middle school student population.
structural equation modeling (SEM): A statistical technique that tests a hypothesized network of linear relationships between observed and unobserved variables (also called latent variables).
Example: A researcher hypothesizes that teachers’ years of experience and their perceptions of school culture influence how much they learn from staff development, which in turn influences student achievement. Teacher experience, perceptions of school culture, and student achievement are observed variables, and teacher learning is an unobserved or latent variable. The researcher uses SEM to test whether the hypothesized model is supported by the data that the researcher collects on the observed variables.
subjects: The participants whose behavior is examined in a research study.
survey: A data-collection method in which participants provide information through self-report on questionnaires or in interviews.
test: A data-collection instrument that gathers information about participants’ knowledge and skills related to a particular topic based on their responses to a standard set of questions.
theory: A set of interrelated principles proposed as an explanation for phenomena or observations (also referred to as a conceptual framework).
Example: Freud’s theory of personality and Piaget’s theory of child development are examples of social science theories. An example of a conceptual framework is an explanation of teacher professional development - in which teacher learning influences instruction, which in turn influences student achievement.

A Policymaker’s Primer on Education Research 75
threats to validity: Specific factors in a research study that threaten the validity or accuracy of research conclusions. (Also referred to as rival explanations.)
Example: The loss of participants from the treatment or control group is a threat to validity because those who remain in the study could be different from those who left. Also, if more participants leave one group than the other, then the two groups are no longer equivalent in non-treatment characteristics.
treatment: The program, policy or practice that is being studied through research or evaluation. Treatments are often interventions of some type such as a special reading program for low-achieving students. In an experimental research study, the treatment is the independent variable.
treatment diffusion: The adoption of elements of the treatment in a research study by the participants who are in a control or a comparison group. Treatment diffusion (also called treatment spillover) threatens the validity of a conclusion that a treatment has no effect because both groups of participants experience the treatment.
Example: A researcher randomly assigns teachers in an elementary school either to participate in weekly professional development on integrating technology (the treatment group) with instruction or to have an extra weekly planning time (the control group). Treatment diffusion is likely because treatment teachers can discuss the new techniques they are learning with control teachers, who then might adopt these techniques.
treatment fidelity: The degree to which the treatment (e.g., a program or intervention) in a research or evaluation study is implemented as planned or intended.
treatment group: The group of participants in an experiment who receive some amount of the independent variable (i.e., the program, policy or practice being studied).
triangulation: Comparison of results obtained from the use of multiple research methods and/or data-collection strategies in a single study.
Example: A researcher randomly assigns half of the students in an after-school program to receive tutoring in reading and the other half to participate in a physical education class. The researcher examines students’ gains in reading achievement and also interviews the students in each group about the effects of the after-school activity. The interview data are used to confirm the information about the effects of the after-school program obtained from the achievement data.
t-test: A statistical technique used to make inferences about a population of study participants based on a

A Policymaker’s Primer on Education Research 76
sample of these participants or to test for statistically significant differences between two different groups of observations.
validity (of a measuring instrument): The degree to which an instrument measures what it is designed to measure and the degree to which it is used appropriately.
Example: A valid test of mathematics should measure mathematics knowledge or skills and should be correlated with other measures of mathematics ability. A valid use of this test is to make inferences about knowledge of mathematics, but using the test to make inferences about reading skills would be invalid.
validity (of a research study): The degree to which the conclusions of a research study are supported by evidence and can be trusted (also referred to as internal validity).
variability: The amount of differences among scores in a distribution (i.e., a set of scores); the degree to which the scores are spread out or are clustered together. When all of the scores in a distribution are the same, there is no variability among the scores.
variable: A characteristic or quantity that can change and have different values.
Example: Variables studied in education include characteristics of students (e.g., achievement), teachers (e.g., certification), schools (e.g., curriculum), districts (e.g., leadership), teacher preparation programs (e.g., accreditation), and states (e.g., education funding).
verification methods: Methods used in qualitative research to confirm the validity and reliability of the data coding and analyses.
A Policymaker’s Primer on Education Research 77
References and Resources
Cooper, H. (1998). Synthesizing research: A guide for literature reviews (3rd ed.). Thousand Oaks, CA: Sage Publications.
Creswell, J.W. (2002). Research design: Qualitative, quantitative and mixed method approaches. Thousand Oaks, CA: Sage Publications.
Isaac S. & Michael, W. B. (1995). Handbook in research and evaluation (3rd ed.). San Diego: EdITS.
Gravetter, F. J. and Wallnau, L. B. (1988). Statistics for the behavioral sciences (2nd ed.). St. Paul: West Publishing.
McMillan, J. H. (2000). Educational research: Fundamentals for the consumer (3rd ed.). New York: Addison Wesley Longman.
Shadish, W. R., Cook, T.D. and Campbell, D. T. (2002). Experimental and quasi-experimental designs for causal inference. Boston: Houghton Mifflin.
Shanahan, T. (2000). "Research synthesis: Making sense of the accumulation of knowledge in reading." In M. L. Kamil, P .B. Mosenthal, P. D. Pearson, and R. Barr (Eds.), Handbook of reading research, volume III (pp. 209–226). Mahwah, NJ: Lawrence Erlbaum and Associates
Weiss, C. H. (1998). Evaluation: Methods for studying programs and policies (2nd ed.). Upper Saddle River, NJ: Prentice Hall.
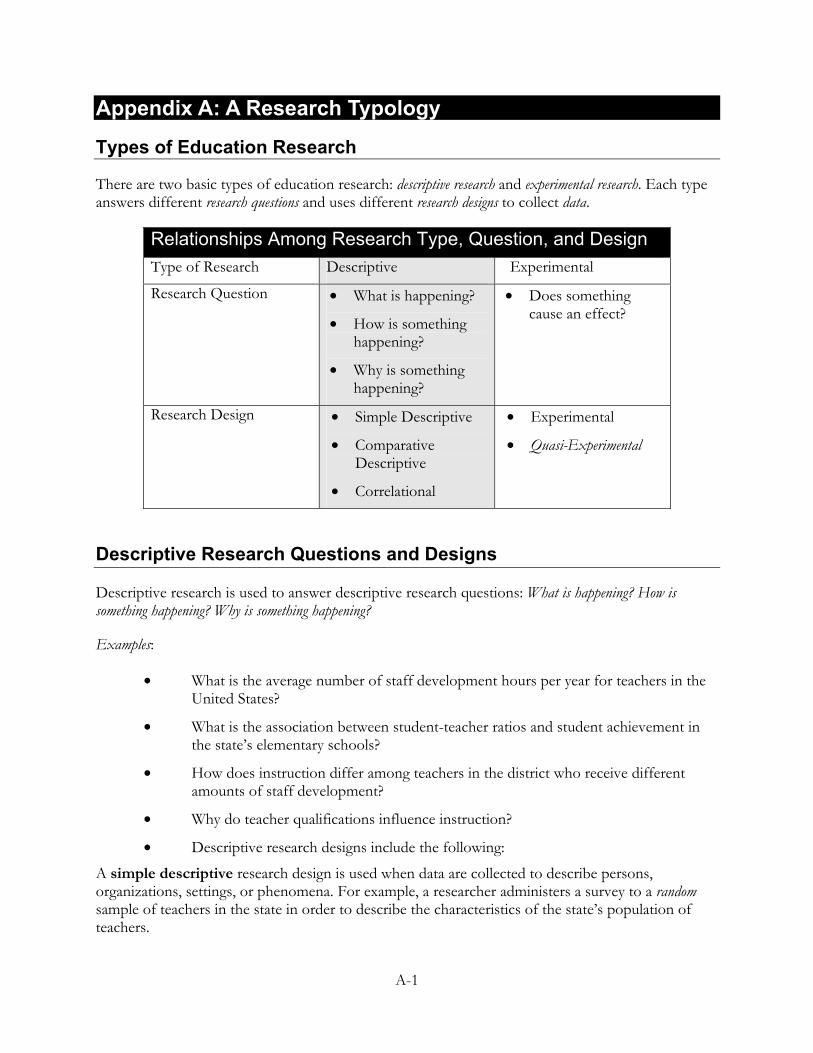
A-1
Appendix A: A Research Typology
Types of Education Research
There are two basic types of education research: descriptive research and experimental research. Each type answers different research questions and uses different research designs to collect data.
Relationships Among Research Type, Question, and Design Type of Research Descriptive Experimental
Research Question • What is happening?
• How is something happening?
• Why is something happening?
• Does something cause an effect?
Research Design • Simple Descriptive
• Comparative Descriptive
• Correlational
• Experimental
• Quasi-Experimental
Descriptive Research Questions and Designs
Descriptive research is used to answer descriptive research questions: What is happening? How is something happening? Why is something happening?
Examples:
• What is the average number of staff development hours per year for teachers in the United States?
• What is the association between student-teacher ratios and student achievement in the state’s elementary schools?
• How does instruction differ among teachers in the district who receive different amounts of staff development?
• Why do teacher qualifications influence instruction?
• Descriptive research designs include the following:
A simple descriptive research design is used when data are collected to describe persons, organizations, settings, or phenomena. For example, a researcher administers a survey to a random sample of teachers in the state in order to describe the characteristics of the state’s population of teachers.

A-2
With a comparative descriptive design, the researcher describes two or more groups of participants. For example, a researcher administers a questionnaire to three groups of teachers about their classroom practices. The researcher chooses the three schools because the schools vary in terms of the amount of professional development that they provide to teachers.
A correlational research design is used to describe the statistical association between two or more variables. For example, a researcher measures the student-teacher ratio in each classroom in a school district and measures the average student achievement on the state assessment in each of these same classrooms. Next the researcher uses statistical techniques to measure whether the student-teacher ratio and student achievement in the school district are connected numerically; for example, when the student-teacher ratio changes in value, so does student achievement. The researcher can then use the student-teacher ratio to predict student achievement, a technique called regression analysis. When there is more than one predictor variable, the technique of multiple regression analysis produces a multiple correlation that is used for prediction.
Experimental Research Questions and Designs
Experimental research is used to answer causal research questions: Does something cause an effect? For example, does a low student-teacher ratio cause higher student achievement?
Experimental research designs include the following:
• True experimental (randomized trials)
• Quasi-experimental In experimental research, the researcher manipulates or varies an independent variable and measures its effects on one or more dependent variables. In a true experimental design, the researcher randomly assigns the participants who are being studied (also called the subjects) to two or more comparison groups. Sometimes the comparison groups are referred to as treatment and control groups. Participants in the treatment group receive some type of treatment, such as a special reading program. Participants in the control group do not receive the treatment.
For example, at the beginning of a school year, a researcher randomly assigns all classes in a school district to have either a low student-teacher ratio (small class, the treatment group) or a normal student-teacher ratio (large class, the control group). At the end of the school year, the researcher measures each student’s achievement using the state assessment and compares the average achievement of students in the two sizes of classes. In this example, class size is the independent variable because class size is being varied or manipulated. Student achievement is the dependent variable because student achievement is being measured. (Note: Researchers conducted a similar experiment in the state of Tennessee starting in 1985. The study is known as Project STAR.)
In a quasi-experimental design, the researcher does not randomly assign participants to comparison groups, usually because random assignment is not feasible. To improve a quasi-experimental design, the researcher can match the comparison groups on characteristics that relate to the dependent variable. For example, a researcher selects from a school district 10 classes to have low student-teacher ratios and 10 classes to maintain their current high student-teacher ratios. The researcher
A-3
selects the high-ratio classes based on their similarity to the low-ratio classes in terms of student socioeconomic status, a variable that is related to student achievement.
For a more in-depth discussion of experimental research, refer to the publication Identifying and Implementing Educational Practices Supported by Rigorous Evidence: A User Friendly Guide, recently released by the U.S. Department of Education’s Institute of Education Sciences. The publication can be viewed on the Web at http://www.ed.gov/rschstat/research/pubs/rigorousevid/index.html or downloaded at http://www.ed.gov/rschstat/research/pubs/rigorousevid/rigorousevid.pdf.
Data and Data-collection Strategies
Types of Data: Quantitative and Qualitative In quantitative research, the data are numbers and measurements; in qualitative research, the data are narrative descriptions and observations. Other differences are that qualitative research occurs in more natural and less controlled research settings than does quantitative research, and qualitative research often uses special methods to collect data, such as case study and ethnography. These methods reflect the philosophy of qualitative research, which emphasizes in-depth descriptions of persons, behaviors and contexts.
With regard to research designs, correlational, experimental and quasi-experimental designs usually collect quantitative data. Simple descriptive and comparative descriptive designs collect either type of data. When both quantitative and qualitative data are collected in the same study, the approach is called mixed methods.
Data-Collection Strategies: Longitudinal and Cross-Sectional Longitudinal and cross-sectional are data-collection strategies that can be used with either descriptive or experimental research designs.
Example of a descriptive longitudinal research study: A researcher studies the relationship between the average class size that each student experienced in grade 2 and each student’s achievement in grades 2, 4, and 6. The purpose is to determine whether the relationship between class size and achievement remains the same or changes over four school years. In longitudinal studies, the emphasis is on individual change over time.
Example of an experimental cross-sectional research study: A researcher randomly assigns 2nd graders, 4th graders, and 6th graders to classes that are either small or large in size. The purpose is to determine at the end of the school year whether the difference in student achievement between small and large classes varies depending on the grade levels of the students. In cross-sectional studies, the emphasis is on differences between groups at one point in time.

A-4
References and Resources
Creswell, J. W. (2002). Research design: Qualitative, quantitative, and mixed method approaches. Thousand Oaks: Sage Publications.
Institute of Education Sciences. Identifying and implementing educational practices supported by rigorous evidence: A user friendly guide. Washington, DC: U.S. Department of Education.
McMillan, J. H. (2000). Educational research: Fundamentals for the consumer (3rd ed.). New York: Addison Wesley Longman.
National Research Council. (2002). Scientific research in education. Committee on Scientific Principles for Education Research. Shavelson, R. J., and Towne, L., Editors. Center for Education. Division of Behavioral and Social Sciences and Education. Washington, DC: National Academy Press.

B-1
Appendix B: NRC’s Principles of Scientific Research
The NRC Principles
Is education research scientific? Can education research be scientific? According to the 2002 National Research Council (NRC) report Scientific Research in Education, science is the same in all fields of study, whether it is chemistry, economics or education. What determines the scientific quality of a research study is the degree to which the study follows the principles that underlie science. The NRC identified six guiding principles for scientific research. The actual principles are quoted here verbatim from the NRC; the further elaboration of each principle paraphrases NRC’s discussion of the principles and includes explanatory text that is original to this Primer.
Principle 1: Pose significant questions that can be investigated empirically. Empirical research involves investigation that uses observations to guide conclusions. Research questions that are significant do one or more of the following:
• Fill in the gaps in what we know about a topic.
• Seek to identify why something occurs.
• Solve a practical problem.
• Test a new idea or hypothesis.
• Expand on scientific knowledge from prior theories and research.
Principle 2: Link research to relevant theory. Theories vary in scope; the more well-known scientific theories tend to be broad such as Einstein’s theory of relativity. Theories that are smaller in scope, sometimes referred to as conceptual frameworks, guide most research studies, particularly in the social sciences and education. Nonetheless, such theories provide the reason for the research design and interpretation of the findings. For example, the theory behind teacher professional development is that teacher learning influences instruction, which in turn influence student achievement. This theory is relatively small in scope because it applies only to teacher learning, in contrast to a theory such as Piaget’s, which applies to child and adolescent development. Theories that are small in scope however, can provide the rationale for scientific research.
Principle 3: Use methods that permit direct investigation of the question. This principle means that the research method should be appropriate to the research question. The appropriateness of one method over another is the subject of debate. This is particularly true in the social sciences where research studies usually involve human subjects. Principle 3 however, does not focus on a particular research method. Rather, it emphasizes that a report on a research study should indicate the following:
• The link between the research question and the method used and why the method is the most appropriate.
• A detailed description of the method and procedure so that other researchers can repeat the study.

B-2
• Possible problems or limitations with the research method.
As Principle 1 indicates, science involves the measurement of observations. In social science research, this means that human behavior will be observed, measured and recorded. The method used to measure observations is critical because errors in measurement can influence the results.
For this reason, research studies should report on the validity and reliability of the measuring instruments that are used.
Principle 4: Provide a coherent and explicit chain of reasoning. Conclusions about the results of research are based on inferential reasoning. This means that researchers make logical judgments based on the results of their research and on conclusions from prior research. The logic of their judgments depends on their research questions and the methods they used. An important part of this logical reasoning is to rule out alternate or rival explanations, also referred to as threats to validity. To counter such threats, researchers need to indicate in their studies how they avoided or controlled for such errors.
Principle 5: Replicate and generalize across studies. Replication means that a researcher who uses the same study method in the same situations or contexts as another researcher can make the same observations and obtain the same results. (Alternatively, the same researcher can obtain the same results on two different occasions.) Generalization refers to how much the results can be replicated in different contexts and with different populations. When the results of a study can be replicated and generalized, the results can be trusted more than results from studies without these characteristics. Usually, many research studies are needed to produce a body of knowledge that provides this information.
Principle 6: Disclose research to encourage professional scrutiny and critique. Through this principle, the National Research Council emphasizes that the accumulation of scientific knowledge depends on its dissemination to members of the scientific community for professional critique. Researchers should submit their reports to journals and publications that require peer review. Presentations on research at professional conferences also provide the opportunity for critique. To facilitate scrutiny, researchers should keep accurate and accessible records of their investigations so they can provide information for review purposes. For education research to advance, the community of education researchers must enforce the norms of scientific research when judging education research studies.

B-3
Guiding Questions
To determine whether an education research study is following scientific principles, ask the following questions about the study:
Scientific Principle 1. Pose significant questions that can be investigated empirically. Guiding Questions
• What is the research question? • Will answering the research question provide new knowledge or solve a problem? • Is it possible to answer the research question through observations of some type? Scientific Principle 2. Link research to relevant theory. Guiding Questions
• What theory or framework is being used to answer the research question? • What is the relationship between the theory or framework and the way that the study is being conducted? Scientific Principle 3. Use methods that permit direct investigation of the question. Guiding Questions
• What methods were used to conduct the study? • Does the study indicate how the method is appropriate for the research question? • Is there detailed information on how the method was carried out so other researchers can repeat the
study? • Does the study report on the validity and reliability of the measuring instruments? • Does the study describe potential problems with the method used? Scientific Principle 4. Provide a coherent and explicit chain of reasoning. Guiding Questions
• Does the study rule out explanations for the results other than the explanation given by the researcher? • Does the study demonstrate how errors or threats to the validity of the results were avoided? Scientific Principle 5. Replicate and generalize across studies. Guiding Questions
• Is there sufficient information to repeat the study? • Are there other studies that have found similar results but in different settings or with different
participants? • What additional research is needed to extend and generalize the results of the study? Scientific Principle 6. Disclose research to encourage professional scrutiny and critique. Guiding Questions
• Where has the study been published? • Has the study been reviewed by other education researchers?

B-4
Reference and Resources
National Research Council. (2002). Scientific research in education. Committee on Scientific Principles for Education Research. Shavelson, R. J., and Towne, L., Editors. Center for Education. Division of Behavioral and Social Sciences and Education. Washington, DC: National Academy Press.