a plan for prosperity, growth and inclusion version 1
TRANSCRIPT

DRAFT 2016-08-05
A PLAN FOR PROSPERITY, GROWTH AND INCLUSION VERSION 1.0
NORTHCENTRAL INDIANA REGIONAL DEVELOPMENT AUTHORITY
____________, 2016

DRAFT 2016-08-05
Northcentral Indiana Regional Development Authority
i
NORTHCENTRAL INDIANA REGIONAL DEVELOPMENT AUTHORITY
Board of Directors
John Affleck-Graves Pete McCown University of Notre Dame Elkhart County Community Foundation
Dallas Bergl Kristin Pruitt INOVA Federal Credit Union Lakeland Financial Corporation
John DeSalle Hoosier Racing Tire
Strategy Development Team
John Affleck-Graves James Keenan University of Notre Dame Walter & Keenan Financial Consulting Co.
Bill Davis Karl King Hilltop Wealth Solutions Crowe Horwath LLC (retired)
Jan Fye Diana Lawson St. Joseph County Chamber of Commerce Elkhart County Convention & Visitors Bureau
Larry Garatoni Chuck Lehman HQ Investments Lehman & Lehman, Inc.
Tracy Graham Pete McCown Graham-Allen Partners Elkhart County Community Foundation
Tim Harman Amish Shah Harmony Marketing Group Kem Krest
Kurt Janowsky Roger Umbaugh J.T. Restaurants, Inc. Umbaugh and Associates (retired0
Kenneth Julian Thor Industries

DRAFT 2016-08-05
Contents
Northcentral Indiana Regional Development Authority i
Board of Directors i
Strategy Development Team i
Executive Summary 1
Introduction 8
Overview 11
Situation Analysis 12
Economic Performance 12
Economic Structural Factors 21
Programs For Improvement 32
Greater Employment in Higher-Pay Traded Clusters 32
Better Access to Quality, Skilled Workers 41
Increased Employment and Business Ownership Opportunities for Minority Populations 44
Mobilizing to Implement the Programs for Improvement 47
The Need for a Regional Economic Development Body 47
Functions of a Regional Economic Development Body 47
Funding a Regional Economic Development Body 49
Appendix A: Selection of Benchmark Regions 51
Appendix B: Data Tables 54
Appendix C: Potential Resources 85

DRAFT 2016-08-05
Northcentral Indiana Regional Development Authority
1
EXECUTIVE SUMMARY
The Northcentral Indiana Regional Development Authority Board wants to stimulate and give direction to ongoing discussion about how to make the most of the region's existing assets and nurture development of the new assets needed to achieve continuous improvement. Accordingly, it appointed a 15-member Strategy Development Team to develop a plan that will guide a coordinated endeavor to assess, manage, and improve the region's economy.
The Strategy Development Team's work product is this Plan for Prosperity, Growth and Inclusion, Version 1.0 (the "Plan"), which provides a set of goals and strategies for which—with further research and deliberation—actionable initiatives will be able to be executed. The Strategy Development Team included "Version 1.0" in the title because we intend the Plan to begin an evolving process that will yield additional versions, each of which becomes both more robust and more precisely calibrated to the structure of Northcentral Indiana's economy
The Strategy Development Team performed a Situation Analysis to evaluate Northcentral Indiana's performance in the measures of economic well-being we consider most important: prosperity, growth, and inclusion. We evaluated how our region is doing and how it compares to the performance of five benchmark regions. Because structural factors drive performance, we also analyzed the key structural characteristics of our region's economy and compared them to those of the benchmark regions.
We recommend Programs for Improvement based on our Situation Analysis findings, specifying Goals, Strategies, and expected Outcomes for the region. We suggest for further research and deliberation actionable initiatives—Activities—to implement each Strategy, the Resources that might be used to support those Activities, and Output indicators to measure the success of the Activities.
We also recommend that a regional economic development body will be needed to implement the Programs for Improvement. We outline the functions of such a body and suggest funding models that could be used to support its operation.
Situation Analysis Findings
Economic Performance
The Strategy Development Team measured economic performance in terms of the factors we believe matter most to prosperity, growth, and inclusion. Accordingly, our evaluation of Northcentral Indiana's economic performance is based on the measures, and comparisons to selected Benchmark Metropolitan Areas (Appleton, WI Metropolitan Area; Cedar Rapids, IA Metropolitan Area; Lancaster, PA Metropolitan Area; Wichita, KS Metropolitan Area; and York, PA Metropolitan Area),1 described below.
1 See Appendix A for an explanation of how the Strategy Development Team selected these Benchmark Regions

DRAFT 2016-08-05
Northcentral Indiana Regional Development Authority
2
Prosperity
We measured Prosperity as the level of income produced by the regional economy on a per capita, per worker, and per proprietor basis because higher personal income leads to an increased demand for goods and services, resulting in greater employment, investment, and production within the region. We also included poverty rate because it reflects how well the benefits of personal income are spread through the population.
Northcentral Indiana's:
Per Capita Personal Income is $5,241 (11.9%) below the Benchmark MSAs' average;
Employee Compensation Per Worker is $2,981 (5.2%) below the Benchmark MSAs' average;
Average Nonfarm Proprietor's Net Income is $5,638 (17.8%) above the Benchmark MSAs' average; and
Poverty Rate (16.7%) is more than 1½ times the Benchmark MSAs' average.
Growth
We measured Growth by the increases over time in employment and productivity because these increases ultimately improve the economic well-being of those who live in the region. We used as measures of employment performance the Employment-Growth To Population-Growth Ratio, Prime-Age Employment Ratio, and the Compound Annual Rate Of Workforce Growth. We also included net migration as a measure of Growth because the region's labor supply can be increased through net in-migration of workers from outside the region or decreased by net out-migration of workers to other regions. We used as our measure of productivity performance the compound annual rate at which Gross Domestic Product per worker has increased.
Northcentral Indiana's:
Employment-Growth-to-Population-Growth Ratio 2004 through 2014 was negative and 1.13 points lower than the Benchmark MSAs' average,
Prime-Age Employment Ratio is 4.4 points below the Benchmark MSAs' average,
Compound Annual Growth Rate of Northcentral Indiana's workforce 2010 through 2014 was negative and .84 points below the Benchmark MSAs' average,
Net Migration 2010 through 2014 was more negative than all but one of the Benchmark MSAs, and
Compound Annual Growth Rate of Real GDP Per Worker 2004 through 2014 was more than double the Benchmark MSAs' average.
Inclusion
The Strategy Development Team focused on racial and ethnic inclusion, in particular as it relates to the availability of economic opportunity to persons of African-American race and Hispanic ethnicity. Accordingly, we measured Inclusion by: (a) the ratio of the African-American race population Unemployment Rate to the total population Unemployment Rate, (b) the ratio

DRAFT 2016-08-05
Northcentral Indiana Regional Development Authority
3
of the Hispanic ethnicity population Unemployment Rate to the total population Unemployment, (c) the percentage of businesses that are minority-owned, and (d) the ratio of the average number employed by minority-owned business firms with paid employees to the average number employed by nonminority-owned business firms with paid employees.
Northcentral Indiana's:
ratio of the African-American race population Unemployment Rate to the total population Unemployment Rate is two points better than the Benchmark MSAs' average, but its African-American Unemployment Rate is more than double the total population Unemployment Rate,
ratio of the Hispanic ethnicity population Unemployment Rate to the total population Unemployment Rate is 12 points worse than the Benchmark MSAs' average, and its Hispanic Unemployment Rate in our region is more than 1½ times the total population Unemployment Rate,
percentage of businesses that are minority-owned is more than 1½ times the Benchmark MSAs' average,
ratio of the average number employed by minority-owned businesses with paid employees to the average number employed by nonminority-owned businesses with paid employees is more than 1½ times the Benchmark MSAs' average.
Economic Structural Factors
The structural factors that most directly drive economic performance are the distribution of employment by industry, the distribution of employment by occupation, and human capital. Accordingly, our evaluation of Northcentral Indiana's economic structural factors is based on the measures, and comparisons to selected Benchmark MSAs, described below.
Employment by Industry Cluster
The Strategy Development Team analyzed the distribution of employment by industry in terms of Industry Clusters—groups of industries closely related by skill, technology, supply, demand, and other linkages—defined by The U.S. Cluster Mapping Project.2
Industry Clusters are either Traded Clusters or Local Clusters. A Traded Cluster is composed of traded industries, which are concentrated in a geographic region and sell to other regions and nations. A Local Cluster is composed of local industries, which primarily sell locally and tend to grow as local population grows.
Northcentral Indiana's employment distribution by Traded and Local Clusters is detailed by number, percentage, and Location Quotient3 in Appendix B, Table B-2. Employment is equally split between Traded Industry Clusters and Local Industry Clusters.
2 The U.S. Cluster Mapping Project (http://www.clustermapping.us) is a national economic initiative led by Harvard Business School's Institute for Strategy and Competitiveness in partnership with the U.S. Department of Commerce and U.S. Economic Development Administration. 3 A Location Quotient (LQ) is the ratio of an industry’s share of total employment in a location relative to its share of total national employment. The LQ measures the specialization or concentration of a cluster in a

DRAFT 2016-08-05
Northcentral Indiana Regional Development Authority
4
We focused on Traded Clusters because a region grows by exporting goods and services it produces to elsewhere, thus bringing income into the region. That new income then further increases the region's income as a portion of it is spent on local goods and services (the multiplier effect).
Northcentral Indiana's:
top two Traded Industry Clusters by employment —"Trailers, Motor Homes, and Appliances" and "Education and Knowledge Creation" account for 32.7% of all Traded Industry Cluster employment; and
ten largest Traded Industry Clusters by employment account for 73% of all Traded Industry Cluster employment, and the average annual pay of three is less than the approximately $39,000 average annual pay for all Traded Industry Clusters.
Employment Distribution by Occupation
The Strategy Development Team analyzed the occupation structure of Northcentral Indiana using the U.S. Bureau of Labor Statistics Occupational Employment Statistics, which provides data for over 800 Standard Occupational Classifications (based on the nature of the work performed and the skills required) for non-governmental occupations in 23 Major Occupation Groups.
In Northcentral Indiana:
The Major Occupations Group "Production" accounts for 21.85% of employment, which is more than 1½ times the Benchmark MSAs' average percentage of employment in Production and more than three times the national average.
The five largest Major Occupation Groups provide average annual pay less than the approximately $39,000 average annual pay for all occupations in the region.
The third largest Major Occupation Group, "Food Preparation and Serving", provides the lowest average annual pay.
Eight of the top 10 Production Occupations provide average annual pay less than the approximately $39,000 average annual pay for all occupations in the region.
The average annual pay for the largest Production Occupation, "Team Assemblers", is nearly $10,000 less than the average annual pay for all occupations in the region.
27% of employment is in low-skill Occupations for which no formal education credential is required, and only 22% is in Occupations for which education more than a High School Diploma is required.
Human Capital
"Human Capital" refers to the stock of knowledge, skills, expertise, and capacities embedded in the labor force. Human Capital is the single biggest driver of economic growth in metropolitan areas and continues to increase in importance in the knowledge economy.
particular location relative to the national average. An LQ > 1 indicates a higher than average cluster concentration in a location.

DRAFT 2016-08-05
Northcentral Indiana Regional Development Authority
5
Regions with higher levels of Human Capital experience greater increases in outputs, productivity, wages, and employment.
We used Workforce Growth Rate, Education Attainment, and Weighted Workforce Education Index as indicators of the region's Human Capital structural characteristics. The Workforce Growth Rate—the rate at which labor supply is increasing—is especially important because it affects the ability of firms to hire the workers they need in order to expand and, accordingly, the rate at which a region's output can grow.
Northcentral Indiana's:
workforce shrunk 1.36% in the period 2010 through 2014, while the workforces of the Benchmark MSAs grew an average of 2.0%,
percentage of population with an education attainment of Associate’s Degree or higher is less than any of the Benchmark MSAs, and
Weighted Workforce Education Index is seven points (20%) below the Benchmark MSAs' average.
Programs for Improvement
The Strategy Development Team concludes from our Situation Analysis that the Northcentral Indiana region needs to enhance its prosperity, growth, and inclusion through Programs for Improvement, to achieve:
greater employment in higher-pay traded clusters,
better access to quality, skilled workers, and
increased employment and business ownership opportunities for minority populations.
We have set forth below the Strategies we recommend to effect these Programs for Improvement and the Outcomes we expect these Strategies to produce.
To Achieve Greater Employment in Higher Pay Traded Clusters
Strategies
1. Accelerate expansion of employment in "Scaleup" Clusters (i.e., existing, already strong clusters for which the average annual pay is higher than the average for all Traded Industry Clusters; the adoption of new technologies such as 3-D Printing, Big Data, Digital Manufacturing, computational modelling, and robotics could have a transformative effect; there are existing companies willing to expand; and there is good potential for attracting new companies).
2. Accelerate expansion of employment in "Entrepreneurial" Clusters (i.e., existing, not yet strong clusters with a high Between Cluster Relatedness to strong clusters, for which the average annual pay is higher than the average for all Traded Industry Clusters, and which involve technology likely to match up with one of Notre Dame's Key Research Areas (Advanced Diagnostics and Therapeutics, Circuits, Computational Data Science, NDnano,

DRAFT 2016-08-05
Northcentral Indiana Regional Development Authority
6
Precision Medicine, Stem Cells and Regenerative Medicine, Sustainable Energy, Turbomachinery & Propulsion, Wireless Institute).
Outcomes
1. Greater diversity of industries and occupations providing employment in the region
2. Increased income produced by the regional economy on a per capita and per worker basis
3. Growth in employment, investment, and production within the region because of higher personal income leading to an increased demand for goods and services
4. Net migration into the region by workers—attracted from elsewhere by the availability of high-paid jobs—producing growth in the workforce and population
To Achieve Better Access to Quality, Skilled Workers
Strategies
1. Improve the number of work-ready people.
2. Stimulate inward migration.
Outcomes
1. Greater availability of "human capital" to companies in the region produced both by improved work-readiness of workers within the region and by attracting skilled labor from outside of the region
2. Increased growth and profitability of companies in the region enabled by their ability to obtain enough workers with the skills and education levels they need
3. Net migration into the region by workers from elsewhere, producing growth in the workforce and population
4. Growth in employment, investment, and production within the region
To Achieve Increased Employment and Business Ownership Opportunities for Minority Populations
Strategies
1. Increase minorities' employment opportunity by reducing barriers to their employment.
2. Increase the number and size of minority-owned businesses by reducing barriers and providing business assistance.
Outcomes
1. Increased employment, income, and economic well-being for African-American and Hispanic populations within the region
2. Increased growth and profitability of minority-owned companies
3. Growth in employment, investment, and production within the region
4. Increased racial and ethnic diversity of the region's population

DRAFT 2016-08-05
Northcentral Indiana Regional Development Authority
7
Mobilizing to Implement the Programs for Improvement
The Strategy Development Team intends this "Plan for Prosperity, Growth and Inclusion, Version 1.0" to begin an evolving process and to launch a coordinated endeavor to assess, manage, and improve Northcentral Indiana's economy. In order for that process to be implemented, an organization designated by the Regional Development Authority to be the regional economic development body operating under its auspices will be needed.
Functions of a Regional Economic Development Body
The functions of a regional economic development body should include the following:
1. Implementing the Program for Improvement strategies
2. Driving the ongoing evolution of this Plan
3. Convening key regional actors and creating collaborations
4. Creating a platform for public-private collaboration on regional economic strategy
5. Marketing the region
6. Directly encouraging collaboration among local governments and local economic development organizations by applying jointly for state, federal, and philanthropic grants
Funding a Regional Economic Development Body
Linked to the formation of a regional economic development body is deciding its funding model. Whereas county- or city-specific economic development organizations are often provided substantial funding by local government, a regional organization would have no counterpart regional government entity with taxing authority to act as a funding source.
The Strategy Development Team recommends consideration of two approaches to funding the regional economic development:
1. Solicit contributions directly from "investors" and, in addition, create a foundation dedicated to supporting the regional economic development organization that separately solicits contributions.
2. Pool funds from local foundations, similar to what is done by an organization in Northeast Ohio--the Fund for Our Economic Future. The Fund for Our Economic Future ("Fund") was launched in 2004 by the community foundations in several counties and a set of other philanthropic institutions from across Northeast Ohio. Presently, the Fund includes over 50 members, which now are not only philanthropic institutions but also businesses, nonprofits, governmental entities, and higher education institutions.

DRAFT 2016-08-05
Northcentral Indiana Regional Development Authority
8
INTRODUCTION
The Northcentral Indiana Regional Development Authority Board appointed a 15-member Strategy Development Team to develop a plan for enhancing the economic well-being of Northcentral Indiana. This document is the product of that work. This Plan for Prosperity, Growth and Inclusion, Version 1.0 (the "Plan") provides a set of goals and an initial set of strategies for which—with further research and deliberation—actionable initiatives will be able to be executed. The Strategy Development Team has included "Version 1.0" in the title of this document because we intend it to begin an evolving process by stimulating and giving direction to ongoing discussion about how to make the most of the region's existing assets and nurture development of the new assets needed to achieve future improvements. We hope it will lead to additional versions, each of which becomes both more robust and more precisely calibrated to the structure of Northcentral Indiana's economy. The best known economic development education and certifying body, the International Economic Development Council (IEDC)4, defines economic development as "improving the economic well-being of a community through the fostering of a dynamic environment where economic opportunities can be discovered, taken advantage of, and maximized to their fullest extent to create balanced and sustainable economic growth, jobs, a positive sense of 'place', and an improved quality of life in a defined geographic region."
Accordingly, the scope of this Plan is goals and strategies for enhancing the economic well-being--the prosperity, growth, and inclusion--of Northcentral Indiana through an improved economic structure. We fully acknowledge the need for planning with regard to community development, education, housing, poverty, public health, safety, transportation, the environment, and the overall quality of life. However, these issues are beyond the scope of this Plan and should be addressed by other efforts. Strong schools and a safe and livable environment certainly are critical factors for a successful economy, but this is a plan for improving economic structure. That is, we focused on those aspects of the region that have the most direct effect on improving employment, wages, and inclusion.
Although this is not a plan for poverty elimination and community development, we believe execution of the Plan will contribute to increased economic opportunity for individuals and enhanced quality of place for communities.
The Plan incorporates, as resources for executing strategies, much of the work presently being performed by entities in the region that is directed to the drivers and mechanics of economic growth. We formulated the Plan taking into consideration these existing efforts, and its strategies are meant to encompass many existing initiatives.
Finally, the Strategy Development Team urges all who read this Plan to recognize that our economy extends beyond governmental boundaries. The goals are ambitious, and implementation of the strategies will have to reach beyond the limits of any county, city, or town. Collaborative and coordinated action throughout the region will be vital to the Plan's implementation. Hence, adherence to a regional strategy by local governments and local
4 International Economic Development Council, http://www.iedconline.org/

DRAFT 2016-08-05
Northcentral Indiana Regional Development Authority
9
economic development organizations will be a critical success factor for improving prosperity, growth, and inclusion in our shared economy.
The Strategy Development Team began by deciding our work product should be a plan that:
is based on documented facts about the performance and structure of Northcentral Indiana's economy,
sets specific, measurable, achievable, realistic, and time-bound goals ("SMART" goals),
proposes explicit strategies from which results-oriented activities can be derived,
defines measurable outputs desired to be produced by the strategies, and
links the facts, goals, strategies, and outputs in a structure that has a built-in basis for evaluating progress.
Accordingly, we used the Program Logic Model as the organizing architecture for each program in the Plan. A Program Logic Model is a structure consisting of: the problem addressed, the goal that defines success, the rationale and assumptions underlying the goal, and a roadmap of the plan illustrating how it is expected to work--what resources will be used, what activitieswill be executed and what outcomes are desired. It is a systematic way to understand and communicate the relationships among the resources available, the activities planned, and the results intended to be achieved.
Figure 1 is a graphic depiction of the structure and components of a Program Logic Model.
Figure 1: Program Logic Model Structure

DRAFT 2016-08-05
Northcentral Indiana Regional Development Authority
10
The Team believes the Program Logic Model architecture fulfills our guiding principle that the Plan should link facts, goals, strategies, and outputs in a structure that has a built-in basis for evaluating progress. Because Program Logic Models "connect the dots" between resources, activities, and outcomes, they can be the basis for project management. Using data collection and a project plan, our logic models can help implementation teams track and monitor operations to manage results.
The Program Logic Model architecture also provides a built-in basis for evaluating progress by data collection and using the logic model as the foundation for an evaluation plan as illustrated by the schematic in Figure 2.
Figure 2: Program Logic Model as the Foundation for Evaluating Progress5
5 Used by permission of Innovation Network, Inc.

DRAFT 2016-08-05
Northcentral Indiana Regional Development Authority
11
OVERVIEW
The Plan for Prosperity, Growth and Inclusion is set forth in the following pages in three parts:
1. Situation Analysis presents an evaluation of Northcentral Indiana's performance in measures of economic well-being – prosperity, growth, and inclusion. It shows how our region is doing and how it compares to the performance of benchmark regions. Furthermore, because structural characteristics drive performance, it also presents analyses of the structural characteristics of our region's economy and compares them to those of the benchmark regions.
2. Programs for Improvement identifies Problem Statements, Goals, and Strategies for the region derived from the Situation Analysis. These Goals and Strategies express the consensus of the Strategy Development Team as to the most important areas for further research and deliberation. Also presented in this part are Activities -- actionable initiatives -- proposed for consideration in relation to each Strategy, potential Resources to support those Activities, and measurable Outputs by which the results of the Activities can be evaluated.
3. Mobilizing for Implementation outlines the functional and funding structures for a regional economic development body, which the Strategy Development Team considers to be needed to support implementation of the Programs for Improvement.

DRAFT 2016-08-05
Northcentral Indiana Regional Development Authority
12
SITUATION ANALYSIS
Economic Performance
The Strategy Development Team for our situation analysis measured economic performance in terms of the factors that matter most to prosperity, growth, and inclusion. Accordingly, our evaluation of Northcentral Indiana's economic performance is based on the measures and comparisons to selected Benchmark Metropolitan Areas (Appleton, WI Metropolitan Area; Cedar Rapids, IA Metropolitan Area; Lancaster, PA Metropolitan Area; Wichita, KS Metropolitan Area; and York, PA Metropolitan Area) 6 set forth below.
Prosperity
We measured Prosperity as the level of income produced by the regional economy on a per capita, per worker, and per proprietor basis because higher personal income leads to an increased demand for goods and services, resulting in greater employment, investment, and production within the region. We also included poverty rate because it reflects how well the benefits of personal income are spread through the population.
Per Capita Personal Income
As illustrated in Figure 3, Northcentral Indiana's Per Capita Personal Income is $5,241 (11.9%) below the Benchmark MSAs' average7.
Figure 3: Per Capita Personal Income
$34,000
$36,000
$38,000
$40,000
$42,000
$44,000
$46,000
$48,000
Cedar Rapids Wichita Appleton York Lancaster NCI
Benchmarksaverage = $44,041
6 See Appendix A for an explanation of how the Strategy Development Team selected these Benchmark Regions 7 Source: U.S. Bureau of Economic Analysis, 2014 data

DRAFT 2016-08-05
Northcentral Indiana Regional Development Authority
13
Employee Compensation Per Worker and Average Nonfarm Proprietor’s Net Income
As illustrated in Figures 4 and 5, Northcentral Indiana's Employee Compensation Per Worker is $2,981 (5.2%) below the Benchmark MSAs' average, but Average Nonfarm Proprietor's Net Income is $5,638 (17.8%) above the Benchmark MSAs' average 8.
Figure 4: Employee Compensation Per Worker
$49,000
$50,000
$51,000
$52,000
$53,000
$54,000
$55,000
$56,000
$57,000
$58,000
$59,000
Cedar Rapids York Wichita Appleton Lancaster NCI
Benchmarksaverage = $55,139
Figure 5: Average Nonfarm Proprietor's Income
$0
$5,000
$10,000
$15,000
$20,000
$25,000
$30,000
$35,000
$40,000
$45,000
Wichita NCI Lancaster Cedar Rapids Appleton York
Benchmarksaverage = $29,896
8 Ibid.

DRAFT 2016-08-05
Northcentral Indiana Regional Development Authority
14
Poverty Rate
As Figure 6 illustrates, the percentage of Northcentral Indiana's population living in poverty (16.7%) is more than 1½ times the Benchmark MSAs' average9.
Figure 6: Poverty Rate
0%
2%
4%
6%
8%
10%
12%
14%
16%
18%
Appleton Cedar Rapids York Lancaster Wichita NCI
Benchmarksaverage = 11.0%
Growth
We measured Growth by the increases over time in employment and productivity because these increases ultimately improve the economic well-being of those who live in the region. The extent to which the population is employed is an indicator of the extent to which the region is utilizing its productive capacity. Employment is also significant as an end itself, because having a job and the ability to generate income profoundly influences a person's sense of well-being and generating income is critical to the life and sustainability of a community. We used as our measures of employment performance the employment-growth to population-growth ratio, prime-age employment ratio, and the compound annual rate of workforce growth. The workforce growth rate — the rate at which labor supply is increasing — is especially important because it affects the ability of firms to expand and, accordingly, the rate at which the region's output can grow. We also included net migration as a measure of Growth because the region's labor supply can be increased through net in-migration of workers from outside the region or decreased by net out-migration of workers to other regions. We used as our measure of productivity performance the compound annual rate at which Gross Domestic Product per worker has increased.
9 U.S. Census Bureau, American Community Survey, 2010-2014

DRAFT 2016-08-05
Northcentral Indiana Regional Development Authority
15
Employment-Growth-to-Population-Growth Ratio
As illustrated in Figure 6, Northcentral Indiana's Employment-Growth-to-Population-Growth Ratio 2004 through 2014 was negative and 1.13 points lower than the Benchmark MSAs' average.10
Figure 6: Employment-Growth-to-Population-Growth Ratio, 2004 - 2014
Prime-Age Employment Ratio
As illustrated in Figure 7, Northcentral Indiana's Prime-Age Employment Ratio is 4.4 points below the Benchmark MSAs' average11.
Prime-Age Employment Ratio is calculated as the number of 25 to 64 year-olds who are either employed or looking for work, divided by the total number of people in that age group. Thus, the Prime-Age Employment Ratio (ER) captures both the Labor Force Participation Rate (LFPR) and the Unemployment Rate (UR) for the population that is most likely to be working, as:
ER = LFPR*(1-UR)
Details of Labor Force Participation Rate, Employment Ratio, and Unemployment Rate for several demographic segments of the population in Northcentral Indiana and the Benchmark MSAs are shown in Appendix B, Table B-1.
10 Source: U.S. Bureau of Economic Analysis 11 Computed using data from U.S. Census Bureau, American Community Survey, 2010-2014
-0.60
-0.40
-0.20
0.00
0.20
0.40
0.60
0.80
1.00
1.20
1.40
Cedar Rapids Wichita Lancaster Appleton York NCI
Benchmarksaverage = 0.80

DRAFT 2016-08-05
Northcentral Indiana Regional Development Authority
16
Figure 7: Prime-Age Employment Ratio
Workforce Growth Rate
As illustrated in Figure 8, Northcentral Indiana's workforce compound annual growth rate 2010 through 2014 was negative and .84 points below the Benchmark MSAs' average.12
Figure 8: Compound Annual Growth Rate of Workforce, 2010 - 2014
12 Computed using data from U.S. Census Bureau, American Community Survey, 2010-2014
68%
70%
72%
74%
76%
78%
80%
82%
Appleton Cedar Rapids Lancaster York Wichita NCI
Benchmarksaverage = 77.8%
-0.4%
-0.2%
0.0%
0.2%
0.4%
0.6%
0.8%
1.0%
Lancaster Cedar Rapids Wichita York Appleton NCI
Co
mp
ou
nd
An
nu
al G
row
th R
ate
, 2
01
0 -
20
14
Benchmarks
average = 0.50%

DRAFT 2016-08-05
Northcentral Indiana Regional Development Authority
17
Net Migration
As illustrated in Figure 9, Northcentral Indiana's net migration 2010 through 2014 was more negative than all but one of the Benchmark MSAs.13
Figure 9: Net Migration, 2010 - 2014
Productivity - Compound Annual Growth Rate of Real GDP Per Worker
As illustrated in Figure 9, Northcentral Indiana's Compound Annual Growth Rate of Real GDP Per Worker 2004 through 2014 was more than double the Benchmark MSAs' average14.
Figure 9: Compound Annual Growth Rate of Real GDP Per Worker, 2004 - 2014
0.0%
0.5%
1.0%
1.5%
2.0%
2.5%
Cedar Rapids NCI Wichita Lancaster Appleton York
Benchmarksaverage = 0.58%
13 Source: U.S. Census Bureau, Estimates of the Components of Resident Population Change: 2010 to 2015 14 Computed using data from U.S. Bureau of Economic Analysis

DRAFT 2016-08-05
Northcentral Indiana Regional Development Authority
18
Inclusion
In today's environment of concern about income inequality, income mobility, social equitability, and environmental sustainability, writers of economic and social literature are assigning an ever-expanding variety of meanings to "inclusion". However, the Strategy Development Team focused on racial and ethnic inclusion as it relates, in particular, to the availability of economic opportunity to persons of African-American race and Hispanic ethnicity. Therefore, we measured Inclusion by the (a) ratio of the unemployment rate of the African-American race population to the unemployment rate of total population 16 years and over, (b) ratio of the unemployment rate of the Hispanic ethnicity population to the unemployment rate of total population 16 years and over, (c) the percentage of businesses that are minority-owned, and (d) the ratio of the average number employed by minority-owned business firms with paid employees to the average number employed by nonminority-owned business firms with paid employees.
Ratio of African-American Unemployment Rate to Total Population Unemployment Rate
As illustrated in Figure 10, Northcentral Indiana's ratio of the unemployment rate of the African-American race population to the unemployment rate of the total population 16 years and over is two points better than the Benchmark MSAs' average. However, the African-American unemployment rate in our region is more than double the total population unemployment rate.15
Figure 10: Ratio of African-American Unemployment Rate to Total Unemployment Rate
Ratio of Hispanic Unemployment Rate to Total Population Unemployment Rate
As illustrated in Figure 11, Northcentral Indiana's ratio of the unemployment rate of the Hispanic ethnicity population to the unemployment rate of total population 16 years and over
15 Computed using data from U.S. Census Bureau, American Community Survey, 2010-2014
0.0
0.5
1.0
1.5
2.0
2.5
3.0
Appleton Wichita NCI York Lancaster Cedar Rapids
Ra
tio
to
To
tal P
op
ula
tio
n U
nem
plo
ymen
t R
ate
Benchmarks
average = 2.15

DRAFT 2016-08-05
Northcentral Indiana Regional Development Authority
19
is 12 points worse than the Benchmark MSAs' average. The Hispanic unemployment rate in our region is more than 1½ times the total population unemployment rate.16
Figure 11: Ratio of Hispanic Unemployment Rate to Total Unemployment Rate
Percentage of Businesses That Are Minority-Owned
As illustrated in Figure 12, Northcentral Indiana's percentage of businesses that are minority-owned is more than 1½ times the Benchmark MSAs' average.17
Figure 12: Percentage of Businesses That Are Minority-Owned
16 Ibid. 17 Computed from U.S. Census Bureau, 2012 Survey of Business Owners

DRAFT 2016-08-05
Northcentral Indiana Regional Development Authority
20
Ratio of Average Number Employed--Minority-Owned Firms to Nonminority-Owned Firms
As illustrated in Figure 13, Northcentral Indiana's ratio of the average number employed by minority-owned businesses with paid employees to the average number employed by nonminority-owned businesses with paid employees is more than 1½ times the Benchmark MSAs' average.18
Figure 13: Ratio of Average Number Employed by Minority-Owned to Nonminority-Owned Businesses
18 Ibid.

DRAFT 2016-08-05
Northcentral Indiana Regional Development Authority
21
Economic Structural Factors
Every region has structural factors that interact in a way unique to that locality and drive its economic performance.19 The structural factors that most directly drive economic performance are the distribution of employment by industry, the distribution of employment by occupation, and human capital. Accordingly, our evaluation of Northcentral Indiana's economic structural factors is based on the measures and comparisons to selected Benchmark MSAs described below.
Employment by Industry Cluster
The Strategy Development Team analyzed the distribution of employment in terms of "Industry Cluster" instead of the industries identified by North American Industry Classification System (NAICS) codes, for the following reasons:
In the NAICS, industries are classified according to the type of goods or services they produce. These designations in the NAICS impose artificial constraints that make it hard to understand how a regional economy actually functions. In the real world, instead of a single industry being an economic driver, each industry is part of a cluster of productive activities that are related to it--many of which are classified in other NAICS sectors. A cluster might embody not only the firms that produce a good or service itself, but also local suppliers to those firms, professional and financial services that provide services to these firms, and institutions that train the labor force for the jobs in those firms.
Industry Clusters are groups of industries closely related by skill, technology, supply, demand, and other linkages. Because the definitions of Industry Clusters incorporate this inter-industry relatedness, they enable the comparison of clusters across locations and over time by mapping the defined clusters into regional units and measuring the specialization patterns of regions in the clusters. 20
Our source of Industry Cluster data is The U.S. Cluster Mapping Project.21.
Industry Clusters are either Traded Clusters or Local Clusters. A Traded Cluster is composed
of traded industries, which are concentrated in a geographic region and sell to other regions and nations. A Local Cluster is composed of local industries, which primarily sell locally and
tend to grow as local population grows
19 George Washington University and RW Ventures, LLC, "Implementing Regionalism: Connecting Emerging Theory and Practice to Inform Economic Development" (Washington, D.C., George Washington Institute of Public Policy, 2011) 20 Mercedes Delgado, Michael Porter and Scott Stern, "Defining Clusters of Related Industries" (Cambridge, MA, National Bureau of Economic Research, 2014), 3 21 The U.S. Cluster Mapping Project (http://www.clustermapping.us) is a national economic initiative that provides over 50 million open data records on industry clusters and regional business environments in the United States to promote economic growth and national competitiveness. The project is led by Harvard Business School's Institute for Strategy and Competitiveness in partnership with the U.S. Department of Commerce and U.S. Economic Development Administration.

DRAFT 2016-08-05
Northcentral Indiana Regional Development Authority
22
Employment Distribution by Industry Cluster
Northcentral Indiana's employment distribution by Traded and Local Clusters is detailed by number, percentage, and Location Quotient (LQ)22 in Appendix B, Table B-2. Employment is equally split between Traded Industry Clusters and Local Industry Clusters.
For our analysis, we focused on Traded Clusters. We did so because the techniques used in most studies to assess an area's economic competitiveness are all, in one way or another, based on an analysis of the area's current or potential ability to trade with the outside world. An economy—a region in our case—grows by exporting goods and services it produces to outside the region, thus bringing income into the region. That new income then further increases the region's income as a portion of it is spent on local goods and services (the multiplier effect).23
Appendix B, Table B-3 shows for Northcentral Indiana and the Benchmark MSAs the percentage of total Traded Industry Cluster employment accounted for by each Traded Industry Cluster. In both Northcentral Indiana and the Benchmark MSAs, the top two clusters combined account for more than 25% of all Traded Industry Cluster employment. The top two clusters and their combined percentage of Traded Industry Cluster employment for each region are:
Northcentral Indiana — "Trailers, Motor Homes, and Appliances"; "Education and Knowledge Creation" (32.7%)
Appleton — "Business Services"; "Distribution and Electronic Commerce" (27.1%)
Cedar Rapids — "Business Services"; "Aerospace Vehicles and Defense" (26.8%)
Lancaster — "Distribution and Electronic Commerce"; "Business Services" (27.1%)
Wichita — "Aerospace Vehicles and Defense"; "Business Services" (48.2%)
York — "Distribution and Electronic Commerce"; "Business Services" (26.7%)
We noted especially that, although all the Benchmark MSAs have Business Services and four of the five have Distribution and Electronic Commerce as one of their top two Traded Industry Clusters, neither of these Traded Industry Clusters is one of Northcentral Indiana's top two.
22 A Location Quotient (LQ) is the ratio of an industry’s share of total employment in a location relative to its share of total national employment. The LQ measures the specialization or concentration of a cluster in a particular location relative to the national average. An LQ > 1 indicates a higher than average cluster concentration in a location. 23 Hal Wolman, Alice Levy, Garry Young, Pamela Blumenthal, "Economic Competitiveness And The Determinants Of Sub-National Area Economic Activity", (Washington, D.C., George Washington Institute of Public Policy, 2008), 6

DRAFT 2016-08-05
Northcentral Indiana Regional Development Authority
23
Figure 14, on the following page, is an illustration of Northcentral Indiana's Traded Industry Clusters and their linkages to related clusters..24
In Figure 14:
"Cluster Specialization" is measured by the value of a cluster’s Location Quotient.
"BCR" is an abbreviation for "Between Cluster Relatedness", a measure of the average relatedness between the industries in two different clusters
"RI" is an abbreviation for ""Related Industries", a measure of the average relatedness between a specific industry and a specific cluster.
An explanation of the methodology by which Between Cluster Relatedness and Related Industries are determined can be viewed at www.clustermapping.us/content/related-clusters-methodology.
24 Figure 14 is adapted from a U.S. Cluster Mapping Project illustration; U.S. Cluster Mapping Project (http://clustermapping.us

DRAFT 2016-08-05
Northcentral Indiana Regional Development Authority
24
Figure 14: Northcentral Indiana's Traded Industry Clusters and Cluster Linkages

DRAFT 2016-08-05
Northcentral Indiana Regional Development Authority
25
Figure 15 is a graphic depiction of Northcentral Indiana's 10 largest Traded Industry Clusters by employment, with each cluster's Average Annual Pay. It shows that 73% of all Traded Industry Cluster employment is in these 10, the top two account for 33%, and the average annual pay for three is less than the approximately $39,000 average annual pay of all Traded Clusters.25
Figure 15: Northcentral Indiana's Top 10 Traded Industry Clusters by Number Employed, with Average Annual Pay
Employment Distribution by Occupation
Occupation classifications are based on the nature of the work performed and the skills required. We used the U.S. Bureau of Labor Statistics Occupational Employment Statistics (OES), which provides data for over 800 Standard Occupational Classifications for non-governmental occupations in 23 major groups.26
Employment Distribution and Average Annual Pay by Major Occupation Group
Northcentral Indiana's employment distribution by Major Occupation Group is detailed by number, percentage, Location Quotient and Average Annual Pay in Appendix B, Table B-4. Table B-4 shows that the Production Occupations Group, at 21.85% of total employment, constitutes more than three times the national average.
Appendix B, Table B-5 shows for Northcentral Indiana and the Benchmark MSAs the percentage of total employment accounted for by each Major Occupation Group. In both
25 Source: U.S. Cluster Mapping Project (http://clustermapping.us) 26 The list of all Standard Occupational Classifications can be accessed at http://www.bls.gov/oes/current/oes_stru.htm
$47,724
$33,264
$40,344
$41,467
$37,962
$42,782
$51,818
$81,272
$22,279
$52,513
0 5,000 10,000 15,000 20,000 25,000 30,000
Metalworking Technology
Downstream Metal Products
Upstream Metal Manufacturing
Furniture
Plastics
Automotive
Distribution and Electronic Commerce
Business Services
Education and Knowledge Creation
Trailers, Motor Homes, and Appliances

DRAFT 2016-08-05
Northcentral Indiana Regional Development Authority
26
Northcentral Indiana and the Benchmark MSAs, the top two Major Occupation Groups combined account for 25% or more of all employment. The top two Major Occupation Groups and their combined percentage of total employment for each region are:
Northcentral Indiana — "Production"; "Office and Administrative Support" (35.2%)
Appleton — Office and Administrative Support; Production (27.8%)
Cedar Rapids — "Office and Administrative Support"; "Transportation and Material Moving"(25%)
Lancaster — "Office and Administrative Support"; "Sales and Related" (26.4%)
Wichita — "Office and Administrative Support"; "Sales and Related" (26.5%)
York — "Office and Administrative Support"; "Production" (26.8%)
We noted especially that Northcentral Indiana and all the Benchmark MSAs have Office and Administrative Support as one of their top two Major Occupation Groups. Also, Northcentral Indiana and two of the Benchmark MSAs have Production as one of their top two Major Occupation Groups, but Northcentral Indiana's percentage of total employment in Production is more than 1½ times that of the Benchmark MSAs.
Figure 16 graphically illustrates the top 10 Major Occupation Groups by number employed and the average annual pay for each.27
Figure 16: Northcentral Indiana's Top 10 Major Occupation Groups by Number Employed, with Average Annual Pay
27 Source: U.S. Bureau of Labor Statistics, Occupational Employment Statistics
$61,460
$39,640
$92,370
$71,400
$49,770
$32,260
$20,810
$36,690
$32,370
$31,610
0 10,000 20,000 30,000 40,000 50,000 60,000
Business & Financial
Installation, Maint. & Repair
Management
Healthcare Practitioners
Education, Training & Library
Transportation & Mat'l Moving
Food Prep. & Serving
Sales
Office & Admin. Support
Production

DRAFT 2016-08-05
Northcentral Indiana Regional Development Authority
27
We noted especially that Figure 16 shows:
The five largest Major Occupation Groups provide average annual pay less than the approximately $39,000 average annual pay for all occupations in the region.
The third largest Major Occupation Group, Food Preparation and Serving, provides the lowest average annual pay.
Employment in Occupations in the National Upper Quartiles of Average Annual Pay
Table B-6 shows that Northcentral Indiana's percentage of employment in Major Occupational Group that are in the national upper quartiles of average annual pay is lower than all the Benchmark MSAs and 5.6 points (21.3%) below the Benchmark MSAs' average.
A Drill-down into the Production Occupations Group
Because the Production Occupations Group constitutes the largest occupational employment group in Northcentral Indiana and is more than a fifth of total employment, we decided to analyze further the individual occupations in the Production group.
Northcentral Indiana's employment distribution by individual occupation within the Production Occupations Group is detailed by number, percentage, and Average Annual Pay in Appendix B, Table B-7.
Figure 17 graphically illustrates the top 10 Production Occupations by number employed and the average annual pay for each.28
Figure 17: Northcentral Indiana's Top 10 Production Occupations by Number Employed, with Average Annual Pay
28 Ibid
$28,410
$38,090
$41,410
$35,270
$27,725
$52,100
$32,675
$25,465
$25,660
$29,855
0 2,000 4,000 6,000 8,000 10,000 12,000 14,000 16,000
Fiberglass Laminators & Fabricators
Machinists
Cabinetmakers & Bench Carpenters
Inspectors & Testers
Cutting, Punching & Press Operators
1st-Line Supervisors of Production Workers
Welders, Cutters, Solderers & Brazers
Assemblers & Fabricators, All Other
Helpers - Production Workers
Team Assemblers

DRAFT 2016-08-05
Northcentral Indiana Regional Development Authority
28
We noted especially that Figure 17 shows:
The average annual pay for eight of the top 10 Production Occupations is less than the approximately $39,000 average annual pay for all occupations in the region.
The average annual pay for the largest Production Occupation, Team Assemblers, is nearly $10,000 less than the average annual pay for all occupations in the region.
The Education and Training Requirements for Occupations
The distribution of Northcentral Indiana's total employment by individual occupation according to the education attainment level required for the occupation is detailed in Appendix B, Table B-8.
Figure 18 graphically illustrates the percentage of total employment in occupations for which each education level is required.29
Figure 18: Percentage Employed in Occupations by Education Attainment Required
To the extent the education attainment required is an indication of the skill level of an occupation, Table B-7 and Figure 18 show that a large percentage of Northcentral Indiana's employment is in low-skill occupations. Occupations for which no formal education credential is required account for 27% of all employment, and occupations for which education more than a High School Diploma is required account for only 22%.
29 Ibid.
0%
5%
10%
15%
20%
25%
30%
35%
40%
45%
50%
No FormalEducationCredential
High SchoolDiploma
PostsecondaryNondegreeCertificate
Some College,No Degree
Associate'sDegree
Bachelor'sDegree
Master'sDegree
Doctoral orProfessional
Degree

DRAFT 2016-08-05
Northcentral Indiana Regional Development Authority
29
Human Capital
Human Capital refers to the stock of knowledge, skills, expertise, and capacities embedded in the labor force. Human Capital is the single biggest driver of economic growth, and it continues to increase in importance in the knowledge economy. Regions with higher levels of Human Capital experience greater increases in outputs, productivity, wages, and employment.
Workforce Growth
The workforce growth rate— the rate at which labor supply is increasing— affects the ability of firms to hire the workers they need in order to expand and, accordingly, the rate at which a region's output can grow.
The workforce growth of Northcentral Indiana and the Benchmark MSAs for the post-recession years 2010 through 2014 is set forth in Appendix B, Table B-9.
Figure 19 graphically illustrates that Northcentral Indiana's workforce shrunk 1.36% in the 2010 through 2014 period, while the workforces of the Benchmark MSAs grew an average of 2.0%.30
Figure 19: Civilian Workforce Growth, 2010 - 2014
30 Source: U.S. Census Bureau, Population Division
-2.0%
-1.5%
-1.0%
-0.5%
0.0%
0.5%
1.0%
1.5%
2.0%
2.5%
3.0%
3.5%
Lancaster Cedar Rapids Wichita York Appleton NCI
Benchmarks Average = 2.0%

DRAFT 2016-08-05
Northcentral Indiana Regional Development Authority
30
Education Attainment of Population Age 25 and Older
The education attainment level distribution of the population age 25 and older in Northcentral Indiana and the Benchmark MSAs is detailed in Appendix B, Table B-10.31
Figure 20 illustrates that Northcentral Indiana's percentage of population with an education attainment of Associate’s Degree or higher is less than any of the Benchmark MSAs.
Figure 20: Education Attainment of Population Age 25 and Older
Weighted Workforce Education Index
Using a Weighted Workforce Education Index is an effective means of comparing the level of total workforce education across locations and over time. A "Weighted Workforce Education Index" is a weighted score of the educational attainment of the workforce devised by the Ewing Marion Kauffman Foundation as part of its "New Economy Index". The measure is computed by (a) weighting the percentage of residents with less than a high school education with a multiplier of -0.5, (b) weighting the percentage of residents with a high school diploma or equivalent with a multiplier of 0.0, (c) weighting the percentage of residents with some college but no degree with a multiplier of 0.25, (d) weighting the percentage of residents with an associate's degree with a multiplier of 0.5, (c) weighting the percentage of residents with a bachelor’s degree with a multiplier of 1.0, (e) weighting the percentage of residents with graduate and professional degrees with a multiplier of 1.5, and (f) totaling the weighted percentages to produce the Weighted Workforce Education Index value.
31 Source: U.S. Bureau of Census, 2010-2014 American Community Survey 5-Year Estimates
0%
5%
10%
15%
20%
25%
30%
35%
40%
45%
NCI Appleton Cedar Rapids
Lancaster Wichita York
Less than High School High School Some college Associate's degree Bachelor's degree or higher

DRAFT 2016-08-05
Northcentral Indiana Regional Development Authority
31
The Weighted Workforce Education Index for Northcentral Indiana and the Benchmark MSAs is shown in Appendix B, Table B-10. Figure 20 illustrates that Northcentral Indiana's Weighted Workforce Education Index is seven points (20%) below the Benchmark MSAs' average.32
Figure 20: Weighted Workforce Education Index
32 Source: Computed from U.S. Bureau of Census, 2010-2014 American Community Survey 5-Year Estimates data

DRAFT 2016-08-05
Northcentral Indiana Regional Development Authority
32
PROGRAMS FOR IMPROVEMENT
The Strategy Development Team concluded from our Situation Analysis that the Northcentral Indiana region should establish programs to improve prosperity, growth, and inclusion through:
greater employment in higher-pay traded clusters,
better access to quality, skilled workers, and
increased employment and business ownership opportunities for minority populations.
We have described these programs in the following pages, setting out for each the following Program Logic Model components:
Problem Statement
Goal
Rationale
Assumptions
Strategies
Activities
Resources
Outputs
Outcomes
Greater Employment in Higher-Pay Traded Clusters
Problem Statement
A high concentration of employment in certain manufacturing clusters which employ a large percentage of low-skill, low-pay occupations such as Assemblers and Fabricators, Production Helpers, and Team Assemblers:
a) causes average employee earnings and per capita personal income to be less than in comparable areas, and
b) is unattractive to skilled workers, thus contributing to negative net migration.
Goal
A greater share of employment in higher-pay, Traded Industry Clusters

DRAFT 2016-08-05
Northcentral Indiana Regional Development Authority
33
Rationale
Increased employment in higher-pay, Traded Industry Clusters:
a) will produce higher employee compensation per worker, which will result in higher per capita income,
b) will attract inward migrants to the region, and
c) will further increase the region's income as a portion of the new income from higher-paid jobs is spent on local goods and services.
Assumptions
1. There will be companies in the selected clusters that will take advantage of innovation and business assistance services to accelerate their growth.
2. There will be sufficient market demand to enable existing companies and startups in the selected clusters, with an appropriate growth strategy, to expand and increase their employment of higher-skill, higher-pay occupations.
Strategies
Although creating new clusters from scratch is not practical, growth of existing clusters can be accelerated.33 As the diagram in Figure 14 presented earlier illustrates, Northcentral Indiana is home to over 20 existing Traded Industry Clusters which are already strong (i.e., their Location Quotient is greater than 1.0) and several others which, while not yet strong, have a high Between Cluster Relatedness to already strong clusters. Accordingly, a greater share of employment in higher-pay, Traded Industry Clusters can be attained by extending innovation and business assistance services to established companies and startup companies with significant growth potential in selected clusters:
Therefore, we recommend the following Strategies:
Accelerate expansion of employment in "Scaleup" Clusters
Accelerate expansion of employment by companies in "Scaleup" Clusters (i.e., existing, already strong clusters for which: the average annual pay is higher than the average for all Traded Industry Clusters; the adoption of new technologies such as 3-D Printing, Big Data, Digital Manufacturing, computational modelling, and robotics could have a transformative effect; there are existing companies willing to expand; and there is good potential for attracting new companies.)
33 George Washington University and RW Ventures, LLC, "Implementing Regionalism: Connecting Emerging Theory and Practice to Inform Economic Development" (Washington, D.C., George Washington Institute of Public Policy, 2011), 85-95

DRAFT 2016-08-05
Northcentral Indiana Regional Development Authority
34
Figures 21 through 24 show that Paper and Packaging, Downstream Chemical Products, Distribution & eCommerce, and Metalworking Technology should be considered as potential Scaleup Clusters.34
Figure 21: Paper & Packaging and Related Clusters
34 Figures 21 through 24 are adapted from U.S. Cluster Mapping Project illustrations.
NCIAverage
Annual Pay$54,812

DRAFT 2016-08-05
Northcentral Indiana Regional Development Authority
35
Figure 22: Downstream Chemical Products and Related Clusters
Figure 23: Distribution & eCommerce and Related Clusters
IndianaAverage
Annual Pay$53,298
NCIAverage
Annual Pay$51,818

DRAFT 2016-08-05
Northcentral Indiana Regional Development Authority
36
Figure 24: Metalworking Technology and Related Clusters
Accelerate expansion of employment in "Entrepreneurial" Clusters
Accelerate expansion of employment by companies in "Entrepreneurial" Clusters (i.e., existing, not yet strong clusters with a high Between Cluster Relatedness to strong clusters, for which the average annual pay is higher than the average for all Traded Industry Clusters, and which involve technology likely to match up with one of Notre Dame's Key Research Areas--Advanced Diagnostics and Therapeutics, Circuits, Computational Data Science, NDnano, Precision Medicine, Stem Cells and Regenerative Medicine, Sustainable Energy, Turbomachinery & Propulsion, Wireless Institute).
Figures 25 through 28 show that Information Technology and Analytical Instruments, Business Services, Biopharmaceuticals, and Communications Equipment and Services should be considered as potential "Scaleup" Clusters.35
35 Figures 25 through 28 are adapted from U.S. Cluster Mapping Project illustrations.
NCIAverage
Annual Pay$47,724

DRAFT 2016-08-05
Northcentral Indiana Regional Development Authority
37
Figure 25: Information Technology & Analytical Instruments and Related Clusters
Figure 26: Business Services and Related Clusters
IndianaAverage
Annual Pay$62,693
NCIAverage
Annual Pay$81,272

DRAFT 2016-08-05
Northcentral Indiana Regional Development Authority
38
Figure 27: Biopharmaceuticals and Related Clusters
Figure 28: Communications Equipment & Services and Related Clusters
IndianaAverage
Annual Pay$85,284
IndianaAverage
Annual Pay$88,432

DRAFT 2016-08-05
Northcentral Indiana Regional Development Authority
39
Activities
Activities to accelerate expansion of employment in Scaleup Clusters
1. Identify36 and select for innovation and business assistance services companies in Scaleup Clusters which are willing to undertake accelerated growth and for which the adoption of new technologies such as 3-D Printing, advanced manufacturing methods, "Big Data", computational modelling, digital manufacturing, high-bandwidth telecommunications, high-performance computing, and robotics could have a transformative effect.
2. Provide innovation and business assistance services to help Scaleup Cluster companies accelerate their growth. (Consider providing these services through a Business Accelerator like Butler University’s Butler Business Consulting Group, https://www.butler.edu/consulting).
3. Provide technical resources to help Scaleup Cluster companies integrate new technologies and methods into their operations. (Consider providing these services through a Manufacturing Innovation Center like Buffalo, New York’s "Buffalo Manufacturing Works", http://buffalomanufacturingworks.com).
4. Facilitate the availability of capital for companies to fund expansion.
5. Foster commercialization of technologies emerging from research by universities in the region.
6. Emphasize companies in the Scaleup Traded Industry Clusters as business attraction targets.
Activities to accelerate expansion of employment in Entrepreneurial Clusters
1. Identify37 and select for innovation and business assistance services existing and startup companies in Entrepreneurial Clusters which are willing to undertake accelerated growth and for which the adoption of new technologies such as 3-D Printing, advanced manufacturing methods, "Big Data", computational modelling, digital manufacturing, high-bandwidth telecommunications, high-performance computing, and robotics could have a transformative effect.
2. Provide innovation and business assistance services to help existing Entrepreneurial Cluster companies accelerate their growth. (Consider providing these services through a Business Accelerator like Butler University’s Butler Business Consulting Group, https://www.butler.edu/consulting).
3. Provide business incubation services to help Entrepreneurial Cluster startup companies become established.
36 Companies in the Scaleup Clusters can be identified by searching a database such as Hoovers or Mergent Intellect and searching for companies in the region whose NAICS codes match a NAICS code in the cluster. 37 Companies in the Entrepreneurial Clusters can be identified by searching a database such as Hoovers or Mergent Intellect and searching for companies in the region whose NAICS codes match a NAICS code in the cluster.

DRAFT 2016-08-05
Northcentral Indiana Regional Development Authority
40
4. Provide technical resources to assist companies with prototyping and designing manufacturing processes for their products. (Consider providing these services through a Manufacturing Innovation Center like Buffalo, New York’s "Buffalo Manufacturing Works", http://buffalomanufacturingworks.com).
5. Foster commercialization of technologies emerging from research by universities in the region.
6. Facilitate the availability of capital to fund expansion of existing companies, establishment of startup companies, and commercialization of technologies emerging from research by universities in the region.
7. Emphasize companies in the Entrepreneurial Traded Industry Clusters as business attraction targets.
Resources
The Strategy Development Team identified several entities and programs as potential Resources for executing the Activities described above. However, because further research will be required to ascertain for each the role it might fulfill and its capability and willingness to do so, we have listed them separately in Appendix C.
Outputs
Outputs from Activities to accelerate expansion of employment in Scaleup Clusters
1. Employment share of Scaleup Clusters (Paper and Packaging, Downstream Chemical Products, Distribution & eCommerce, and Metalworking Technology) increased by a percentage to be determined from the present 12.3%.
2. Higher rankings of the Elkhart-Goshen MSA and South Bend-Mishawaka MSA in Area Development’s "Leading Cities", Forbes' "Best Places for Business and Careers", and Milken Institute’s "Best-Performing Cities" listings.
Outputs from Activities to accelerate expansion of employment in Entrepreneurial Clusters
1. Employment share of Entrepreneurial Clusters (Information Technology and Analytical Instruments, Biopharmaceuticals, Business Services, and Communications Equipment and Services) increased approximately 25% from the present 9.4% to 12%.
2. Employment share of Occupations in national upper quartiles of Average Annual Pay increased approximately 10% from 26.1% to 28.6% (about ½ the difference to the present 31.6% Benchmark MSA Average)
3. Higher rankings of the Elkhart-Goshen MSA and South Bend-Mishawaka MSA in Area Development’s "Leading Cities", Forbes' "Best Places for Business and Careers", and Milken Institute’s "Best-Performing Cities" listings.
Outcomes
1. Greater diversity of industries and occupations providing employment in the region
2. Increased income produced by the regional economy on a per capita and per worker basis

DRAFT 2016-08-05
Northcentral Indiana Regional Development Authority
41
3. Growth in employment, investment, and production within the region because of higher personal income leading to an increased demand for goods and services
4. Net migration into the region by workers--attracted from elsewhere by the availability of high-paid jobs--producing growth in the workforce and population
Better Access to Quality, Skilled Workers
Problem Statement
The availability of quality, skilled workers is insufficient to meet employers' needs because:
a) career path education and workforce preparation is inadequate,
b) the Labor Force Participation Rate is low, and
c) inward migration of highly skilled workers is low.
Goal
Better access to quality, skilled workers.
Rationale
Understanding this problem requires recognition of the following:38
a) Regional labor supply is principally determined by the number of individuals of working age within the region, the Labor Force Participation Rate (the percentage of individuals of working age who are either working or actively seeking work), and worker decisions about the wage rates at which they will work. These decisions about wage rates (and number of hours to be worked) reflect individual worker opportunity cost (or what labor economists call a worker’s "reservation wage"). The reservation wage must equal or exceed the value a worker places on leisure time (plus any transfer payments the worker receives in lieu of working) and must also cover the costs of commuting and living in the region; thus regional transportation systems and housing markets are inputs into labor supply.
b) Labor supply is also influenced by net migration into the region of workers from elsewhere. Workers will be attracted to the region if jobs are available and real wage rates (accounting for the cost of living) are higher in the region relative to elsewhere, or if the region has other attractions such as low housing costs or high quality amenities.
38 Hal Wolman, Alice Levy, and Andrea Sarzynski, "Regional Systems and Regional Economic Growth: A Systems Approach to Understanding the Regional Economy" (Washington, DC: The George Washington Institute of Public Policy, 2011), 6-8

DRAFT 2016-08-05
Northcentral Indiana Regional Development Authority
42
c) The supply of labor can be increased through increases in the Labor Force Participation Rate of individuals already in the region.
d) In addition to balancing the amount of labor demanded and supplied, the regional labor market should work to balance the skills and education needs of businesses with the skills and education levels of available workers. Worker skills and education reflect the "human capital" of the labor which can be produced both from educating workers within the region and by attracting skilled labor from outside of the region. There is a close connection between the education and training systems and labor quality.
Assumptions
1. Effectively implementing the Indiana Career Council’s "Align, Engage, Advance - A Strategic Plan to Transform Indiana’s Workforce" will remedy presently inadequate career path education and workforce preparation.
2. Reducing the factors we have identified as possible obstacles to employment or seeking employment will increase the Labor Force Participation Rate.
Strategies
1. Improve the number of work-ready people.
2. Stimulate inward migration.
Activities
Activities to Increase the Number of Work-Ready People
1. Execute the Indiana Career Council’s "Align, Engage, Advance - A Strategic Plan to Transform Indiana’s Workforce".
2. Encourage adults who did not graduate from high school to take advantage of programs to help them achieve a high school diploma and develop workplace skills.
3. Use "work-and-learn" programs to attract qualified talent (see Indiana Career Council’s publication "A Guide to Talent Attraction and Development for Indiana Employers" at: www.in.gov/icc/files/A_Guide_to_Talent_Attraction_and_Development_for_Hoosier_Employers.pdf)
4. Consider regional common competency assessments for both open positions and potential job candidates.
5. Establish more effective interaction with WorkOne Northern Indiana to improve (a) the matching of potential workers seeking employment with potential employers seeking workers through better job information exchange and (b) the linking of employer needs to potential workers through workforce training institutions and through community college programs such as customized training.
6. Develop clusters of young professionals for in-demand occupations through internship and fellowship programs.

DRAFT 2016-08-05
Northcentral Indiana Regional Development Authority
43
Activities to Stimulate Inward Migration
1. Enhance the region’s "quality of place" by coordinating and improving region-wide land use planning, smart streets and walkability programs, and expansion of cultural and recreational amenities.
2. Deploy RCNI grants to assist in funding quality of place enhancement projects and population attraction projects.
3. Improve marketing and brand of the region, accenting great things in the region and welcoming attitude to other cultures/minorities/immigrants.
4. Consider a campaign to encourage residents to recruit their family members and friends back to the region for existing opportunities. "Dakota Roots", a program by the South Dakota Department of Labor to attract talent back to South Dakota, could be a model for such a campaign (https://dakotarootstest.sd.gov/).
Resources
The Strategy Development Team identified several entities and programs as potential Resources for executing the Activities described above. However, because further research will be required to ascertain for each the role it might fulfill and its capability and willingness to do so, we have listed them separately in Appendix C.
Outputs
Outputs from Activities to Increase the Number of Work-Ready People
1. "High School graduate" share of age 25 - 64 population increased from 35.0% to 38.5% (a 10% increase).
2. "Some college, no degree" share of age 25 - 64 population increased from 20.5% to 22.1% (a 10% increase).
3. "Associate’s degree" share of age 25 - 64 population increased from 7.1% to 8.1% (a 14% increase — ½ the difference to 9.1% Benchmark MSA Average).
4. "Bachelor’s degree" share of age 25 - 64 population increased from 14.3% to 16.1% (a 14% increase — ½ the difference to 18% Benchmark MSA Average)
Outputs from Activities to Stimulate Inward Migration
1. Net Migration percentage of population improved from -1.19% to the +0.0025% Benchmark MSA average.
2. Inward migrants with Some College or an Associate’s Degree increased by at least 12%.
3. Inward migrants with Graduate or professional degree increased by at least 19%.
4. Inward migrants with High School Diploma increased by at least 6%

DRAFT 2016-08-05
Northcentral Indiana Regional Development Authority
44
Outcomes
1. Greater availability of "human capital" to companies in the region produced both by improved work-readiness of workers within the region and by attracting skilled labor from outside of the region
2. Increased growth and profitability of companies in the region enabled by their ability to obtain enough workers with the skills and education levels they need
3. Net migration into the region by workers from elsewhere, producing growth in the workforce and population
4. Growth in employment, investment, and production within the region
Increased Employment and Business Ownership Opportunities for Minority Populations
Problem Statement
Minority populations have insufficient access to economic opportunity.
Goals
1. Less minority unemployment
2. Increased number and size of minority-owned businesses
Rationale
1. The Unemployment Rate for racial and ethnic minorities is above the average of the Benchmark MSAs.
2. Although minority ownership of businesses in our region is above the average of the Benchmark MSAs, increases in the number and size of minority-owned businesses would help the region in retaining, and attracting as inward migrants, a more diverse population.
Assumptions
1. Racial and ethnic minorities will take advantage of programs to help them overcome obstacles to employment.
2. Present and potential minority business owners will take advantage of programs to help them establish or expand businesses.
Strategies
1. Increase minorities' employment opportunity by reducing barriers to their employment.
2. Increase the number and size of minority-owned businesses by reducing barriers and providing business assistance.

DRAFT 2016-08-05
Northcentral Indiana Regional Development Authority
45
Activities
Activities to Increase Minorities' Employment
1. Expand the availability of programs to help workers master not only occupational skills but also other work-related skills such as communication, problem solving, and dealing with supervisors and coworkers (like the Georgia Youth Apprenticeship Program, http://www.gadoe.org).
2. Examine the availability of public transportation between Census Tracts where a large share of the population consists of minorities and the locations of their most-likely potential employers and, to the extent feasible, remedy any deficiencies.
3. Expand the availability of programs to overcome cultural or language barriers to seeking employment.
4. Nurture and mentor minority-owned nonemployer firms to grow into employer firms.
Activities to Increase the Number and Size of Minority-Owned Businesses
1. Acknowledge and address institutional bias and how racial and ethnic differences can affect business opportunities. For example, multiple studies document higher loan application rejection rates among minority business enterprises (MBEs), compared with equally creditworthy White-owned firms. When MBEs do receive bank financing, they get smaller loans than Whites do39.
2. Bridge the language divide, translating chamber of commerce and economic development corporation websites into native languages.
3. Align racial- and ethnic-oriented chambers such as Black and Latino businesses leaders to access needed resources such as leadership roundtables.
4. Evaluate the feasibility of assisting startup and small minority-owned businesses by establishing a region-wide Community Development Venture Capital Fund (see http://cdvca.org).
5. Using Cleveland’s "Minority Business Accelerator 2.5+" as a model, create a region-wide minority business accelerator to help established minority-owned businesses expand and prosper by: (a) Minority business development - growing the number, size, and infrastructure of existing medium-to-large minority-owned businesses (annual revenue of at least $2.5 million) that offer products or services in one of five target industries: construction, manufacturing, information technology, financial services or healthcare (which research has shown tend to hire more minority individuals) and (b) corporate supplier diversity development - strengthening and expanding large companies’ supplier diversity programs.
6. Launch in the region's urbanized areas a "Cleveland Model" type of community wealth-building initiative to increase opportunities for anchor institutions (such as cultural institutions, health care facilities, faith-based institutions, public utilities, and municipal governments) to purchase goods and services locally, and help minority-owned
39 Timothy Bates and Alicia Robb, "Impacts of Owner Race and Geographic Context on Access to Small-Business Financing", Economic Development Quarterly May 2016 vol. 30 no. 2, 159-170

DRAFT 2016-08-05
Northcentral Indiana Regional Development Authority
46
businesses increase their capacity to meet these needs. (http://community-wealth.org/content/cleveland-model-how-evergreen-cooperatives-are-building-community-wealth).
Resources
The Strategy Development Team identified several entities and programs as potential Resources for executing the Activities described above. However, because further research will be required to ascertain for each the role it might fulfill and its capability and willingness to do so, we have listed them separately in Appendix C.
Outputs
Outputs from Activities to Increase Minorities' Employment
1. Labor Force Participation Rate of African-Americans increased from 62.9% to 63.6% (a 1.1% increase — ¼ the difference to the 65.6% LFPR of Total Population Age 16 and Over)
2. Unemployment Rate of African-Americans reduced from 20.4% to 18.8% (a 7.8% decrease — ¼ the difference to 14% Benchmark MSA average)
3. Unemployment Rate of Hispanics reduced from 14.9% to 13.6% (an 8.7% decrease — ¼ the difference to 9.7% Benchmark MSA average)
Outputs from Activities to Increase the Number and Size of Minority-Owned Businesses
1. Number of minority-owned business firms increased from 12.8% to 14% of all business firms (a 10% increase).
2. Number of minority-owned business firms with paid employees increased from 6.1% to 6.7% of all business firms (a 10% increase).
3. Average number employed by minority-owned business firms with paid employees increased from 13 to 15 (a 15% increase).
Outcomes
1. Increased employment, income, and economic well-being for African-American and Hispanic populations within the region
2. Increased growth and profitability of minority-owned companies
3. Growth in employment, investment, and production within the region
4. Increased racial and ethnic diversity of the region's population

DRAFT 2016-08-05
Northcentral Indiana Regional Development Authority
47
MOBILIZING TO IMPLEMENT THE PROGRAMS FOR IMPROVEMENT
The Need for a Regional Economic Development Body
As stated in the Introduction, we intend this "Plan for Prosperity, Growth and Inclusion, Version 1.0" to begin an evolving process and to launch a coordinated endeavor to assess, manage, and improve Northcentral Indiana's economy. We mean it to stimulate and give direction to ongoing discussion about how to make the most of the region's existing assets and nurture development of the new assets needed to achieve future improvement. We have provided in this Plan a set of goals and an initial set of strategies for which—with further research and deliberation—actionable initiatives will be able to be executed. However, in order for the intended process to be implemented, a strong regional economic development body will be needed.
Unlike the Benchmark MSAs and other economic regions such as Chicago and Indianapolis, that concentrate around a single major city, the Northcentral Indiana region consists of three counties in which there are three cities with population more than 50,000 and over 20 smaller cities and towns. The larger cities in the region each have an economic development department and an economic development corporation operates in each of the three counties. Each has its own strategy for attracting and retaining jobs, with little coordination across the region and frequent competition between localities. This horizontal fragmentation is understandable because, while from a regional perspective it matters little where within the region economic activity locates, it matters deeply to individual local governments that receive a property tax yield only if the activity locates within their boundaries. Localities, therefore, have an incentive to compete with one another to be the "winner" in the location decisions of new development projects.
Nevertheless, parochial interests will have to be overcome in order to implement this Plan. There are many issues involved, including land use planning, workforce skills development, transportation planning and investment, environmental quality, communications infrastructure, and quality of place. A regional economic development body is needed to induce cooperation and collaboration among local governments and actors. A regional economic development body also could help the region's smaller communities, whose means are limited, connect with economic opportunities in the region and align their efforts with the strategic needs of the region.
Functions of a Regional Economic Development Body
The Strategy Development Team recommends that the Regional Development Authority designate an entity to be a regional economic development body that would operate under its auspices. The functions of the regional economic development body should include the following:

DRAFT 2016-08-05
Northcentral Indiana Regional Development Authority
48
1. Program implementation -- Implementing the Programs for Improvement set forth in this Plan by:
a) performing further research and deliberation to produce a set of Activities to implement the Strategies, decide the Resources to be used for executing the Activities, and determine the Outputs—targeted values of indicators related to each of the Activities—by which to measure progress;
b) developing the project plan, timetable, and responsible party assignments for executing the Activities; and
c) managing execution of the Activities.
2. Plan evolution -- Driving the evolution of this Plan to effect the ongoing coordinated endeavor to continually assess, manage, and improve Northcentral Indiana's economy.
3. Convening key regional actors and creating collaborations -- Encouraging greater regional activity by creating, supporting or facilitating networks that bring together the potential actors in the region concerned with economic growth, including local governments, local economic development corporations, local land use planning agencies, agencies of the State of Indiana (such as Indiana Economic Development Corporation, Indiana Procurement Technical Assistance Center, Northern Indiana Small Business Development Center, and WorkOne Northern Indiana), K–12 education institutions, postsecondary education institutions, elected officials, Elevate Ventures, Innovation Park at Notre Dame, Ignition Park, the Michiana Area Council of Governments, local foundations, local non-profits, and local civic organizations to discuss regional strategies and how they might be implemented.
4. Creating a platform for public-private collaboration on regional economic strategy -- Aggregating public planning and development goals, and conveying that information to developers and businesses looking to expand their operations. This should include:
a) fostering dialogue between businesses, local government, local economic development organizations, key stakeholders, and regional agencies about changing needs and new strategies related to workforce, infrastructure, communications connectivity, and related issues;
b) helping local governments create consistent business permitting guidelines across jurisdictions and streamlining development permitting processes;
c) serving as the regional clearinghouse on land availability, zoning permitting, and local development;
d) serving as the regional clearinghouse for "leads" received from the Indiana Economic Development Corporation, and
e) assisting businesses looking to expand within or enter the region through site selection services and consulting.
5. Marketing the region -- Communicating the region's attractiveness to businesses, investors, and potential inward migrants and expanding awareness of its brand, its distinct assets, its diversity of locations for business activities, and its innovation ecosystem.

DRAFT 2016-08-05
Northcentral Indiana Regional Development Authority
49
6. Directly encouraging collaboration – Directly encouraging local governments and local economic development organizations to engage in cooperative activity by applying jointly for state, federal, and philanthropic grants.
Funding a Regional Economic Development Body
Linked to the designation of an entity to be the regional economic development body is deciding its funding model. Whereas county- or city-specific economic development organizations are often provided substantial funding by local government, a regional organization would have no counterpart regional government entity with taxing authority to act as a funding source.
A key finding of a study of 10 regions participating in the Brookings-Rockefeller Project on State and Metropolitan Innovation (an effort designed to advance a new model of economic development that achieves better results for more people and communities) is that it takes a sustained, comprehensive effort over many years to make lasting improvements in a regional economy. Yet, most of the innovative economic development work in the United States is grant funded, typically in small chunks, for a limited duration, restricted to particular programs, and often focused on short-term results.
The disconnect between short-term, programmatic funding and the need for long-term, systemic change is creating a predicament for regional partnerships, forcing them to cobble together enough short-term grants to keep their innovative efforts going long enough to make a lasting difference. Their heavy reliance on grant funding is also making it difficult to retain core staff, who are critical to holding the pieces together and keeping the work moving in the right direction.
In those 10 regions, the most common approach is to house their core functions and staff in a chamber of commerce or local economic development organization that has strong, stable support from private sector members, along with a willingness to redirect some of that revenue stream to the regional entity. However, those efforts have often come up short of what is needed, particularly when trying to expand the work.40
Hence, a different approach should be used in Northcentral Indiana for funding an organization to implement the region's strategies.
One would be the approach used by the Northeast Indiana Partnership. This is to solicit contributions directly from "investors" and, in addition, create a foundation dedicated to supporting the regional economic development organization, which separately solicits contributions. The Northeast Indiana Partnership's 2014 Annual Report lists 120 investors contributing $10,000 or more annually and 30 investors contributing less than $10,000 annually, and its total assets were $1,415,318. Its Northeast Indiana Foundation, Inc., ("NIF"), formed in 2005, is a 501(c)(3) Type 1 supporting organization to the Northeast Indiana
40 Pete Carlson, "Funding for Regional Growth", (Washington, D.C., Brookings Institution 2015), Metropolitan Innovations Series Number 28 of 34

DRAFT 2016-08-05
Northcentral Indiana Regional Development Authority
50
Regional Partnership under section 509(a)(3) of the Internal Revenue Code. NIF's 2014 Annual Report lists 50 donors and its total assets were $1,680,588.
Another approach would be to pool funds from local foundations, similar to what the Fund for Our Economic Future does in Northeast Ohio. The Fund for Our Economic Future ("Fund") was launched in 2004 by the community foundations in several counties and a set of other philanthropic institutions from across Northeast Ohio. Its mission was to promote a regional approach for increasing economic prosperity and opportunity. The original 28 Fund members committed a total of $30 million over three years to begin restoring regional economic competitiveness through pooled grant-making, research, and convening. This regional collaboration has grown in strength over time. Presently, the Fund includes over 50 members, which now are not only philanthropic institutions but also businesses, nonprofits, governmental entities, and higher education institutions. Funders have pooled more than $90 million and invested nearly twice that amount through economic development grants made by their individual organizations, including $141 million in grants in 2011 and 2012. In addition, the Fund has helped the region attract more than $100 million in federal and state support for its strategies.

DRAFT 2016-08-05
Northcentral Indiana Regional Development Authority
51
APPENDIX A: SELECTION OF BENCHMARK REGIONS
The Strategy Development Team decided to compare Northcentral Indiana's economic performance to Metropolitan Statistical Areas (MSAs) that are performing better in at least one key measure: Per Capita Personal Income as a percentage of U.S. Per Capita Personal Income. Our reasoning was that comparing to regions performing better in Per Capita Personal Income would help decide the levels of other performance measures that would be improvements our region might reasonably aspire to achieving.
In addition to the MSA's Per Capita Personal Income, our other selection criteria were:
1. MSA's primary state is not an East Coast state, Sun Belt state, or West Coast state
2. MSA does not encompass a state capital city
3. MSA's population in 2014 was between 200,000 and 1,000,000
4. MSA's Compound Annual Growth Rate of Real GDP Per Worker 2004-2014 was positive
5. MSA's Manufacturing industry accounted for more than 14% of total employment in 2014 (We used 14% because that is the lowest percentage of Manufacturing employment in any of Northcentral Indiana's three counties.)
Thirteen Metropolitan Areas met these criteria:
Appleton, WI Lancaster, PA
Canton, OH Lexington, KY
Cedar Rapids, IA Peoria, IL
Davenport-Moline-Rock Island, IA-IL Toledo, OH
Fort Wayne, IN Wichita, KS
Green Bay, WI York, PA
Kalamazoo, MI
Based on a review of the economic performance measures in Table A-1 below and profiles of these 13 Metropolitan Areas prepared for us by enFocus Fellows, the Strategy Development Team voted to select as our "Benchmark MSAs" Appleton, WI; Cedar Rapids, IA; Lancaster, PA; Wichita, KS; and York, PA.
Table A-2 below shows the economic performance measures for Northcentral Indiana and the five selected Benchmark MSAs.

Pe
rfo
rman
ce M
eas
ure
NCI
Appleton
Canton
Cedar
Rapids
Davenport
Ft Wayne
Green Bay
Kalamazoo
Lancaster
Lexington
Peoria
Toledo
Wichita
York
Per
Cap
ita
Pe
rso
nal
Inco
me
as
a %
of
U.S
. Pe
r C
apit
a P
ers
on
al In
com
e8
4.3
95
.12
87
.01
00
.79
4.9
85
.79
7.2
86
.09
0.6
91
.79
5.3
88
.29
8.4
93
.5
Co
mp
en
sati
on
of
Emp
loye
es
Pe
r
Wo
rke
r as
a %
of
U.S
. Co
mp
en
sati
on
of
Emp
loye
es
Pe
r W
ork
er
82
.08
5.2
80
.19
1.5
90
.28
1.9
89
.08
9.4
82
.48
5.6
10
0.6
87
.98
6.6
87
.0
Ave
rage
No
nfa
rm P
rop
rie
tor
Inco
me
as
a %
of
U.S
. Ave
rage
No
nfa
rm
Pro
pri
eto
r In
com
e1
14
.77
6.6
81
.88
8.3
94
.21
02
.51
02
.06
7.9
10
4.0
10
3.8
66
.41
07
.01
24
.76
6.7
Re
al G
DP
Pe
r W
ork
er
(2
00
9 C
hai
ne
d $
)8
3,1
45
70
,30
57
0,0
36
93
,14
77
8,8
69
72
,40
87
7,0
83
74
,61
27
0,8
51
74
,09
48
5,4
00
80
,42
87
0,3
00
70
,08
7
Co
mp
ou
nd
An
nu
al G
row
th R
ate
of
Re
al G
DP
Pe
r W
ork
er
20
04
- 2
01
41
.76
0.2
20
.83
1.9
40
.71
0.6
30
.24
0.0
70
.33
0.0
41
.41
1.0
20
.35
0.0
8
Pri
me
Age
Em
plo
yme
nt
Rat
io7
3.4
81
.47
1.6
80
.67
4.9
79
.57
7.5
71
.07
6.5
73
.57
3.4
70
.57
4.5
75
.9
Per
cen
tage
of
po
pu
lati
on
livi
ng
in p
ove
rty
16
.78
.31
5.1
9.5
13
.11
4.7
11
.41
9.1
10
.61
7.5
13
.01
9.2
16
.11
0.3
Rat
io o
f Em
plo
yme
nt
Gro
wth
Rat
e t
o
Po
pu
lati
on
Gro
wth
Rat
e
-0.3
30
.65
-1.7
81
.29
0.2
50
.33
0.5
1-0
.31
0.7
30
.79
0.6
21
.90
0.7
90
.55
Sou
rces
: U
.S. B
ure
au
of
Eco
no
mic
An
aly
sis,
U.S
. Bu
rea
u o
f La
bo
r St
ati
stic
s, a
nd
U.S
. Cen
sus
Bu
rea
u
Tab
le A
-1:
No
rth
cen
tral
In
dia
na
Reg
ion
an
d P
ote
nti
al B
ench
mar
k M
etro
po
litan
Are
as
Northcentral Indiana Regional Development Authority 52

Pe
rfo
rman
ce M
eas
ure
NC
IA
pp
leto
n
Ce
dar
Rap
ids
Lan
cast
er
Wic
hit
a
Yo
rk-
Han
ove
r
Per
Cap
ita
Pe
rso
nal
Inco
me
as
a p
erc
en
tage
of
U.S
. Pe
r C
apit
a P
ers
on
al In
com
e8
4.3
95
.11
00
.79
0.6
98
.49
3.5
Co
mp
en
sati
on
of
Emp
loye
es
Pe
r W
ork
er
as a
per
cen
tage
of
U.S
. Co
mp
en
sati
on
of
Emp
loye
es
Pe
r W
ork
er
82
.08
5.2
91
.58
2.4
86
.68
7.0
Ave
rage
No
nfa
rm P
rop
rie
tor
Inco
me
as
a p
erce
nta
ge o
f
U.S
. Ave
rage
No
nfa
rm P
rop
rie
tor
Inco
me
11
4.7
76
.68
8.3
10
4.0
12
4.7
66
.7
Re
al G
DP
Pe
r W
ork
er
(in
20
09
Ch
ain
ed
Do
llars
)$
83
,14
5$
70
,30
5$
93
,14
7$
70
,85
1$
70
,30
0$
70
,08
7
Co
mp
ou
nd
An
nu
al G
row
th R
ate
of
Re
al G
DP
Pe
r W
ork
er
20
04
- 2
01
41
.76
0.2
21
.94
0.3
30
.35
0.0
8
Pri
me
Age
Em
plo
yme
nt
Rat
io7
3.4
81
.48
0.6
76
.57
4.5
75
.9
Per
cen
tage
of
po
pu
lati
on
livi
ng
in p
ove
rty
16
.78
.39
.51
0.6
16
.11
0.3
Rat
io o
f Em
plo
yme
nt
Gro
wth
Rat
e t
o
Po
pu
lati
on
Gro
wth
Rat
e
-0.3
30
.65
1.2
90
.73
0.7
90
.55
Sou
rces
: U
.S. B
ure
au
of
Eco
no
mic
An
aly
sis,
U.S
. Bu
rea
u o
f La
bo
r St
ati
stic
s, a
nd
U.S
. Cen
sus
Bu
rea
u
Tab
le A
-2:
Eco
no
mic
Per
form
ance
Mea
sure
sN
ort
hce
ntr
al In
dia
na
Re
gio
n a
nd
Be
nch
mar
k M
etr
op
olit
an A
reas
Northcentral Indiana Regional Development Authority 53

DRAFT 2016-08-05
Northcentral Indiana Regional Development Authority
54
APPENDIX B: DATA TABLES

PR
%ER
%U
R%
PR
%ER
%U
R%
PR
%ER
%U
R%
PR
%ER
%U
R%
PR
%ER
%U
R%
PR
%ER
%U
R%
20
14
65
.65
9.3
9.6
71
.16
7.9
4.5
69
.76
6.1
5.1
66
.66
2.1
6.7
67
.16
1.4
7.7
67
.46
1.7
8.3
20
10
67
.36
0.9
9.5
73
.26
9.2
5.4
70
.36
6.8
4.9
67
.06
3.2
5.7
69
.36
3.7
7.3
68
.66
4.1
6.4
20
08
68
.16
3.3
7.0
73
.77
0.1
4.8
70
.56
7.1
4.7
67
.16
4.3
4.0
69
.76
5.1
5.8
69
.06
5.7
4.7
20
14
80
.07
3.4
8.2
84
.88
1.4
3.9
84
.08
0.6
4.0
81
.17
6.5
5.6
80
.27
4.5
6.4
81
.47
5.9
6.6
20
10
81
.57
4.8
8.2
86
.08
2.2
4.3
84
.18
0.8
3.9
81
.17
7.4
4.5
81
.67
6.1
5.9
81
.87
7.6
5.0
20
08
81
.97
7.1
5.7
85
.98
3.0
3.4
83
.48
0.2
3.8
81
.17
8.5
3.2
81
.57
7.2
4.6
82
.27
9.2
3.5
20
14
41
.92
7.5
25
.15
3.2
48
.09
.75
2.4
44
.51
5.2
51
.84
1.3
20
.14
5.2
35
.02
2.1
48
.63
5.1
27
.7
20
10
45
.43
4.2
25
.05
8.7
49
.91
5.0
56
.14
7.7
14
.95
3.2
44
.31
6.7
52
.54
0.6
22
.35
2.7
41
.22
1.7
20
08
47
.03
7.3
20
.66
3.1
53
.21
5.6
59
.55
0.3
15
.45
3.6
46
.21
3.9
55
.34
4.8
18
.75
4.5
45
.31
6.8
20
14
75
.06
3.4
15
.48
3.1
76
.77
.78
4.6
76
.89
.37
8.8
71
.19
.78
0.4
69
.51
2.1
80
.76
8.8
14
.7
20
10
73
.76
3.5
13
.88
5.6
77
.49
.58
3.7
76
.97
.78
0.4
73
.48
.58
2.9
72
.61
1.1
81
.87
2.5
11
.1
20
08
74
.06
5.6
11
.18
5.0
76
.59
.98
3.8
78
.06
.17
9.8
74
.96
.18
3.6
75
.58
.68
0.0
72
.68
.8
20
14
84
.27
6.1
9.5
89
.38
5.7
3.9
88
.18
4.3
4.2
84
.27
9.1
5.8
84
.47
7.3
7.1
86
.07
9.6
7.2
20
10
84
.47
6.5
9.3
89
.48
5.6
4.1
88
.48
4.7
4.1
83
.77
9.1
5.3
85
.57
8.8
6.6
86
.28
1.2
5.6
20
08
84
.47
9.0
6.3
89
.48
6.1
3.6
87
.48
3.6
4.2
83
.37
9.9
4.0
85
.57
9.8
5.5
86
.38
2.5
4.2
20
14
82
.07
6.4
6.8
87
.58
4.4
3.5
86
.78
3.1
4.0
84
.37
9.4
5.8
83
.17
7.9
6.0
85
.07
9.8
6.0
20
10
84
.47
7.8
7.7
71
.46
6.8
6.3
71
.26
8.9
3.2
70
.36
8.1
3.1
69
.16
6.0
4.5
67
.76
4.7
4.5
20
08
84
.67
9.7
5.8
90
.18
7.8
2.6
86
.18
3.0
3.6
85
.98
3.5
2.8
83
.17
9.4
4.2
85
.48
3.0
2.7
20
14
69
.36
4.7
6.6
71
.46
8.1
4.6
72
.26
9.8
3.3
71
.66
8.3
4.7
68
.16
4.7
5.0
68
.76
4.4
6.3
20
10
71
.46
7.0
6.2
71
.46
6.8
6.3
71
.26
8.9
3.2
70
.36
8.1
3.1
69
.16
6.0
4.5
67
.76
4.7
4.5
20
08
71
.86
8.8
4.1
69
.86
6.8
4.2
69
.36
7.5
2.7
69
.46
8.4
1.5
69
.06
7.0
2.8
68
.56
6.5
3.0
25
to
44
ye
ars
45
to
54
ye
ars
55
to
64
ye
ars
Tota
l po
pu
lati
on
16
ye
ars
& o
ver
Pri
me
Wo
rkin
g A
ge (
25
- 6
4)
Age
16
to
19
ye
ars
20
to
24
ye
ars
Tab
le B
-1: L
abo
r Fo
rce
Par
tici
pat
ion
Rat
e, U
ne
mp
loym
en
t R
ate
an
d E
mp
loym
en
t R
atio
No
rth
cen
tral
Ind
ian
a R
egi
on
an
d B
en
chm
ark
Me
tro
po
litan
Are
as
Att
rib
ute
NC
IA
pp
leto
nC
ed
ar R
apid
sLa
nca
ste
rW
ich
ita
Yo
rk-H
ano
ver
Northcentral Indiana Regional Development Authority 55

PR
%ER
%U
R%
PR
%ER
%U
R%
PR
%ER
%U
R%
PR
%ER
%U
R%
PR
%ER
%U
R%
PR
%ER
%U
R%
20
14
24
.52
5.8
6.2
20
.82
0.1
3.2
25
.92
4.8
4.2
31
.83
0.6
3.9
26
.22
5.0
4.6
27
.52
6.0
5.2
20
10
28
.62
4.1
5.3
22
.22
1.0
5.3
24
.82
4.1
2.9
29
.62
8.4
4.1
26
.72
4.8
3.5
26
.52
4.0
5.5
20
08
29
.12
4.9
3.9
21
.92
0.9
4.4
25
.62
5.0
2.3
27
.82
7.3
2.0
27
.22
6.3
3.2
26
.92
5.8
4.3
20
14
6.2
6.1
3.0
4.5
4.5
0.3
6.2
6.1
1.5
8.0
7.7
3.0
6.6
6.4
3.0
6.6
6.3
4.4
20
10
6.6
6.4
3.1
4.0
3.9
2.7
5.6
5.5
1.4
7.5
7.1
4.4
6.8
6.6
3.7
6.1
5.8
5.0
20
08
6.5
6.3
3.3
5.2
4.9
5.4
6.3
6.2
1.6
7.1
6.8
3.6
7.6
7.3
3.6
5.1
4.9
2.9
20
14
65
.66
0.0
8.6
71
.26
8.0
4.4
69
.86
6.4
4.8
66
.76
2.5
6.2
67
.16
2.2
6.5
67
.76
2.7
7.3
20
10
67
.36
1.5
8.5
73
.56
9.7
5.1
70
.36
7.0
4.6
66
.96
3.4
5.1
69
.16
4.4
6.1
68
.96
4.9
5.7
20
08
68
.06
3.9
6.0
74
.07
0.6
4.6
70
.56
7.3
4.4
67
.16
4.7
3.5
69
.66
5.7
5.0
69
.16
6.2
4.1
20
14
62
.95
0.1
20
.45
8.5
54
.07
.76
3.6
55
.21
3.2
66
.85
6.8
14
.96
4.1
52
.81
6.2
63
.15
1.4
18
.2
20
10
64
.35
1.6
19
.56
9.4
50
.52
7.2
65
.95
5.3
16
.26
8.3
56
.71
6.9
67
.35
3.9
18
.66
7.8
58
.61
3.5
20
08
63
.75
3.8
14
.9N
.A.
N.A
.N
.A.
65
.95
6.5
14
.36
3.7
53
.41
6.1
66
.45
5.5
15
.86
8.8
59
.81
3.1
20
14
69
.06
6.1
4.2
68
.66
6.2
3.6
70
.46
7.7
3.9
66
.16
3.9
3.4
69
.46
2.0
10
.26
7.3
61
.48
.9
20
10
67
.36
2.6
6.8
69
.36
5.1
6.0
72
.26
9.1
4.2
63
.96
1.0
4.5
72
.46
5.6
9.1
68
.16
2.2
8.4
20
08
N.A
.N
.A.
N.A
.N
.A.
N.A
.N
.A.
N.A
.N
.A.
N.A
.N
.A.
N.A
.N
.A.
73
.16
8.1
6.3
N.A
.N
.A.
N.A
.
20
14
66
.55
8.3
11
.36
4.3
58
.68
.86
3.2
61
.52
.76
2.8
61
.02
.96
9.8
59
.01
4.8
52
.85
1.8
1.7
20
10
64
.25
5.8
14
.56
5.5
56
.11
4.4
69
.16
4.3
7.0
74
.66
4.2
14
.06
8.0
61
.98
.76
4.4
64
.40
.0
20
08
N.A
.N
.A.
N.A
.6
5.5
56
.91
3.1
N.A
.N
.A.
N.A
.N
.A.
N.A
.N
.A.
68
.16
3.3
6.5
N.A
.N
.A.
N.A
.
20
14
79
.67
5.9
3.7
86
.48
6.4
0.0
10
0.0
10
0.0
0.0
37
.93
7.9
0.0
72
.66
1.1
15
.99
0.5
90
.50
.0
20
10
64
.35
0.5
13
.81
00
.01
00
.00
.01
00
.01
00
.00
.07
8.9
78
.90
.08
6.8
48
.04
4.7
31
.63
1.6
0.0
20
08
N.A
.N
.A.
N.A
.N
.A.
N.A
.N
.A.
N.A
.N
.A.
N.A
.N
.A.
N.A
.N
.A.
N.A
.N
.A.
N.A
.N
.A.
N.A
.N
.A.
Asi
an
A
me
rica
n In
dia
n a
nd
Ala
ska
Nat
ive
N
ativ
e H
awai
ian
an
d O
the
r P
acif
ic Is
lan
de
r
65
to
74
ye
ars
75
ye
ars
and
ove
r
Rac
e a
nd
His
pan
ic o
r La
tin
o
Wh
ite
Bla
ck o
r A
fric
an A
me
rica
n
Tab
le B
-1: L
abo
r Fo
rce
Par
tici
pat
ion
Rat
e, U
ne
mp
loym
en
t R
ate
an
d E
mp
loym
en
t R
atio
(co
nti
nu
ed
)N
ort
hce
ntr
al In
dia
na
Re
gio
n a
nd
Be
nch
mar
k M
etr
op
olit
an A
reas
Att
rib
ute
NC
IA
pp
leto
nC
ed
ar R
apid
sLa
nca
ste
rW
ich
ita
Yo
rk-H
ano
ver
Northcentral Indiana Regional Development Authority 56

PR
%ER
%U
R%
PR
%ER
%U
R%
PR
%ER
%U
R%
PR
%ER
%U
R%
PR
%ER
%U
R%
PR
%ER
%U
R%
20
14
72
.06
3.6
11
.47
7.4
71
.08
.37
4.6
70
.85
.16
6.6
56
.01
5.9
70
.56
3.1
10
.26
6.1
50
.52
3.6
20
10
75
.56
6.5
12
.06
8.6
57
.11
6.8
80
.47
8.0
2.9
69
.56
1.6
11
.37
5.1
69
.67
.26
0.2
47
.32
1.1
20
08
N.A
.N
.A.
N.A
.N
.A.
N.A
.N
.A.
N.A
.N
.A.
N.A
.6
5.7
60
.28
.47
5.3
71
.15
.65
5.1
49
.41
0.5
20
14
72
.76
1.8
14
.97
8.2
73
.75
.47
4.5
71
.83
.66
6.7
58
.01
3.1
72
.86
5.1
9.9
64
.85
4.0
16
.5
20
10
75
.26
5.0
13
.77
3.4
68
.86
.27
9.0
75
.24
.86
7.3
58
.81
2.5
74
.26
6.5
9.9
61
.95
1.5
16
.5
20
08
75
.26
7.6
10
.1N
.A.
N.A
.N
.A.
N.A
.N
.A.
N.A
.6
3.6
58
.48
.17
3.9
67
.88
.06
3.5
54
.61
4.0
20
14
73
.66
7.4
8.5
80
.27
7.3
3.6
81
.27
8.3
3.5
74
.47
0.1
5.8
74
.66
9.1
7.2
76
.77
1.6
6.6
20
10
74
.76
8.3
8.6
81
.47
7.8
4.5
80
.57
7.3
3.9
73
.56
9.9
4.8
76
.07
0.8
6.6
76
.77
2.4
5.5
20
08
74
.16
9.3
6.5
81
.57
8.2
4.0
79
.17
6.1
3.8
73
.27
0.5
3.7
75
.37
1.0
5.4
76
.67
3.3
4.3
20
14
85
.27
7.1
9.5
88
.98
4.5
4.9
86
.98
2.0
5.6
87
.48
1.8
6.3
85
.87
8.7
6.9
86
.17
8.8
8.2
20
10
86
.77
8.7
9.1
90
.48
5.6
5.1
87
.68
3.4
4.7
88
.88
4.2
5.1
87
.48
0.7
6.5
86
.98
1.9
5.6
20
08
87
.88
2.2
6.1
90
.08
6.3
4.1
87
.78
3.7
4.3
88
.98
5.9
3.3
88
.18
2.9
4.8
87
.58
4.0
3.8
20
14
58
.83
9.0
33
.66
0.5
49
.01
8.9
61
.14
9.0
19
.85
4.4
40
.82
5.1
58
.54
2.3
27
.65
1.4
34
.03
3.8
20
10
N.A
.N
.A.
N.A
.N
.A.
N.A
.N
.A.
N.A
.N
.A.
N.A
.N
.A.
N.A
.N
.A.
N.A
.N
.A.
N.A
.N
.A.
N.A
.N
.A.
20
08
N.A
.N
.A.
N.A
.N
.A.
N.A
.N
.A.
N.A
.N
.A.
N.A
.N
.A.
N.A
.N
.A.
N.A
.N
.A.
N.A
.N
.A.
N.A
.N
.A.
20
14
42
.63
7.2
21
.15
1.3
46
.01
0.4
50
.74
3.5
14
.04
5.7
37
.71
7.6
46
.03
8.3
16
.24
7.8
40
.31
5.7
20
10
N.A
.N
.A.
N.A
.N
.A.
N.A
.N
.A.
N.A
.N
.A.
N.A
.N
.A.
N.A
.N
.A.
N.A
.N
.A.
N.A
.N
.A.
N.A
.N
.A.
20
08
N.A
.N
.A.
N.A
.N
.A.
N.A
.N
.A.
N.A
.N
.A.
N.A
.N
.A.
N.A
.N
.A.
N.A
.N
.A.
N.A
.N
.A.
N.A
.N
.A.
20
14
64
.15
3.0
17
.46
8.1
60
.81
0.6
67
.76
1.7
8.9
65
.15
9.9
8.1
66
.15
7.1
13
.65
9.5
50
.81
4.7
20
10
68
.45
9.2
13
.67
2.6
64
.61
1.1
65
.65
9.9
8.7
64
.96
0.4
6.9
66
.55
9.0
11
.36
2.3
55
.91
0.3
20
08
70
.06
3.8
8.9
74
.06
9.0
6.8
62
.65
6.2
10
.16
4.2
60
.65
.66
6.5
60
.78
.76
4.7
60
.07
.3
Som
e O
the
r R
ace
His
pan
ic o
r La
tin
o o
rigi
n (
of
any
rac
e)
Sex
- P
op
ula
tio
n a
ge 2
0 t
o 6
4
Fem
ale
Mal
e
Be
low
Po
vert
y
Dis
abili
ty S
tatu
s
Edu
cati
on
al A
ttai
nm
en
t -
Po
pu
lati
on
age
25
to
64
Less
th
an h
igh
sch
oo
l gra
du
ate
Tab
le B
-1: L
abo
r Fo
rce
Par
tici
pat
ion
Rat
e, U
ne
mp
loym
en
t R
ate
an
d E
mp
loym
en
t R
atio
(co
nti
nu
ed
)N
ort
hce
ntr
al In
dia
na
Re
gio
n a
nd
Be
nch
mar
k M
etr
op
olit
an A
reas
Att
rib
ute
NC
IA
pp
leto
nC
ed
ar R
apid
sLa
nca
ste
rW
ich
ita
Yo
rk-H
ano
ver
Northcentral Indiana Regional Development Authority 57

PR
%ER
%U
R%
PR
%ER
%U
R%
PR
%ER
%U
R%
PR
%ER
%U
R%
PR
%ER
%U
R%
PR
%ER
%U
R%
20
14
78
.77
1.4
9.3
82
.27
8.1
5.0
79
.07
4.2
5.9
79
.77
4.4
6.6
75
.16
8.7
8.4
80
.37
3.6
8.3
20
10
80
.67
2.4
10
.18
3.2
79
.05
.07
9.5
75
.35
.38
0.9
77
.04
.77
7.7
71
.57
.88
0.5
75
.85
.8
20
08
80
.87
4.9
7.3
83
.68
0.4
3.9
79
.17
5.3
4.9
81
.47
8.5
3.5
77
.67
2.6
6.3
80
.47
7.2
3.9
20
14
82
.67
5.8
8.1
85
.38
2.2
3.6
85
.48
1.8
4.2
84
.67
9.3
6.2
81
.77
5.3
6.5
85
.68
0.5
5.7
20
10
83
.77
6.5
8.5
87
.58
3.3
4.6
86
.08
2.5
3.9
85
.38
0.6
5.4
83
.57
7.6
5.9
85
.48
1.1
4.9
20
08
84
.87
9.7
5.8
86
.88
3.6
3.5
85
.88
2.4
3.8
85
.98
3.0
3.4
83
.87
9.2
4.5
86
.08
2.8
3.5
20
14
87
.58
4.8
3.2
89
.68
7.5
2.3
88
.88
7.2
1.8
88
.28
5.6
2.9
87
.38
4.0
3.0
86
.48
3.4
3.2
20
10
88
.58
5.8
3.0
90
.18
8.1
2.2
89
.18
7.1
2.2
87
.38
5.2
2.4
88
.28
4.9
2.9
87
.88
5.7
2.3
20
08
88
.08
6.3
1.9
90
.38
8.4
2.0
88
.38
6.4
2.1
87
.48
6.0
1.5
88
.08
5.2
2.3
88
.88
6.9
1.9
N.A
. = d
ata
no
t av
aila
ble
Ce
dar
Rap
ids
Hig
h s
cho
ol g
rad
uat
e (
incl
ud
es
eq
uiv
ale
ncy
)
Som
e c
olle
ge o
r as
soci
ate
's d
egr
ee
Bac
he
lor'
s d
egr
ee
or
hig
he
r
PR
% =
Lab
or
Forc
e P
arti
cip
atio
n R
ate;
ER
% =
Em
plo
ymen
t R
atio
; UR
% =
Un
emp
loym
ent
Rat
e
Ap
ple
ton
Sou
rce:
U.S
. Cen
sus
Bu
rea
u, A
mer
ica
n C
om
mu
nit
y Su
rvey
Lan
cast
er
Wic
hit
a
Tab
le B
-1: L
abo
r Fo
rce
Par
tici
pat
ion
Rat
e, U
ne
mp
loym
en
t R
ate
an
d E
mp
loym
en
t R
atio
(co
nti
nu
ed
)N
ort
hce
ntr
al In
dia
na
Re
gio
n a
nd
Be
nch
mar
k M
etr
op
olit
an A
reas
Yo
rk-H
ano
ver
Att
rib
ute
NC
I
Northcentral Indiana Regional Development Authority 58

Nu
mb
er
Pe
rce
nta
geLQ
1
01
Aer
osp
ace
Veh
icle
s an
d D
efen
se9
25
0.3
4%
0.7
7$
85
,03
32
02
Agr
icu
ltu
ral I
np
uts
an
d S
ervi
ces
21
30
.08
%0
.96
$2
0,1
25
03
Ap
par
el5
00
.02
%0
.17
$3
1,3
87
2
04
Au
tom
oti
ve9
,56
83
.57
%4
.73
$4
2,7
82
05
Bio
ph
arm
aceu
tica
ls2
65
0.1
0%
0.5
0$
85
,28
42
06
Bu
sin
ess
Serv
ices
10
,52
13
.92
%0
.40
$8
1,2
72
07
Co
al M
inin
g0
0.0
0%
0.0
0$
0
08
Co
mm
un
icat
ion
s Eq
uip
men
t an
d S
ervi
ces
32
50
.12
%0
.34
$8
8,4
32
2
09
Co
nst
ruct
ion
Pro
du
cts
and
Ser
vice
s1
,95
10
.73
%1
.07
$3
9,5
04
10
Dis
trib
uti
on
an
d E
lect
ron
ic C
om
mer
ce9
,73
83
.63
%0
.76
$5
1,8
18
11
Do
wn
stre
am C
hem
ical
Pro
du
cts
1,6
20
0.6
0%
2.9
8$
53
,29
82
12
Do
wn
stre
am M
etal
Pro
du
cts
3,9
51
1.4
7%
4.3
3$
33
,26
4
13
Ed
uca
tio
n a
nd
Kn
ow
led
ge C
reat
ion
19
,29
37
.19
%2
.79
$2
2,2
79
14
Ele
ctri
c P
ow
er G
ener
atio
n a
nd
Tra
nsm
issi
on
10
0.0
0%
0.0
3$
99
,27
32
15
En
viro
nm
enta
l Ser
vice
s1
52
0.0
6%
0.7
8$
31
,71
4
16
Fin
anci
al S
ervi
ces
1,3
59
0.5
1%
0.3
2$
45
,84
1
17
Fis
hin
g an
d F
ish
ing
Pro
du
cts
60
0.0
2%
0.6
9$
0
18
Fo
od
Pro
cess
ing
and
Man
ufa
ctu
rin
g1
,88
10
.70
%0
.84
$3
5,2
35
19
Fo
otw
ear
00
.00
%0
.00
$0
20
Fo
rest
ry1
00
.00
%0
.07
$2
7,8
10
2
21
Fu
rnit
ure
5,1
18
1.9
1%
6.8
8$
41
,46
7
22
Ho
spit
alit
y an
d T
ou
rism
2,4
76
0.9
2%
0.3
5$
17
,25
3
23
Info
rmat
ion
Tec
hn
olo
gy a
nd
An
alyt
ical
Inst
rum
ents
1,3
35
0.5
0%
0.5
6$
62
,29
32
24
Insu
ran
ce S
ervi
ces
1,1
65
0.4
3%
0.3
4$
75
,57
32
25
Jew
elry
an
d P
reci
ou
s M
etal
s1
00
.00
%0
.17
$0
26
Lea
ther
an
d R
elat
ed P
rod
uct
s4
95
0.1
8%
7.1
2$
35
,86
42
27
Lig
hti
ng
and
Ele
ctri
cal E
qu
ipm
ent
79
40
.30
%1
.24
$4
6,1
67
Tab
le B
-2:
Emp
loym
en
t an
d A
vera
ge A
nn
ual
Pay
by
Ind
ust
ry C
lust
er
No
rth
cen
tral
Ind
ian
a R
egi
on
Clu
ste
r C
od
e a
nd
Nam
e
Emp
loym
en
tA
vera
ge
Pay
Trad
ed
Clu
ste
rs
Northcentral Indiana Regional Development Authority 59

Nu
mb
er
Pe
rce
nta
geLQ
1
28
Liv
esto
ck P
roce
ssin
g7
90
0.2
9%
0.7
4$
36
,04
42
29
Mar
keti
ng,
Des
ign
, an
d P
ub
lish
ing
80
00
.30
%0
.27
$4
0,4
08
30
Med
ical
Dev
ices
57
10
.21
%0
.99
$3
1,3
13
31
Met
al M
inin
g0
0.0
0%
0.0
0$
0
32
Met
alw
ork
ing
Tech
no
logy
3,7
87
1.4
1%
3.4
2$
47
,72
42
33
Mu
sic
and
So
un
d R
eco
rdin
g1
00
.00
%0
.16
$0
34
No
nm
etal
Min
ing
80
0.0
3%
0.4
4$
53
,34
62
35
Oil
and
Gas
Pro
du
ctio
n a
nd
Tra
nsp
ort
atio
n5
00
.02
%0
.03
$7
4,4
87
2
36
Pap
er a
nd
Pac
kagi
ng
1,2
16
0.4
5%
1.5
2$
54
,81
2
37
Per
form
ing
Art
s8
33
0.3
1%
1.0
6$
18
,00
0
38
Pla
stic
s7
,29
12
.72
%4
.77
$3
7,9
62
39
Pri
nti
ng
Serv
ices
96
50
.36
%0
.88
$4
4,4
86
40
Pro
du
ctio
n T
ech
no
logy
an
d H
eavy
Mac
hin
ery
3,2
43
1.2
1%
1.4
6$
30
,15
5
41
Rec
reat
ion
al a
nd
Sm
all E
lect
ric
Go
od
s1
,01
30
.38
%2
.94
$3
8,1
44
42
Tex
tile
Man
ufa
ctu
rin
g3
14
0.1
2%
0.7
3$
24
,53
3
43
To
bac
co0
0.0
0%
0.0
0$
0
44
Tra
ilers
, Mo
tor
Ho
mes
, an
d A
pp
lian
ces
24
,17
69
.01
%8
3.6
4$
52
,51
3
45
Tra
nsp
ort
atio
n a
nd
Lo
gist
ics
2,7
57
1.0
3%
0.7
5$
44
,97
7
46
Up
stre
am C
hem
ical
Pro
du
cts
39
50
.15
%0
.99
$6
9,1
60
2
47
Up
stre
am M
etal
Man
ufa
ctu
rin
g3
,98
71
.49
%4
.40
$4
0,3
44
48
Vid
eo P
rod
uct
ion
an
d D
istr
ibu
tio
n4
10
.02
%0
.07
$4
6,1
90
49
Vu
lcan
ized
an
d F
ired
Mat
eria
ls1
,60
70
.60
%2
.94
$3
6,3
48
50
Wat
er T
ran
spo
rtat
ion
2,0
02
0.7
5%
2.8
5$
40
,12
7
51
Wo
od
Pro
du
cts
3,5
42
1.3
2%
4.5
6$
38
,04
7
10
1 L
oca
l Fo
od
an
d B
ever
age
Pro
cess
ing
and
Dis
trib
uti
on
6,1
14
2.2
8%
0.6
7$
21
,66
6
10
2 L
oca
l Per
son
al S
ervi
ces
(No
n-M
edic
al)
4,0
60
1.5
1%
0.7
1$
20
,52
1
10
3 L
oca
l Hea
lth
Ser
vice
s2
8,5
98
10
.66
%0
.76
$4
7,4
86
Tab
le B
-2: E
mp
loym
en
t an
d A
vera
ge A
nn
ual
Pay
by
Ind
ust
ry C
lust
er
(co
nti
nu
ed
)N
ort
hce
ntr
al In
dia
na
Re
gio
n
Clu
ste
r C
od
e a
nd
Nam
e
Emp
loym
en
tA
vera
ge
Pay
Trad
ed
Clu
ste
rs (
con
tin
ue
d)
Loca
l Clu
ste
rs
Northcentral Indiana Regional Development Authority 60

Nu
mb
er
Pe
rce
nta
geLQ
1
10
4 L
oca
l Uti
litie
s1
,31
80
.49
%0
.42
$5
7,8
61
10
5 L
oca
l Lo
gist
ical
Ser
vice
s4
,00
91
.49
%0
.82
$4
6,9
87
10
6 L
oca
l Ho
use
ho
ld G
oo
ds
and
Ser
vice
s2
,78
51
.04
%0
.80
$3
0,1
30
10
7 L
oca
l Fin
anci
al S
ervi
ces
4,7
55
1.7
7%
0.7
0$
30
,13
0
10
8 L
oca
l Mo
tor
Veh
icle
Pro
du
cts
and
Ser
vice
s9
,42
53
.51
%1
.03
$3
7,4
03
10
9 L
oca
l Ret
ailin
g o
f C
loth
ing
and
Gen
eral
Mer
chan
dis
e8
,99
33
.35
%0
.84
$1
7,3
78
11
0 L
oca
l En
tert
ain
men
t an
d M
edia
2,8
21
1.0
5%
0.8
7$
23
,41
5
11
1 L
oca
l Ho
spit
alit
y Es
tab
lish
men
ts2
0,3
55
7.5
9%
0.7
7$
12
,57
7
11
2 L
oca
l Co
mm
erci
al S
ervi
ces
14
,57
55
.43
%0
.77
$2
6,5
40
11
3 L
oca
l Ed
uca
tio
n a
nd
Tra
inin
g2
,32
00
.87
%0
.71
$2
5,3
34
11
4 L
oca
l Co
mm
un
ity
and
Civ
ic O
rgan
izat
ion
s8
,48
83
.16
%0
.87
$2
0,0
22
11
5 L
oca
l Rea
l Est
ate,
Co
nst
ruct
ion
, an
d D
evel
op
men
t1
5,0
14
5.6
0%
0.8
3$
46
,62
2
11
6 L
oca
l In
du
stri
al P
rod
uct
s an
d S
ervi
ces
1,8
06
0.6
7%
1.4
9$
52
,04
5
Tab
le B
-2: E
mp
loym
en
t an
d A
vera
ge A
nn
ual
Pay
by
Ind
ust
ry C
lust
er
(co
nti
nu
ed
)N
ort
hce
ntr
al In
dia
na
Re
gio
n
Clu
ste
r C
od
e a
nd
Nam
e
Emp
loym
en
tA
vera
ge
Pay
1LQ
(Lo
cati
on
Qu
oti
ent)
is t
he
rati
o o
f an
ind
ust
ry’s
sh
are
of
tota
l em
plo
ymen
t in
a lo
cati
on
rel
ativ
e to
its
shar
e o
f to
tal n
atio
nal
emp
loym
ent.
Th
e LQ
mea
sure
s th
e sp
ecia
lizat
ion
or
con
cen
trat
ion
of
a cl
ust
er in
a p
arti
cula
r lo
cati
on
rel
ativ
e to
th
e n
atio
nal
ave
rage
. An
LQ >
1 in
dic
ates
a h
igh
er t
han
ave
rage
clu
ster
co
nce
ntr
atio
n in
a lo
cati
on
.2In
dia
na
Ave
rage
Pay
bec
ause
No
rth
cen
tral
Ind
ian
a d
ata
is n
ot
avai
lab
leSo
urc
e: U
.S. C
lust
er M
ap
pin
g P
roje
ct (
htt
p:/
/clu
ster
ma
pp
ing
.us/
), In
stit
ute
fo
r St
rate
gy
an
d C
om
pet
itiv
enes
s, H
arv
ard
Bu
sin
ess
Sch
oo
l. D
ata
So
urc
es
(htt
p:/
/clu
ster
ma
pp
ing
.us/
con
ten
t/d
ata
-so
urc
es-a
nd
-lim
ita
tio
ns)
Loca
l Clu
ste
rs (
con
tin
ue
d)
Northcentral Indiana Regional Development Authority 61

Clu
ste
r C
od
e a
nd
Nam
eN
CI
Ap
ple
ton
Ce
dar
Rap
ids
Lan
cast
er
Wic
hit
a
Yo
rk-
Han
ove
r
01
Aer
osp
ace
Veh
icle
s an
d D
efen
se0
.70
%0
.00
%1
3.2
2%
0.0
1%
35
.32
%0
.02
%
02
Agr
icu
ltu
ral I
np
uts
an
d S
ervi
ces
0.1
6%
0.1
3%
0.1
9%
0.3
5%
0.0
4%
0.0
7%
03
Ap
par
el0
.04
%0
.41
%0
.04
%0
.14
%0
.25
%0
.33
%
04
Au
tom
oti
ve7
.21
%5
.75
%0
.04
%1
.37
%0
.57
%5
.93
%
05
Bio
ph
arm
aceu
tica
ls0
.20
%0
.00
%0
.11
%0
.14
%0
.03
%0
.10
%
06
Bu
sin
ess
Serv
ices
7.9
3%
16
.31
%1
3.6
1%
12
.26
%1
2.9
1%
10
.53
%
07
Co
al M
inin
g0
.00
%0
.00
%0
.00
%0
.00
%0
.00
%0
.00
%
08
Co
mm
un
icat
ion
s Eq
uip
men
t an
d S
ervi
ces
0.2
4%
0.3
9%
1.2
2%
0.5
3%
0.7
8%
0.3
0%
09
Co
nst
ruct
ion
Pro
du
cts
and
Ser
vice
s1
.47
%1
.35
%0
.68
%1
0.6
1%
1.0
3%
2.6
9%
10
Dis
trib
uti
on
an
d E
lect
ron
ic C
om
mer
ce7
.34
%1
0.8
1%
11
.66
%1
4.8
4%
10
.30
%1
6.2
0%
11
Do
wn
stre
am C
hem
ical
Pro
du
cts
1.2
2%
0.1
0%
1.2
0%
0.6
3%
0.4
4%
0.3
1%
12
Do
wn
stre
am M
etal
Pro
du
cts
2.9
8%
1.0
8%
0.6
0%
2.2
8%
0.5
7%
2.9
6%
13
Ed
uca
tio
n a
nd
Kn
ow
led
ge C
reat
ion
14
.53
%4
.28
%6
.02
%6
.69
%3
.18
%4
.03
%
14
Ele
ctri
c P
ow
er G
ener
atio
n a
nd
Tra
nsm
issi
on
0.0
1%
0.1
3%
1.6
4%
0.1
0%
0.0
2%
1.9
5%
15
En
viro
nm
enta
l Ser
vice
s0
.11
%0
.16
%0
.29
%0
.17
%0
.25
%0
.41
%
16
Fin
anci
al S
ervi
ces
1.0
2%
2.4
2%
5.0
7%
1.7
7%
3.7
3%
1.2
4%
17
Fis
hin
g an
d F
ish
ing
Pro
du
cts
0.0
5%
0.0
0%
0.0
0%
0.0
0%
0.0
2%
0.0
0%
18
Fo
od
Pro
cess
ing
and
Man
ufa
ctu
rin
g1
.42
%8
.55
%5
.55
%8
.04
%1
.22
%1
0.0
3%
19
Fo
otw
ear
0.0
0%
0.0
4%
0.0
0%
0.0
2%
0.0
0%
0.0
0%
20
Fo
rest
ry0
.01
%0
.02
%0
.02
%0
.04
%0
.01
%0
.02
%
21
Fu
rnit
ure
3.8
6%
0.3
3%
0.1
6%
2.2
4%
0.8
9%
1.3
8%
22
Ho
spit
alit
y an
d T
ou
rism
1.8
7%
1.9
4%
2.9
1%
4.1
1%
3.8
0%
3.3
4%
23
Info
rmat
ion
Tec
hn
olo
gy a
nd
An
alyt
ical
Inst
rum
ents
1.0
1%
1.3
5%
1.4
4%
1.1
6%
0.7
1%
2.5
3%
24
Insu
ran
ce S
ervi
ces
0.8
8%
4.9
7%
8.3
8%
1.8
3%
0.8
6%
0.3
8%
25
Jew
elry
an
d P
reci
ou
s M
etal
s0
.01
%0
.02
%0
.00
%0
.00
%0
.01
%0
.10
%
26
Lea
ther
an
d R
elat
ed P
rod
uct
s0
.37
%0
.15
%0
.02
%0
.08
%0
.28
%0
.03
%
27
Lig
hti
ng
and
Ele
ctri
cal E
qu
ipm
ent
0.6
0%
0.1
5%
0.2
3%
1.3
4%
0.2
5%
0.5
9%
28
Liv
esto
ck P
roce
ssin
g0
.60
%3
.83
%0
.05
%1
.77
%0
.88
%0
.10
%
29
Mar
keti
ng,
Des
ign
, an
d P
ub
lish
ing
0.6
0%
0.8
4%
4.2
5%
2.8
7%
2.2
0%
1.7
9%
Tab
le B
-3: E
mp
loym
en
t b
y Tr
ade
d In
du
stry
Clu
ste
rN
ort
hce
ntr
al In
dia
na
Re
gio
n a
nd
Be
nch
mar
k M
etr
op
olit
an A
reas
Northcentral Indiana Regional Development Authority 62

30
Med
ical
Dev
ices
0.4
3%
0.0
2%
0.0
0%
0.4
0%
0.0
9%
0.5
2%
31
Met
al M
inin
g0
.00
%0
.00
%0
.00
%0
.00
%0
.00
%0
.00
%
32
Met
alw
ork
ing
Tech
no
logy
2.8
5%
5.1
6%
1.2
9%
1.1
7%
1.0
4%
1.9
2%
33
Mu
sic
and
So
un
d R
eco
rdin
g0
.01
%0
.00
%0
.02
%0
.01
%0
.00
%0
.00
%
34
No
nm
etal
Min
ing
0.0
6%
0.3
9%
0.2
5%
0.2
5%
0.0
9%
0.3
7%
35
Oil
and
Gas
Pro
du
ctio
n a
nd
Tra
nsp
ort
atio
n0
.04
%0
.06
%0
.02
%0
.04
%2
.30
%0
.12
%
36
Pap
er a
nd
Pac
kagi
ng
0.9
2%
6.1
9%
0.9
3%
0.7
9%
0.1
7%
3.9
1%
37
Per
form
ing
Art
s0
.63
%0
.78
%0
.39
%1
.32
%0
.30
%0
.18
%
38
Pla
stic
s5
.49
%2
.73
%0
.78
%3
.19
%2
.70
%3
.03
%
39
Pri
nti
ng
Serv
ices
0.7
3%
3.9
5%
1.0
3%
5.1
9%
1.1
1%
3.8
0%
40
Pro
du
ctio
n T
ech
no
logy
an
d H
eavy
Mac
hin
ery
2.4
4%
5.2
2%
2.0
4%
3.9
9%
6.6
2%
5.6
1%
41
Rec
reat
ion
al a
nd
Sm
all E
lect
ric
Go
od
s0
.76
%0
.13
%0
.14
%0
.12
%0
.14
%3
.56
%
42
Tex
tile
Man
ufa
ctu
rin
g0
.24
%0
.49
%0
.04
%0
.22
%0
.09
%0
.40
%
43
To
bac
co0
.00
%0
.00
%0
.00
%0
.21
%0
.00
%0
.00
%
44
Tra
ilers
, Mo
tor
Ho
mes
, an
d A
pp
lian
ces
18
.21
%0
.04
%0
.11
%0
.49
%0
.06
%0
.32
%
45
Tra
nsp
ort
atio
n a
nd
Lo
gist
ics
2.0
8%
6.7
3%
11
.14
%2
.10
%2
.81
%3
.60
%
46
Up
stre
am C
hem
ical
Pro
du
cts
0.3
0%
0.0
2%
1.6
3%
0.0
1%
0.7
1%
0.4
2%
47
Up
stre
am M
etal
Man
ufa
ctu
rin
g3
.00
%0
.54
%0
.68
%2
.01
%0
.40
%2
.43
%
48
Vid
eo P
rod
uct
ion
an
d D
istr
ibu
tio
n0
.03
%0
.04
%0
.15
%0
.05
%0
.09
%0
.01
%
49
Vu
lcan
ized
an
d F
ired
Mat
eria
ls1
.21
%0
.42
%0
.16
%1
.12
%0
.25
%1
.59
%
50
Wat
er T
ran
spo
rtat
ion
1.5
1%
0.0
0%
0.0
0%
0.0
1%
0.0
0%
0.0
0%
51
Wo
od
Pro
du
cts
2.6
7%
1.5
7%
0.6
4%
1.9
4%
0.4
8%
0.8
4%
Sou
rce:
U.S
. Clu
ster
Ma
pp
ing
Pro
ject
(h
ttp
://c
lust
erm
ap
pin
g.u
s/)
Tab
le B
-3: E
mp
loym
en
t b
y Tr
ade
d In
du
stry
Clu
ste
rN
ort
hce
ntr
al In
dia
na
Re
gio
n a
nd
Be
nch
mar
k M
etr
op
olit
an A
reas
Clu
ste
r N
ame
NC
IA
pp
leto
n
Ce
dar
Rap
ids
Lan
cast
er
Wic
hit
a
Yo
rk-
Han
ove
r
Northcentral Indiana Regional Development Authority 63

Nu
mb
er
Pe
rce
nta
ge2
LQ3
All
Occ
up
atio
ns
24
5,4
30
10
0.0
0%
1.0
0$
39
,43
1
Man
agem
ent
Occ
up
atio
ns
10
,73
04
.37
%0
.88
$9
2,3
70
Bu
sin
ess
and
Fin
anci
al O
per
atio
ns
Occ
up
atio
ns
7,4
30
3.0
3%
0.6
0$
61
,46
0
Co
mp
ute
r an
d M
ath
emat
ical
Occ
up
atio
ns
2,4
20
0.9
9%
0.3
5$
59
,63
0
Arc
hit
ectu
re a
nd
En
gin
eeri
ng
Occ
up
atio
ns
3,4
40
1.4
0%
0.7
8$
64
,29
0
Life
, Ph
ysic
al, a
nd
So
cial
Sci
ence
Occ
up
atio
ns
1,1
30
0.4
6%
0.5
4$
51
,77
0
Co
mm
un
ity
and
So
cial
Ser
vice
Occ
up
atio
ns
2,8
00
1.1
4%
0.8
0$
43
,09
0
Lega
l Occ
up
atio
ns
93
00
.38
%0
.49
$7
3,8
10
Edu
cati
on
, Tra
inin
g, a
nd
Lib
rary
Occ
up
atio
ns
13
,81
05
.62
%0
.90
$4
9,7
70
Art
s, D
esig
n, E
nte
rtai
nm
ent,
Sp
ort
s, a
nd
Med
ia O
ccu
pat
ion
s2
,62
01
.07
%0
.80
$4
3,5
70
Hea
lth
care
Pra
ctit
ion
ers
and
Tec
hn
ical
Occ
up
atio
ns
11
,91
04
.85
%0
.83
$7
1,4
00
Hea
lth
care
Su
pp
ort
Occ
up
atio
ns
5,7
90
2.3
6%
0.8
1$
27
,23
0
Pro
tect
ive
Serv
ice
Occ
up
atio
ns
4,3
90
1.7
9%
0.7
3$
39
,05
0
Foo
d P
rep
arat
ion
an
d S
ervi
ng
Rel
ated
Occ
up
atio
ns
20
,41
08
.31
%0
.91
$2
0,8
10
Bu
ildin
g an
d G
rou
nd
s C
lean
ing
and
Mai
nte
nan
ce O
ccu
pat
ion
s6
,32
02
.57
%0
.80
$2
5,9
60
Per
son
al C
are
and
Ser
vice
Occ
up
atio
ns
6,6
10
2.6
9%
0.8
8$
22
,39
0
Sale
s an
d R
elat
ed O
ccu
pat
ion
s2
2,2
50
9.0
6%
0.8
6$
36
,69
0
Off
ice
and
Ad
min
istr
ativ
e Su
pp
ort
Occ
up
atio
ns
32
,86
01
3.3
8%
0.8
4$
32
,37
0
Farm
ing,
Fis
hin
g, a
nd
Fo
rest
ry O
ccu
pat
ion
s2
60
0.1
1%
0.3
2$
25
,75
0
Co
nst
ruct
ion
an
d E
xtra
ctio
n O
ccu
pat
ion
s6
,85
02
.79
%0
.71
$4
5,6
90
Inst
alla
tio
n, M
ain
ten
ance
, an
d R
epai
r O
ccu
pat
ion
s1
0,1
60
4.1
4%
1.0
7$
39
,64
0
Pro
du
ctio
n O
ccu
pat
ion
s5
3,6
60
21
.85
%3
.31
$3
1,6
10
Tran
spo
rtat
ion
an
d M
ater
ial M
ovi
ng
Occ
up
atio
ns
18
,75
07
.64
%1
.12
$3
2,2
60
Tab
le B
-4: E
mp
loym
en
t an
d A
vera
ge A
nn
ual
Pay
by
Maj
or
Occ
up
atio
n G
rou
p
No
rth
cen
tral
Ind
ian
a R
egi
on
1
Sou
rce:
U.S
. Bu
rea
u o
f La
bo
r St
ati
stic
s, O
ccu
pa
tio
na
l Em
plo
ymen
t St
ati
stic
s
1El
khar
t-G
osh
en a
nd
So
uth
Ben
d-M
ish
awak
a M
etro
po
litan
Sta
tist
ical
Are
as o
nly
- d
ata
no
t av
aila
ble
at
the
cou
nty
leve
l
Maj
or
Occ
up
atio
n G
rou
p T
itle
Emp
loym
en
tA
vera
ge
Pay
3LQ
(Lo
cati
on
Qu
oti
ent)
is t
he
rati
o o
f an
ind
ust
ry’s
sh
are
of
tota
l em
plo
ymen
t in
a lo
cati
on
rel
ativ
e to
its
shar
e o
f to
tal n
atio
nal
em
plo
ymen
t. T
he
LQ m
easu
res
the
spec
ializ
atio
n o
r co
nce
ntr
atio
n o
f a
clu
ster
in a
par
ticu
lar
loca
tio
n r
elat
ive
to t
he
nat
ion
al a
vera
ge. A
n L
Q >
1 in
dic
ates
a h
igh
er t
han
ave
rage
clu
ster
co
nce
ntr
atio
n in
a
loca
tio
n.
2P
erce
nta
ge o
f El
khar
t-G
osh
en a
nd
So
uth
Ben
d-M
ish
awak
a M
etro
po
litan
Sta
tist
ical
Are
as t
ota
l em
plo
ymen
t
Northcentral Indiana Regional Development Authority 64

Maj
or
Occ
up
atio
nal
Cat
ego
ry C
od
e a
nd
Tit
leN
CI
Ap
ple
ton
Ce
dar
Rap
ids
Lan
cast
er
Wic
hit
a
Yo
rk-
Han
ove
r
11
-00
00
Man
agem
ent
4.3
7%
4.3
8%
6.8
0%
3.3
5%
4.3
6%
3.4
0%
13
-00
00
Bu
sin
ess
and
Fin
anci
al O
per
atio
ns
3.0
3%
4.4
4%
5.1
4%
3.6
2%
4.5
2%
3.7
8%
15
-00
00
Co
mp
ute
r an
d M
ath
emat
ical
0.9
9%
1.7
3%
4.3
0%
1.6
3%
2.1
0%
1.2
7%
17
-00
00
Arc
hit
ectu
re a
nd
En
gin
eeri
ng
1.4
0%
1.6
2%
2.2
0%
1.5
9%
2.5
2%
2.0
5%
19
-00
00
Lif
e, P
hys
ical
, an
d S
oci
al S
cien
ce0
.46
%0
.43
%0
.35
%0
.43
%0
.39
%0
.45
%
21
-00
00
Co
mm
un
ity
and
So
cial
Ser
vice
1.1
4%
0.9
4%
1.6
2%
1.3
8%
1.3
4%
1.5
0%
23
-00
00
Leg
al0
.38
%0
.38
%0
.57
%0
.29
%0
.53
%0
.35
%
25
-00
00
Ed
uca
tio
n, T
rain
ing,
an
d L
ibra
ry5
.62
%5
.02
%6
.05
%4
.71
%6
.18
%5
.49
%
27
-00
00
Art
s, D
esig
n, E
nte
rtai
nm
ent,
Sp
ort
s, a
nd
Med
ia1
.07
%1
.17
%1
.04
%1
.21
%1
.23
%0
.85
%
29
-00
00
Hea
lth
care
Pra
ctit
ion
ers
and
Tec
hn
ical
4.8
5%
4.5
8%
4.9
5%
5.4
9%
5.5
5%
6.1
3%
31
-00
00
Hea
lth
care
Su
pp
ort
2.3
6%
2.5
1%
2.5
7%
3.6
3%
3.0
2%
2.6
1%
33
-00
00
Pro
tect
ive
Serv
ice
1.7
9%
1.4
3%
1.5
8%
0.9
8%
2.0
0%
1.5
6%
35
-00
00
Fo
od
Pre
par
atio
n a
nd
Ser
vin
g R
elat
ed8
.31
%8
.91
%7
.62
%9
.17
%8
.51
%8
.73
%
37
-00
00
Bu
ildin
g an
d G
rou
nd
s C
lean
ing
and
Mai
nte
nan
ce2
.57
%2
.42
%2
.71
%3
.02
%2
.82
%2
.74
%
39
-00
00
Per
son
al C
are
and
Ser
vice
2.6
9%
3.2
5%
2.2
8%
3.2
2%
3.4
2%
2.4
6%
41
-00
00
Sal
es a
nd
Rel
ated
9.0
6%
12
.87
%9
.37
%1
1.3
0%
10
.23
%1
0.0
5%
43
-00
00
Off
ice
and
Ad
min
istr
ativ
e Su
pp
ort
13
.38
%1
4.6
3%
14
.95
%1
5.1
2%
16
.24
%1
5.1
1%
45
-00
00
Far
min
g, F
ish
ing,
an
d F
ore
stry
0.1
1%
0.1
2%
0.1
1%
0.3
4%
0.0
8%
0.0
3%
47
-00
00
Co
nst
ruct
ion
an
d E
xtra
ctio
n2
.79
%4
.41
%4
.33
%5
.39
%4
.52
%4
.15
%
49
-00
00
In
stal
lati
on
, Mai
nte
nan
ce, a
nd
Rep
air
4.1
4%
4.0
0%
4.3
7%
4.2
4%
4.7
7%
4.6
1%
51
-00
00
Pro
du
ctio
n2
1.8
5%
13
.18
%7
.04
%1
0.7
8%
10
.13
%1
1.6
9%
53
-00
00
Tra
nsp
ort
atio
n a
nd
Mat
eria
l Mo
vin
g7
.64
%7
.58
%1
0.0
4%
9.1
3%
5.5
3%
10
.99
%
Tab
le B
-5: E
mp
loym
en
t D
istr
ibu
tio
n b
y M
ajo
r O
ccu
pat
ion
al C
ate
gory
No
rth
cen
tral
Ind
ian
a R
egi
on
an
d B
en
chm
ark
Me
tro
po
litan
Are
as1
Sou
rce:
U.S
. Bu
rea
u o
f La
bo
r St
ati
stic
s, O
ccu
pa
tio
na
l Em
plo
ymen
t St
ati
stic
s
1El
khar
t-G
osh
en a
nd
So
uth
Ben
d-M
ish
awak
a M
etro
po
litan
Sta
tist
ical
Are
as o
nly
- d
ata
no
t av
aila
ble
at
the
cou
nty
leve
l
Northcentral Indiana Regional Development Authority 65

Maj
or
Occ
up
atio
nal
Cat
ego
ry C
od
e &
Tit
leN
CI
Ap
ple
ton
Ce
dar
Rap
ids
Lan
cast
er
Wic
hit
a
Yo
rk-
Han
ove
r
11
-00
00
Man
agem
ent
4.3
7%
4.3
8%
6.8
0%
3.3
5%
4.3
6%
3.4
0%
23
-00
00
Leg
al0
.38
%0
.38
%0
.57
%0
.29
%0
.53
%0
.35
%
15
-00
00
Co
mp
ute
r an
d M
ath
emat
ical
0.9
9%
1.7
3%
4.3
0%
1.6
3%
2.1
0%
1.2
7%
17
-00
00
Arc
hit
ectu
re a
nd
En
gin
eeri
ng
1.4
0%
1.6
2%
2.2
0%
1.5
9%
2.5
2%
2.0
5%
29
-00
00
Hea
lth
care
Pra
ctit
ion
ers
and
Tec
hn
ical
4.8
5%
4.5
8%
4.9
5%
5.4
9%
5.5
5%
6.1
3%
13
-00
00
Bu
sin
ess
and
Fin
anci
al O
per
atio
ns
3.0
3%
4.4
4%
5.1
4%
3.6
2%
4.5
2%
3.7
8%
Tota
ls1
5.0
1%
17
.14
%2
3.9
6%
15
.96
%1
9.5
9%
16
.99
%
19
-00
00
Lif
e, P
hys
ical
, an
d S
oci
al S
cien
ce0
.46
%0
.43
%0
.35
%0
.43
%0
.39
%0
.45
%
27
-00
00
Art
s, D
esig
n, E
nte
rtai
nm
ent,
Sp
ort
s, a
nd
Med
ia1
.07
%1
.17
%1
.04
%1
.21
%1
.23
%0
.85
%
25
-00
00
Ed
uca
tio
n, T
rain
ing,
an
d L
ibra
ry5
.62
%5
.02
%6
.05
%4
.71
%6
.18
%5
.49
%
47
-00
00
Co
nst
ruct
ion
an
d E
xtra
ctio
n2
.79
%4
.41
%4
.33
%5
.39
%4
.52
%4
.15
%
21
-00
00
Co
mm
un
ity
and
So
cial
Ser
vice
1.1
4%
0.9
4%
1.6
2%
1.3
8%
1.3
4%
1.5
0%
Tota
ls1
1.0
8%
11
.97
%1
3.3
9%
13
.12
%1
3.6
6%
12
.44
%
49
-00
00
In
stal
lati
on
, Mai
nte
nan
ce, a
nd
Rep
air
4.1
4%
4.0
0%
4.3
7%
4.2
4%
4.7
7%
4.6
1%
33
-00
00
Pro
tect
ive
Serv
ice
1.7
9%
1.4
3%
1.5
8%
0.9
8%
2.0
0%
1.5
6%
41
-00
00
Sal
es a
nd
Rel
ated
9.0
6%
12
.87
%9
.37
%1
1.3
0%
10
.23
%1
0.0
5%
43
-00
00
Off
ice
and
Ad
min
istr
ativ
e Su
pp
ort
13
.38
%1
4.6
3%
14
.95
%1
5.1
2%
16
.24
%1
5.1
1%
51
-00
00
Pro
du
ctio
n2
1.8
5%
13
.18
%7
.04
%1
0.7
8%
10
.13
%1
1.6
9%
Tota
ls5
0.2
2%
46
.11
%3
7.3
2%
42
.42
%4
3.3
7%
43
.02
%
35
-00
00
Fo
od
Pre
par
atio
n a
nd
Ser
vin
g R
elat
ed8
.31
%8
.91
%7
.62
%9
.17
%8
.51
%8
.73
%
39
-00
00
Per
son
al C
are
and
Ser
vice
2.6
9%
3.2
5%
2.2
8%
3.2
2%
3.4
2%
2.4
6%
45
-00
00
Far
min
g, F
ish
ing,
an
d F
ore
stry
0.1
1%
0.1
2%
0.1
1%
0.3
4%
0.0
8%
0.0
3%
37
-00
00
Bu
ildin
g an
d G
rou
nd
s C
lean
ing
and
Mai
nte
nan
ce2
.57
%2
.42
%2
.71
%3
.02
%2
.82
%2
.74
%
31
-00
00
Hea
lth
care
Su
pp
ort
2.3
6%
2.5
1%
2.5
7%
3.6
3%
3.0
2%
2.6
1%
53
-00
00
Tra
nsp
ort
atio
n a
nd
Mat
eria
l Mo
vin
g7
.64
%7
.58
%1
0.0
4%
9.1
3%
5.5
3%
10
.99
%
Tota
ls2
3.6
8%
24
.78
%2
5.3
3%
28
.51
%2
3.3
8%
27
.55
%
Sou
rce:
U.S
. Bu
rea
u o
f La
bo
r St
ati
stic
s, O
ccu
pa
tio
na
l Em
plo
ymen
t St
ati
stic
s
1El
khar
t-G
osh
en a
nd
So
uth
Ben
d-M
ish
awak
a M
etro
po
litan
Sta
tist
ical
Are
as o
nly
- d
ata
no
t av
aila
ble
at
the
cou
nty
leve
l
Tab
le B
-6: P
erc
en
tage
of
Emp
loym
en
t b
y M
ajo
r O
ccu
pat
ion
al G
rou
p in
Nat
ion
al Q
uar
tile
s o
f A
vera
ge A
nn
ual
Pay
No
rth
cen
tral
Ind
ian
a R
egi
on
an
d B
en
chm
ark
Me
tro
po
litan
Are
as1
Nat
ion
al H
igh
est
Qu
arti
le o
f A
vera
ge A
nn
ual
Pay
Nat
ion
al U
pp
er
Mid
dle
Qu
arti
le o
f A
vera
ge A
nn
ual
Pay
Nat
ion
al L
ow
er
Mid
dle
Qu
arti
le o
f A
vera
ge A
nn
ual
Pay
Nat
ion
al L
ow
est
Qu
arti
le o
f A
vera
ge A
nn
ual
Pay
Northcentral Indiana Regional Development Authority 66

Nu
mb
er
Pe
rce
nta
ge2
51
-10
11
Fir
st-L
ine
Sup
ervi
sors
of
Pro
du
ctio
n a
nd
Op
erat
ing
Wo
rker
s2
,60
01
.06
%$
52
,10
0
51
-20
22
Ele
ctri
cal a
nd
Ele
ctro
nic
Eq
uip
men
t A
ssem
ble
rs7
10
0.3
0%
$2
6,9
85
51
-20
41
Str
uct
ura
l Met
al F
abri
cato
rs a
nd
Fit
ters
40
00
.20
%$
40
,06
5
51
-20
91
Fib
ergl
ass
Lam
inat
ors
an
d F
abri
cato
rs1
,23
00
.60
%$
28
,41
0
51
-20
92
Tea
m A
ssem
ble
rs1
4,2
70
5.9
0%
$2
9,8
55
51
-20
99
Ass
emb
lers
an
d F
abri
cato
rs, A
ll O
ther
3,4
40
1.5
0%
$2
5,4
65
51
-30
11
Bak
ers
27
00
.11
%$
23
,98
5
51
-30
21
Bu
tch
ers
and
Mea
t C
utt
ers
22
00
.09
%$
28
,01
5
51
-30
92
Fo
od
Bat
chm
aker
s1
90
0.0
8%
$2
8,9
25
51
-30
93
Fo
od
Co
oki
ng
Mac
hin
e O
per
ato
rs a
nd
Ten
der
s1
10
0.0
4%
$2
4,2
90
51
-40
11
Co
mp
ute
r-C
on
tro
lled
Mac
hin
e To
ol O
per
ato
rs9
60
0.3
9%
$3
3,1
10
51
-40
12
CN
C M
ach
ine
Too
l Pro
gram
mer
s1
40
0.0
6%
$4
3,7
30
51
-40
21
Ext
rud
ing
and
Dra
win
g M
ach
ine
Op
erat
ors
1,0
60
0.5
0%
$3
0,5
65
51
-40
23
Ro
llin
g M
ach
ine
Op
erat
ors
32
00
.13
%$
45
,63
0
51
-40
31
Cu
ttin
g, P
un
chin
g &
Pre
ss M
ach
ine
Op
erat
ors
1,7
50
0.8
0%
$2
7,7
25
51
-40
33
Gri
nd
ing,
Po
lish
ing
and
Bu
ffin
g M
ach
ine
Op
erat
ors
30
00
.12
%$
32
,45
0
51
-40
34
Lat
he
and
Tu
rnin
g M
ach
ine
Too
l Op
erat
ors
28
00
.11
%$
34
,25
0
51
-40
35
Mill
ing
and
Pla
nin
g M
ach
ine
Op
erat
ors
60
0.0
2%
$3
0,0
95
51
-40
41
Mac
hin
ists
1,6
90
0.7
0%
$3
8,0
90
51
-40
61
Mo
del
Mak
ers,
Met
al a
nd
Pla
stic
40
0.0
2%
$4
8,1
30
51
-40
72
Mo
ldin
g, C
ore
mak
ing
and
Cas
tin
g M
ach
ine
Op
erat
ors
1,1
10
0.5
0%
$3
0,6
35
51
-40
81
Mu
ltip
le M
ach
ine
Too
l Op
erat
ors
37
00
.15
%$
37
,46
0
51
-41
11
To
ol a
nd
Die
Mak
ers
41
00
.17
%$
48
,80
0
51
-41
21
Wel
der
s, C
utt
ers,
So
lder
ers,
an
d B
raze
rs2
,69
01
.10
%$
32
,67
5
51
-41
22
Wel
din
g, S
old
erin
g an
d B
razi
ng
Mac
hin
e O
per
ato
rs1
90
0.1
0%
$3
0,7
50
51
-41
91
Hea
t Tr
eati
ng
Equ
ipm
ent
Op
erat
ors
40
0.0
2%
$3
9,5
50
51
-41
93
Pla
tin
g an
d C
oat
ing
Mac
hin
e O
per
ato
rs2
70
0.1
1%
$2
8,5
40
51
-41
99
Met
al W
ork
ers
and
Pla
stic
Wo
rker
s, A
ll O
ther
25
00
.10
%$
28
,61
0
51
-51
12
Pri
nti
ng
Pre
ss O
per
ato
rs1
70
0.0
7%
$3
5,2
50
51
-60
11
Lau
nd
ry a
nd
Dry
-Cle
anin
g W
ork
ers
40
00
.16
%$
19
,64
5
Tab
le B
-7:
Pro
du
ctio
n O
ccu
pat
ion
s Em
plo
yme
nt
and
Ave
rage
An
nu
al P
ay
No
rth
cen
tral
Ind
ian
a R
egi
on
1
Pro
du
ctio
n O
ccu
pat
ion
Tit
le
Emp
loym
en
tA
vera
ge
Pay
Northcentral Indiana Regional Development Authority 67

Nu
mb
er
Pe
rce
nta
ge2
51
-60
31
Sew
ing
Mac
hin
e O
per
ato
rs7
40
0.3
0%
$2
3,9
25
51
-60
62
Tex
tile
Cu
ttin
g M
ach
ine
Op
erat
ors
13
00
.05
%$
27
,42
0
51
-60
91
Ext
rud
ing
and
Fo
rmin
g M
ach
ine
Op
erat
ors
90
0.0
4%
$3
4,4
90
51
-60
93
Up
ho
lste
rers
66
00
.27
%$
28
,34
0
51
-70
11
Cab
inet
mak
ers
and
Ben
ch C
arp
ente
rs1
,94
00
.80
%$
41
,41
0
51
-70
21
Fu
rnit
ure
Fin
ish
ers
13
00
.05
%$
27
,63
0
51
-70
41
Saw
ing
Mac
hin
e O
per
ato
rs, W
oo
d2
20
0.0
9%
$2
7,9
70
51
-70
42
Wo
od
wo
rkin
g M
ach
ine
Op
erat
ors
, Exc
ept
Saw
ing
71
00
.29
%$
27
,32
0
51
-80
31
Wat
er a
nd
Was
tew
ater
Tre
atm
ent
Pla
nt
Op
erat
ors
18
00
.07
%$
40
,05
0
51
-90
11
Ch
emic
al E
qu
ipm
ent
Op
erat
ors
an
d T
end
ers
80
0.0
3%
$2
6,1
20
51
-90
22
Gri
nd
ing
and
Po
lish
ing
Wo
rker
s, H
and
36
00
.15
%$
27
,45
0
51
-90
23
Mix
ing
and
Ble
nd
ing
Mac
hin
e O
per
ato
rs3
50
0.1
4%
$3
4,6
50
51
-90
31
Cu
tter
s an
d T
rim
mer
s, H
and
50
0.0
2%
$2
9,7
90
51
-90
32
Cu
ttin
g an
d S
licin
g M
ach
ine
Op
erat
ors
42
00
.17
%$
32
,77
5
51
-90
41
Ext
rud
ing,
etc
. Mac
hin
e O
per
ato
rs8
00
.03
%$
31
,93
5
51
-90
61
Insp
ecto
rs, T
este
rs, e
tc.
1,9
00
0.8
0%
$3
5,2
70
51
-91
11
Pac
kagi
ng
Mac
hin
e O
per
ato
rs1
,03
00
.50
%$
27
,84
0
51
-91
21
Co
atin
g, P
ain
tin
g, e
tc. M
ach
ine
Op
erat
ors
70
00
.29
%$
31
,11
0
51
-91
22
Pai
nte
rs, T
ran
spo
rtat
ion
Eq
uip
men
t3
90
0.2
0%
$4
0,8
90
51
-91
23
Pai
nti
ng,
Co
atin
g, a
nd
Dec
ora
tin
g W
ork
ers
60
0.0
2%
$2
8,6
60
51
-91
51
Ph
oto
grap
hic
Pro
cess
Wo
rker
s7
00
.03
%$
27
,23
0
51
-91
91
Ad
hes
ive
Bo
nd
ing
Mac
hin
e O
per
ato
rs a
nd
Ten
der
s4
50
0.2
0%
$2
7,4
40
51
-91
92
Cle
anin
g an
d M
etal
Pic
klin
g Eq
uip
men
t O
per
ato
rs1
30
0.0
5%
$2
6,6
50
51
-91
95
Mo
lder
s, S
hap
ers,
etc
., E
xcep
t M
etal
an
d P
last
ic5
00
.02
%$
30
,30
0
51
-91
96
Pap
er G
oo
ds
Mac
hin
e O
per
ato
rs2
30
0.0
9%
$3
3,3
80
51
-91
98
Hel
per
s -
Pro
du
ctio
n W
ork
ers
4,0
10
1.7
0%
$2
5,6
60
51
-91
99
Pro
du
ctio
n W
ork
ers,
All
Oth
er4
70
0.2
0%
$2
9,4
15
1El
khar
t-G
osh
en &
So
uth
Ben
d-M
ish
awak
a M
etro
po
litan
Sta
tist
ical
Are
as o
nly
- d
ata
no
t av
aila
ble
at
the
cou
nty
leve
l
Sou
rce:
U.S
. Bu
rea
u o
f La
bo
r St
ati
stic
s, O
ccu
pa
tio
na
l Em
plo
ymen
t St
ati
stic
s
Tab
le B
-7: P
rod
uct
ion
Occ
up
atio
ns
Emp
loym
en
t an
d A
vera
ge A
nn
ual
Pay
(co
nti
nu
ed
)
No
rth
cen
tral
Ind
ian
a R
egi
on
1
Pro
du
ctio
n O
ccu
pat
ion
Tit
le
Emp
loym
en
tA
vera
ge
Pay
2P
erce
nta
ge o
f El
khar
t-G
osh
en a
nd
So
uth
Ben
d-M
ish
awak
a M
etro
po
litan
Sta
tist
ical
Are
as t
ota
l em
plo
ymen
t
Northcentral Indiana Regional Development Authority 68

Occ
up
atio
n C
od
e a
nd
Tit
le
Entr
y
Exp
eri
en
ce
Typ
ical
OJT
Ne
ed
ed
% o
f
Emp
loym
en
t2
31
-10
11
Ho
me
He
alth
Aid
es
No
ne
Sho
rt-t
erm
0.2
52
%
33
-90
91
Cro
ssin
g G
uar
ds
No
ne
Sho
rt-t
erm
0.0
49
%
35
-20
12
Co
oks
, In
stit
uti
on
& C
afet
eri
aN
on
eSh
ort
-te
rm0
.26
5%
35
-20
14
Co
oks
, Re
stau
ran
tLe
ss t
han
5 y
ear
sM
od
erat
e-t
erm
0.7
41
%
35
-20
21
Fo
od
Pre
par
atio
n W
rkrs
No
ne
Sho
rt-t
erm
0.6
93
%
35
-30
11
Bar
ten
de
rsN
on
eSh
ort
-te
rm0
.33
5%
35
-30
21
Co
mb
ine
d F
oo
d P
rep
arat
ion
& S
ervi
ng
Wre
rsN
on
eSh
ort
-te
rm2
.92
2%
35
-30
22
Co
un
ter
Att
en
dan
ts, C
afe
teri
a, e
tcN
on
eSh
ort
-te
rm0
.21
2%
35
-30
31
Wai
ters
& W
aitr
esse
sN
on
eSh
ort
-te
rm1
.66
8%
35
-30
41
Fo
od
Se
rve
rs, N
on
rest
aura
nt
No
ne
Sho
rt-t
erm
0.1
54
%
35
-90
11
Din
ing
Ro
om
& C
afet
eri
a A
tte
nd
ants
No
ne
Sho
rt-t
erm
0.3
35
%
35
-90
21
Dis
hw
ash
ers
No
ne
Sho
rt-t
erm
0.2
96
%
35
-90
31
Ho
sts
& H
ost
ess
es,
Re
stau
ran
t, e
tcN
on
eN
on
e0
.30
5%
37
-20
11
Jan
ito
rs &
Cle
aner
s, E
xc. M
aid
s &
Hsk
pg
Cle
aner
sN
on
eSh
ort
-te
rm1
.27
6%
37
-20
12
Mai
ds
& H
ou
seke
ep
ing
Cle
aner
sN
on
eSh
ort
-te
rm0
.64
4%
37
-30
11
Lan
dsc
apin
g &
Gro
un
dsk
ee
pin
g W
rkrs
No
ne
Sho
rt-t
erm
0.5
96
%
39
-30
31
Ush
ers
, Lo
bb
y A
tte
nd
ants
& T
icke
t Ta
kers
No
ne
Sho
rt-t
erm
0.0
13
%
39
-30
91
Am
use
me
nt
& R
ecr
eati
on
Att
end
ants
No
ne
Sho
rt-t
erm
0.1
63
%
39
-90
21
Pe
rso
nal
Car
e A
ide
sN
on
eSh
ort
-te
rm0
.98
4%
41
-20
11
Cas
hie
rsN
on
eSh
ort
-te
rm2
.29
5%
41
-20
21
Co
un
ter
& R
en
tal C
lerk
sN
on
eSh
ort
-te
rm0
.41
5%
41
-20
22
Par
ts S
ale
spe
rso
ns
No
ne
Mo
der
ate
-te
rm0
.22
1%
41
-20
31
Re
tail
Sale
sper
son
sN
on
eSh
ort
-te
rm3
.03
2%
43
-50
81
Sto
ck C
lerk
s &
Ord
er
Fille
rsN
on
eSh
ort
-te
rm1
.59
8%
45
-20
92
Far
mw
ork
ers
& L
abo
rers
, Cro
pN
on
eSh
ort
-te
rm0
.05
7%
45
-20
93
Far
mw
ork
ers
, An
imal
sN
on
eSh
ort
-te
rm0
.03
1%
47
-20
51
Cem
en
t M
aso
ns
& C
on
cret
e F
inis
he
rsN
on
eM
od
erat
e-t
erm
0.1
19
%
47
-20
61
Co
nst
ruct
ion
Lab
ore
rsN
on
eSh
ort
-te
rm0
.15
4%
47
-20
81
Dry
wal
l & C
eili
ng
Tile
Inst
alle
rsN
on
eM
od
erat
e-t
erm
0.0
22
%
Tab
le B
-8:
Occ
up
atio
ns
Edu
cati
on
an
d T
rain
ing
Req
uir
em
ents
No
rth
cen
tral
Ind
ian
a R
egi
on
1
No
Fo
rmal
Ed
uca
tio
n C
red
enti
al
Northcentral Indiana Regional Development Authority 69

Occ
up
atio
n C
od
e a
nd
Tit
le
Entr
y
Exp
eri
en
ce
Typ
ical
OJT
Ne
ed
ed
% o
f
Emp
loym
en
t2
47
-21
41
Pai
nte
rs, C
on
stru
ctio
n &
Mai
nte
nan
ceN
on
eM
od
erat
e-t
erm
0.0
40
%
47
-21
81
Ro
ofe
rsN
on
eM
od
erat
e-t
erm
0.0
93
%
51
-30
11
Bak
ers
No
ne
Lon
g-te
rm0
.11
9%
51
-30
21
Bu
tch
ers
& M
eat
Cu
tte
rsN
on
eLo
ng-
term
0.0
97
%
51
-60
11
Lau
nd
ry &
Dry
-Cle
anin
g W
rkrs
No
ne
Sho
rt-t
erm
0.1
77
%
51
-60
31
Sew
ing
Mac
hin
e O
per
ato
rsN
on
eSh
ort
-te
rm0
.32
7%
51
-90
22
Gri
nd
ing
& P
olis
hin
g W
rkrs
, Han
dN
on
eM
od
erat
e-t
erm
0.1
59
%
51
-90
31
Cu
tte
rs &
Tri
mm
ers
, Han
dN
on
eSh
ort
-te
rm0
.02
2%
51
-91
23
Pai
nti
ng,
Co
atin
g &
De
cora
tin
g W
rkrs
No
ne
Mo
der
ate
-te
rm0
.02
6%
51
-91
92
Cle
anin
g &
Me
tal P
ickl
ing
Equ
ip O
pe
rato
rsN
on
eM
od
erat
e-t
erm
0.0
57
%
51
-91
98
He
lpe
rs--
Pro
du
ctio
n W
rkrs
No
ne
Sho
rt-t
erm
1.7
70
%
53
-30
41
Tax
i Dri
vers
& C
hau
ffe
urs
No
ne
Sho
rt-t
erm
0.0
71
%
53
-30
99
Mo
tor
Ve
hic
le O
pe
rato
rs, A
ll O
the
rN
on
eSh
ort
-te
rm0
.02
2%
53
-60
31
Au
tom
oti
ve &
Wat
erc
raft
Se
rvic
e A
tte
nd
ants
No
ne
Sho
rt-t
erm
0.0
88
%
53
-70
11
Co
nve
yor
Op
era
tors
& T
en
de
rsN
on
eSh
ort
-te
rm0
.01
8%
53
-70
51
Ind
ust
rial
Tru
ck &
Tra
cto
r O
pe
rato
rsN
on
eSh
ort
-te
rm0
.62
2%
53
-70
61
Cle
ane
rs o
f V
ehic
les
& E
qu
ipm
en
tN
on
eSh
ort
-te
rm0
.20
3%
53
-70
62
Lab
ore
rs &
Mat
eri
al M
ove
rs, H
and
No
ne
Sho
rt-t
erm
1.9
24
%
53
-70
64
Pac
kers
& P
acka
gers
, Han
dN
on
eSh
ort
-te
rm0
.77
7%
53
-70
81
Re
fuse
& R
ecy
clab
le M
ate
rial
Co
llect
ors
No
ne
Sho
rt-t
erm
0.0
66
%
T
ota
l No
Fo
rmal
Ed
uca
tio
n C
red
en
tial
26
.52
6%
11
-30
71
Tra
nsp
ort
atio
n, S
tora
ge &
Dis
trib
uti
on
Man
age
rs5
yea
rs o
r m
ore
No
ne
0.0
97
%
11
-90
51
Fo
od
Se
rvic
e M
anag
ers
Less
th
an 5
ye
ars
No
ne
0.1
19
%
11
-90
81
Lo
dgi
ng
Man
age
rsLe
ss t
han
5 y
ear
sN
on
e0
.01
3%
11
-91
41
Pro
pe
rty
& R
eal
Est
ate
Man
age
rsLe
ss t
han
5 y
ear
sN
on
e0
.09
3%
13
-10
31
Cla
ims
Ad
just
ers
, Exa
min
ers
& In
vest
igat
ors
No
ne
Lon
g-te
rm0
.03
5%
13
-20
82
Tax
Pre
par
ers
No
ne
Mo
der
ate
-te
rm0
.02
2%
21
-10
93
So
cial
& H
um
an S
erv
ice
Ass
ista
nts
No
ne
Sho
rt-t
erm
0.2
30
%
Tab
le B
-8:
Occ
up
atio
ns
Edu
cati
on
an
d T
rain
ing
Req
uir
em
ents
(co
nti
nu
ed
)
No
rth
cen
tral
Ind
ian
a R
egi
on
1
No
Fo
rmal
Ed
uca
tio
n C
red
en
tial
(co
nti
nu
ed
)
Hig
h S
cho
ol D
iplo
ma
Northcentral Indiana Regional Development Authority 70

Occ
up
atio
n C
od
e a
nd
Tit
le
Entr
y
Exp
eri
en
ce
Typ
ical
OJT
Ne
ed
ed
% o
f
Emp
loym
en
t2
25
-30
21
Sel
f-En
rich
me
nt
Edu
cati
on
Te
ach
ers
Less
th
an 5
ye
ars
No
ne
0.0
44
%
27
-10
26
Me
rch
and
ise
Dis
pla
yers
& W
ind
ow
Tri
mm
ers
No
ne
Mo
der
ate
-te
rm0
.04
0%
27
-40
21
Ph
oto
grap
he
rsN
on
eLo
ng-
term
0.0
26
%
29
-20
52
Ph
arm
acy
Tech
nic
ian
sN
on
eM
od
erat
e-t
erm
0.2
16
%
29
-20
81
Op
tici
ans,
Dis
pe
nsi
ng
No
ne
Lon
g-te
rm0
.04
4%
29
-20
99
He
alth
Te
chn
olo
gist
s &
Te
chn
icia
ns,
All
Oth
er
No
ne
No
ne
0.0
26
%
31
-10
15
Ord
erl
ies
No
ne
Sho
rt-t
erm
0.0
22
%
31
-90
93
Me
dic
al E
qu
ipm
ent
Pre
par
ers
No
ne
Mo
der
ate
-te
rm0
.02
6%
31
-90
95
Ph
arm
acy
Aid
es
No
ne
Sho
rt-t
erm
0.0
18
%
31
-90
96
Ve
teri
nar
y A
ssis
tan
ts &
Lab
. An
imal
Car
etak
ers
No
ne
Sho
rt-t
erm
0.0
40
%
31
-90
99
He
alth
care
Su
pp
ort
Wrk
rs, A
ll O
the
rN
on
eN
on
e0
.05
3%
33
-10
12
Fir
st-L
ine
Su
per
viso
rs o
f P
olic
e &
De
tect
ive
sLe
ss t
han
5 y
ear
sM
od
erat
e-t
erm
0.0
35
%
33
-10
99
Fir
st-L
ine
Su
per
vrs
of
Pro
tect
v Sv
c W
rkrs
, Oth
er
Less
th
an 5
ye
ars
No
ne
0.0
31
%
33
-30
21
De
tect
ive
s &
Cri
min
al In
vest
igat
ors
Less
th
an 5
ye
ars
Mo
der
ate
-te
rm0
.01
8%
33
-30
51
Po
lice
& S
he
riff
's P
atro
l Off
ice
rsN
on
eM
od
erat
e-t
erm
0.5
03
%
33
-90
32
Sec
uri
ty G
uar
ds
No
ne
Sho
rt-t
erm
0.4
63
%
33
-90
93
Tra
nsp
ort
atio
n S
ecu
rity
Scr
een
ers
No
ne
Sho
rt-t
erm
0.0
22
%
33
-90
99
Pro
tect
ive
Se
rvic
e W
rkrs
, All
Oth
er
No
ne
Sho
rt-t
erm
0.0
40
%
35
-10
11
Ch
efs
& H
ead
Co
oks
5 y
ears
or
mo
reN
on
e0
.04
4%
35
-10
12
Fir
st-L
ine
Su
per
viso
rs o
f Fo
od
Pre
p. &
Se
rvin
g W
rkrs
Less
th
an 5
ye
ars
No
ne
0.5
34
%
37
-10
11
Fir
st-L
ine
Su
per
viso
rs o
f H
ou
seke
ep
ing
Wrk
rsLe
ss t
han
5 y
ear
sN
on
e0
.12
4%
37
-10
12
Fir
st-L
ine
Su
per
viso
rs o
f G
rou
nd
ske
ep
ing
Wrk
rsLe
ss t
han
5 y
ear
sN
on
e0
.06
2%
37
-20
21
Pe
st C
on
tro
l Wrk
rsN
on
eM
od
erat
e-t
erm
0.0
18
%
39
-10
21
Fir
st-L
ine
Su
per
viso
rs o
f P
ers
on
al S
ervi
ce W
rkrs
Less
th
an 5
ye
ars
No
ne
0.0
66
%
39
-20
21
No
nfa
rm A
nim
al C
aret
ake
rsN
on
eSh
ort
-te
rm0
.11
5%
39
-40
21
Fu
ne
ral A
tten
dan
tsN
on
eSh
ort
-te
rm0
.03
5%
39
-90
11
Ch
ildca
re W
rkrs
No
ne
Sho
rt-t
erm
0.2
74
%
39
-90
31
Fit
nes
s Tr
ain
ers
& A
ero
bic
s In
stru
cto
rsN
on
eSh
ort
-te
rm0
.15
4%
39
-90
32
Re
crea
tio
n W
rkrs
No
ne
Sho
rt-t
erm
0.0
53
%
Hig
h S
cho
ol D
iplo
ma
(co
nti
nu
ed)
Tab
le B
-8:
Occ
up
atio
ns
Edu
cati
on
an
d T
rain
ing
Req
uir
em
ents
(co
nti
nu
ed
)
No
rth
cen
tral
Ind
ian
a R
egi
on
1
Northcentral Indiana Regional Development Authority 71

Occ
up
atio
n C
od
e a
nd
Tit
le
Entr
y
Exp
eri
en
ce
Typ
ical
OJT
Ne
ed
ed
% o
f
Emp
loym
en
t2
39
-90
41
Re
sid
en
tial
Ad
viso
rsN
on
eSh
ort
-te
rm0
.10
2%
41
-10
11
Fir
st-L
ine
Su
per
viso
rs o
f R
eta
il Sa
les
Wrk
rsLe
ss t
han
5 y
ear
sN
on
e0
.86
1%
41
-10
12
Fir
st-L
ine
Su
per
viso
rs o
f N
on
-Re
tail
Sale
s W
rkrs
Less
th
an 5
ye
ars
No
ne
0.1
99
%
41
-30
11
Ad
vert
isin
g Sa
les
Age
nts
No
ne
Mo
der
ate
-te
rm0
.07
9%
41
-30
21
Insu
ran
ce S
ales
Age
nts
No
ne
Mo
der
ate
-te
rm0
.16
3%
41
-30
99
Sal
es R
ep
rese
nta
tive
s, S
erv
ice
s, A
ll O
the
rN
on
eM
od
erat
e-t
erm
0.3
18
%
41
-40
12
Sal
es R
ep
s, E
xce
pt
Tech
nic
al &
Sci
en
tifi
c P
rod
uct
sN
on
eM
od
erat
e-t
erm
1.7
04
%
41
-90
22
Re
al E
stat
e S
ales
Age
nts
No
ne
Mo
der
ate
-te
rm0
.02
6%
43
-10
11
Fir
st-L
ine
Su
per
viso
rs o
f O
ffic
e &
Ad
min
. Wrk
rsLe
ss t
han
5 y
ear
sN
on
e0
.79
0%
43
-20
11
Sw
itch
bo
ard
Op
era
tors
No
ne
Sho
rt-t
erm
0.0
75
%
43
-30
11
Bill
& A
cco
un
t C
olle
cto
rsN
on
eM
od
erat
e-t
erm
0.1
68
%
43
-30
21
Bill
ing
& P
ost
ing
Cle
rks
No
ne
Mo
der
ate
-te
rm0
.36
2%
43
-30
51
Pay
roll
& T
ime
kee
pin
g C
lerk
sN
on
eM
od
erat
e-t
erm
0.1
37
%
43
-30
61
Pro
cure
me
nt
Cle
rks
No
ne
Mo
der
ate
-te
rm0
.03
1%
43
-30
71
Te
llers
No
ne
Sho
rt-t
erm
0.3
49
%
43
-40
31
Co
urt
, Mu
nic
ipal
& L
ice
nse
Cle
rks
No
ne
Mo
der
ate
-te
rm0
.01
3%
43
-40
41
Cre
dit
Au
tho
rize
rs, C
he
cke
rs &
Cle
rks
No
ne
Mo
der
ate
-te
rm0
.01
8%
43
-40
51
Cu
sto
me
r Se
rvic
e R
ep
rese
nta
tive
sN
on
eSh
ort
-te
rm1
.47
0%
43
-40
61
Elig
ibili
ty In
terv
iew
ers
, Go
vern
me
nt
Pro
gram
sN
on
eM
od
erat
e-t
erm
0.0
44
%
43
-40
71
File
Cle
rks
No
ne
Sho
rt-t
erm
0.0
57
%
43
-40
81
Ho
tel,
Mo
tel &
Re
sort
De
sk C
lerk
sN
on
eSh
ort
-te
rm0
.15
4%
43
-41
11
Inte
rvie
we
rs, E
xce
pt
Elig
ibili
ty &
Lo
anN
on
eSh
ort
-te
rm0
.22
5%
43
-41
21
Lib
rary
Ass
ista
nts
, Cle
rica
lN
on
eSh
ort
-te
rm0
.09
7%
43
-41
31
Lo
an In
terv
iew
ers
& C
lerk
sN
on
eSh
ort
-te
rm0
.09
7%
43
-41
41
Ne
w A
cco
un
ts C
lerk
sN
on
eM
od
erat
e-t
erm
0.0
26
%
43
-41
51
Ord
er
Cle
rks
No
ne
Sho
rt-t
erm
0.2
30
%
43
-41
71
Re
cep
tio
nis
ts &
Info
rmat
ion
Cle
rks
No
ne
Sho
rt-t
erm
0.6
49
%
43
-41
99
Info
rmat
ion
& R
eco
rd C
lerk
s, A
ll O
the
rN
on
eSh
ort
-te
rm0
.04
0%
43
-50
21
Co
uri
ers
& M
ess
en
gers
No
ne
Sho
rt-t
erm
0.0
35
%
Tab
le B
-8:
Occ
up
atio
ns
Edu
cati
on
an
d T
rain
ing
Req
uir
em
ents
(co
nti
nu
ed
)
No
rth
cen
tral
Ind
ian
a R
egi
on
1
Hig
h S
cho
ol D
iplo
ma
(co
nti
nu
ed)
Northcentral Indiana Regional Development Authority 72

Occ
up
atio
n C
od
e a
nd
Tit
le
Entr
y
Exp
eri
en
ce
Typ
ical
OJT
Ne
ed
ed
% o
f
Emp
loym
en
t2
43
-50
31
Po
lice
, Fir
e &
Am
bu
lan
ce D
isp
atch
ers
No
ne
Mo
der
ate
-te
rm0
.03
1%
43
-50
32
Dis
pat
che
rs, E
xce
pt
Po
lice
, Fir
e &
Am
bu
lan
ceN
on
eM
od
erat
e-t
erm
0.1
19
%
43
-50
51
Po
stal
Ser
vice
Cle
rks
No
ne
Sho
rt-t
erm
0.0
26
%
43
-50
52
Po
stal
Ser
vice
Mai
l Car
rier
sN
on
eSh
ort
-te
rm0
.21
2%
43
-50
53
Po
stal
Ser
vice
Wrk
rsN
on
eSh
ort
-te
rm0
.05
3%
43
-50
61
Pro
du
ctio
n, P
lan
nin
g &
Exp
ed
itin
g C
lerk
sN
on
eM
od
erat
e-t
erm
0.2
30
%
43
-50
71
Sh
ipp
ing,
Re
ceiv
ing
& T
raff
ic C
lerk
sN
on
eSh
ort
-te
rm1
.13
4%
43
-51
11
We
igh
ers
, Me
asu
rers
, etc
.N
on
eSh
ort
-te
rm0
.11
5%
43
-60
11
Exe
cuti
ve S
ecr
eta
rie
s &
Ad
min
istr
ativ
e A
ssis
tan
tsLe
ss t
han
5 y
ear
sN
on
e0
.41
0%
43
-60
12
Le
gal S
ecr
etar
ies
No
ne
Mo
der
ate
-te
rm0
.05
7%
43
-60
13
Me
dic
al S
ecr
etar
ies
No
ne
Mo
der
ate
-te
rm0
.27
8%
43
-60
14
Sec
reta
ries
& A
dm
in A
ssts
, Exc
. Leg
al, M
ed
& E
xec
No
ne
Sho
rt-t
erm
1.3
42
%
43
-90
21
Dat
a En
try
Ke
yers
No
ne
Mo
der
ate
-te
rm0
.10
2%
43
-90
41
Insu
ran
ce C
laim
s &
Po
licy
Pro
cess
ing
Cle
rks
No
ne
Mo
der
ate
-te
rm0
.05
3%
43
-90
51
Mai
l Cle
rks,
Exc
ep
t P
ost
al S
erv
ice
No
ne
Sho
rt-t
erm
0.0
49
%
43
-90
61
Off
ice
Cle
rks,
Ge
ne
ral
No
ne
Sho
rt-t
erm
1.9
16
%
43
-91
99
Off
ice
& A
dm
in S
up
po
rt W
rkrs
, All
Oth
er
No
ne
Sho
rt-t
erm
0.1
19
%
47
-10
11
Fir
st-L
ine
Su
per
v o
f C
on
stru
ctio
n W
rkrs
5 y
ears
or
mo
reN
on
e0
.23
8%
47
-20
21
Bri
ckm
aso
ns
& B
lock
mas
on
sN
on
eA
pp
ren
tice
ship
0.0
57
%
47
-20
31
Car
pe
nte
rsN
on
eA
pp
ren
tice
ship
0.3
88
%
47
-20
73
Op
era
tin
g En
g. &
Co
nst
ruct
ion
Eq
uip
. Op
era
tors
No
ne
Mo
der
ate
-te
rm0
.13
7%
47
-21
11
Ele
ctri
cian
sN
on
eA
pp
ren
tice
ship
0.3
97
%
47
-21
52
Plu
mb
ers
, Pip
efi
tte
rs &
Ste
amfi
tte
rsN
on
eA
pp
ren
tice
ship
0.4
02
%
47
-22
11
Sh
ee
t M
eta
l Wrk
rsN
on
eA
pp
ren
tice
ship
0.0
84
%
47
-30
13
He
lpe
rs--
Ele
ctri
cian
sN
on
eSh
ort
-te
rm0
.01
8%
47
-30
15
He
lpe
rs--
Pip
ela
yers
, Plu
mb
ers
, etc
No
ne
Sho
rt-t
erm
0.0
22
%
47
-40
11
Co
nst
ruct
ion
& B
uild
ing
Insp
ect
ors
5 y
ears
or
mo
reM
od
erat
e-t
erm
0.0
31
%
47
-40
51
Hig
hw
ay M
ain
ten
ance
Wrk
rsN
on
eM
od
erat
e-t
erm
0.0
62
%
49
-10
11
Fir
st-L
ine
Su
per
v o
f M
ech
anic
s, e
tcLe
ss t
han
5 y
ear
sN
on
e0
.35
3%
Tab
le B
-8:
Occ
up
atio
ns
Edu
cati
on
an
d T
rain
ing
Req
uir
em
ents
(co
nti
nu
ed
)
No
rth
cen
tral
Ind
ian
a R
egi
on
1
Hig
h S
cho
ol D
iplo
ma
(co
nti
nu
ed)
Northcentral Indiana Regional Development Authority 73

Occ
up
atio
n C
od
e a
nd
Tit
le
Entr
y
Exp
eri
en
ce
Typ
ical
OJT
Ne
ed
ed
% o
f
Emp
loym
en
t2
49
-30
21
Au
tom
oti
ve B
od
y &
Re
late
d R
ep
aire
rsN
on
eLo
ng-
term
0.1
02
%
49
-30
31
Bu
s &
Tru
ck M
ech
anic
sN
on
eLo
ng-
term
0.1
90
%
49
-30
41
Far
m E
qu
ipm
en
t M
ech
anic
s &
Ser
vice
Te
chn
icia
ns
No
ne
Lon
g-te
rm0
.02
2%
49
-30
42
Mo
bile
Hea
vy E
qu
ip.t
Me
chan
ics,
Exc
. En
gin
es
No
ne
Lon
g-te
rm0
.06
6%
49
-30
53
Ou
tdo
or
Po
we
r Eq
uip
& S
mal
l En
gin
e M
ech
anic
sN
on
eM
od
erat
e-t
erm
0.0
35
%
49
-30
92
Re
crea
tio
nal
Ve
hic
le S
ervi
ce T
ech
nic
ian
sN
on
eLo
ng-
term
0.1
50
%
49
-90
41
Ind
ust
rial
Mac
hin
ery
Me
chan
ics
No
ne
Lon
g-te
rm0
.35
3%
49
-90
43
Mai
nte
nan
ce W
rkrs
, Mac
hin
ery
No
ne
Mo
der
ate
-te
rm0
.08
4%
49
-90
44
Mill
wri
ghts
No
ne
Ap
pre
nti
cesh
ip0
.04
9%
49
-90
69
Pre
cisi
on
Inst
rum
ent
& E
qu
ipm
ent
Re
pai
rers
,N
on
eLo
ng-
term
0.0
26
%
49
-90
71
Mai
nte
nan
ce &
Re
pai
r W
rkrs
, Gen
era
lN
on
eLo
ng-
term
1.1
92
%
49
-90
91
Co
in, V
en
din
g &
Am
use
men
t M
ach
ine
Re
pai
rers
No
ne
Sho
rt-t
erm
0.0
18
%
49
-90
98
He
lpe
rs--
Inst
alla
tio
n &
Re
pai
r W
rkrs
No
ne
Sho
rt-t
erm
0.0
66
%
49
-90
99
Inst
alla
tio
n, M
ain
ten
ance
&R
ep
air
Wrk
rs, O
the
rN
on
eM
od
erat
e-t
erm
0.0
84
%
51
-10
11
Fir
st-L
ine
Su
per
viso
rs o
f P
rod
uct
n &
Op
er.
Wrk
rsLe
ss t
han
5 y
ear
sN
on
e1
.14
8%
51
-20
22
Ele
ctri
cal &
Ele
ctro
nic
Eq
uip
me
nt
Ass
em
ble
rsN
on
eM
od
erat
e-t
erm
0.3
13
%
51
-20
41
Str
uct
ura
l Me
tal F
abri
cato
rs &
Fit
ters
No
ne
Mo
der
ate
-te
rm0
.17
7%
51
-20
91
Fib
erg
lass
Lam
inat
ors
& F
abri
cato
rsN
on
eM
od
erat
e-t
erm
0.5
43
%
51
-20
92
Te
am A
sse
mb
lers
No
ne
Mo
der
ate
-te
rm6
.29
8%
51
-20
99
Ass
em
ble
rs &
Fab
rica
tors
, All
Oth
er
No
ne
Mo
der
ate
-te
rm1
.51
8%
51
-30
92
Fo
od
Bat
chm
ake
rsN
on
eM
od
erat
e-t
erm
0.0
84
%
51
-30
93
Fo
od
Co
oki
ng
Mac
hin
e O
pe
rato
rs &
Te
nd
ers
No
ne
Mo
der
ate
-te
rm0
.04
9%
51
-40
11
Co
mp
ute
r-C
on
tro
lled
Mac
hin
e T
oo
l Op
erat
ors
No
ne
Mo
der
ate
-te
rm0
.42
4%
51
-40
12
CN
C M
ach
ine
To
ol P
rogr
amm
ers
No
ne
Lon
g-te
rm0
.06
2%
51
-40
21
Ext
rud
ing
& D
raw
ing
Mac
hin
e O
pe
rato
rsN
on
eM
od
erat
e-t
erm
0.4
68
%
51
-40
23
Ro
llin
g M
ach
ine
Op
era
tors
No
ne
Mo
der
ate
-te
rm0
.14
1%
51
-40
31
Cu
ttin
g, P
un
chin
g &
Pre
ss M
ach
ine
Op
era
tors
No
ne
Mo
der
ate
-te
rm0
.77
2%
51
-40
33
Gri
nd
ing,
Po
lish
ing
& B
uff
ing
Mac
hin
e O
pe
rato
rsN
on
eM
od
erat
e-t
erm
0.1
32
%
51
-40
34
Lat
he
& T
urn
ing
Mac
hin
e T
oo
l Op
era
tors
No
ne
Mo
der
ate
-te
rm0
.12
4%
Tab
le B
-8:
Occ
up
atio
ns
Edu
cati
on
an
d T
rain
ing
Req
uir
em
ents
(co
nti
nu
ed
)
No
rth
cen
tral
Ind
ian
a R
egi
on
1
Hig
h S
cho
ol D
iplo
ma
(co
nti
nu
ed)
Northcentral Indiana Regional Development Authority 74

Occ
up
atio
n C
od
e a
nd
Tit
le
Entr
y
Exp
eri
en
ce
Typ
ical
OJT
Ne
ed
ed
% o
f
Emp
loym
en
t2
51
-40
35
Mill
ing
& P
lan
ing
Mac
hin
e O
pe
rato
rsN
on
eM
od
erat
e-t
erm
0.0
26
%
51
-40
41
Mac
hin
ists
No
ne
Lon
g-te
rm0
.74
6%
51
-40
61
Mo
de
l Mak
ers
, Me
tal &
Pla
stic
No
ne
Mo
der
ate
-te
rm0
.01
8%
51
-40
72
Mo
ldin
g, C
ore
mak
ing
& C
asti
ng
Mac
hin
e O
pe
rato
rsN
on
eM
od
erat
e-t
erm
0.4
90
%
51
-40
81
Mu
ltip
le M
ach
ine
To
ol O
pe
rato
rsN
on
eM
od
erat
e-t
erm
0.1
63
%
51
-41
11
To
ol &
Die
Mak
ers
No
ne
Lon
g-te
rm0
.18
1%
51
-41
21
We
lde
rs, C
utt
ers
, So
lde
rers
& B
raze
rsN
on
eM
od
erat
e-t
erm
1.1
87
%
51
-41
22
We
ldin
g, S
old
eri
ng
& B
razi
ng
Mac
hin
e O
pe
rato
rsN
on
eM
od
erat
e-t
erm
0.0
84
%
51
-41
91
He
at T
reat
ing
Equ
ipm
en
t O
pe
rato
rsN
on
eM
od
erat
e-t
erm
0.0
18
%
51
-41
93
Pla
tin
g &
Co
atin
g M
ach
ine
Op
era
tors
No
ne
Mo
der
ate
-te
rm0
.11
9%
51
-41
99
Me
tal W
rkrs
& P
last
ic W
rkrs
, All
Oth
er
No
ne
Mo
der
ate
-te
rm0
.11
0%
51
-51
12
Pri
nti
ng
Pre
ss O
pe
rato
rsN
on
eM
od
erat
e-t
erm
0.0
75
%
51
-60
62
Te
xtile
Cu
ttin
g M
ach
ine
Op
era
tors
No
ne
Mo
der
ate
-te
rm0
.05
7%
51
-60
91
Ext
rud
ing
& F
orm
ing
Mac
hin
e O
pe
rato
rsN
on
eM
od
erat
e-t
erm
0.0
40
%
51
-60
93
Up
ho
lste
rers
No
ne
Mo
der
ate
-te
rm0
.29
1%
51
-70
11
Cab
inet
mak
ers
& B
en
ch C
arp
en
ters
No
ne
Mo
der
ate
-te
rm0
.85
6%
51
-70
21
Fu
rnit
ure
Fin
ish
ers
No
ne
Sho
rt-t
erm
0.0
57
%
51
-70
41
Saw
ing
Mac
hin
e O
pe
rato
rs, W
oo
dN
on
eSh
ort
-te
rm0
.09
7%
51
-70
42
Wo
od
wo
rkin
g M
ach
ine
Op
era
tors
, Exc
ep
t Sa
win
gN
on
eSh
ort
-te
rm0
.31
3%
51
-80
31
Wat
er
& W
aste
wat
er
Trea
tme
nt
Pla
nt
Op
era
tors
No
ne
Lon
g-te
rm0
.07
9%
51
-90
11
Ch
em
ical
Eq
uip
me
nt
Op
era
tors
& T
en
de
rsN
on
eM
od
erat
e-t
erm
0.0
35
%
51
-90
23
Mix
ing
& B
len
din
g M
ach
ine
Op
era
tors
No
ne
Mo
der
ate
-te
rm0
.15
4%
51
-90
32
Cu
ttin
g &
Slic
ing
Mac
hin
e O
pe
rato
rsN
on
eSh
ort
-te
rm0
.18
5%
51
-90
41
Ext
rud
ing,
etc
Mac
hin
e O
per
ato
rsN
on
eM
od
erat
e-t
erm
0.0
35
%
51
-90
61
Insp
ect
ors
, Te
ste
rs, e
tcN
on
eM
od
erat
e-t
erm
0.8
39
%
51
-91
11
Pac
kagi
ng
Mac
hin
e O
pe
rato
rsN
on
eM
od
erat
e-t
erm
0.4
55
%
51
-91
21
Co
atin
g, P
ain
tin
g, e
tc M
ach
ine
Op
era
tors
No
ne
Mo
der
ate
-te
rm0
.30
9%
51
-91
22
Pai
nte
rs, T
ran
spo
rtat
ion
Eq
uip
me
nt
No
ne
Mo
der
ate
-te
rm0
.17
2%
51
-91
51
Ph
oto
grap
hic
Pro
cess
Wrk
rsN
on
eSh
ort
-te
rm0
.03
1%
Tab
le B
-8:
Occ
up
atio
ns
Edu
cati
on
an
d T
rain
ing
Req
uir
em
ents
(co
nti
nu
ed
)
No
rth
cen
tral
Ind
ian
a R
egi
on
1
Hig
h S
cho
ol D
iplo
ma
(co
nti
nu
ed)
Northcentral Indiana Regional Development Authority 75

Occ
up
atio
n C
od
e a
nd
Tit
le
Entr
y
Exp
eri
en
ce
Typ
ical
OJT
Ne
ed
ed
% o
f
Emp
loym
en
t2
51
-91
91
Ad
he
sive
Bo
nd
ing
Mac
hin
e O
pe
rato
rs &
Te
nd
ers
No
ne
Mo
der
ate
-te
rm0
.19
9%
51
-91
95
Mo
lde
rs, S
hap
ers
, etc
, Exc
Me
tal &
Pla
stic
No
ne
Lon
g-te
rm0
.02
2%
51
-91
96
Pap
er
Go
od
s M
ach
ine
Op
era
tors
No
ne
Mo
der
ate
-te
rm0
.10
2%
51
-91
99
Pro
du
ctio
n W
rkrs
, All
Oth
er
No
ne
Mo
der
ate
-te
rm0
.20
7%
53
-10
21
Fir
st-L
ine
Su
per
viso
rs o
f H
elp
ers
, Lab
ore
rs, e
tcLe
ss t
han
5 y
ear
sN
on
e0
.13
7%
53
-10
31
Fir
st-L
ine
Su
per
v o
f M
atl-
Mo
vin
g V
eh O
pe
rato
rsLe
ss t
han
5 y
ear
sN
on
e0
.16
8%
53
-30
21
Bu
s D
rive
rs, T
ran
sit
& In
terc
ity
No
ne
Mo
der
ate
-te
rm0
.11
5%
53
-30
22
Bu
s D
rive
rs, S
cho
ol o
r Sp
eci
al C
lien
tN
on
eSh
ort
-te
rm0
.42
8%
53
-30
31
Dri
ver/
Sale
s W
rkrs
No
ne
Sho
rt-t
erm
0.2
56
%
53
-30
33
Lig
ht
Tru
ck o
r D
eliv
ery
Se
rvic
es
Dri
vers
No
ne
Sho
rt-t
erm
0.6
36
%
T
ota
l Hig
h S
cho
ol D
iplo
ma
44
.89
1%
25
-40
31
Lib
rary
Te
chn
icia
ns
No
ne
No
ne
0.1
37
%
27
-40
11
Au
dio
& V
ide
o E
qu
ipm
en
t Te
chn
icia
ns
No
ne
Sho
rt-t
erm
0.0
26
%
29
-20
41
Em
erg
en
cy M
ed
ical
Te
chn
icia
ns
& P
aram
ed
ics
No
ne
No
ne
0.1
10
%
29
-20
55
Su
rgic
al T
ech
no
logi
sts
No
ne
No
ne
0.0
57
%
29
-20
61
Lic
ense
d P
ract
ical
& L
ice
nse
d V
oca
tio
nal
Nu
rses
No
ne
No
ne
0.4
72
%
29
-20
71
Me
dic
al R
eco
rds
& H
eal
th In
fo. T
ech
nic
ian
sN
on
eN
on
e0
.18
1%
31
-10
14
Nu
rsin
g A
ssis
tan
tsN
on
eN
on
e1
.00
6%
31
-90
11
Mas
sage
Th
erap
ists
No
ne
No
ne
0.0
22
%
31
-90
91
De
nta
l Ass
ista
nts
No
ne
No
ne
0.1
81
%
31
-90
92
Me
dic
al A
ssis
tan
tsN
on
eN
on
e0
.51
2%
31
-90
94
Me
dic
al T
ran
scri
pti
on
ists
No
ne
No
ne
0.0
49
%
31
-90
97
Ph
leb
oto
mis
tsN
on
eN
on
e0
.13
2%
33
-20
11
Fir
efig
hte
rsN
on
eLo
ng-
term
0.4
37
%
39
-50
12
Hai
rdre
sse
rs, H
airs
tylis
ts &
Co
sme
tolo
gist
sN
on
eN
on
e0
.33
1%
39
-50
94
Ski
nca
re S
pe
cial
ists
No
ne
No
ne
0.0
18
%
49
-20
22
Te
leco
mm
un
icat
ion
s Eq
uip
me
nt
Inst
alle
rsN
on
eM
od
erat
e-t
erm
0.1
46
%
49
-20
92
Ele
ctri
c M
oto
r, P
ow
er T
oo
l & R
ela
ted
Re
pai
rers
No
ne
Lon
g-te
rm0
.01
8%
Po
stse
con
dar
y N
on
de
gre
e C
ert
ific
ate
Tab
le B
-8:
Occ
up
atio
ns
Edu
cati
on
an
d T
rain
ing
Req
uir
em
ents
(co
nti
nu
ed
)
No
rth
cen
tral
Ind
ian
a R
egi
on
1
Hig
h S
cho
ol D
iplo
ma
(co
nti
nu
ed)
Northcentral Indiana Regional Development Authority 76

Occ
up
atio
n C
od
e a
nd
Tit
le
Entr
y
Exp
eri
en
ce
Typ
ical
OJT
Ne
ed
ed
% o
f
Emp
loym
en
t2
49
-20
93
Ele
ctri
cal I
nst
alle
rs &
Re
pai
rers
, Tra
nsp
. Eq
uip
.N
on
eLo
ng-
term
0.0
49
%
49
-20
94
Ele
ctri
cal R
ep
aire
rs, C
om
m'l
& In
du
st. E
qu
ipN
on
eLo
ng-
term
0.0
26
%
49
-30
23
Au
tom
oti
ve S
erv
ice
Te
chn
icia
ns
& M
ech
anic
sN
on
eSh
ort
-te
rm0
.50
8%
49
-90
21
He
atin
g, A
ir C
on
dit
ion
ing
& R
ef.
Me
chan
ics
No
ne
Lon
g-te
rm0
.14
6%
53
-30
32
He
avy
& T
ract
or-
Trai
ler
Tru
ck D
rive
rsN
on
eSh
ort
-te
rm1
.67
3%
T
ota
l Po
stse
con
dar
y N
on
de
gre
e C
ert
ific
ate
6.2
36
%
15
-11
51
Co
mp
ute
r U
ser
Sup
po
rt S
pe
cial
ists
No
ne
No
ne
0.2
07
%
25
-90
41
Te
ach
er A
ssis
tan
tsN
on
eN
on
e1
.00
6%
43
-30
31
Bo
okk
eep
ing,
Acc
ou
nti
ng
& A
ud
itin
g C
lerk
sN
on
eM
od
erat
e-t
erm
1.2
62
%
49
-20
11
Co
mp
ute
r &
Off
ice
Mac
hin
e R
ep
aire
rsN
on
eSh
ort
-te
rm0
.09
3%
T
ota
l So
me
Co
lle
ge, N
o D
egr
ee
2.5
69
%
15
-11
34
We
b D
eve
lop
ers
No
ne
No
ne
0.0
79
%
17
-30
11
Arc
hit
ect
ura
l & C
ivil
Dra
fte
rsN
on
eN
on
e0
.06
2%
17
-30
13
Me
chan
ical
Dra
fter
sN
on
eN
on
e0
.15
4%
17
-30
22
Civ
il En
gin
ee
rin
g Te
chn
icia
ns
No
ne
No
ne
0.0
18
%
17
-30
23
Ele
ctri
cal &
Ele
ctro
nic
s En
gin
ee
rin
g Te
chn
icia
ns
No
ne
No
ne
0.0
62
%
17
-30
26
Ind
ust
rial
En
gin
eeri
ng
Tech
nic
ian
sN
on
eN
on
e0
.07
9%
17
-30
27
Me
chan
ical
En
gin
ee
rin
g Te
chn
icia
ns
No
ne
No
ne
0.0
40
%
19
-40
31
Ch
em
ical
Te
chn
icia
ns
No
ne
Mo
der
ate
-te
rm0
.06
6%
23
-20
11
Par
aleg
als
& L
ega
l Ass
ista
nts
No
ne
No
ne
0.1
41
%
25
-20
11
Pre
sch
oo
l Te
ach
ers,
Exc
ep
t Sp
eci
al E
du
cati
on
No
ne
No
ne
0.1
24
%
29
-20
12
Me
dic
al &
Clin
ical
Lab
ora
tory
Te
chn
icia
ns
No
ne
No
ne
0.0
88
%
29
-20
21
De
nta
l Hyg
ien
ists
No
ne
No
ne
0.2
21
%
29
-20
32
Dia
gno
stic
Me
dic
al S
on
ogr
aph
ers
No
ne
No
ne
0.0
57
%
29
-20
34
Rad
iolo
gic
Tech
no
logi
sts
No
ne
No
ne
0.1
10
%
29
-20
35
Mag
ne
tic
Re
son
ance
Imag
ing
Tech
no
logi
sts
Less
th
an 5
ye
ars
No
ne
0.0
18
%
29
-20
51
Die
teti
c Te
chn
icia
ns
No
ne
No
ne
0.0
22
%
Tab
le B
-8:
Occ
up
atio
ns
Edu
cati
on
an
d T
rain
ing
Req
uir
em
ents
(co
nti
nu
ed
)
No
rth
cen
tral
Ind
ian
a R
egi
on
1
Po
stse
con
dar
y N
on
de
gre
e C
ert
ific
ate
(co
nti
nu
ed
)
Som
e C
oll
ege
, No
De
gree
Ass
oci
ate
's D
egr
ee
Northcentral Indiana Regional Development Authority 77

Occ
up
atio
n C
od
e a
nd
Tit
le
Entr
y
Exp
eri
en
ce
Typ
ical
OJT
Ne
ed
ed
% o
f
Emp
loym
en
t2
29
-20
56
Ve
teri
nar
y Te
chn
olo
gist
s &
Te
chn
icia
ns
No
ne
No
ne
0.0
31
%
31
-20
21
Ph
ysic
al T
he
rap
ist
Ass
ista
nts
No
ne
No
ne
0.0
49
%
43
-41
61
Hu
man
Re
s. A
ssis
tan
ts, E
xc, P
ayro
ll &
Tim
eke
ep
ing
No
ne
No
ne
0.0
79
%
49
-90
62
Me
dic
al E
qu
ipm
ent
Re
pai
rers
No
ne
Mo
der
ate
-te
rm0
.04
0%
T
ota
l Ass
oci
ate
's D
egr
ee
1.5
40
%
11
-10
11
Ch
ief
Exe
cuti
ves
5 y
ears
or
mo
reN
on
e0
.19
0%
11
-10
21
Ge
ne
ral &
Op
era
tio
ns
Man
age
rs5
yea
rs o
r m
ore
No
ne
1.4
65
%
11
-10
31
Le
gisl
ato
rsLe
ss t
han
5 y
ear
sN
on
e0
.02
6%
11
-20
21
Mar
keti
ng
Man
age
rs5
yea
rs o
r m
ore
No
ne
0.1
15
%
11
-20
22
Sal
es M
anag
ers
Less
th
an 5
ye
ars
No
ne
0.3
44
%
11
-30
11
Ad
min
istr
ativ
e S
ervi
ces
Man
age
rsLe
ss t
han
5 y
ear
sN
on
e0
.13
2%
11
-30
21
Co
mp
ute
r &
Info
rmat
ion
Sys
tem
s M
anag
ers
5 y
ears
or
mo
reN
on
e0
.10
2%
11
-30
31
Fin
anci
al M
anag
ers
5 y
ears
or
mo
reN
on
e0
.30
0%
11
-30
51
Ind
ust
rial
Pro
du
ctio
n M
anag
ers
5 y
ears
or
mo
reN
on
e0
.38
4%
11
-30
61
Pu
rch
asin
g M
anag
ers
5 y
ears
or
mo
reN
on
e0
.08
4%
11
-31
21
Hu
man
Re
sou
rces
Man
ager
s5
yea
rs o
r m
ore
No
ne
0.0
71
%
11
-90
21
Co
nst
ruct
ion
Man
ager
sN
on
eM
od
erat
e-t
erm
0.1
19
%
11
-90
31
Ed
uca
tio
n A
dm
inis
trat
ors
, Pre
sch
oo
lLe
ss t
han
5 y
ear
sN
on
e0
.01
8%
11
-90
41
Arc
hit
ect
ura
l & E
ngi
ne
eri
ng
Man
ager
s5
yea
rs o
r m
ore
No
ne
0.1
02
%
11
-91
11
Me
dic
al &
Hea
lth
Se
rvic
es
Man
age
rsLe
ss t
han
5 y
ear
sN
on
e0
.23
4%
11
-91
51
So
cial
& C
om
mu
nit
y Se
rvic
e M
anag
ers
5 y
ears
or
mo
reN
on
e0
.08
4%
11
-91
99
Man
age
rs, A
ll O
the
rLe
ss t
han
5 y
ear
sN
on
e0
.26
0%
13
-10
22
Wh
ole
sale
& R
eta
il B
uye
rs, E
xce
pt
Farm
Pro
du
cts
No
ne
Lon
g-te
rm0
.04
4%
13
-10
23
Pu
rch
asin
g A
gen
ts, E
xcep
t W
ho
lesa
le, R
eta
il &
Far
mN
on
eLo
ng-
term
0.3
22
%
13
-10
41
Co
mp
lian
ce O
ffic
ers
No
ne
Mo
der
ate
-te
rm0
.08
8%
13
-10
51
Co
st E
stim
ato
rsN
on
eN
on
e0
.15
0%
13
-10
71
Hu
man
Re
sou
rces
Sp
ecia
lists
No
ne
No
ne
0.3
09
%
13
-10
75
Lab
or
Re
lati
on
s Sp
eci
alis
tsLe
ss t
han
5 y
ear
sN
on
e0
.08
4%
Tab
le B
-8:
Occ
up
atio
ns
Edu
cati
on
an
d T
rain
ing
Req
uir
em
ents
(co
nti
nu
ed
)
No
rth
cen
tral
Ind
ian
a R
egi
on
1
Ass
oci
ate
's D
egr
ee
(co
nti
nu
ed
)
Bac
he
lor'
s D
egr
ee
Northcentral Indiana Regional Development Authority 78

Occ
up
atio
n C
od
e a
nd
Tit
le
Entr
y
Exp
eri
en
ce
Typ
ical
OJT
Ne
ed
ed
% o
f
Emp
loym
en
t2
13
-10
81
Lo
gist
icia
ns
No
ne
No
ne
0.0
44
%
13
-11
11
Man
age
men
t A
nal
ysts
Less
th
an 5
ye
ars
No
ne
0.1
46
%
13
-11
21
Me
eti
ng,
Co
nve
nti
on
& E
ven
t P
lan
ne
rsN
on
eN
on
e0
.03
1%
13
-11
31
Fu
nd
rais
ers
No
ne
No
ne
0.0
26
%
13
-11
41
Co
mp
en
sati
on
, Be
ne
fits
& J
ob
An
alys
tsLe
ss t
han
5 y
ear
sN
on
e0
.01
8%
13
-11
51
Tra
inin
g &
De
velo
pm
en
t Sp
eci
alis
tsLe
ss t
han
5 y
ear
sN
on
e0
.12
8%
13
-11
61
Mar
ket
Re
sear
ch A
nal
ysts
& M
arke
tin
g Sp
eci
alis
tsN
on
eN
on
e0
.26
0%
13
-11
99
Bu
sin
ess
Op
era
tio
ns
Spe
cial
ists
, All
Oth
er
No
ne
No
ne
0.2
52
%
13
-20
11
Acc
ou
nta
nts
& A
ud
ito
rsN
on
eN
on
e0
.78
6%
13
-20
21
Ap
pra
iser
s &
Ass
ess
ors
of
Re
al E
stat
eN
on
eLo
ng-
term
0.0
22
%
13
-20
41
Cre
dit
An
alys
tsN
on
eN
on
e0
.01
8%
13
-20
51
Fin
anci
al A
nal
ysts
No
ne
No
ne
0.1
19
%
13
-20
52
Pe
rso
nal
Fin
anci
al A
dvi
sors
No
ne
Lon
g-te
rm0
.08
8%
13
-20
72
Lo
an O
ffic
ers
No
ne
Mo
der
ate
-te
rm0
.10
2%
13
-20
81
Tax
Exa
min
ers
& C
olle
cto
rs &
Re
ven
ue
Age
nts
No
ne
Mo
der
ate
-te
rm0
.01
3%
15
-11
21
Co
mp
ute
r Sy
ste
ms
An
alys
tsN
on
eN
on
e0
.15
0%
15
-11
31
Co
mp
ute
r P
rogr
amm
ers
No
ne
No
ne
0.0
75
%
15
-11
32
So
ftw
are
De
velo
pe
rs, A
pp
licat
ion
sN
on
eN
on
e0
.11
9%
15
-11
33
So
ftw
are
De
velo
pe
rs, S
yste
ms
Soft
war
eN
on
eN
on
e0
.02
2%
15
-11
41
Dat
abas
e A
dm
inis
trat
ors
Less
th
an 5
ye
ars
No
ne
0.0
44
%
15
-11
42
Ne
two
rk &
Co
mp
ute
r Sy
ste
ms
Ad
min
istr
ato
rsN
on
eN
on
e0
.24
3%
15
-11
99
Co
mp
ute
r O
ccu
pat
ion
s, A
ll O
the
rN
on
eN
on
e0
.01
3%
15
-20
31
Op
era
tio
ns
Re
sear
ch A
nal
ysts
No
ne
No
ne
0.0
13
%
17
-10
11
Arc
hit
ect
s, E
xce
pt
Lan
dsc
ape
& N
aval
No
ne
Inte
rnsh
ip/r
esi
de
ncy
0.0
49
%
17
-20
51
Civ
il En
gin
ee
rsN
on
eN
on
e0
.03
5%
17
-20
71
Ele
ctri
cal E
ngi
ne
ers
No
ne
No
ne
0.0
22
%
17
-20
72
Ele
ctro
nic
s En
gin
ee
rs, E
xce
pt
Co
mp
ute
rN
on
eN
on
e0
.01
8%
17
-21
12
Ind
ust
rial
En
gin
eers
No
ne
No
ne
0.3
27
%
17
-21
31
Mat
eri
als
Engi
ne
ers
No
ne
No
ne
0.0
13
%
Tab
le B
-8:
Occ
up
atio
ns
Edu
cati
on
an
d T
rain
ing
Req
uir
em
ents
(co
nti
nu
ed
)
No
rth
cen
tral
Ind
ian
a R
egi
on
1
Bac
he
lor'
s D
egr
ee
(co
nti
nu
ed
)
Northcentral Indiana Regional Development Authority 79

Occ
up
atio
n C
od
e a
nd
Tit
le
Entr
y
Exp
eri
en
ce
Typ
ical
OJT
Ne
ed
ed
% o
f
Emp
loym
en
t2
17
-21
41
Me
chan
ical
En
gin
ee
rsN
on
eN
on
e0
.35
8%
19
-20
31
Ch
em
ists
No
ne
No
ne
0.0
35
%
19
-20
41
En
viro
nm
en
tal S
cie
nti
sts
& S
pe
cial
ists
, In
cl. H
eal
thN
on
eN
on
e0
.03
5%
21
-10
11
Su
bst
ance
Ab
use
& B
eh
avio
ral D
iso
rde
r C
ou
nse
lors
No
ne
No
ne
0.0
40
%
21
-10
21
Ch
ild, F
amily
& S
cho
ol S
oci
al W
rkrs
No
ne
No
ne
0.2
03
%
21
-10
23
Me
nta
l He
alth
& S
ub
stan
ce A
bu
se S
oci
al W
rkrs
No
ne
No
ne
0.0
26
%
21
-10
91
He
alth
Ed
uca
tors
No
ne
No
ne
0.0
18
%
21
-10
92
Pro
bat
ion
Off
ice
rs &
Co
rre
ctio
nal
Tre
atm
en
t Sp
ec.
No
ne
Sho
rt-t
erm
0.0
49
%
21
-20
11
Cle
rgy
No
ne
Mo
der
ate
-te
rm0
.01
3%
21
-20
21
Dir
ecto
rs, R
elig
iou
s A
ctiv
itie
s &
Ed
uca
tio
nLe
ss t
han
5 y
ear
sN
on
e0
.02
2%
25
-20
12
Kin
de
rgar
ten
Tea
che
rs, E
xce
pt
Spe
cial
Ed
uca
tio
nN
on
eIn
tern
ship
/re
sid
en
cy0
.11
9%
25
-20
21
Ele
me
nta
ry S
cho
ol T
eac
he
rs, E
xc. S
pe
cial
Ed
uca
tio
nN
on
eIn
tern
ship
/re
sid
en
cy0
.92
7%
25
-20
22
Mid
dle
Sch
oo
l Te
ach
ers,
Exc
ep
t Sp
ec.
Ed
uca
tio
nN
on
eIn
tern
ship
/re
sid
en
cy0
.35
8%
25
-20
31
Sec
on
dar
y Sc
ho
ol T
eac
he
rs, E
xce
pt
Spe
c. E
du
cati
on
No
ne
Inte
rnsh
ip/r
esi
de
ncy
0.6
00
%
25
-20
32
Car
eer/
Tech
nic
al E
du
cati
on
Te
ach
ers
, Se
con
dar
yLe
ss t
han
5 y
ear
sIn
tern
ship
/re
sid
en
cy0
.07
9%
25
-20
52
Sp
eci
al E
du
cati
on
Te
ach
ers
, Ele
men
tary
Sch
oo
lN
on
eIn
tern
ship
/re
sid
en
cy0
.08
8%
25
-20
53
Sp
eci
al E
du
cati
on
Te
ach
ers
, Mid
dle
Sch
oo
lN
on
eIn
tern
ship
/re
sid
en
cy0
.04
0%
25
-20
54
Sp
eci
al E
du
cati
on
Te
ach
ers
, Se
con
dar
y Sc
ho
ol
No
ne
Inte
rnsh
ip/r
esi
de
ncy
0.1
10
%
25
-30
11
Ad
ult
Bas
ic &
Se
con
dar
y Ed
. & L
ite
racy
Te
ach
ers
No
ne
Inte
rnsh
ip/r
esi
de
ncy
0.0
31
%
25
-30
97
Te
ach
ers,
All
Oth
er,
Exc
ep
t Su
bst
itu
te T
eac
her
sN
on
e0
.06
6%
25
-30
98
Su
bst
itu
te T
eac
her
sN
on
e0
.50
3%
27
-10
21
Co
mm
erc
ial &
Ind
ust
rial
De
sign
ers
No
ne
No
ne
0.0
79
%
27
-10
24
Gra
ph
ic D
esi
gne
rsN
on
eN
on
e0
.15
0%
27
-10
25
Inte
rio
r D
esig
ne
rsN
on
eN
on
e0
.03
1%
27
-20
12
Pro
du
cers
& D
ire
cto
rsLe
ss t
han
5 y
ear
sN
on
e0
.02
2%
27
-20
22
Co
ach
es &
Sco
uts
No
ne
No
ne
0.3
53
%
27
-30
22
Re
po
rte
rs &
Co
rre
spo
nd
en
tsN
on
eN
on
e0
.03
1%
27
-30
31
Pu
blic
Re
lati
on
s Sp
ecia
lists
No
ne
No
ne
0.0
75
%
27
-30
41
Ed
ito
rsLe
ss t
han
5 y
ear
sN
on
e0
.02
2%
Tab
le B
-8:
Occ
up
atio
ns
Edu
cati
on
an
d T
rain
ing
Req
uir
em
ents
(co
nti
nu
ed
)
No
rth
cen
tral
Ind
ian
a R
egi
on
1
Bac
he
lor'
s D
egr
ee
(co
nti
nu
ed
)
Northcentral Indiana Regional Development Authority 80

Occ
up
atio
n C
od
e a
nd
Tit
le
Entr
y
Exp
eri
en
ce
Typ
ical
OJT
Ne
ed
ed
% o
f
Emp
loym
en
t2
27
-30
91
Inte
rpre
ters
& T
ran
slat
ors
No
ne
Sho
rt-t
erm
0.0
26
%
29
-10
31
Die
titi
ans
& N
utr
itio
nis
tsN
on
eIn
tern
ship
/re
sid
en
cy0
.01
8%
29
-11
41
Re
gist
ere
d N
urs
es
No
ne
No
ne
1.8
45
%
29
-20
11
Me
dic
al &
Clin
ical
Lab
ora
tory
Te
chn
olo
gist
sN
on
eN
on
e0
.11
5%
29
-90
11
Occ
up
atio
nal
He
alth
& S
afet
y Sp
ecia
lists
No
ne
No
ne
0.0
35
%
29
-90
91
Ath
leti
c Tr
ain
ers
No
ne
No
ne
0.0
18
%
41
-30
31
Sec
uri
ties
, Co
mm
od
itie
s &
Fin
anci
al S
vcs
Sale
s A
gts
No
ne
Mo
der
ate
-te
rm0
.10
6%
41
-40
11
Sal
es R
ep
s, T
ech
nic
al &
Sci
enti
fic
Pro
du
cts
No
ne
Mo
der
ate
-te
rm0
.19
4%
41
-90
31
Sal
es E
ngi
ne
ers
No
ne
Mo
der
ate
-te
rm0
.02
2%
T
ota
l Bac
he
lor'
s D
egr
ee
15
.08
6%
11
-90
32
Ed
uca
tio
n A
dm
inis
trat
ors
, Ele
me
nta
ry &
Se
con
dar
y5
yea
rs o
r m
ore
No
ne
0.1
24
%
11
-90
33
Ed
uca
tio
n A
dm
inis
trat
ors
, Po
stse
con
dar
yLe
ss t
han
5 y
ear
sN
on
e0
.11
0%
19
-30
51
Urb
an &
Re
gio
nal
Pla
nn
ers
No
ne
No
ne
0.0
22
%
21
-10
12
Ed
uca
tio
nal
, Gu
idan
ce &
Vo
cati
on
al C
ou
nse
lors
No
ne
No
ne
0.1
50
%
21
-10
15
Re
hab
ilita
tio
n C
ou
nse
lors
No
ne
No
ne
0.0
13
%
21
-10
22
He
alth
care
So
cial
Wrk
rsN
on
eN
on
e0
.12
4%
21
-10
99
Co
mm
un
ity
& S
oci
al S
erv
ice
Sp
eci
alis
ts, A
ll O
the
rN
on
eN
on
e0
.01
8%
25
-10
72
Nu
rsin
g In
stru
cto
rs &
Te
ach
ers
, Po
stse
con
dar
yLe
ss t
han
5 y
ear
sN
on
e0
.05
3%
25
-11
21
Art
, Dra
ma
& M
usi
c Te
ach
ers,
Po
stse
con
dar
yN
on
eN
on
e0
.12
4%
25
-40
21
Lib
rari
ans
No
ne
No
ne
0.1
19
%
25
-90
31
Inst
ruct
ion
al C
oo
rdin
ato
rs5
yea
rs o
r m
ore
No
ne
0.0
40
%
29
-10
71
Ph
ysic
ian
Ass
ista
nts
No
ne
No
ne
0.0
22
%
29
-11
22
Occ
up
atio
nal
Th
era
pis
tsN
on
eN
on
e0
.07
5%
29
-11
27
Sp
ee
ch-L
angu
age
Pat
ho
logi
sts
No
ne
No
ne
0.0
79
%
29
-11
71
Nu
rse
Pra
ctit
ion
ers
No
ne
No
ne
0.0
97
%
T
ota
l Mas
ter'
s D
egr
ee
1.1
70
%
Bac
he
lor'
s D
egr
ee
(co
nti
nu
ed
)
Mas
ter'
s D
egr
ee
Tab
le B
-8:
Occ
up
atio
ns
Edu
cati
on
an
d T
rain
ing
Req
uir
em
ents
(co
nti
nu
ed
)
No
rth
cen
tral
Ind
ian
a R
egi
on
1
Northcentral Indiana Regional Development Authority 81
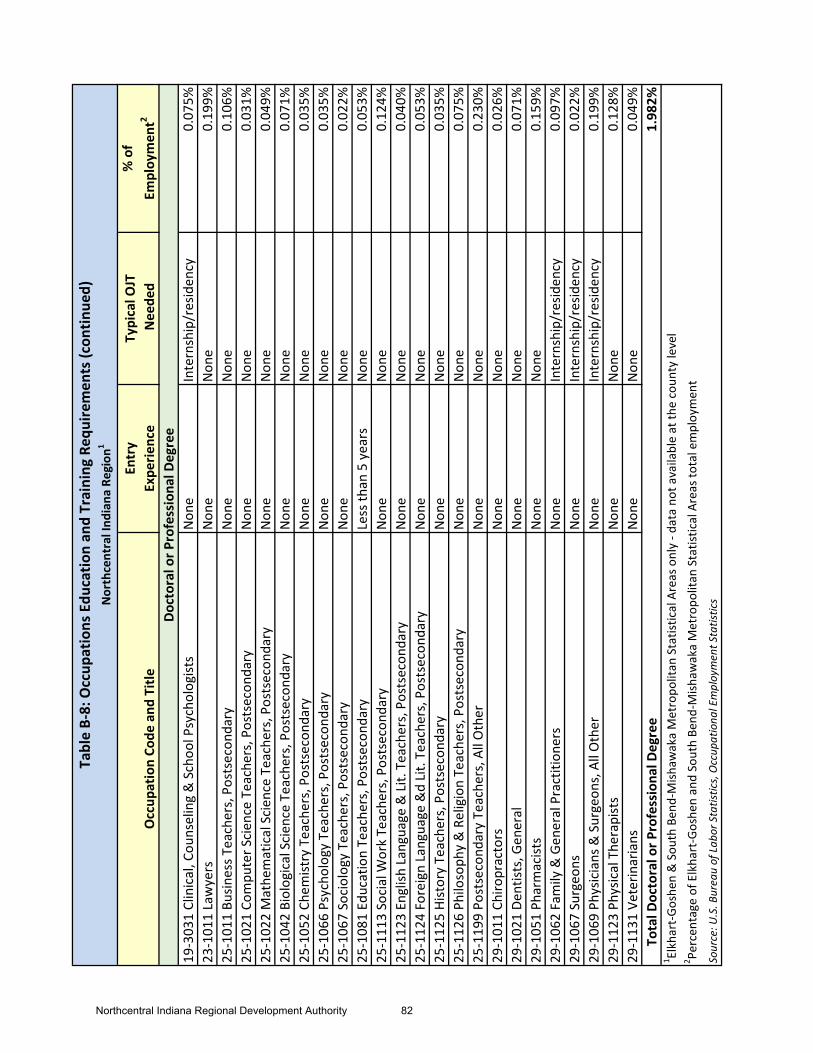
Occ
up
atio
n C
od
e a
nd
Tit
le
Entr
y
Exp
eri
en
ce
Typ
ical
OJT
Ne
ed
ed
% o
f
Emp
loym
en
t2
19
-30
31
Clin
ical
, Co
un
selin
g &
Sch
oo
l Psy
cho
logi
sts
No
ne
Inte
rnsh
ip/r
esi
de
ncy
0.0
75
%
23
-10
11
Law
yers
No
ne
No
ne
0.1
99
%
25
-10
11
Bu
sin
ess
Teac
he
rs, P
ost
seco
nd
ary
No
ne
No
ne
0.1
06
%
25
-10
21
Co
mp
ute
r Sc
ien
ce T
eac
her
s, P
ost
seco
nd
ary
No
ne
No
ne
0.0
31
%
25
-10
22
Mat
he
mat
ical
Sci
en
ce T
eac
her
s, P
ost
seco
nd
ary
No
ne
No
ne
0.0
49
%
25
-10
42
Bio
logi
cal S
cie
nce
Te
ach
ers,
Po
stse
con
dar
yN
on
eN
on
e0
.07
1%
25
-10
52
Ch
em
istr
y Te
ach
ers,
Po
stse
con
dar
yN
on
eN
on
e0
.03
5%
25
-10
66
Psy
cho
logy
Te
ach
ers,
Po
stse
con
dar
yN
on
eN
on
e0
.03
5%
25
-10
67
So
cio
logy
Te
ach
ers
, Po
stse
con
dar
yN
on
eN
on
e0
.02
2%
25
-10
81
Ed
uca
tio
n T
eac
he
rs, P
ost
seco
nd
ary
Less
th
an 5
ye
ars
No
ne
0.0
53
%
25
-11
13
So
cial
Wo
rk T
eac
her
s, P
ost
seco
nd
ary
No
ne
No
ne
0.1
24
%
25
-11
23
En
glis
h L
angu
age
& L
it. T
eac
her
s, P
ost
seco
nd
ary
No
ne
No
ne
0.0
40
%
25
-11
24
Fo
reig
n L
angu
age
&d
Lit
. Te
ach
ers,
Po
stse
con
dar
yN
on
eN
on
e0
.05
3%
25
-11
25
His
tory
Te
ach
ers,
Po
stse
con
dar
yN
on
eN
on
e0
.03
5%
25
-11
26
Ph
iloso
ph
y &
Re
ligio
n T
eac
her
s, P
ost
seco
nd
ary
No
ne
No
ne
0.0
75
%
25
-11
99
Po
stse
con
dar
y Te
ach
ers
, All
Oth
er
No
ne
No
ne
0.2
30
%
29
-10
11
Ch
iro
pra
cto
rsN
on
eN
on
e0
.02
6%
29
-10
21
De
nti
sts,
Ge
ne
ral
No
ne
No
ne
0.0
71
%
29
-10
51
Ph
arm
acis
tsN
on
eN
on
e0
.15
9%
29
-10
62
Fam
ily &
Ge
ne
ral P
ract
itio
ne
rsN
on
eIn
tern
ship
/re
sid
en
cy0
.09
7%
29
-10
67
Su
rge
on
sN
on
eIn
tern
ship
/re
sid
en
cy0
.02
2%
29
-10
69
Ph
ysic
ian
s &
Su
rgeo
ns,
All
Oth
er
No
ne
Inte
rnsh
ip/r
esi
de
ncy
0.1
99
%
29
-11
23
Ph
ysic
al T
he
rap
ists
No
ne
No
ne
0.1
28
%
29
-11
31
Ve
teri
nar
ian
sN
on
eN
on
e0
.04
9%
T
ota
l Do
cto
ral o
r P
rofe
ssio
nal
De
gre
e1
.98
2%
Sou
rce:
U.S
. Bu
rea
u o
f La
bo
r St
ati
stic
s, O
ccu
pa
tio
na
l Em
plo
ymen
t St
ati
stic
s
Tab
le B
-8:
Occ
up
atio
ns
Edu
cati
on
an
d T
rain
ing
Req
uir
em
ents
(co
nti
nu
ed
)
No
rth
cen
tral
Ind
ian
a R
egi
on
1
Do
cto
ral o
r P
rofe
ssio
nal
De
gre
e
1El
khar
t-G
osh
en &
So
uth
Ben
d-M
ish
awak
a M
etro
po
litan
Sta
tist
ical
Are
as o
nly
- d
ata
no
t av
aila
ble
at
the
cou
nty
leve
l2P
erce
nta
ge o
f El
khar
t-G
osh
en a
nd
So
uth
Ben
d-M
ish
awak
a M
etro
po
litan
Sta
tist
ical
Are
as t
ota
l em
plo
ymen
t
Northcentral Indiana Regional Development Authority 82

Sub
ject
NC
IA
pp
leto
n
Ce
dar
Rap
ids
Lan
cast
er
Wic
hit
a
Yo
rk-
Han
ove
r
20
10
26
2,5
46
12
5,6
03
13
9,8
33
26
6,2
22
31
7,8
86
23
1,7
08
20
11
25
9,9
91
12
5,7
79
14
1,8
78
26
9,2
06
32
0,4
84
23
3,9
76
20
12
25
9,7
75
12
6,6
51
14
2,3
98
27
0,9
73
32
2,1
43
23
4,3
39
20
13
25
8,3
76
12
6,6
86
14
3,0
75
27
2,9
56
32
4,1
18
23
4,8
08
20
14
25
8,9
80
12
6,7
45
14
3,5
55
27
4,6
29
32
3,2
48
23
5,3
54
20
11
-0.9
7%
0.1
4%
1.4
6%
1.1
2%
0.8
2%
0.9
8%
20
12
-0.0
8%
0.6
9%
0.3
7%
0.6
6%
0.5
2%
0.1
6%
20
13
-0.5
4%
0.0
3%
0.4
8%
0.7
3%
0.6
1%
0.2
0%
20
14
0.2
3%
0.0
5%
0.3
4%
0.6
1%
-0.2
7%
0.2
3%
20
10
- 2
01
4 C
han
ge-1
.36
%0
.91
%2
.66
%3
.16
%1
.69
%1
.57
%
20
10
- 2
01
4 C
om
po
un
d A
nn
ual
Gro
wth
Rat
e-0
.34
%0
.23
%0
.66
%0
.78
%0
.42
%0
.39
%
Tab
le B
-9: C
ivili
an W
ork
forc
e G
row
th, 2
01
0 -
20
14
No
rth
cen
tral
Ind
ian
a R
egi
on
an
d B
en
chm
ark
Me
tro
po
litan
Are
as
Civ
ilian
Wo
rkfo
rce
Nu
mb
er
Civ
ilian
Wo
rkfo
rce
Gro
wth
Rat
e
Sou
rce:
U.S
. Cen
sus
Bu
rea
u, P
op
ula
tio
n D
ivis
ion
Northcentral Indiana Regional Development Authority 83

Edu
cati
on
Att
ain
me
nt
Leve
lN
CI
Ap
ple
ton
Ce
dar
Rap
ids
Lan
cast
er
Wic
hit
a
Yo
rk-
Han
ove
r
Less
th
an 9
th g
rad
e5
.3%
2.6
%1
.9%
6.8
%3
.9%
3.6
%
9th
to
12
th g
rad
e, n
o d
iplo
ma
9.4
%4
.4%
4.4
%8
.8%
6.9
%8
.1%
Hig
h s
cho
ol g
rad
uat
e (i
ncl
ud
es e
qu
ival
ency
)3
5.0
%3
4.2
%2
9.4
%3
8.6
%2
7.3
%4
1.2
%
Som
e co
llege
, no
deg
ree
20
.5%
19
.9%
23
.3%
14
.7%
26
.1%
16
.5%
Ass
oci
ate'
s d
egre
e7
.1%
11
.8%
11
.9%
6.3
%7
.3%
8.1
%
Bac
hel
or'
s d
egre
e1
4.3
%1
9.4
%2
0.4
%1
6.1
%1
9.4
%1
4.7
%
Gra
du
ate
or
pro
fess
ion
al d
egre
e8
.4%
7.7
%8
.8%
8.6
%9
.0%
7.9
%
Less
th
an 9
th g
rad
e-2
.6%
-1.3
%-1
.0%
-3.4
%-2
.0%
-1.8
%
9th
to
12
th g
rad
e, n
o d
iplo
ma
-4.7
%-2
.2%
-2.2
%-4
.4%
-3.5
%-4
.1%
Hig
h s
cho
ol g
rad
uat
e (i
ncl
ud
es e
qu
ival
ency
)0
.0%
0.0
%0
.0%
0.0
%0
.0%
0.0
%
Som
e co
llege
, no
deg
ree
5.1
%5
.0%
5.8
%3
.7%
6.5
%4
.1%
Ass
oci
ate'
s d
egre
e3
.6%
5.9
%6
.0%
3.2
%3
.7%
4.1
%
Bac
hel
or'
s d
egre
e1
4.3
%1
9.4
%2
0.4
%1
6.1
%1
9.4
%1
4.7
%
Gra
du
ate
or
pro
fess
ion
al d
egre
e1
2.6
%1
1.6
%1
3.2
%1
2.9
%1
3.5
%1
1.9
%
Wei
ghte
d W
ork
forc
e Ed
uca
tio
n In
dex
28
.3%
38
.4%
42
.2%
28
.1%
37
.6%
28
.9%
Tab
le B
-10
: Ed
uca
tio
nal
Att
ain
me
nt
and
We
igh
ted
Wo
rkfo
rce
Ed
uca
tio
n In
de
x o
f P
op
ula
tio
n A
ge 2
5 a
nd
Old
er
No
rth
cen
tral
Ind
ian
a R
egi
on
an
d B
en
chm
ark
Me
tro
po
litan
Are
as
Edu
cati
on
Att
ain
me
nt
Leve
ls
We
igh
ted
Wo
rkfo
rce
Ed
uca
tio
n In
de
x1
"Wei
ghte
d W
ork
forc
e Ed
uca
tio
n In
dex
" is
a m
easu
re d
evis
ed b
y K
auff
man
Fo
un
dat
ion
as
par
t o
f it
s "N
ew E
con
om
y In
dex
". T
he
mea
sure
is c
om
pu
ted
by
(a)
wei
ghti
ng
the
per
cen
tage
of
resi
den
ts w
ith
less
th
an a
hig
h s
cho
ol e
du
cati
on
wit
h a
mu
ltip
lier
of
-0.5
, (b
) w
eigh
tin
g th
e p
erce
nta
ge o
f re
sid
ents
wit
h a
hig
h s
cho
ol
dip
lom
a o
r eq
uiv
alen
t w
ith
a m
ult
iplie
r o
f 0
.0, (
c) w
eigh
tin
g th
e p
erce
nta
ge o
f re
sid
ents
wit
h s
om
e co
llege
(at
leas
t a
year
) b
ut
no
deg
ree
wit
h a
mu
ltip
lier
of
0.2
5,
(d)
wei
ghti
ng
the
per
cen
tage
of
resi
den
ts w
ith
an
ass
oci
ate'
s d
egre
e w
ith
a m
ult
iplie
r o
f 0
.5, (
c) w
eigh
tin
g th
e p
erce
nta
ge o
f re
sid
ents
wit
h a
bac
hel
or’
s d
egre
e
wit
h a
mu
ltip
lier
of
1.0
, (e)
wei
ghti
ng
the
per
cen
tage
of
resi
den
ts w
ith
gra
du
ate
and
pro
fess
ion
al d
egre
es w
ith
a m
ult
iplie
r o
f 1
.5, a
nd
(f)
to
talin
g th
e w
eigh
ted
per
cen
tage
s to
pro
du
ce t
he
Wei
ghte
d W
ork
forc
e Ed
uca
tio
n In
dex
val
ue.
Sou
rce:
U.S
. Bu
rea
u o
f C
ensu
s, 2
01
0-2
01
4 A
mer
ica
n C
om
mu
nit
y Su
rvey
5-Y
ear
Esti
ma
tes
Northcentral Indiana Regional Development Authority 84

DRAFT 2016-08-05
Northcentral Indiana Regional Development Authority
85
APPENDIX C: POTENTIAL RESOURCES
We have described in the following pages potential Resources for each of the recommended strategies. We ask that readers note the entities and programs listed are only suggestions for further consideration. We have included every entity or program suggested by a member of the Strategy Development Team. Except where stated along with the name of the entity or program, we have neither specified the role it might fulfill in executing an Activity nor evaluated its capability and willingness to undertake such a role.
For Greater Employment in Higher-Pay Traded Clusters
• Academic Affairs Consortium (a group that meets quarterly and is populated by the Academic Affairs Chancellor/Representative from Bethel, ITT, Trine, IUSB, Holy Cross, Ivy Tech, Purdue, and Saint Mary's College)
• Buffalo Manufacturing Works Buffalo, NY (as a model for creating a Manufacturing Innovation Center, http://buffalomanufacturingworks.com)
• Butler University's Business Consulting Group (as a model for creating a Business Accelerator, https://www.butler.edu/consulting)
• Center for Business Excellence sponsored by Greater Elkhart Chamber of Commerce
• CEO St. Joe Program
• Chamber Job Board (sponsored by St. Joseph County Chamber of Commerce, http://www.sjchamber.org/job-board/)
• Chambers of Commerce in Elkhart, Marshall, and St. Joseph counties
• Downtown South Bend, Inc.
• Economic Development Corporation of Elkhart County
• Elevate Ventures
• enFocus, Inc.
• Entrepreneurship Initiative Board (This is a new entity that is just being formed as the result of an agreement between the Northcentral Indiana Regional Development Authority and Elevate Ventures. Its mission is to enhance the entrepreneurship ecosystem and infrastructure in our region.)
• EWI - the non-profit engineering and applied research and development organization that designed and operates Buffalo Manufacturing Works (https://ewi.org/)
• Ignition Park
• Indiana Career Connect

DRAFT 2016-08-05
Northcentral Indiana Regional Development Authority
86
• Indiana Procurement Technical Assistance Center Office of Small Business and Entrepreneurship (http://www.indianaptac.com)
• Innovation Park at Notre Dame
• Junior Achievement
• LaunchPad Goshen (a co-working space for freelancers and entrepreneurs, start-up businesses and small businesses http://launchpadgoshen.org/)
• Lifelong Learning Network
• Magnet Investors Group
• Marshall County Career Success Coalition
• Marshall County Development for the Future (quarterly economic development round-table meetings with MC/business leadership)
• Marshall County Economic Development Corporation
• North Central Indiana Small Business Development Center
• Postsecondary educational institutions including Ancilla College, Bethel College, Goshen College, Holy Cross College, IUSB, IU School of Medicine, ITT, Ivy Tech, Purdue Polytechnic Institute, Saint Mary's College, Trine University, and University of Notre Dame
• Project Lead the Way
• Purdue Technical Assistance Program (TAP) Manufacturing Extension Partnership (MEP)
• R2 Advanced Manufacturing Partnership (sponsored by St. Joseph County Chamber of Commerce)
• Renaissance District
• Secondary educational institutions - Penn-Harris-Madison School Corp; School City of Mishawaka; South Bend Community School Corp; Career Academy, Trinity School at Greenlawn; St. Joseph High School; Marian High School; Elkhart Community Schools; Wa-Nee Community Schools; Goshen Community Schools; Fairfield Community Schools; Middlebury Community Schools; Culver Academies; Argos Community Schools; Bremen Public Schools; Culver Community Schools; John Glenn School Corp; Plymouth Community School Corp; Triton Public Schools; Union North United Schools
• Service Corps of Retired Executives (SCORE)
• South Bend Region Economic Development
• SPARK - a program offered through the Women’s Entrepreneurship Initiative at Saint Mary’s College
St. Joe Valley Metronet, Inc.
• WorkOne Northern Indiana

DRAFT 2016-08-05
Northcentral Indiana Regional Development Authority
87
For Better Access to Quality, Skilled Workers
• 100+ Women Who Care Elkhart (http://www.100womenwhocareelkhart.com/)
• ACT Work Ready Community program, http://workreadycommunities.org and the Workforce Benchmarking Network, http://skilledwork.org/projects/benchmarking-project-workforce-benchmarking-network as possible models for regional common competency assessments for both open positions and potential job candidates
• Ancilla College
• Boys and Girls Clubs of Elkhart, Marshall and St. Joseph counties
• Chambers of Commerce of Elkhart, Marshall, and St. Joseph counties
• Community Education Coalition located in Columbus Indiana focuses on partnerships between manufacturing, business, and government to create and skill up local workforce
• Community Foundations of Elkhart, Marshall, and St. Joseph counties
• Convention and Visitors Bureaus of Elkhart, Marshall, and St. Joseph counties
• County, City, and Town governments in Elkhart, Marshall, and St. Joseph counties
• Crossing Educational Center in Elkhart, Plymouth, and South Bend
• DTSB, Inc. - a group facilitating making downtown South Bend a vibrant destination
• Economic Development Corporation of Elkhart County
• Elkhart Area Career Center
Elkhart Horizon Education Alliance
Elkhart Leadership Academy, Leadership Marshall County, and Leadership South Bend-Mishawaka
• enFocus Fellowship Program and Talent-as-a-Service
• ETHOS Science Center in Elkhart - "ETHOS" is an acronym for Encouraging Technology & Hands-On Science (http://www.ethosinc.org/)
Elkhart County, Marshall County, Mishawaka-Penn-Harris-Madison, and St. Joseph County Public Libraries
• Excel Center at Goodwill - tuition-free school for adults in South Bend that provides a high school diploma and pays tuition costs for students to earn industry-recognized certificates or begin undergraduate degrees at Ivy Tech Community College, Indiana University, IUPUI, and higher-learning institutions (http://excelatgoodwill.org/)
Goshen College
Holy Cross College
Indiana Department of Workforce Development's Jobs for America’s Graduates program
Indiana Tech

DRAFT 2016-08-05
Northcentral Indiana Regional Development Authority
88
Indiana University South Bend
• intern SJC
• Ivy Tech
• Judd Leighton Foundation, Inc.
• Junior Achievement
• Kroc Center
• La Casa De Amistad (provides English language education, citizenship classes, computer skills development, job search support, legal services, youth education programs)
• Marshall County Career Success Coalition
• Marshall County Community Table (round table meetings for non-profits, churches, government entities, or any other organization that provides social services to the community)
• Marshall County Neighborhood Center (MCNC) - a group facilitating making downtown Plymouth a vibrant destination
• Marshall County Economic Development Corporation
• Michiana Partnership, Inc.
National Advanced Manufacturing Portal
PeopleLink
• Pillars of Elkhart - a group facilitating making downtown Elkhart a vibrant destination
• Plan Commissions of Elkhart County, Marshall County, Mishawaka, and St. Joseph County
• Plymouth Community School Corporation Adult Education (Free ESL and GED classes)
• Project Lead The Way
• Purdue Technical Assistance Program (TAP) Manufacturing Extension Partnership (MEP)
R2 Advanced Manufacturing Partnership
• Regional Cities Initiative grant funds
• South Bend Code School
• South Bend Region Economic Development
• St. Joe CEO Program
• St. Joseph County, Elkhart County, Marshall County community schools and private schools
St. Mary's College
Specialized Staffing Solutions
• United Way of Elkhart, Marshall and St. Joseph counties

DRAFT 2016-08-05
Northcentral Indiana Regional Development Authority
89
• University of Notre Dame Dual Career Assistance Program (http://hr.nd.edu/employment-opportunities/dualcareer/)
U.S. Economic Development Administration
Workforce Innovation Opportunity Act (https://www.doleta.gov/wioa/)
• WorkOne Northern Indiana
• Young Professionals Network in Elkhart County, YAP in Marshall County, and YPN in St. Joseph County
For Increased Employment and Business Ownership Opportunities for Minority Populations
Elkhart County, Marshall County, Mishawaka-Penn-Harris-Madison, and St. Joseph County Public Libraries
• 100 Black Men of South Bend
• Church Community Services in Elkhart
• Community Development Venture Capital Alliance (http://cdvca.org/) for information and advice about assisting startup and small minority-owned businesses by establishing a community development venture capital fund
• Excel Center at Goodwill
• Goshen College’s Center for Intercultural Teaching and Learning
• Greater Cleveland Partnership Commission on Economic Inclusion for information and advice about their Cleveland’s "Minority Business Accelerator 2.5+"
• Indiana Department of Workforce Development's Jobs for America’s Graduates program (http://www.in.gov/dwd/JAG.htm)
• Kroc Center
• La Casa De Amistad in South Bend
• LaCasa Inc. of Elkhart County
• Latino Chamber of Commerce (Goshen)
• Michiana African-American Chamber of Commerce
• North Central Indiana Small Business Development Center
• Northern Indiana Hispanic Health Coalition
• School Corporation Adult Education ESL classes in Elkhart, Marshall, and St. Joseph counties
• Service Corps of Retired Executives (SCORE)
• St. Joseph County Bridges Out of Poverty

DRAFT 2016-08-05
Northcentral Indiana Regional Development Authority
90
• St. Joseph County Latin-American Chamber of Commerce
• The Democracy Collaborative for information and advice regarding their "Cleveland Model" community wealth-building initiative (http://community-wealth.org/content/cleveland-model-how-evergreen-cooperatives-are-building-community-wealth)
• United Way of Elkhart, Marshall, and St. Joseph counties
• WorkOne Northern Indiana