a pitfall with dsge–based, estimated, government spending … · 2002, galí, lopez–salido and...
TRANSCRIPT

A Pitfall with DSGE–Based, Estimated,
Government Spending Multipliers
Patrick Fèvea,b,∗, Julien Matheronb,c, Jean–Guillaume Sahucb
aToulouse School of Economics (GREMAQ, IDEI, IUF, and Banque de France)bBanque de France, SEPS
cSDFi (University of Paris–Dauphine)
November 4, 2010
Abstract
Against the current crisis backdrop, a sharp assessment of the long–run, government spendingmultiplier is of utmost importance. Using a general equilibrium model fit to postwar US data,we show that estimation of and inference on this quantity crucially depend on two key modellingaspects: (i) the degree of Edgeworth complementarity between private and public consumptionsand (ii) the responsiveness of government spending to macroeconomic conditions. While element(ii) does not directly affect the long–run multiplier, it exerts an indirect effect through an empiricallink with element (i). We find in particular that wrongly assuming that public policy is exogenous,an econometrician would underestimate the degree of Edgeworth complementarity. Since, in ourmodel, the long–run multiplier is an increasing function of this degree of complementarity, theeconometrician would also underestimate this multiplier.
Keywords: Dynamic general equilibrium models, Edgeworth complementarity, Government spend-ing rules, Maximum likelihood.
JEL Class.: C32, E32, E62.
1 Introduction
Against the current crisis backdrop, government all around the world have embarked on massive
fiscal stimulus packages to fight the global crisis. These plans have renewed the academic interest in
quantifying the government spending multiplier. Given the size of the recovery plans adopted in the
US and other countries, a sharp assessment of this multiplier is crucial, as emphasized by Cogan et al.
(2010).
This paper contributes to the rapidly developing literature on the size of the government spending
multiplier, e.g. Christiano et al. (2009), Fernandez–Villaverde (2010), Leeper et al. (2010), Ulhig
(2010) among others. Our starting point is an estimated Dynamic Stochastic General Equilibrium
(DSGE) model featuring two key modelling elements: (i) Edgeworth complementarity between private
∗Address: Université de Toulouse 1, Aile Jean–Jacques Laffont, 21 Allée de Brienne, 31000, Toulouse, France. email:[email protected]. We thank T. Chaney, M. Dupaigne, F. Gonzalez, M. Hagedorn, M. Juillard, H. Le Bihan,B. Mackowiak, M. Normandin, G. Ordonez, F. Portier, and A. Sbordone for valuable comments and suggestions. Theviews expressed herein are those of the authors and do not reflect those of the Banque de France.
1
and public consumptions and (ii) a countercyclical public spending policy. We then use this model
to quantify the long–run government spending multiplier. Allowing for Edgeworth complementarity
is essential if one wants to reproduce the positive response of private consumption to government
spending shocks found in structural VAR models (Fattas and Mihov, 2001, Blanchard and Perotti,
2002, Galí, Lopez–Salido and Valles, 2007, Perotti, 2007), as shown by Bouakez and Rebei (2007).1
Similarly, a long–standing tradition in macroeconomics insists on countercyclical government spending
as a key aspect of the business cycle (McGrattan, 1994, Jones, 2002).
Including these modeling devices in a DSGE designed to quantify the long–run government spending
multiplier turns out to be essential. First, we show that this multiplier is actually an increasing function
of the degree of Edgeworth complementarity between private and public consumption. Thus omitting
this model component mechanically results in a smaller multiplier. This finding is trivial and we do
not make much of it. More fundamentally, building on the cross–equation restrictions imposed by the
DSGE framework, we show that omitting the endogenous component of government expenditures can
severely bias the estimated long–run government spending multiplier. The subtler reason why is the
following: while the countercyclical spending policy does not directly affect the long–run multiplier
in our framework, it exerts an indirect effect through an empirical link (also known as a binding
function) with the degree of Edgeworth complementarity. We find in particular that wrongly assuming
that public policy is exogenous, an econometrician would underestimate the degree of Edgeworth
complementarity. Since, in our model, the long–run multiplier is an increasing function of this degree
of complementarity, the econometrician would also underestimate this multiplier. Symmetrically, we
show that in a world where Edgeworth complementarity is shut down, as in the bulk of the literature,
misspecifying the public spending rule is unimportant. Yet, such a restriction is strongly rejected by
the data. Our main contribution is thus to provide a quantitative example that warns business cycle
students against an important pitfall with DSGE–based estimated government spending multipliers.
Our quantitative example follows the pionneering contributions by Bailey (1971), Barro (1981), and
Aschauer (1985). The Edgeworth complementarity between private and public consumptions is thus
introduced by allowing for a direct positive effect of public spending on the marginal utility of private
consumption.2 Importantly, this direct positive effect can more than offset the negative wealth effect
of government spending obtained in standard neoclassical growth models. In our model, we show
analytically that this translates into a larger long–run government spending multiplier. The value of
the parameter describing this effect will thus turn out to be crucial for our assessment. The model also
features a government spending rule that incorporates an automatic stabilizer component, in the form
of a contemporaneous response of the cyclical component of government spending to output growth
deviations. The rule does not incorporate any explicit government debt stabilization mechanism. In
our setup, Ricardian equivalence holds and since we assume lump–sum taxes, we can safely abstract
1While the positive response of consumption to government spending shocks is relatively uncontroversial in thestructural VAR literature, the actual response of the real wage is more prone to debates. Structural VARs à la Blanchardand Perotti (2002) suggest that the real wage increases after a government spending shock. In a recent contribution,however, Fisher and Peters (2010) propose a structural VAR that rests on stock returns data to extract the predictablecomponent of government spending. In this setup, they unambiguously conclude that the real wage initially declinesafter a government spending shock. Our neoclassical model is consistent with this finding.
2Fiorito and Kollintzas (2004) offer a general discussion and description of different types of government spendingthat can substitute or complement private consumption.
2
from a debt stabilization concerns in the government spending feedback rule, as in Christiano and
Eichenbaum (1992) or Cogan et al. (2010). Besides, the model features an important real friction in
the form of habit formation in leisure, e.g. Eichenbaum et al. (1988). This simple device proves a
remarkably powerful propagation and persistence mechanism, as shown by Wen (1998) and Bouakez
and Kano (2006), among others. Allowing for this propagation channel turns out to be central when
taking our model to the data.
To get some intuition for our results, we first consider a simplified model version in which we show
analytically that omitting the feedback rule at the estimation stage yields a downward–biased estimate
of the government spending mutliplier. This originates from the well–known single–equation bias in a
simultaneous–equation setup. As a matter of fact, the simplified model allows us to derive a formula for
the bias that closely resembles those appearing in standard econometrics textbooks in a demand–supply
framework. By analogy with this celebrated framework, an econometrician omitting the feedback rule
risks recovering the policy rule parameter when trying to estimate the private response to public
spending. In all likelihood, this will happen when shocks to output account for the bulk of fluctuations
and/or the feedback effect in the policy rule is strong.
In a second step, we estimate on post–war US data a quantitative model version via maximum likelihood
techniques. Using both actual and simulated data, we show that the same sort of bias is present when
the econometrician omits the endogenous component of government policy. This, in turn, translates
into significant differences in the estimated long–run government spending multiplier. Our preferred
model version has both Edgeworth complementarity between private and public consumptions and
a counter–cyclical government spending rule. Additionally, our estimation suggests that allowing for
habit formation in leisure greatly helps the model to fit the data. As a matter of fact, this model version
passes a series of specification and robustness tests. Importantly, the implied long–run multiplier
amounts to 1.85. Using the same model and imposing an exogenous policy rule, we obtain a multiplier
significantly smaller by 0.34 point. Such a difference is clearly not neutral if the model is used to assess
recovery plans of the same size as those recently enacted in the US.
To complement these results, we use our preferred model version as a data generating process to conduct
several simulation exercises in finite sample. We obtain quantitative results that echo our analytical
formula derived in the simplified model version. In particular, we obtain a positively slopped curve
between the feedback rule parameter and the estimated long–run government spending multiplier.
Resorting to simulations also allows us to make sure that the estimated feedback rule is not an artifact
either of our sample of empirical data or of a possible model mispecification. More precisely, when
estimating a model with a feedback rule but no real frictions on data simulated from a model with real
frictions and no feedback rule, the endogenous component of government spending is not found to be
significantly different from zero.
The present paper is related to McGrattan (1994), Jones (2002), and Cúrdia and Reis (2010). In
all these papers, the forcing variables are assumed to follow vector autoregressive processes which
can be interpreted as reduced–form policy rules when it comes to exogenous policy variables such
as government spending or taxes. Importantly, in spite of specification or sample differences, these
papers all find significant countercyclical policy rules that prove essential to the models fit. We obtain
3

very similar results, though in a much more parsimonious specification of government policy. As a
consequence, this parsimony allows for a much sharper diagnostic about policy rule mispecification.
The remainder is as follows. Section 2 presents a simplified model version allowing us to obtain an
analytical characterization of the bias arising when omitting the endogenous component of public
spending. Section 3 develops a quantitative version of this model that we take to post–war US data.
Section 4 explores the quantitative implications of policy rule mispecification, using both actual and
simulated data. The last section offers concluding remarks.
2 A Simple Illustrative Example
In this section, we work out an equilibrium model simple enough to obtain closed–form formulas
illustrating how the long–run government spending multiplier is biased when the econometrician omits
the endogenous component of public policy.
2.1 The Model
Consider a discrete time economy populated with a large number of infinitely–lived, identical agents.
The representative household’s utility function is given by
eat log (c⋆t ) − ebtνo
1 + νn1+νt (1)
where
c⋆t = ct + αggt
The parameter αg accounts for the complementarity/substitutability between private consumption ct
and public spending gt.3 When αg = 0, we recover the standard business cycle model in which govern-
ment spending operates through negative income effects on the labor supply (see Aiyagari, Christiano
and Eichenbaum, 1992, and Baxter and King, 1993). If αg > 0, government spending substitute for
private consumption, with perfect substitution if αg = 1, as in Christiano and Eichenbaum (1992).
In this case, a permanent increase in government spending has no effect on output and hours but
reduces private consumption, through a perfect crowding–out effect. At the opposite, when the pa-
rameter αg < 0, it can be the case (depending on the labor supply elasticity) that equilibrium private
consumption and output will react positively to an unexpected increase in government spending (see
Bouakez and Rebei, 2007).4 The parameter ν ≥ 0 is the the inverse of the Frisch elasticity of labor
supply nt at time t and νo ≥ 0 is a scale parameter. Consumption and labor supply decisions are
altered by preference shocks at and bt, respectively. The time t budget constraint of the representative
household is
ct ≤ wtnt − Tt (2)
where wt is the real wage and Tt is a lump–sum tax. The representative household maximizes (1)
subject to (2).
3Such a specification has now become standard, following the seminal work by Bailey (1971), Barro (1980), Aschauer(1985), Braun (1994), McGrattan (1994).
4Bouakez and Rebei (2007) consider a CES specification of utility which is similar to our setup when the model islog–linearized.
4

The representative firm produces a homogeneous final good yt using labor as the sole input, according
to the constant returns–to–scale technology
yt = eztnt.
Here, zt is a shock to total factor productivity. Profit maximization implies that the marginal produc-
tivity of labor equals the real wage wt.
Government purchases are entirely financed by taxes,
Tt = gt.
In most business cycle models estimated from industrialized countries data, government purchases are
assumed to follow an exogenous stochastic process (see Christiano and Eichenbaum, 1992, Burnside,
Eichembaum and Rebelo, 1993, Fève and Langot, 1994, Smets and Wouters, 2003, 2005, among many
others). This simple specification is often viewed as a useful representation of the complicated public
policy making. However, the recent literature has emphasized the relevance of stabilizing government
spending rules (see, among others, Leeper et al., 2010). Here, we specify a feedback rule of the following
form
gt =
(
ytyt−1
)
−ϕg
eut (3)
where ϕg ≥ 0, i.e. government spending stabilizes aggregate activity. The random term ut represents
the discretionary part of policy. A simpler rule would have government spending react to current output
only. A problem with such a specification within our simplified model is that it would compromise
identification for the policy parameter. Anticipating on the next section, we also notice that such a
dynamic rule is favored by the data when we estimate a full–blown version of the model.
The homogenous good can be used for private and public consumption. Accordingly, the market
clearing condition on the goods market writes
yt = ct + gt.
Using the optimality conditions for households and firms, equilibrium output obeys
νoebtyνt =
eat
yt − (1 − αg)gte(1+ν)zt (4)
Equations (3) and (4) thus define the joint dynamics of (yt, gt). Log–linearizing these equations around
the deterministic steady state yields
yt = αgt + vt (5)
gt = −ϕg(yt − yt−1) + ut (6)
where vt is a composite shock depending on at, bt and zt. For simplicity, we assume that each component
of vt is white noise. Notice that using only observations for y and g does not allow us to separately
identify these components. However, for the sake of obtaining analytical and easily interpretable
results, we restrict attention to a simple bivariate setup. Finally, the private behavior parameter α is
defined as
α ≡τg(1 − αg)
1 + ν(1 − τg(1 − αg)),
5

where τg ∈ [0, 1) is the steady–state public spending–output ratio. Notice that α in equation (5)
decreases with αg. For example, when αg = 1, α is zero and public spending perfectly crowds out
private consumption. To the contrary, when αg is strictly negative, government spending has a pos-
itive effect on output and eventually on private consumption. In the remainder, we impose that
αg > (τg − 1)/τg. This lower bound ensures that the the steady–state marginal utility of private
consumption (c+ αgg)−1 is positive. For ν and τg set at given values, the value of α summarizes the
complementarity/substitutability between private and public consumption. We will thus concentrate
our analysis on the estimated value of α.
Importantly, α and the long–run government spending multiplier ∆y/∆g are tightly linked through
the relation∆y
∆g=α
τg.
Thus, any estimation bias on α would immediately translate into a bias in the estimated multiplier. As
we explain below, such a bias emerges as soon as the econometrician omits the endogenous component
of government policy.
Equation (6) is the log–linear version of equation (3). With the restriction ϕg ≥ 0, we make sure that
the reduced–form model displays second–order stationarity. The random term ut is assumed to be
white noise. The two random terms ut and vt have variances given by σ2u and σ2
v . In addition, we
further assume they are uncorrelated.
Direct calculations yield the model’s reduced–form
yt =αϕg
1 + αϕgyt−1 +
α
1 + αϕgut +
1
1 + αϕgvt (7)
gt =ϕg
1 + αϕgyt−1 +
1
1 + αϕgut −
ϕg1 + αϕg
vt (8)
From (7), the short–run effect of the innovation ut on yt is α/(1 + αϕg). However, the long–run effect
depends only on α.
2.2 The Effect of Omitting Endogenous Policy
From the model reduced form, the structural parameters (α,ϕg, σu, σv) can be recovered using the
p lim of the maximum likelihood estimation or an instrumental variable technique (with a relevant
choice of instrumental variables). An easy way to obtain a consistent estimator of α relies on indirect
estimation using the following representation of the reduced form
yt = π1yt−1 + ǫ1,t (9)
gt = π2yt−1 + ǫ2,t (10)
The p lim estimators of π1 and π2 are given by
π1 =E(ytyt−1)
E(y2t )
and π2 =E(gtyt−1)
E(y2t )
from which we deduce
α =π1
π2=E(ytyt−1)
E(gtyt−1)
6

From (7)–(8), we obtain:
E(ytyt−1) =αϕg
1 + αϕgE(y2
t ) and E(gtyt−1) =ϕg
1 + αϕgE(y2
t )
The indirect estimator α of α is thus consistent. Similarly, ϕg is also a consistent estimator of ϕg.
Now, imagine the econometrician ignores the feedback rule and seeks to estimate the parameter α from
data (yt, gt) generated by the model (5)–(6). The model considered by this econometrician is thus of
the form
yt = αut + vt (11)
gt = ut. (12)
By ignoring the parameter ϕg, the econometrician is implicitly estimating the government spending
effects on output through a single–equation approach in a simultaneous–equation setup. As is well
known from standard econometrics textbooks, she potentially faces a severe simultaneous–equation
bias (see Greene, 1996, Hamilton, 1994). To see this clearly, the ML estimator ˆα of α would be
ˆα =E(ytgt)
E(g2t )
which simply corresponds to the OLS estimator. Direct calculations yield
ˆα =
(
α(1 + αϕg)σ2u − ϕgσ
2v
(1 + αϕg)σ2u + 2ϕ2
g.σ2v
)
(13)
The estimated value of ˆα is thus corrupted, in a non–linear way, by ϕg, σu and σv. The OLS regression
does not pin down the effects of g on y but an average of private behavior and public policy, with
weights that depend on the relative size of the shocks’ variances. Notice that this is more or less the
formula displayed in standard textbooks in a demand–supply setup (e.g., see Hamilton, 1994, chap.
9).
In our underlying data generating process (DGP), we have assumed that ϕg > 0. This restriction
has direct consequences on the sign of the bias. In particular, we have ˆα < α whenever σv > 0
and the bias may increase with ϕg, depending on the particular parameter values.5 This means that
when the econometrician wrongly omits the feedback rule on government spending, thus ignoring the
endogeneity of government spending, she underestimates the true value α. As explained above, she
will actually estimate a mix of the output and (inverse) government spending rule. In this case, the
long–run government spending multiplier is systematically downward–biased.6
The intuition for the downward bias is intimately linked to the endogeneity bias in a simultaneous–
equation setup. Recall that estimating α without a feedback rule wrongly assumes that government
spending is exogenous. However, in the actual DGP, current government spending is positively corre-
lated with the innovation u and negatively with v, due to our assumed ϕg > 0.
Depending on the relative size of the two shocks, the estimated parameter ˆα will take on different
values. Suppose first that σv > 0 and σu → 0. This would correspond to the case when government
5More precisely, depending on α, σu and σv, there exists a threshold positive value ϕg for ϕg such that ∂ ˆα/∂ϕg < 0when ϕg < ϕg and positive elsewhere. However, the bias never reverts back to zero, since limϕg→∞
ˆα = 0.6When ϕg = 0, the bias is obviously zero. Indeed, in this case the model is well specified.
7
spending shocks do not contribute much to the variance of y. In this case, we obtain ˆα → −1/(2ϕg).
Thus, omitting the endogeneity of government spending would lead us to estimate a negative value
of α. This is because endogenous public spending is negatively related to the shock v which shifts
aggregate output. The covariance between yt and gt is negative and thus the estimated effect of public
spending on output is negative. We are in the case when the output equation moves along the policy
rule equation (which is truly downward slopping). In this case, the econometrician almost recovers the
reverse government policy rule. Assume now that σv → 0 and σu > 0. This would correspond to a
situation when the bulk of fluctuations in y are accounted for by government spending shocks. In this
case, the endogeneity bias vanishes since ˆα = α. Endogenous public spending is positively related to
the shock u and the (inverse) government policy shifts along the output equation.
To sum up, we have shown analytically in a tractable model that omitting the endogenous component
of government spending can result in a downward–biased estimate of the long–run government spending
multiplier. In this simple setup, the downward bias is a mix of a simultaneous–equation bias and an
omitted–variable bias.
In the following section, we consider a full–blown DSGE model which we estimate on US data via
maximum likelihood techniques. While the model is too complicated to get such a sharp bias char-
acterization, it proves a useful tool to investigate whether omitting the endogenous component of
government spending actually results in a quantitatively significant bias in the estimated long–run
government spending multiplier.
3 A Fully–Fledged Model for Estimation
We now work out an extension of the previous model that we formally take to the data. We first briefly
describe the augmented framework, then document our estimation strategy, and finally comment our
empirical results.
3.1 The Model
We extend the previous simple model by allowing for capital accumulation and habit formation in
leisure decisions. The intertemporal expected utility function of the representative household is given
by
Et
∞∑
i=0
βi
eat log(
c⋆t+i)
− ebtνo
1 + ν
(
nt+i
nφt+i−1
)1+ν
(14)
where as previously
c⋆t+i = ct+i + αggt+i
Et denotes the expectation operator conditional on the information set at period t. The parameter
αg is as in section 2. The parameter β ∈ (0, 1) is the discount factor. The parameter φ governs the
habit persistence in labor supply and νo ≥ 0 is a scale parameter. When the parameter φ 6= 0, labor
supply decisions are subject to time non–separabilities. If φ < 0, labor supply displays inter–temporal
8

substitutability (see Kydland and Prescott, 1982 or Hotz et al., 1988), whereas φ > 0 implies inter–
temporal complementarity (see Eichenbaum et al. 1988). Recently, this specification has proven to
be a very adequate specification of labor supply as it translates habit persistence in leisure choices
into aggregate output persistence (see Wen, 1998, Bouakez and Kano, 2006, Dupaigne et al., 2007).
While other specifications that allow to capture the persistence in hours have been considered in the
literature (e.g. adjustment costs on labor input, as in Chang et al., 2007, or learning–by–doing, as in
Chang et al., 2002), it turns out that the implied reduced–form are almost identical to that resulting
from our specification.
Utility derived from consumption is altered by a a preference shock at, which follows a stationary
stochastic process
at = ρaat−1 + σaǫa,t
where |ρa| < 1, σa > 0 and ǫa,t is iid with zero mean and unit variance. Labor disutility is subject to
a preference shock bt, which follows a stationary stochastic process
bt = ρbbt−1 + σbǫb,t
where |ρb| < 1, σb > 0 and ǫb,t is iid with zero mean and unit variance. As noted by Galí (2005),
this shock accounts for a sizeable portion of aggregate fluctuations. Moreover, it allows us to capture
various distortions on the labor market, labeled labor wedge in Chari et al. (2007).
The representative household supplies hours and capital to firms, and pays a lump–sum tax to the
government. The capital stock evolves according to the following law of motion:
kt+1 = (1 − δ)kt + xt (15)
where δ ∈ (0, 1) is the constant depreciation rate. The budget constraint of the representative household
in every period t is
ct + xt ≤ wtnt + rtkt − Tt (16)
where wt is the real wage, rt is the rental rate of capital and Tt is a lump–sum tax. The representative
household thus maximizes (14) subject to (15) and (16).
The representative firm produces a homogeneous final good yt through the constant returns–to–scale
technology
yt = kθt (eztnt)1−θ
where kt and nt denote the inputs of capital and labor, respectively, θ ∈ (0, 1) is the elasticity of output
with respect to capital, and zt is a shock to total factor productivity, which follows a random walk
process with drift of the form
zt = log(γz) + zt−1 + σzǫz,t
where σz > 0 and ǫz,t is iid with zero mean and unit variance. The constant term γz > 1 is the
drift term and accounts for the deterministic component of the growth process. Profit maximization
equalizes the marginal productivity of each input factor (θ(yt/kt) and (1 − θ)(yt/nt)) to their prices
wt and rt.
9
The government spending are entirely financed by taxes,
Tt = gt
Notice that Ricardian equivalence holds in our setup, so that introducing government debt is unneces-
sary. Government spending, after appropriately detrending by the stochastic growth component (the
non–stationary technology shock) is represented by the following policy function
gte−zt = ggte
g⋆t .
The endogenous policy component gt obeys
log(gt) = −ϕg (∆ log(yt) − log(γz)) ,
where ∆ stands for the first–difference operator. The parameter ϕg is the policy rule parameter that
links the stationary component of government policy to demeaned output growth. The stochastic
component of the rule is assumed to follow an autoregressive process of the form:
g⋆t = ρgg⋆t−1 + σgǫg,t
where |ρg| < 1, σg > 0 and ǫg,t is iid with zero mean and unit variance.
The homogeneous good can be used for private consumption ct, government consumption gt, and
investment xt. The market clearing condition on the good market write
yt = ct + xt + gt.
We induce stationarity by getting rid of the stochastic trend component zt and we log–linearize the
resulting system in the neighborhood of the deterministic steady state. The log–linear solution is of
the form
st = F (ψ)st−1 +G(ψ)
ǫz,tǫa,tǫb,tǫg,t
, (17)
where ψ is the vector of model’s parameters and st is a vector collecting the loglinear model variables.
The system matrices F (ψ) and G(ψ) are complicated functions of the model’s parameters.
3.2 Data and Estimation
The data used for estimation come from the Federal Reserve Bank of St. Louis’ FRED II database and
from the Bureau of Labor Statistics website. They consist of government consumption expenditures
and gross investment (GCE), private investment and private consumption, all deflated by the implicit
GDP deflator (GDPDEF). Private investment is defined as the sum of gross private domestic invest-
ment (GPDI) and personal consumption expenditures on durable goods (PCDG). Private consumption
is measured as the sum of personal consumption expenditures on non–durable goods (PCND) and ser-
vices (PCESV). Output is then defined as the sum of private investment, private consumption and
government expenditures. Hours are measured as total hours worked in the non–farm business sector.
10

All the series are converted to per–capita terms by dividing them by the civilian population, age 16
and over (CNP16OV). All the series are seasonally adjusted except for population. Our sample runs
from 1960:1 to 2007:4.
We use as observable variables in estimation the logs of output, consumption, hours worked, and
government expenditures. The measurement equation is
∆ log(yt)∆ log(nt)
log(ct) − log(yt)log(gt) − log(yt)
=
γz − 10
mc(ψ)mg(ψ)
+H(ψ)st (18)
Here, mc(ψ) is a function that gives the average log consumption–output ratio as a function of ψ,
mg(ψ) is an analog function for the average log government consumption–output ratio, and H(ψ) is a
selection matrix that may depend on ψ. The observed growth rate of hours worked is demeaned prior
to estimation, to get rid of a very small and insignificant sample mean. For a given ψ, using equations
(17) and (18), the log–likelihood is evaluated via standard Kalman filter techniques. The estimated
parameters are then obtained by maximizing the log–likelihood.7
The vector of parameters ψ is split in two subvectors ψ1 and ψ2. The first one, ψ1 = (β, δ, ν), contains
parameters calibrated prior to estimation. Typically, these are parameters difficult to estimate in our
framework. The subjective discount factor, β, is set to 0.9951, yielding a real annual interest rate of
3.75%. The depreciation rate, δ, is set to 0.0153, which implies an annual depreciation rate of slightly
more than 6%. Finally, the parameter ν is set to 2, in accordance with previous studies (Smets and
Wouters, 2007).
The other parameters are contained in ψ2 = (φ, αg, θ, γz, τg, ϕg, ρg, ρa, ρb, σz, σg, σa, σb). Results per-
taining to the estimation of ψ2 are reported in table 1. We consider several model restrictions, according
to whether αg, ϕg and/or φ are constrained or not, yielding a total of 8 specifications. These specifica-
tions start from a plain RBC model and end up with a complete DSGE model with real frictions and
endogenous public policy. In the first four specifications, we impose αg = 0. In these cases, government
purchases have no direct effect on the marginal utility of private consumption. The purpose here is to
investigate whether allowing for endogenous government spending and intertemporal complementari-
ties in labor supply yield a better fit in terms of log–likelihood. In the first model version, referred
to as model (1), we additionally impose φ = ϕg = 0. In this case, there are no habits in leisure nor
any feedback effect in the government spending rule. This is a version of Christiano and Eichenbaum
(1992), with two additional shocks. In the second model version, referred to as model (2), we relax the
constraint ϕg = 0 and maintain the constraint φ = 0. In this case, we allow for a feedback effect in
government policy. In the third model version, referred to as model (3), we let the data pin down φ but
set ϕg to zero. Finally, in the fourth model version, referred to as model (4), we freely estimate φ and
ϕg. In the remaining four model specifications, we relax the constraint αg = 0. We then reestimate all
the previous specifications (allowing sequentially for the same constraints on φ and ϕg). These model
specifications are labelled (5) to (8). To sum up, our height model versions are
7We estimated different model versions using the growth rate of private and public consumptions instead of the loggedprivate consumption–output and logged public consumption–output ratios. Estimation results were almost identical.However, we faced numerical failures in estimating some extended model versions. Moreover, specification tests insuccess cases delivered similar results to what obtains in the benchmark case.
11

• Model (1): αg = 0, ϕg = 0, φ = 0,
• Model (2): αg = 0, ϕg 6= 0, φ = 0,
• Model (3): αg = 0, ϕg = 0, φ 6= 0,
• Model (4): αg = 0, ϕg 6= 0, φ 6= 0,
• Model (5): αg 6= 0, ϕg = 0, φ = 0,
• Model (6): αg 6= 0, ϕg 6= 0, φ = 0,
• Model (7): αg 6= 0, ϕg = 0, φ 6= 0,
• Model (8): αg 6= 0, ϕg 6= 0, φ 6= 0.
Comparing specifications (1)–(4) with (5)–(8), one can determine whether allowing for a direct effect
of government spending on the marginal utility of private consumption has a positive effect on the
model’s fit. Similarly, comparing specifications (5) to (8) allows us to assess the relevance of habits in
leisure and endogenous government spending. Finally, the table reports the log–likelihood L for each
model specification, which we use naturally as our selection criterion.
Overall, the model specifications yield precisely estimated parameters.8 Several general comments can
be made. First, the share parameters τg and θ and the growth rate of technology γz are consistent with
previous estimates with US data (e.g. Christiano and Eichenbaum, 1992, Burnside et al., 1993). Notice
that these parameters are pretty invariant to the restrictions imposed on αg, ϕg, or φ. In contrast,
the shock parameters adjust to compensate for economic mechanisms that have been shut down when
imposing restrictions on αg, ϕg, and φ. For example, when φ = 0, the persistence of the labor supply
shock increases to make up for the lack of endogenous persistence in the model. Finally, all the shocks
display sizable serial correlation, as is common in this kind of models, irrespective of the constraints
imposed on the structural parameters.
The log–likelihood comparison suggests the following comments. First, comparing specifications (1)
with (5), (2) with (6), (3) with (7) or (4) with (8), one can clearly see that the restrictions αg = 0 is
strongly rejected by the data. The p–values of the associated likelihood ratio tests are almost zero. In
specifications (5) to (8), the parameter αg is negative and significantly different from zero, consistent
with the above likelihood ratio tests. Put another way, αg is found to be significantly negative and
this result is not an artifact of allowing for intertemporal complementarities in labor supply or for an
endogenous government policy. This suggests that private and public consumption are complements.
This result echoes findings by Bouakez and Rebei (2007) in a slightly different specification for the
interaction of public and private consumption.
Second, whether or not we allow for intertemporal complementarities in labor supply or a direct effect
of government spending on the marginal utility of private consumption, the restriction ϕg = 0 is clearly
rejected by the data. To see this, compare specifications (1) and (2), (3) and (4), (5) and (6), or (7)
8We numerically checked the estimation convergence by shocking initial conditions on parameter values in the like-lihood maximization step. Upon convergence, we also plotted slices of the likelihood function around each parameterestimated value to check local identification.
12
and (8). For example, the likelihood ratio test is 28.75 when comparing (5) and (6) and 33.61 when
comparing (7) and (8). In both cases, the associated p–values are almost zero. These results strongly
show that government policy comprises an endogenous component that contributes significantly to the
model’s fit.
Third, the restriction φ = 0, meaning that intertemporal non–separabilities in labor supply are shut
down, is also strongly rejected by the data. To see this, compare either (1) and (3), (2) and (4), (5)
and (7), or (6) and (8). Here again, a standard likelihood ratio test would reject this restriction. We
further obtain positive values for φ when the parameter is freely estimated, thus suggesting dynamic
complementarities in labor supply decisions. This is reminiscent of results previously obtained in the
literature, see, e.g., Bouakez and Kano (2006), Eichenbaum et al. (1988), and Wen (1998).
To sum up, specification (8) is our preferred model. This specification thus features (i) intertemporal
complementarities, (ii) a positive effect of government spending on the marginal utility of private
consumption, and (iii) a countercyclical feedback effect in government spending. We thus use this
specification to illustrate the quantitative implications of omitting feedback effects in the government
spending rule.9
To get some intuition why model (8) is preferred, we compare unconditional moments from the models
to their empirical counterparts. Results are reported in table 2. We consider moments documenting
the volatility, persistence, and co–movement of key variables. All the model versions perform equally
well in terms of fitting standard errors of key aggregate variables. However, allowing for intertemporal
complementarities in labor supply greatly helps the model to match the persistence of output growth
and changes in hours worked (see models (7) and (8) in table 2). In addition, allowing for countercyclical
government spending rules improves the model’s ability to replicate the co–movement between changes
in government spending and other aggregate variables (see models (6) and (8) in table 2). Finally,
allowing for a positive effect of government spending on the marginal utility of private consumption
helps to match the observed positive correlation between changes in private and public consumptions.
It turns out that model (8) combines all three features, thus yielding the best fit.
We complement the above results by performing specification tests for the innovation of each variables
used for estimation in equation (18), i.e. ∆ log(yt) output growth, ∆ log(nt) hours growth, log(ct) −
log(yt) the log of the private consumption to output ratio and log(gt) − log(yt) the log of the public
consumption to output ratio. The innovation are thus obtained as the difference between the observed
variables and their predicted value at convergence of the estimation stage. The specification tests,
reported in table 3, are conducted for the eight model’s versions. The first column reports the Shapiro
and Wilk (1965) test statistic. The null hypothesis being tested is that the innovation of the variables
listed on the left is normally distributed. A small value of the test statistic indicates a rejection of
the null, whereas a value close to unity favors the normality assumptions. On the right, we report
the P–value (in %) of the test statistic. For each model’ specification, the normality is rejected for
all the innovations. In all cases, normality rejection is essentially driven by a few outliers. Given the
parametric parsimony of the model, such a rejection is hard to interpret. More interestingly, table 3
also includes serial correlation tests. We first report the least–squares coefficient obtained by projecting
9In appendix A, we discuss the robustness of our estimation results, allowing successively for habits, dynamic adjust-ment costs on investment, alternative feedback policy rules, and news shocks on government spending rule.
13

each innovation on its own lag. For each coefficient, we report the associated 95% confidence interval.
We also include in the table the Lagrange Multiplier statistic (Godfrey, 1988). This statistic is obtained
from projecting each innovation on their four own lags and is distributed as a Chi–Squared with four
degrees of freedom. The results clearly shows that omitting habits in leisure leads to a significant serial
correlation in the innovations of output and hours (see specification (1), (2), (5) and (6)). Moreover,
omitting the feedback rule deteriorate the results. Indeed, comparing specification (7) and (8) shows
that output and hours innovations display less serial correlation when the policy rule coefficient is
not constrained to zero. The coefficient of serial correlation is equal to 0.09 for the innovation of
hours in the case of model (8), whereas it is equal to 0.14 in the case of model (7). A similar finding
applies for output growth. As previously discussed in our simple setup, these results indicate that the
counter–cyclical feedback rule in government spending helps to replicate the persistence of output and
hours.
4 Quantitative Implications of Policy Rule Misspecification
Having explored the empirical properties of model (8), we now use this version to investigate the
quantitative effects of omitting the government feedback rule.
4.1 Results from Actual Data
Upon inspecting models (7) and (8), we see that imposing ϕg = 0 strongly affects the estimated value
of αg. When ϕg is freely estimated, we obtain αg = −0.88 whereas we get αg = −0.57 when we impose
ϕg = 0. Importantly, these parameter estimates are significantly different from each other, according
to a standard Wald test. Notice that this interaction between ϕg and αg is not an artifact of our
specification with dynamic complementarities in labor supply since the same pattern emerges when
comparing models (5) and (6).
What does this imply for long–run government spending multiplier? In our quantitative model, this
multiplier obeys∆y
∆g=
1 − αg
1 − xy + µ
(
cy + αgτg
) , µ ≡ (1 + ν)(1 − φ) − 1
wherex
y≡
(γz − 1 + δ)θβ
γz − β(1 − δ),
c
y≡ 1 − τg −
x
y.
Clearly, ϕg does not show up in this formula. To the contrary, the multiplier is unambiguously de-
creasing with αg, as in the simple model. Thus, if ϕg is to affect the multiplier, it must be indirectly,
through its empirical relation with αg.10
The estimated multipliers are reported in table 4, together with their standard errors. When αg is
restricted to zero, the estimated long–run multiplier is typically less than one, as obtains in standard
models. For example, depending on the restrictions imposed on φ, we obtain values roughly comprised
10Notice that when αg and φ are set to zero, the above formula collapses to those reported in Baxter and King (1993)and Aiyagari et al. (1992).
14
between 0.53 and 0.93. This is typically the range of available estimates derived from estimated DSGE
models in the literature. Importantly, comparing columns (1) and (2) or (3) and (4) in table 4, one
can clearly see that ϕg has almost no discernible effect on the long–run multiplier. The reason why
is simple: the parameters β, δ, and ν are restricted prior to estimation. In addition, the estimation
results show that θ and φ are relatively insensitive to the different specifications (see table 1).
In our framework, omitting the feedback effect in the policy rule can impact on the long–run output
multiplier only when the parameter αg is freely estimated. This is the novel feature of our model,
because the link between the policy feedback parameter (ϕg) and the degree of Edgeworth comple-
mentarity between public and private consumptions (αg) could obviously not be studied in frameworks
imposing αg = 0. Columns (5) to (8) in table 4 thus give new results. More precisely, in model (7),
the output multiplier is 1.51 while it reaches 1.85 in model (8). These values are significantly different
from each other at conventional levels. As explained above, the higher multiplier in (8) derives from a
smaller αg than in (7).11
To complement on these results, we consider the following exercise. We set the feedback parameters
ϕg to values on a grid between ϕg = 0 and the estimated value obtained in specification (8), i.e.
ϕg = 0.6226. For each value, all the remaining parameters in ψ2 are reestimated. The results are
reported on figure 1. The upper left panel reports the log–likelihood as a function of ϕg. The grey
area corresponds to restrictions on ϕg that are not rejected at the 5% level according to a likelihood
ratio test. This grey area is also reported in each of the other panels in figure 1. The upper right
panel reports the estimated value of αg as a function of ϕg. The bottom panels report the long–run
multipliers on output and consumption. The figure makes clear that even loose restrictions on ϕg (i.e.
restrictions not too far from the estimated value) are easily rejected and rapidly translate into higher
αg and much lower multipliers. Importantly, the continuous and decreasing mapping from ϕg to αg
(and thus on long–run multipliers) echoes the analytical findings obtained in the simple model explored
in the first section.
To sum up, there exists a strong interaction between the estimated values of ϕg and αg that have
potentially dramatic implications for the quantitative assessment of the long–run government spending
multiplier that cannot be ignored if the model is to be used to assess recovery plans of the same size
as those recently enacted in the US.
4.2 Results from Simulated Data
At this stage, we suspect that the greater αg obtained under model (7) is the outcome of a mispecifica-
tion bias. Indeed, we previously saw that, whether or not the habit persistence in leisure is included,
omitting ϕg always increases the estimated value of αg. In the simple model considered in the first
section, we were able to formally show the existence of such a bias. In our DSGE framework, no such
analytical results is available. To make our point, we thus resort to simulation techniques. Indeed,
actual data are just one draw from an unknown DGP. Hence one cannot exclude that the negative link
11Similar results obtain for the multiplier on private investment. This is not surprising since this multiplier is strictlyproportional to ∆y/∆g and the proportionality factor does not depend on αg. Interestingly, the multiplier on privateconsumption is positive in specifications (7) and (8). In specification (8), the consumption mutliplier is higher than in(7), essentially because αg is smaller in (8).
15

between αg and ϕg is idiosyncratic to our sample. In addition, resorting to simulation enables us to
investigate whether ϕg can be estimated to non–zero values even in a world where no such mechanism
exists (an exercise that we can hardly perform on actual data).
To investigate this, we develop a controlled experiment in which we use model (8) as our DGP, using
the estimated values reported in table 1. More specifically, using model (8) as our DGP we first want
to make sure that (i) estimating specification (8) on simulated data delivers consistent estimates and
(ii) estimating specification (7) on the exact same simulated data yields severely biased estimates of
αg.12 To complement on this, we also run the symmetric estimations in which we use model (7) as our
DGP and successively estimate specifications (7) and (8) on simulated data. In this case, the crucial
point is to check whether our estimation procedure is able to properly reject a policy feedback rule
when no such rule exists in simulated data.
To begin with, table 5 reports the simulation results when using either specifications (8) or (7) as
DGP and/or estimated model. Figure 2 reports the empirical density of parameter estimates obtained
from a Gaussian kernel. The thick plain line corresponds to the parameter distribution obtained by
estimating model (8) on data simulated from model (8). The thick dashed line corresponds to the
parameter distribution obtained by estimating model (7) on data simulated from model (8). The plain
vertical line denotes the true value used for simulation. The dashed vertical line is the average value
obtained by estimating model (8) on data simulated from model (8). Finally, the dotted vertical line
is the average value obtained by estimating model (7) on data simulated from model (8). Figure 3
reports analog densities obtained when using model (7) as the DGP.
We first check whether estimating model (8) on data simulated from model (8) yields consistent pa-
rameter estimates. It turns out that this is the case. Indeed, we see from figure 2 and table 5 that
the average parameters estimates almost coincide with the true ones. Now, consider what happens
when estimating model (7) on data simulated from model (8). In this case, all the parameters linked
to government policy (αg, ρg, σg) turn out to be biased. This is particularly striking when it comes
to αg, the average value of which is almost twice as small (in absolute term) as the true one. Figure 2
once again offers a visual illustration of this. Interestingly, the average estimated value of αg from our
simulation experiment is very similar to what obtains from actual data when estimating model (7).
This suggests that using specification (8) as an approximation to the true DGP is indeed legitimate.
Consider now what happens when using specification (7) as our DGP. Once again, the results are
reported in table 5 and figure 3. As before, the first thing to check is whether estimating specification
(7) on data simulated from model (7) yields consistent estimates. Once again, this turns out to be
the case. Now, consider what happens when estimating model (8) on data simulated from model (7).
Basically, this procedure is able to recover the true parameters on average. This is particularly striking
when it comes to the feedback parameter ϕg, which is zero on average. Recall that the latter does not
12In practice our Monte Carlo simulation is run as follows: using model (8), we generate 1000 samples of observables(∆ log(yt), ∆ log(nt), log(ct) − log(yt), log(xt) − log(yt)), with the same sample size as in actual data, after having elim-inated 800 initial observations, thus ensuring that initial conditions do not contaminate our estimation results. To doso, the four structural shocks innovations are drawn from independent Gaussian distributions with zero mean and unitvariance. On each simulated sample, we estimate specifications (7) and (8) and thus generate a population of estimatedparameters.
16

exist in model (7), the DGP used for this simulation experiment, and appears only in model (8). This
implies that a significant ϕg on actual data does not seem to be an artifact of our particular sample.
Some of our previous estimation results and specification tests suggest that the feedback policy rule
may improve on the ability of the DSGE model to reproduce aggregate persistence (either in terms of
output or of hours worked). As a matter of fact, the P–value associated to the Lagrange multiplier test
on the innovations in output and hours is always greater in model (8) than in any other model version.
To investigate whether the feedback rule parameter can make up for a possible lack of endogenous
persistence, we now use additional simulations from model (7). Indeed, this specification offers us this
possibility because it includes habits in leisure without any feedback rule. We thus use simulated data
from this model and estimate model version (6) (a model without habits in leisure but including the
endogenous government policy). The idea is to evaluate if the feedback rule can compensate for the
omitted serial correlation in hours and output. The results are reported in the last column of table
5. The average estimated value of ϕg is close to zero. Thus ϕg does not adjust to make up for the
lack of persistence in the estimated model. This suggests that when ϕg is found to be significantly
positive, as in model (8), this parameter captures other features of the data than solely persistence.13.
As shown in table 5 and figure 4, the omitted dynamics in hours (and thus in output) is now captured
by the increased persistence of the labor wedge shock. Indeed, the autoregressive parameter ρb is now
equal to 0.9523 which significantly exceeds the reference value of 0.8304 used for simulation of model
(7) (see the empirical distribution of ρb in figure 4).
Finally, our simulations also allow us to investigate the local existence of a negative slope between
αg and ϕg, as our simple model and our previous estimation results suggested. As we saw before,
such a negative slope would imply a positive relation between ϕg and the long–run multiplier. To
investigate this, we generate pairs of parameters (αg, ϕg) obtained by (i) estimating model (8) using
data simulated from model (7) and (ii) estimating model (8) using data simulated from model (8).
Using these parameter draws, we then perform a non–parametric kernel regression of αg on ϕg.
Figure 5 reports the outcome of this exercise. Here, the thick plain line is the non–parametric regres-
sion and the thick dashed lines delineate the 95% confidence interval obtained by standard bootstrap
techniques. The leftmost scatter diagram corresponds to the estimation of model (8) on data drawn
from model (7). The rightmost scatter diagram corresponds to the estimation of model (8) on data
drawn from model (8). On each scatter diagram, the crosses indicate the average parameter values for
ϕg and αg.
The figure clearly reveals the existence of a negatively slopped relation between the parameters of
interest. Basically, the figure tells us that, in the neighborhood of ϕg = 0, if there exists a state of nature
such that ϕg > 0, the associated αg is greater in absolute terms than its average value. Symmetrically,
in the neighborhood of ϕg = 0.6226, if there exists a state of nature such that ϕg < 0.0.6226, the
associated αg is smaller in absolute terms than its average value. This confirms what obtained from
actual data (see table 1 and figure 1). Finally, we complement these analyses by running a similar
exercise using the long–run multiplier on output instead of αg, the outcome of which is reported in
13As previously mentioned, this parameter improves upon the model’s ability to replicate the co–movement betweenchanges in government spending and other aggregate variables (see the above discussion and the reported moments intable 2.
17

figure 7. In this case, we obtain a positively–slopped relation that, once again, confirms our results on
actual data (see table 4 and figure 1).
5 Conclusion
This paper has proposed to assess quantitatively the consequences of misspecifying the government
spending rule on the estimated long–run multplier within a DSGE framework. We first considered a
simplified model version to show analytically that omitting the feedback rule at the estimation stage
yields a downward–biased estimate of the government spending mutliplier, corresponding to the well–
known single–equation bias in a simultaneous–equation setup. We then estimated on postwar US data a
quantitative model version and obtained that omitting the endogeneity of government spending exerts
a severe, downward impact on the estimated long–run multiplier. We also used various simulation
experiments to illustrate our results obtained from actual data. In particular, we showed that our
findings should not be interpreted as idiosyncratic to our sample and/or model.
In our framework, we have deliberately abstracted from relevant details in order to highlight, as trans-
parently as possible, the empirical link between policy rule parameters and the degree of Edgeworth
complementarity between private and public consumption. However, the recent litterature insists on
other modeling isssues that might potentially affect our results. We mention three of them. First, other
specifications of agent’s preferences (Gali, Lopez–Salido and Valles, 2007 and Monacelli and Perotti,
2008) have proven to be useful mechanisms for reproducing the aggregate effect of government spend-
ing shocks, thus competing with the approach retained in this paper. It will be useful to investigate
how such alternative specifications interact with the policy feedback rule. Second, as put forth in
Leeper et al. (2010), a more general specification of government spending rule, lump–sump transfers,
and distotionary taxation is needed to properly fit the US data. This richer specification includes
in addition to the automatic stabilzer component, a response to government debt and co–movement
between tax rates. An important quantitative issue may be to assess which type of stabilization
(automatic stabilization and/or debt stabilization) interacts with the estimated degree of Edgeworth
complementarity. Third, Fiorito and Kollintzas (2004) have suggested that the degree of complemen-
tarity/substitutability between government and private consumptions is not homogeneous over types
of public expenditures. This suggests to disagregate government spending and inspect how feedback
rules affect the estimated degree of Edgeworth complementarity in this more general setup. These
three issues will constitute the object of further researches.
18

Table 1. Estimation Results
(1) (2) (3) (4) (5) (6) (7) (8)
αg – – – – −0.6175 −0.8129 −0.5661 −0.8835(0.1340) (0.1394) (0.1208) (0.1362)
ϕg – 0.5158 – 0.5573 – 0.5321 – 0.6226(0.0759) (0.0779) (0.0654) (0.0677)
φ – – 0.4764 0.4434 – – 0.4568 0.4354(0.0532) (0.0536) (0.0526) (0.0469)
θ 0.3039 0.3058 0.3059 0.3077 0.3047 0.3057 0.3075 0.3075(0.0054) (0.0054) (0.0050) (0.0049) (0.0060) (0.0062) (0.0050) (0.0054)
γz 1.0043 1.0045 1.0036 1.0045 1.0044 1.0046 1.0037 1.0045(0.0007) (0.0007) (0.0007) (0.0008) (0.0007) (0.0007) (0.0007) (0.0008)
τg 0.1978 0.1976 0.1970 0.1976 0.1982 0.1982 0.1984 0.1989(0.0032) (0.0035) (0.0044) (0.0037) (0.0034) (0.0042) (0.0050) (0.0052)
ρg 0.9318 0.9486 0.9090 0.9546 0.9405 0.9632 0.9197 0.9730(0.0141) (0.0111) (0.0191) (0.0147) (0.0114) (0.0078) (0.0168) (0.0085)
ρa 0.9766 0.9774 0.9891 0.9812 0.9835 0.9848 0.9910 0.9878(0.0060) (0.0058) (0.0030) (0.0073) (0.0050) (0.0044) (0.0025) (0.0043)
ρb 0.9421 0.9376 0.8309 0.8580 0.9271 0.9237 0.8304 0.8675(0.0149) (0.0144) (0.0327) (0.0299) (0.0166) (0.0158) (0.0316) (0.0252)
σz 0.0104 0.0104 0.0104 0.0104 0.0104 0.0104 0.0104 0.0104(0.0005) (0.0005) (0.0005) (0.0005) (0.0005) (0.0005) (0.0005) (0.0005)
σg 0.0122 0.0114 0.0120 0.0113 0.0122 0.0112 0.0119 0.0113(0.0007) (0.0006) (0.0006) (0.0006) (0.0006) (0.0006) (0.0006) (0.0006)
σa 0.0106 0.0104 0.0112 0.0162 0.0133 0.0137 0.0127 0.0126(0.0011) (0.0011) (0.0009) (0.0009) (0.0016) (0.0016) (0.0010) (0.0012)
σb 0.0209 0.0206 0.0165 0.0099 0.0210 0.0137 0.0165 0.0161(0.0012) (0.0011) (0.0009) (0.0011) (0.0012) (0.0016) (0.0009) (0.0009)
L 2633.85 2655.56 2663.06 2686.66 2644.16 2672.91 2674.41 2708.02
Notes: Sample period: 1960:1–2007:4. Standard errors in parentheses. Model (1): no effect of government spending on marginal utility, no feedback rule,no habit in leisure. Model (2): no effect of government spending on marginal utility, feedback rule, no habit in leisure. Model (3): no effect of governmentspending on marginal utility, no feedback rule, habit in leisure. Model (4): no effect of government spending on marginal utility, feedback rule, habit inleisure. Model (5): effect of government spending on marginal utility, no feedback rule, no habit in leisure. Model (6): effect of government spending onmarginal utility, feedback rule, no habit in leisure. Model (7): effect of government spending on marginal utility, no feedback rule, habit in leisure. Model(8): effect of government spending on marginal utility, feedback rule, habit in leisure.
19

Table 2. Moments Comparison
Data Model
(1) (2) (3) (4) (5) (6) (7) (8)
σ(∆y) 0.0093 0.0102 0.0101 0.0101 0.0098 0.0104 0.0104 0.0102 0.0101
σ(∆c) 0.0050 0.0073 0.0072 0.0075 0.0074 0.0075 0.0066 0.0078 0.0068
σ(∆x) 0.0327 0.0271 0.0304 0.0273 0.0285 0.0273 0.0339 0.0272 0.0309
σ(∆g) 0.0110 0.0162 0.0142 0.0161 0.0138 0.0161 0.0139 0.0160 0.0133
σ(∆n) 0.0079 0.0088 0.0087 0.0087 0.0082 0.0091 0.0090 0.0086 0.0083
ρ(∆y) 0.3200 −0.0021 0.0006 0.2051 0.1866 −0.0058 −0.0003 0.1952 0.1939
ρ(∆c) 0.2482 0.0224 0.0234 0.0304 0.0270 0.0182 0.1888 0.0226 0.1922
ρ(∆x) 0.2057 −0.0231 −0.1370 0.2854 0.1365 −0.0277 −0.2177 0.2541 0.0167
ρ(∆g) 0.0948 −0.0201 0.0757 −0.0266 0.1113 −0.0174 0.1013 −0.0232 0.1407
ρ(∆n) 0.5328 −0.0289 −0.0300 0.4530 0.3761 −0.0340 −0.0330 0.4343 0.4364
corr(∆y,∆c) 0.5115 0.6983 0.7002 0.7007 0.6851 0.7772 0.6813 0.7543 0.7012
corr(∆y,∆x) 0.9043 0.8528 0.8862 0.8263 0.8746 0.8054 0.8620 0.7620 0.8488
corr(∆y,∆g) 0.2913 0.5434 0.2561 0.5397 0.3231 0.5717 0.2865 0.5668 0.3622
corr(∆c,∆g) 0.2368 0.2268 0.0161 0.2949 0.0491 0.5053 0.3716 0.5508 0.3981
corr(∆x,∆g) −0.0288 0.2138 −0.0382 0.1587 0.0493 0.0977 −0.1350 0.0257 −0.0657
Notes: Sample period: 1960:1–2007:4. Model (1): no effect of government spending on marginal utility, no feedback rule, no habitin leisure. Model (2): no effect of government spending on marginal utility, feedback rule, no habit in leisure. Model (3): no effectof government spending on marginal utility, no feedback rule, habit in leisure. Model (4): no effect of government spending onmarginal utility, feedback rule, habit in leisure. Model (5): effect of government spending on marginal utility, no feedback rule, nohabit in leisure. Model (6): effect of government spending on marginal utility, feedback rule, no habit in leisure. Model (7): effect ofgovernment spending on marginal utility, no feedback rule, habit in leisure. Model (8): effect of government spending on marginalutility, feedback rule, habit in leisure.
20

Table 3. Specification Tests
Model Innovation in Normality Serial CorrelationShapiro–Wilk P–value Coefficient Confidence LM(4) P–value
Statistic (in %) Interval (at 95%) (in %)
(1) ∆ log(yt) 0.9582 0.0103 0.3246 [0.1891 ; 0.4601] 26.1789 0.0029∆ log(nt) 0.9557 0.0063 0.5852 [0.4694 ; 0.7011] 69.1140 3.49 10−12
log(ct) − log(yt) 0.9462 0.0011 -0.0177 [-0.1520 ; 0.1166] 1.9053 75.3169log(gt) − log(yt) 0.9607 0.0174 0.4092 [0.2824 ; 0.5360] 37/4103 1.48 10−5
(2) ∆ log(yt) 0.9589 0.0120 0.3193 [0.1835 ; 0.4551] 25.5797 0.0038∆ log(nt) 0.9574 0.0087 0.5838 [0.4678 ; 0.6999] 68.8011 4.06 10−12
log(ct) − log(yt) 0.9538 0.0043 -0.01735 [-0.1530 ; 0.1183] 1.8315 76.6722log(gt) − log(yt) 0.9630 0.0281 0.5050 [0.3848 ; 0.6251] 47.9162 9.82 10−8
(3) ∆ log(yt) 0.9793 1.5150 0.1549 [0.0134 ; 0.2964] 9.1040 5.8552∆ log(nt) 0.9761 0.6262 0.1385 [-0.0030 ; 0.2801] 16.3687 0.25362log(ct) − log(yt) 0.9296 7.15 10−5 -0.1387 [-0.2696 ; -0.0078] 2.3381 67.38402log(gt) − log(yt) 0.9618 0.0219 0.3270 [0.1966 ; 0.4575] 28.0155 0.0012
(4) ∆ log(yt) 0.9775 0.9273 0.1545 [0.0129 ; 0.2961] 9.0462 5.9954∆ log(nt) 0.9754 0.5256 0.1182 [-0.0231 ; 0.2607] 12.7348 1.2647log(ct) − log(yt) 0.9501 0.0021 -0.1213 [-0.2562 ; 0.0137] 1.7459 78.2387log(gt) − log(yt) 0.9557 0.0062 0.3887 [0.2610 ; 0.5167] 29.2387 6.99 10−4
(5) ∆ log(yt) 0.9596 0.0137 0.3203 [0.1845 ; 0.4562] 25.5970 0.0038∆ log(nt) 0.9585 0.0110 0.5907 [0.4754 ; 0.7060] 70.4017 1.87 10−12
log(ct) − log(yt) 0.9508 0.0024 -0.0151 [-0.1502 ; 0.1201] 1.8640 76.0766log(gt) − log(yt) 0.9591 0.0124 0.3829 [0.2542 ; 0.5116] 32.2800 1.67 10−4
(6) ∆ log(yt) 0.9609 0.0180 0.3098 [0.1734 ; 0.4460] 24.4016 0.0066∆ log(nt) 0.9602 0.0157 0.5828 [0.4676 ; 0.6998] 68.9365 3.81 10−12
log(ct) − log(yt) 0.9600 0.0150 0.1389 [0.0037 ; 0.2742] 10.4189 3.3932log(gt) − log(yt) 0.9640 0.0352 0.4776 [0.3548 ; 0.6003] 41.5484 2.07 10−6
(7) ∆ log(yt) 0.9779 1.0182 0.1545 [0.0130 ; 0.2961] 8.9602 6.2102∆ log(nt) 0.9772 0.8377 0.1391 [-0.0023 ; 0.2807] 15.3241 0.40741log(ct) − log(yt) 0.9442 7.53 10−4 -0.1294 [-0.2689 ; 0.00397] 2.0183 73.2388log(gt) − log(yt) 0.9639 0.0343 0.2909 [0.1575 ; 0.4242] 21.4005 0.0264
(8) ∆ log(yt) 0.9774 0.9009 0.1435 [0.0016 ; 0.2853] 8.3522 7.9497∆ log(nt) 0.9776 0.9818 0.0915 [-0.0507 ; 0.2338] 9.7809 4.4284log(ct) − log(yt) 0.9615 0.0203 0.0345 [-0.1025 ; 0.1715] 1.7395 78.3529log(gt) − log(yt) 0.9601 0.01517 0.3556 [0.2246 ; 0.4866] 22.3671 0.0169
Notes: Sample period: 1960:1–2007:4. ∆ log(yt) denotes output growth, ∆ log(nt) hours growth, log(ct) − log(yt) the log of theprivate consumption to output ratio and log(gt) − log(yt) the log of the public consumption to output ratio. Model (1): no effectof government spending on marginal utility, no feedback rule, no habit in leisure. Model (2): no effect of government spending onmarginal utility, feedback rule, no habit in leisure. Model (3): no effect of government spending on marginal utility, no feedbackrule, habit in leisure. Model (4): no effect of government spending on marginal utility, feedback rule, habit in leisure. Model (5):effect of government spending on marginal utility, no feedback rule, no habit in leisure. Model (6): effect of government spendingon marginal utility, feedback rule, no habit in leisure. Model (7): effect of government spending on marginal utility, no feedbackrule, habit in leisure. Model (8): effect of government spending on marginal utility, feedback rule, habit in leisure. Coefficients areobtained by projecting each innovation on its own lag. LM(4) denotes the Lagrange Multiplier test, including four own lags of eachinnovation.
21

Table 4. Estimated Multipliers
Model
(1) (2) (3) (4) (5) (6) (7) (8)
∆y/∆g 0.5327 0.5344 0.9279 0.8877 0.9927 1.1712 1.5109 1.8516(0.0050) (0.0050) (0.0785) (0.0711) (0.1143) (0.1304) (0.1650) (0.1913)
∆c/∆g −0.5968 −0.5966 −0.2971 −0.3310 −0.2495 −0.1161 0.1420 0.3957(0.0015) (0.0016) (0.0585) (0.0532) (0.0864) (0.0987) (0.1244) (0.1444)
∆x/∆g 0.1295 0.1310 0.2251 0.2186 0.2423 0.2874 0.3689 0.4560(0.0041) (0.0040) (0.0207) (0.0187) (0.0286) (0.0326) (0.0416) (0.0482)
Notes: Sample period: 1960:1–2007:4. Standard errors in parentheses. Model (1): no effect of government spending on marginal utility, nofeedback rule, no habit in leisure. Model (2): no effect of government spending on marginal utility, feedback rule, no habit in leisure. Model (3):no effect of government spending on marginal utility, no feedback rule, habit in leisure. Model (4): no effect of government spending on marginalutility, feedback rule, habit in leisure. Model (5): effect of government spending on marginal utility, no feedback rule, no habit in leisure. Model(6): effect of government spending on marginal utility, feedback rule, no habit in leisure. Model (7): effect of government spending on marginalutility, no feedback rule, habit in leisure. Model (8): effect of government spending on marginal utility, feedback rule, habit in leisure.
22

Table 5. Simulation Results
DGP: Model (8) DGP: Model (7)
Estimated Models Estimated Models
Parameters True Value (8) (7) True Value (8) (7) (6)
αg -0.8835 -0.8297 -0.5614 -0.5661 -0.5408 -0.5419 -0.6803ϕg 0.6226 0.6241 – – -0.0085 – -0.0676φ 0.4354 0.4277 0.3905 0.4568 0.4519 0.4522 –θ 0.3075 0.3076 0.3060 0.3075 0.3073 0.3073 0.3065γz 1.0045 1.0046 1.0043 1.0037 1.0037 1.0037 1.0036τg 0.1989 0.1989 0.1988 0.1984 0.1983 0.1983 0.1986ρg 0.9730 0.9664 0.8983 0.9197 0.9011 0.9013 0.9182ρa 0.9878 0.9729 0.9594 0.9910 0.9813 0.9817 0.9421ρb 0.8675 0.8615 0.8527 0.8304 0.8223 0.8220 0.9523σz 0.0104 0.0104 0.0103 0.0104 0.0104 0.0104 0.0104σg 0.0113 0.0112 0.0131 0.0119 0.0118 0.0118 0.0118σa 0.0126 0.0113 0.0093 0.0127 0.0117 0.0117 0.0099σb 0.0161 0.0163 0.0173 0.0165 0.0166 0.0166 0.0219
Notes: Simulation results obtained from 1000 replications. Model (6): effect of government spending on marginal utility,feedback rule, no habit in leisure. Model (7): effect of government spending on marginal utility, no feedback rule, habit inleisure. Model (8): effect of government spending on marginal utility, feedback rule, habit in leisure. In each case, we reportthe average value of parameters across simulations.
23

Figure 1: Sensitivity to constraints on policy rule parameter ϕg
0 0.1 0.2 0.3 0.4 0.5 0.6−0.9
−0.8
−0.7
−0.6
−0.5
Feedback Parameter in Policy Rule
Par
amet
er α g
0 0.1 0.2 0.3 0.4 0.5 0.62670
2680
2690
2700
2710
Feedback Parameter in Policy Rule
Log
Like
lihoo
d
0 0.1 0.2 0.3 0.4 0.5 0.61.5
1.6
1.7
1.8
1.9
Feedback Parameter in Policy Rule
Long
−R
un M
ultip
lier
on O
utpu
t
Feedback Parameter in Policy Rule
Long
−R
un M
ultip
lier
on C
onsu
mpt
ion
0 0.1 0.2 0.3 0.4 0.5 0.60.1
0.2
0.3
0.4
0.5
Notes: Sample period: 1960:1–2007:4. Standard errors in parentheses. Model (8): effect ofgovernment spending on marginal utility, feedback rule, habit in leisure. The feedback parametersϕg takes values on a grid between 0 and 0.6226. For each value, all the remaining parameters inψ2 are re–estimated. The upper left panel reports the log–likelihood as a function of ϕg . Thegrey area corresponds to restrictions on ϕg that are not rejected at the 5% level according to alikelihood ratio test. This grey area is also reported in each of the other panels. The upper rightpanel reports the estimated value of αg as a function of ϕg . The bottom panels report the long–runmultipliers on output and consumption.
24

Figure 2: Simulation Results under Model (8)
−1.2 −1 −0.8 −0.6 −0.4 −0.2
0.005
0.01
0.015
0.02
0.025
0.03
Parameter αg
0.4 0.5 0.6 0.7 0.8
0.005
0.01
0.015
0.02
0.025
0.03
Feedback Parameter in the Policy rule
0.29 0.3 0.31 0.32
0.005
0.01
0.015
0.02
0.025
0.03
Parameter θ0.2 0.3 0.4 0.5 0.6 0.7
0.005
0.01
0.015
0.02
0.025
0.03
Parameter φ
1.0021.0031.0041.0051.0061.007
0.005
0.01
0.015
0.02
0.025
0.03
Parameter γz
0.17 0.18 0.19 0.2 0.21
0.01
0.02
0.03
Parameter τg
0.75 0.8 0.85 0.9 0.95 1
0.01
0.02
0.03
0.04
0.05
0.06
Parameter ρg
0.8 0.85 0.9 0.95 1
0.02
0.04
0.06
0.08
Parameter ρa
0.5 0.6 0.7 0.8 0.9 1
0.01
0.02
0.03
0.04
Parameter ρb
0.009 0.01 0.011 0.012
0.005
0.01
0.015
0.02
0.025
Parameter σz
0.010.0110.0120.0130.0140.015
0.005
0.01
0.015
0.02
0.025
0.03
Parameter σg
0.005 0.01 0.015
0.005
0.01
0.015
0.02
0.025
Parameter σa
Parameter σb
0.012 0.014 0.016 0.018 0.02 0.022
0.005
0.01
0.015
0.02
0.025
0.03
Notes: Simulation results obtained from 1000 replications. Model (8): effect of government spending on marginalutility, feedback rule, habit in leisure. The empirical density of parameter estimates is obtained from a Gaussian kernel.The thick plain line corresponds to the parameter distribution obtained by estimating model (8) on data simulatedfrom model (8). The thick dashed line corresponds to the parameter distribution obtained by estimating model (7)on data simulated from model (8). The plain vertical line denotes the true value used for simulation. The dashedvertical line is the average value obtained by estimating model (8) on data simulated from model (8). Finally, thedotted vertical line is the average value obtained by estimating model (7) on data simulated from model (8).
25
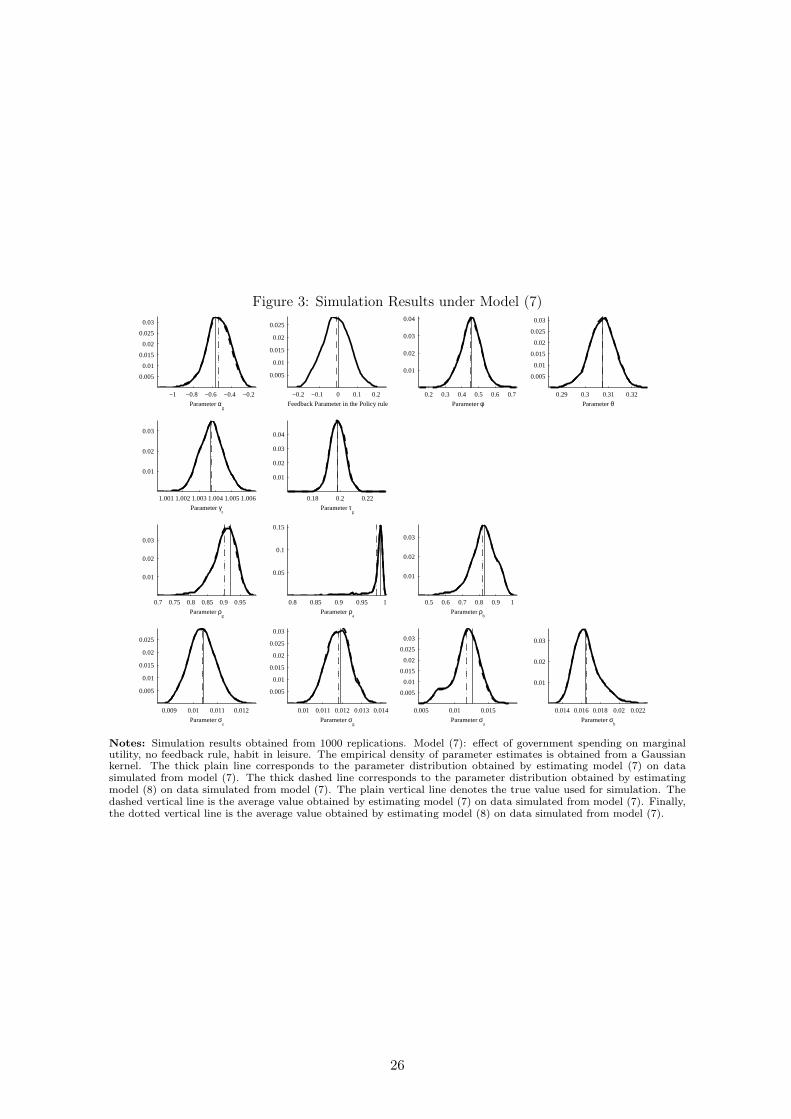
Figure 3: Simulation Results under Model (7)
−1 −0.8 −0.6 −0.4 −0.2
0.005
0.01
0.015
0.02
0.025
0.03
Parameter αg
−0.2 −0.1 0 0.1 0.2
0.005
0.01
0.015
0.02
0.025
Feedback Parameter in the Policy rule
0.29 0.3 0.31 0.32
0.005
0.01
0.015
0.02
0.025
0.03
Parameter θ0.2 0.3 0.4 0.5 0.6 0.7
0.01
0.02
0.03
0.04
Parameter φ
1.0011.0021.0031.0041.0051.006
0.01
0.02
0.03
Parameter γz
0.18 0.2 0.22
0.01
0.02
0.03
0.04
Parameter τg
0.7 0.75 0.8 0.85 0.9 0.95
0.01
0.02
0.03
Parameter ρg
0.8 0.85 0.9 0.95 1
0.05
0.1
0.15
Parameter ρa
0.5 0.6 0.7 0.8 0.9 1
0.01
0.02
0.03
Parameter ρb
0.009 0.01 0.011 0.012
0.005
0.01
0.015
0.02
0.025
Parameter σz
0.01 0.011 0.012 0.013 0.014
0.005
0.01
0.015
0.02
0.025
0.03
Parameter σg
0.005 0.01 0.015
0.005
0.01
0.015
0.02
0.025
0.03
Parameter σa
Parameter σb
0.014 0.016 0.018 0.02 0.022
0.01
0.02
0.03
Notes: Simulation results obtained from 1000 replications. Model (7): effect of government spending on marginalutility, no feedback rule, habit in leisure. The empirical density of parameter estimates is obtained from a Gaussiankernel. The thick plain line corresponds to the parameter distribution obtained by estimating model (7) on datasimulated from model (7). The thick dashed line corresponds to the parameter distribution obtained by estimatingmodel (8) on data simulated from model (7). The plain vertical line denotes the true value used for simulation. Thedashed vertical line is the average value obtained by estimating model (7) on data simulated from model (7). Finally,the dotted vertical line is the average value obtained by estimating model (8) on data simulated from model (7).
26
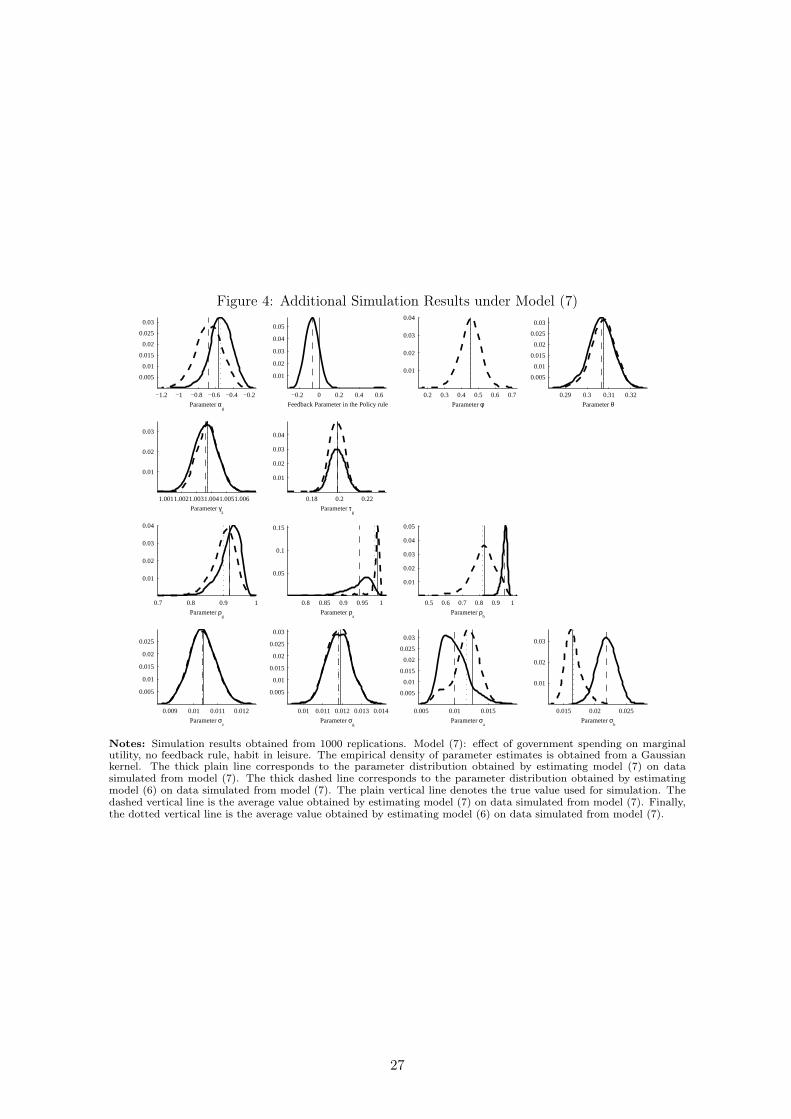
Figure 4: Additional Simulation Results under Model (7)
−1.2 −1 −0.8 −0.6 −0.4 −0.2
0.005
0.01
0.015
0.02
0.025
0.03
Parameter αg
−0.2 0 0.2 0.4 0.6
0.01
0.02
0.03
0.04
0.05
Feedback Parameter in the Policy rule
0.29 0.3 0.31 0.32
0.005
0.01
0.015
0.02
0.025
0.03
Parameter θ0.2 0.3 0.4 0.5 0.6 0.7
0.01
0.02
0.03
0.04
Parameter φ
1.0011.0021.0031.0041.0051.006
0.01
0.02
0.03
Parameter γz
0.18 0.2 0.22
0.01
0.02
0.03
0.04
Parameter τg
0.7 0.8 0.9 1
0.01
0.02
0.03
0.04
Parameter ρg
0.8 0.85 0.9 0.95 1
0.05
0.1
0.15
Parameter ρa
0.5 0.6 0.7 0.8 0.9 1
0.01
0.02
0.03
0.04
0.05
Parameter ρb
0.009 0.01 0.011 0.012
0.005
0.01
0.015
0.02
0.025
Parameter σz
0.01 0.011 0.012 0.013 0.014
0.005
0.01
0.015
0.02
0.025
0.03
Parameter σg
0.005 0.01 0.015
0.005
0.01
0.015
0.02
0.025
0.03
Parameter σa
Parameter σb
0.015 0.02 0.025
0.01
0.02
0.03
Notes: Simulation results obtained from 1000 replications. Model (7): effect of government spending on marginalutility, no feedback rule, habit in leisure. The empirical density of parameter estimates is obtained from a Gaussiankernel. The thick plain line corresponds to the parameter distribution obtained by estimating model (7) on datasimulated from model (7). The thick dashed line corresponds to the parameter distribution obtained by estimatingmodel (6) on data simulated from model (7). The plain vertical line denotes the true value used for simulation. Thedashed vertical line is the average value obtained by estimating model (7) on data simulated from model (7). Finally,the dotted vertical line is the average value obtained by estimating model (6) on data simulated from model (7).
27

Figure 5: Local Relationship between αg and ϕg.
Feedback Parameter in Policy Rule
Par
amet
er α g
−0.4 −0.2 0 0.2 0.4 0.6 0.8 1−1.4
−1.2
−1
−0.8
−0.6
−0.4
−0.2
0
Model (8) estimated under model (7)
Model (8) estimatedunder model (8)
Notes: Simulation results obtained from 1000 replications. The thick plain line is the non–parametric regressionand thick dashed lines are 95% confidence interval obtained by standard bootstrap techniques. The leftmost scatterdiagram corresponds to the estimation of model (8) on data drawn from model (7). The rightmost scatter diagramcorresponds to the estimation of model (8) on data drawn from model (8). The crosses indicate the average parametervalues for ϕg and αg . Model (7): effect of government spending on marginal utility, no feedback rule, habit in leisure.Model (8): effect of government spending on marginal utility, feedback rule, habit in leisure.
28

Figure 6: Local Relationship between the Long–Run Multiplier ∆y/∆g and ϕg.
Feedback Parameter in Policy Rule
Long
−R
un M
ultip
lier
on O
utpu
t
−0.4 −0.2 0 0.2 0.4 0.6 0.8 10.8
1
1.2
1.4
1.6
1.8
2
2.2
2.4
2.6
Model (8) estimated under model (7)
Model (8) estimatedunder model (8)
Notes: Simulation results obtained from 1000 replications. The thick plain line is the non–parametric regressionand thick dashed lines are 95% confidence interval obtained by standard bootstrap techniques. The leftmost scatterdiagram corresponds to the estimation of model (8) on data drawn from model (7). The rightmost scatter diagramcorresponds to the estimation of model (8) on data drawn from model (8). The crosses indicate the average parametervalues for ϕg and the long–run multiplier ∆y/∆g. Model (7): effect of government spending on marginal utility, nofeedback rule, habit in leisure. Model (8): effect of government spending on marginal utility, feedback rule, habit inleisure.
29

References
Aiyagari, R., Christiano, L. and M. Eichenbaum (1992) “The Output and Employment of Government
Spending”, Journal of Monetary Economics, 30(1), pp. 73–86.
Aschauer, D. (1985) “Fiscal Policy and Aggregate Demand”, American Economic Review, 75, pp. 117–
127.
Bailey, M. (1971) National Income and the Price Level: A Study in Macroeconomic Theory, 2nd ed.
New York, McGraw–Hill.
Barro, R. (1981) “Output Effects of Government Purchases”, Journal of Political Economy, 89(6), pp.
1086–1121.
Baxter, M. and R. King (1993) “Fiscal Policy in General Equilibrium”, American Economic Review,
83(3), pp. 315–334.
Blanchard O. and R. Perotti (2002) “An Empirical Characterization of the Dynamic Effects of Changes
in Government Spending and Taxes on Output”, Quarterly Journal of Economics, 117(4), pp. 1329–
1368.
Bouakez H. and T. Kano (2006) “Learning–by–Doing or Habit Formation?”, Review of Economic Dy-
namics, 9, pp. 508–524.
Bouakez, H. and Rebei (2007) “Why Does Private Consumption Rise after a Government Spending
Shock?”, Canadian Journal of Economics, 117(4), pp. 1329–1368.
Braun, A. (1994) “Tax Disturbances and Real Economic Activity in the Post War United States”,
Journal of Monetary Economics, 33(3), pp. 441–462.
Burnside, C., M. Eichenbaum and S. Rebelo (1993) “Labor Hoarding and the Business Cycle”, Journal
of Political Economy, 101(2), pp. 245–273.
Chang, Y., J.F. Gomes and F. Schorfheide (2002) “Learning–by–Doing as a Propagation Mechanism”,
American Economic Review, 92(5), pp. 1498–1520.
Chang, Y., T. Doh and F. Schorfheide (2007) “Non–stationary Hours in a DSGE Model”, Journal of
Money, Credit and Banking, 39(6), pp. 1357–1373.
Chari, V., P. Kehoe and E. McGrattan (2007) “Business Cycle Accounting”, Econometrica, 75, pp.
781–836.
Christiano, L. and M. Eichenbaum (1992) “Current Real Business Cycle Theories and Aggregate Labor
Market Fluctuations‘”, American Economic Review, 82(3), pp. 430–450.
Christiano, L., M. Eichenbaum and S. Rebelo (2009) “When is the Government Spending Multiplier
Large?”, NBER Working Paper 15394.
30
Curdia and Reis (2010) “Correlated Disturbances and US Business Cycles”, NBER Working Paper
15774 .
Cogan, PJ., T. Cwik, J. Taylor and V. Wieland (2010) “New Keynesian versus Old Keynesian Gov-
ernment Spending Multipliers”, Journal of Economic Dynamics and Control, 34, pp. 281–295.
Dupaigne, M., P. Fève and J. Matheron (2007) “Avoiding Pitfalls in Using Structural VARs to Estimate
Economic Models”, Review of Economic Dynamics, 10, pp. 238–255.
Eichenbaum, M., L.P. Hansen and K. Singleton (1988) “A Time Series Analysis of Representative Agent
Models of Consumption and Leisure Choice Under Uncertainty”, Quarterly Journal of Economics,
103(1), pp. 51–78.
Fattas, A. and I. Mihov (2001) “The Effects of Fiscal Policy on Consumption and Employment”,
manuscript, INSEAD.
Fernandez–Villaverde, J. (2010) “Fiscal Policy in a Model with Financial Frictions”, American Economic
Review Papers and Proceedings, 100(2), pp. 35–40.
Fève, P. and F. Langot (1994) “The RBC Model Through Statistical Inference: An Application with
French Data”, Journal of Applied Econometrics, 9(S), pp. S11–S35.
Fiorito, R. and T. Kollintzas (2004) “Public Goods, Merit Goods, and the Relation Between Private
and Government Consumption”, European Economic Review, 48, pp. 1367–1398.
Fisher, J. and R. Peters (2010) “Using Stock Returns to Identify Government Spending Shocks”, The
Economic Journal, 120, pp. 414–436.
Galí J. (2005) “Trends in Hours, Balanced Growth and the Role of Technology in the Business Cycle”,
Federal Reserve Bank of St. Louis, 87(4), pp. 459–486.
Galí, J., Lopez–Salido and Valles (2007) “Understanding the Effects of Government Spending on Con-
sumption”, Journal of European Economic Association, 5, pp. 227–270.
Godfrey, L. (1988) Misspecification Tests in Econometrics, Cambridge, Cambridge University Press.
Greene (1997) Econometric Analysis, Prentice Hall, Third Edition.
Hamilton (1994) Time Series Analysis, Princeton University Press.
Hotz, J., F. Kydland and G. Sedlacek (1988) “Intertemporal Preferences and Labor Supply”, Econo-
metrica, 56(2), pp. 335–360.
Jones, J. (2002) “Has Fiscal Policy Helped Stabilize the Postwar US Economy?”, Journal of Monetary
Economics, 49, pp. 709–746.
Kydland, F. and E. Prescott (1982) “Time–to–Build and Aggregate Fluctuations”, Econometrica, 50(6),
pp. 1345–1370.
31
Leeper, E., M. Plante and N. Traum (2010) “Dynamics of Fiscal Financing in the United States”,
Journal of Econometrics, 156, pp. 304–321.
McGrattan, E. (1994) “The Macroeconomic Effects of Distortionary Taxation”, Journal of Monetary
Economics, 33, pp. 573–601.
Monacelli, T. and R. Perotti (2008) “Fiscal Policy, Wealth Effects, and Markups”, NBER Working
Paper 14584.
Perotti, R. (2007) “In Search of the Transmission Mechanism of Fiscal Policy”, NBER Macroeconomics
Annual, 22, pp. 169–226.
Ramey, V. (2009) “Identifying Government Spending Shocks: It’s All in the Timing”, NBER Working
Paper 15464, forthcoming Quarterly Journal of Economics.
Schmitt–Grohe S. and M. Uribe (2008) “What’s News in Business Cycle”, NBER working paper 14215.
Shapiro, S. and M. Wilk (1965) “An Analysis of Variance Test for Normality”, Biometrika, 52(3–4),
pp. 591–611.
Smets F. and R. Wouters (2003) “An Estimated Dynamic Stochastic General Equilibrium Model of
the Euro Area”, Journal of European Economic Association, 1(5), pp. 1123–1175.
Smets F. and R. Wouters (2005) “Comparing Shocks and Frictions in US and Euro Area Business
Cycles: A Bayesian DSGE Approach”, Journal of Applied Econometrics, 20(2), pp. 161–183.
Smets F. and R. Wouters (2007) “Shocks and Frictions in US Business Cycles: A Bayesian DSGE
Approach”, American Economic Review, 97(3), pp. 586–606.
Uhlig, H. (2010) “Some Fiscal Calculus”, American Economic Review Papers and Proceedings, 100(2),
pp. 30–34.
Wen, Y. (1988) “Can a Real Business Cycle Model Pass the Watson Test?”, Journal of Monetary
Economics, 42, pp. 185–203.
32

A Robustness
The paper emphasizes the role of misspecification (especially in terms of omitting persistence) for the properestimation of the aggregate effect of government spending. The literature actually offers other specificationstrategies that we will now investigate. We now consider extensions of our benchmark model (8), allowingsuccessively for habits and dynamic adjustment costs on investment, alternative feedback policy rules and newsshocks on government spending rule.
A.1 Additional Real Frictions
A central ingredient of our preferred specification is the presence of dynamic complementarities in labor supply.Importantly, output dynamics inherit the built–in persistence of hours worked generated by this mechanism.The recent DSGE literature, however, has emphasized alternative real frictions capable of generating verystrong aggregate persistence. Important such mechanisms are habits in consumption and dynamic investmentadjustment costs, see Christiano et al. (2005). We considered versions of our preferred model augmented withthese additional mechanisms. When either of these are included, they do not significantly contribute to themodel’s fit. A standard likelihood ratio test would not reject the restriction of no habits in consumption and/orno dynamic adjustment costs. For example, in the case of model (8) augmented with habits in consumptionand dynamic adjustment costs, the log–likelihood is equal to 2709.79, to be compared to our reference model(8) where the log–likelihood is equal to 2708.02. The habits in consumption parameter is equal to 0.22 (notsignificantly different from zero) and the adjustment cost parameter is almost zero. In addition, we redo thespecification tests (normality and serial correlation). As it is clear from table 6, including habits in consumptionand dynamic adjustment costs does not improve upon the model performance: the normality test statistic isalmost the same for each innovation and the serial correlation coefficients are very similar.
A.2 Alternative Specifications of the Feedback Rule
We also experimented with alternative specifications for the government spending feedback rule. These rulesare specified as follows
(A) log(gt) = −ϕg(∆ log(yt) − log(γz))(B) log(gt) = −ϕg(log(yt) − zt − log(y))(C) log(gt) = −ϕg(log(yt−1) − zt−1 − log(y))(D) log(gt) = −ϕg(∆zt − log(γz))(E) log(gt) = −ϕg,1(∆zt − log(γz)) − ϕg,2∆at − ϕg,3∆bt
where y denotes the steady–state value of detrended output. Results are reported in table 7. For comparisonpurpose, we reproduce the results obtained with our preferred specification (8), referred to here as specification(A). The other specifications are: (B) the stationary component of government spending reacts to currentdeviations of output from its stochastic trend; (C) the stationary component of government spending reactsto the lagged deviations of output from its stochastic trend; (D) the stationary component of governmentspending reacts to changes in total factor productivity, resembling the specification used by Smets and Wouters(2007); (E) the stationary component of government spending reacts to changes in all the structural shocks.Table 7 reports the estimated values of αg and the policy rule parameters, together with the implied long–runmultipliers. We also report the log–likelihood.
In all these cases we estimate the parameters freely (in particular, we do not impose ex ante sign restrictionson ϕg). As is clear from table 7, the best–fit specification is (A), our preferred model. The specifications thatyield the lowest fit are (B) and (C). In addition, specification (B) implies a procyclical government spendingpolicy, whereas specification (C) is almost acyclical. Interestingly, the estimated αg under these alternativespecifications are much higher than in our benchmark specification (−0.56 in (B) and (C)). In these cases, thus,we find less evidence of a complementarity between private and public consumptions. Specification (D) implies acountercyclical policy rule in response to technology shocks. The estimated is αg = −0.64, slightly lower than in(B) or (C). Finally, specification (E) yields αg = −0.74. This specification also implies a countercyclical policyrule, in the sense that the estimated values of ϕg,1 and ϕg,2 are positive while the estimated value of ϕg,3 isnegative. Finally, in specifications (D) and (E), since the estimated value of αg is lower than in (B) and (C), wehere obtain more complementarity between private and public consumptions. For all alternative specificationsof the feedback rule, we redo the specification tests and obtain that none of these specification helps to improve
33

Table 6. Specification Tests with Alternative Specifications
Normality Serial Correlation
Shapiro–Wilk P–value Coefficient Confidence LM(4) P–valueModel Innovation in Statistic (in %) Interval (at 95%) (in %)
(8) ∆ log(yt) 0.9774 0.9009.72 0.1435 [0.0016 ; 0.2853] 8.3522 7.9497∆ log(nt) 0.9776 0.9818 0.0915 [-0.0507 ; 0.2338] 9.7809 4.4284log(ct) − log(yt) 0.9615 0.0203 0.0345 [-0.1025 ; 0.1715] 1.7395 78.3529log(gt) − log(yt) 0.9601 0.01517 0.3556 [0.2246 ; 0.4866] 22.3671 0.0169
(8) + Habits in Consumption and Dynamic Adjustment Costs
∆ log(yt) 0.9791 1.4309 0.1363 [-0.0057 ; 0.2783] 7.8972 9.5416∆ log(nt) 0.9792 1.4613 0.0569 [-0.0857 ; 0.1995] 8.4205 7.7332log(ct) − log(yt) 0.9547 0.0051 -0.0493 [-0.1863 ; 0.0877] 0.3593 98.5672log(gt) − log(yt) 0.9588 0.0119 0.3469 [0.2160 ; 0.4779] 21.9482 0.0205
(8) + Alternative Feedback Rule (E)
∆ log(yt) 0.9766 0.7257 0.1501 [0.0084 ; 0.2918] 8.8305 6.5479∆ log(nt) 0.9762 0.6508 0.1354 [-0.0062 ; 0.2769] 13.9146 0.7573log(ct) − log(yt) 0.9551 0.0055 -0.0026 [-0.1391 ; 0.1338] 0.9956 91.0466log(gt) − log(yt) 0.9581 0.0101 0.3806 [0.2112 ; 0.5100] 26.0002 0.0032
(8) + News Shocks in Government Spending
∆ log(yt) 0.9757 0.5674 0.1624 [0.0210 ; 0.3039] 9.4777 5.0208∆ log(nt) 0.9758 0.5824 0.1262 [-0.0155 ; 0.2680] 10.6959 3.0203log(ct) − log(yt) 0.9622 0.0237 0.0261 [-0.1118 ; 0.1640] 2.8280 58.7001log(gt) − log(yt) 0.9653 0.0473 0.3778 [0.2477 ; 0.5080] 24.9933 0.0050
Notes: Sample period: 1960:1–2007:4. ∆ log(yt) denotes output growth, ∆ log(nt) hours growth, log(ct) − log(yt) the log ofthe private consumption to output ratio and log(gt) − log(yt) the log of the public consumption to output ratio. Model (8):effect of government spending on marginal utility, feedback rule, habit in leisure. For comparison purpose, specification testswith model (8) are first reported. Coefficients are obtained by projecting each innovation on its own lag. LM(4) denotes theLagrange Multiplier test, including four own lags of each innovation.
Table 7. Parameter Estimates with Alternative Feedback Rules
Specification αg ϕg ϕg,1 ϕg,2 ϕg,3 ∆y/∆g ∆c/∆g ∆x/∆g L
(A) -0.8835 0.6226 1.8516 0.3956 0.4560 2708.02
(B) -0.5624 -0.1141 1.5818 0.1602 0.3859 2674.91
(C) -0.5644 0.0239 1.4950 0.1369 0.3652 2674.43
(D) -0.6421 0.3717 1.5732 0.1868 0.3865 2695.19
(E) -0.7421 0.4341 0.0769 -0.0995 1.6613 0.2531 0.4082 2698.87
Notes: Sample period: 1960:1–2007:4. Model (8): effect of government spending on marginal utility, alternative feedbackrules (from specification (A) to (E)), habit in leisure. Notice that rule (A) corresponds to our benchmark specification oftable 1.
34
the model’s performance. For example, table 6 reports the specification tests with the alternative rule (E) whichprovides the best fit among the rules (B) to (E). As is clear from the table, this estimated rule deteriorates theproperty of the model in term of serial correlation of the innovation in both variables. Upon inspecting table7, one could be tempted to combine specifications (A) (corresponding to model (8)) together with (D) or (E).We tried to estimate such combined specifications but ran into severe convergence problems at the estimationstage.
A.3 News Shocks in the Government Spending Rule
As emphasized by Ramey (2008) and Schmitt–Grohe and Uribe (2008), the expected component in publicspending constitutes an important element of government policy. We thus consider this issue by modifying thestochastic component in government spending according to
g⋆t = ρgg
⋆t−1
+
q∑
i=0
σg,qǫg,t−q
We first imposed q = 4. According to our estimation results, we obtain that lags i = 1, 2, 3 are not significant.
This specification delivers a significantly a better fit to the data than our preferred model (8), according to the
likelihood ratio test (in this case, the log–likelihood is equal to 2715.66). However, the parameter estimates do
not change too much compared to specification (8). In particular, the parameter αg is now equal to 0.8220,
whereas the feedback rule parameter is equal to 0.5999. In addition, as indicated in table 6, allowing for news
shocks in government spending does not improve upon the specification tests of our reference model (8).
35

Figure 7: Local Relationship between the Long–Run Multiplier ∆y/∆g and ϕg.
Private Behaviour
Government Policy
g
y
Notes: Simulation results obtained from 1000 replications. The thick plain line is the non–parametric regressionand thick dashed lines are 95% confidence interval obtained by standard bootstrap techniques. The leftmost scatterdiagram corresponds to the estimation of model (8) on data drawn from model (7). The rightmost scatter diagramcorresponds to the estimation of model (8) on data drawn from model (8). The crosses indicate the average parametervalues for ϕg and the long–run multiplier ∆y/∆g. Model (7): effect of government spending on marginal utility, nofeedback rule, habit in leisure. Model (8): effect of government spending on marginal utility, feedback rule, habit inleisure.
36