a piloted simulator evaluation of transport aircraft rudder pedal force/feel systems eric c. stewart...
TRANSCRIPT

A Piloted Simulator Evaluation of Transport Aircraft Rudder Pedal
Force/Feel Systems
Eric C. StewartNASA Langley Research Center
98th Aerospace Control and Guidance Systems Committee MeetingOctober 11-13, 2006Williamsburg, Virginia

Background• American Airlines Flight 587 crashed on Nov. 12, 2001 on Long
Island, killing 265 people• The accident was probably caused by the pilot over-controlling
the rudder (or PIO) after an encounter with wake turbulence (NTSB/AAR-04/04)
• All rudder systems limit rudder (aerodynamic surface) travel at high speeds to protect against structural failure for static maneuvers such as cross-wind landings and engine failures
• For AA 587 it is thought that large, dynamic lateral-directional motions caused by rapid rudder pedal reversals led to structural failure of the vertical tail and complete loss of control (NTSB/AAR-04/04)
• According to several experts, certain rudder systems are “tailor-made for over-control” (Aviation Week April 1, 2002)

Background (continued)
• Two designs are commonly used: (1) ”ratio changer” and (2) ”variable stop” or fixed ratio
• These two designs have vastly different pilot rudder pedal feel characteristics (pilot forces and deflections) which may cause over-control or PIOs
• The handling quality requirements governing airplane certification in the Federal Aviation Regulations and MIL-STD-8785 have very little to say about rudder pedal feel
• A literature search produced practically nothing relating to a systematic study of the handling qualities due to rudder pedal feel characteristics

Purpose of Study
• Conduct a systematic simulation study of the effects of pilot rudder pedal feel characteristics on the handling qualities of a transport airplane
• Results can be used to guide designers of rudder systems, as a basis for changing the certification requirements, or modifying existing systems

Langley Instrument Flight Deck (IFD) Simulator

Langley IFD Simulator

Candidate Maneuvers/Disturbances
• Operationally realistic maneuvers– Gusts– Wake vortex– Engine surging– Rudder actuator failure
• Artificial maneuvers– “Pop-up” obstacles – Arbitrary angular and/or linear displacements
• Flight condition– High speed/altitude– Low speed/altitude

Test Maneuver
• Combination realistic/artificial maneuver– Produced most rudder pedal activity of
maneuvers tested– Approach in crosswind and random
turbulence– Severe lateral wind shear introduced around
125 feet AGL– No go-around or landing allowed– Runway tracking at 50 feet AGL

Static Pedal Forces
Pedal Deflection, inches
Pedal Forces, lbs
B, breakout force
M, force at maximum travel
X, maximum travel
Slope orStiffness

Pedal Feel Combinations
(Numbers in cells indicate 15 actual test combinations out of possible 125)
Central Composite Design (of Experiments)

Pedal Feel Combinations

Lateral Wind Shear ScenariosShear #1
-40
-30
-20
-10
0
10
20
30
40
0 5 10 15 20 25 30
Time (arbitrary zero), seconds
Lat
eral
Win
d, k
ts
(15 kts)/(2 seconds)
Shear #2
-40
-30
-20
-10
0
10
20
30
40
0 5 10 15 20 25 30
Time (arbitrary zero), seconds
Lat
eral
Win
d,
kts
(-30 kts)/(4 seconds)
Shear #3
-40
-30
-20
-10
0
10
20
30
40
0 5 10 15 20 25 30
Time (arbitrary zero), seconds
Lat
eral
Win
d,
kts
(-45 kts)/(6 seconds)
Shear #4
-40
-30
-20
-10
0
10
20
30
40
0 5 10 15 20 25 30
Time (arbitrary zero), seconds
Lat
eral
Win
d,
kts
(-15 kts)/(2 seconds)
Shear #5
-40
-30
-20
-10
0
10
20
30
40
0 5 10 15 20 25 30
Time (arbitrary zero), seconds
Lat
eral
Win
d, k
ts
(30 kts)/(4 seconds)
Shear #6
-40
-30
-20
-10
0
10
20
30
40
0 5 10 15 20 25 30
Time (arbitrary zero), secondsL
ater
al W
ind
, kt
s
(45 kts)/(6 seconds)

Test Subjects
• All active airline pilots operating Boeing equipment
• 7 males and 5 females
• 4 captains and 8 first officers
• Individual Total Hours: 5,500 to 20,000, average = 11,000
• Individual Hours in command: 500 to 18,500, average = 5,000

Typical Time Histories(Longitudinal Parameters)

Typical Time Histories(Directional Parameters)

Response Surface Equation
Y = b1 + b2*M + b3*B + b4*X (linear terms)
+ b5*M*B + b6*M*X + b7*B*X (interaction terms)
+ b8*M^2 + b9*B^2 + b10*X^2 (squared terms)
where
b’s are constants determined from a least squares fit
M = force at maximum travel (lbs)
B = breakout force (lbs)
X = maximum pedal travel (inches)

Response Surface Equation Predictions

Pilot Rating ContoursMaximum Travel = 1.5 inches
3.8
(61,20)
Min PR
(X, Y)
Key

Pilot Rating ContoursMaximum Travel = 2.5 inches
3.2
(80,19)
Min PR
(X, Y)
Key

Pilot Rating ContoursMaximum Travel = 3.5 inches
2.7
(98,18)
Min PR
(X, Y)
Key

C-H Pilot Rating ContoursBreakout Force = 26.5 lbs
Minimum is out of Range

PIO Tendencies (Time histories)
No Pilot induced oscillations Pilot induced oscillations
Turbulence Induced

PIO Tendencies (Cross spectra)
No Pilot induced oscillations Pilot induced oscillations
Peak Value
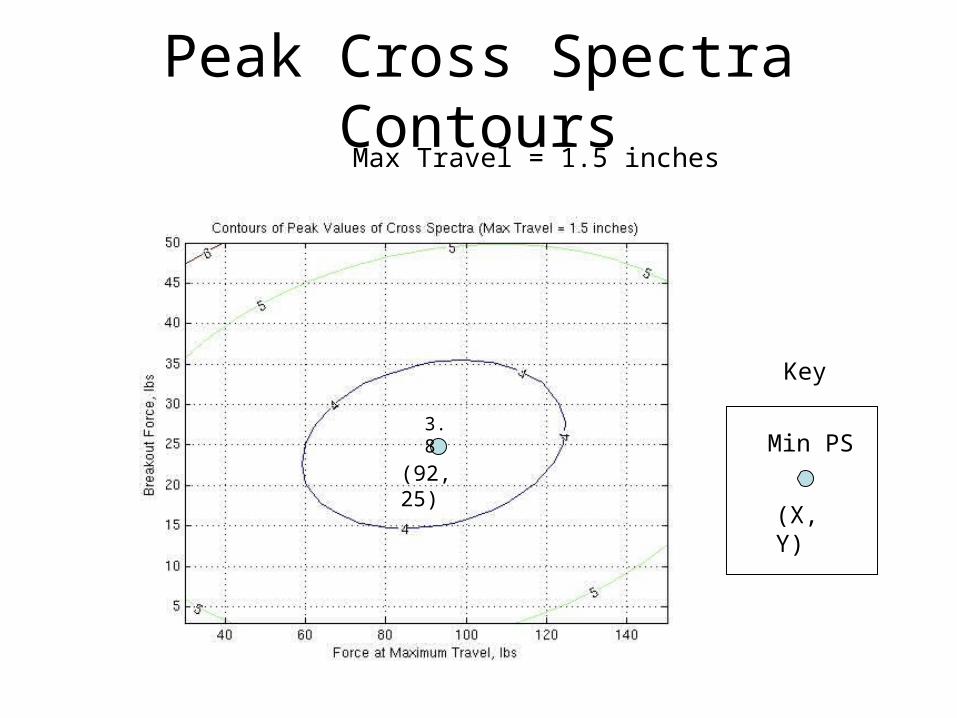
Peak Cross Spectra ContoursMax Travel = 1.5 inches
3.8
(92, 25)Min PS
(X, Y)
Key

Peak Cross Spectra ContoursMax Travel = 2.5 inches
Min PS
(X, Y)
Key2.1
(86, 28)

Peak Cross Spectra ContoursMax Travel = 3.5 inches
1.5
(80,30)Min PS
(X, Y)
Key

Peak Cross Spectra ContoursBreakout Force = 26.5 lbs
1.5
(78, 3.4)
Min PS
(X, Y)
Key

Preliminary Results
• Method successfully quantified pedal feel characteristics– Central Composite Design– Response Surface Equation– Averaged pilot ratings from line pilots gave consistent
results for 6 or more pilots
• Results need to verified for– Other configurations (e.g. wheel feel characteristics)– Motion-base simulator– Other maneuvers

Preliminary Results (concluded)
• Response Surface Equation is useful for– Generating arbitrary contours of constant pilot ratings– Revealing optimum combinations of pedal feel
characteristics
• Peak values of cross spectra of pilot input and airplane response may be used to predict PIO tendencies– Predicted PIO tendencies are generally consistent
with pilot ratings
• A more complete report with added details is in preparation