a pilot study on pearson’s interactive science 2011 program · pearson’s interactive science...
TRANSCRIPT

Prepared by PRES Associates, Inc. – An Independent Evaluation Company 1
A Pilot Study on Pearson’s Interactive Science 2011 Program
Final Report
Prepared by:
Danielle DuBose, Research Associate
Miriam Resendez, Senior Researcher
Dr. Mariam Azin, President
Submitted on August 5, 2010
For inqui r ies , p lease contact PRES Assoc iates at :
(307) 733-3255
© 2010 PRES Assoc iates, Inc .

Prepared by PRES Associates, Inc. – An Independent Evaluation Company 2
Table of Contents Executive Summary........................................................................................................................... 6 Project Background......................................................................................................................... 11 Project Overview.............................................................................................................................. 13 Methodology ..................................................................................................................................... 14 Sites and Sample Characteristics ................................................................................................... 16 Results ............................................................................................................................................... 19
What preliminary relationships are observed between use of the Pearson Interactive Science 2011 program and key student and teacher outcomes? ................................................................. 24
What do users of the Pearson Interactive Science 2011 program think about the program? What aspects of the program do they find most useful? Least useful? What, if any, suggestions for program improvement do they have? ............................................................................................ 38
How do teachers use the Pearson Interactive Science 2011 program in their classroom? Do teachers of differing pedagogical approaches and philosophies implement the program differently across science classrooms? .......................................................................................... 47
How should the Pearson Interactive Science 2011 program best be used in order to maximize its impact on student performance? ............................................................................................... 53
What type(s) of training and preparation is needed in order to promote effective implementation of the Pearson Interactive Science 2011 program? Are the built-in teacher resources useful to teachers in helping them prepare to effectively deliver science instruction in their classroom?... 56
Which types of assessments and outcome measures will be most sensitive to picking up the effects of the Pearson Interactive Science 2011 program? What is the reliability, validity and sensitivity of data collection instruments used during the pilot study? ......................................... 59
Conclusion ........................................................................................................................................ 60 References......................................................................................................................................... 61 Appendix A: Tables of Statistical Results...................................................................................... 64 Appendix B: Implementation Guidelines ...................................................................................... 68 Appendix C: Description of the Regular (non-PIS) Science Curriculum and Resources………74
Prepared by PRES Associates, Inc. – An Independent Evaluation Company 3
Table of Figures and Tables Tables Table 1. Study Site School Level Student Demographics ...........................................................17 Table 2. Number of Teachers and Study Classes that Used the Ecology and the Environment
Module ...........................................................................................................................18 Table 3. Number of Teachers and Study Classes that Used the Earth’s Structure Module.........18 Table 4. Number of Teachers and Study Classes that Used the Forces and Energy Module ......18 Table 5. Regular Science Program used by Participating Pilot Teachers....................................18 Table 6. Usefulness Ratings of the Pearson Interactive Science Program by Pilot Teachers......39 Table 7. Frequency of Use of Pearson Interactive Science Components ....................................49 Table 8. Average Number of Labs and Time to Complete Labs and Chapters During the 2009
and 2010 Pilot Study………………………………………………………………………………...52 Table 9. Training Schedule ..........................................................................................................55 Table 10. Psychometric Properties of the Pearson Interactive Science Custom Assessments ......58 Table 11. Correlation Between Pearson Interactive Science Custom Assessments and the
TerraNova3, Science Assessments ................................................................................59 Table A1. Pre and Post Pearson Interactive Science Custom Test Statistics by Item TypeTable
A2. PRE and Post TerraNova3 Test Statistics ...............................................................63 Table A2. PRE and Post TerraNova3 Test Statistics......................................................................64 Table A3. Pre and Post TerraNova3: Content Specific Results......................................................64 Table A4. Frequency of use of Pearson Interactive Science Components Required by
Implementation Guidelines as reported by Teacher Activity Logs – Earth’s Structure.........................................................................................................................64
Table A5. Frequency of Use of Pearson Interactive Science Components Optional Activities by Implementation Guidelines as Reported by Teacher Activity Logs-Earth’s Structure .65
Table A6. Frequency of use of Pearson Interactive Science Components Required by Implementation Guidelines as reported by Teacher Activity Logs – Ecology and the Environment...................................................................................................................65
Table A7. Frequency of Use of Pearson Interactive Science Components Optional Activities by Implementation Guidelines as Reported by Teacher Activity Logs—Ecology and the Environment...................................................................................................................65
Table A8. Frequency of use of Pearson Interactive Science Components required by Implementation Guidelines as Reported by Teacher Activity Logs – Forces and Energy ............................................................................................................................65
Table A9. Frequency of Use of Pearson Interactive Science Components Optional Activities by Implementation Guidelines as Reported by Teacher Activity Logs-Forces and Energy ............................................................................................................................66
Figures Figure 1. Student Performance on the Pearson Interactive Science Assessment: Earth’s
Structure.........................................................................................................................23 Figure 2. Student Performance on the Pearson Interactive Science Assessment: Ecology and
the Environment.............................................................................................................23 Figure 3. Student Performance on the Pearson Interactive Science Assessment: Forces and
Energy ............................................................................................................................23
Prepared by PRES Associates, Inc. – An Independent Evaluation Company 4
Figure 4. Student Performance on the Pearson Interactive Science Earth’s Structure Test by Type of Test Items .........................................................................................................24
Figure 5. Student Performance on the Pearson Interactive Science Ecology and the Environment Test by Type of Test Items ......................................................................24
Figure 6. Student Performance on the Pearson Interactive Science Forces and Energy Test by Type of Test Items .........................................................................................................25
Figure 7. Overall Student Performance on the TerraNova3 Science Assessments.......................25 Figure 8. Student Performance on the TerraNova3 Earth Science Content Area.........................26 Figure: 9. Student Performance on the TerraNova3 Life Science Content Area...........................26 Figure 10. Student Performance on the TerraNova3 Physical Science Content Area ....................27 Figure 11. Student Performance on the TerraNova3 Science Assessment: Level 16 (Grade 6) ....27 Figure 12. Student Performance on the TerraNova3 Science Assessment: Level 17 (Grade 7) ....27 Figure 13. Student Performance on the TerraNova3 Science Assessment: Level 18 (Grade 8) ....28 Figure 14. Student Performance on the TerraNova3, Science Assessment: Level 16 (Grade 6)
by Ability Level .............................................................................................................28 Figure 15. Student Performance on the Pearson Interactive Science Assessment: Ecology and
the Environment by Ability Level of 6th Graders ..........................................................28 Figure 16. Student Performance on the TerraNova3, Science Assessment: Level 17 (Grade 7)
by Ability Level .............................................................................................................29 Figure 17. Student Performance on the Pearson Interactive Science Assessment: Earth’s
Structure by Ability Level of 7th Graders ......................................................................29 Figure 18. Student Performance on the Pearson Interactive Science Assessment: Forces and
Energy by Ability Level of 8th Graders .........................................................................29 Figure 19. Percent of Students who Agreed the Pearson Interactive Science Program Helped
Them Learn Science ......................................................................................................30 Figure 20. Teacher Perceptions of the Degree to Which the Pearson Interactive Science
Program Helped Students’ Problem-Solving and Cognitive Skills ...............................30 Figure 21. Teacher and Student perceptions of the Degree to Which They Were Engaged in
Science While Using Pearson Interactive Science Relative to their Regular Science Program..........................................................................................................................31
Figure 22. Percent of Teachers and Students Who Agreed that the Pearson Interactive Science Program Affected Student Interest in Science ...............................................................32
Figure 23. Percent of Teachers and Students Who Agreed the Pearson Interactive Science Program Helped Students with Science Connections and Applications........................33
Figure 24. Percent of Teachers and Students Who Agreed the Pearson Interactive Science Program Helped Students on Tests and Future Science Classes ...................................33
Figure 25. Percent of Teachers Who Agreed the Pearson Interactive Science Program Provided Useful Information to Effectively Teach Science..........................................................34
Figure 26. Teacher Perceptions of the Degree to Which the Pearson Interactive Science Program Helped Them With Their Science Instruction Relative to Their Regular Science Program ............................................................................................................34
Figure 27. Average Level of Teacher Preparedness for Instructional Activities ............................35 Figure 28. Average Level of Teacher Preparedness for Inquiry-Related Instructional Activities..35 Figure 29. Teacher Perceptions of the Degree to which the Pearson Interactive Science Program
Helped with Individualizing Instruction Relative to Other Science Programs..............36 Figure 30. Percent of Teachers and Students Who Liked the Pearson Interactive Science
Program..........................................................................................................................37
Prepared by PRES Associates, Inc. – An Independent Evaluation Company 5
Figure 31. Teacher and Student Ratings of Preference for Pearson Interactive Science Program vs. Regular Science Program .........................................................................................38
Figure 32. Average Descriptive Ratings by Students on the Pearson Interactive Science Program..........................................................................................................................38
Figure 33. Teacher and Student Perceptions of the Degree to Which Pearson Interactive Science Program Components are Better Relative to their Regular Science Program..39
Figure 34. Percent of Students and Teachers Who Liked the Pearson Interactive Science Worktext ........................................................................................................................40
Figure 35. Percent of Students and Teachers Who Agreed That They Liked the Organization of the Pearson Interactive Science Worktext .................................................................42
Figure 36. Percent of Teachers and Students Who Liked the Labs Activities in the Pearson Interactive Science Program ..........................................................................................43
Figure 37. Teacher Ratings of the Pearson Interactive Science Labs by Type ...............................44 Figure 38. Teacher and Student Perceptions of the Degree to Which Students Engaged in
Activities While Using the Pearson Interactive Science Program.................................46 Figure 39. Teacher Perceptions of the Degree to Which Their Classroom Activities and
Practices Were Effected by the Pearson Interactive Science Program..........................47 Figure 40. Student Perceptions on the Degree to Which Teachers Engaged in Various
Classroom Activities While Using Pearson Interactive Science ...................................48 Figure 41. Percentage of Teachers Who Assigned Supplemental Activities While Using
Pearson Interactive Science ...........................................................................................50 Figure 42. Teacher and Student Perception of the Degree to Which Inquiry Related Activities
Occurred While Using Pearson Interactive Science Relative to their Regular Science Program..........................................................................................................................51
Figure 43. Percent of Teachers Who Felt Training and the Teacher’s Edition Were Helpful ........56 Figure 44. Student Performance on the Pearson Interactive Science Assessments by Type of
Test Items.......................................................................................................................58

Prepared by PRES Associates, Inc. – An Independent Evaluation Company 6
Executive Summary Planning, Research, and Evaluation Services
(PRES) Associates, Inc. conducted a pilot study on the new Pearson Interactive Science 2011 program in the Spring, 2010. This pilot study was designed to expand on the 2009 pilot study by gathering quantitative and qualitative data during a more extended period of time1 to provide a more comprehensive picture of program implementation as well as preliminary outcome data on a diverse set of student and teacher outcomes. In addition, information obtained from this pilot study is being used to inform the design of the more rigorous experimental study on the effectiveness of this program to be undertaken during the 2010-2011 school year. Specifically, additional potential outcome measures, including custom assessments were piloted to ensure that assessments used during the 2010-2011 RCT are sensitive to the Pearson Interactive Science program.
The pilot study consisted of 381 students in
grades 6-8 and 8 science teachers spread across 3 middle schools in the states of Missouri, Utah, and Washington. Three Pearson Interactive Science modules were piloted and consisted of Earth’s Structure, Ecology and the Environment, and Forces and Energy. What follows is a summary of the key findings from the study arranged by research questions. What preliminary relationships are observed between use of the Pearson Interactive Science 2011 program and key student and teacher outcomes?
Students showed significant growth from pre- to post-testing on the Earth Structure, Ecology and the Environment, and Forces and Energy custom assessments. Gains
1 In particular, while the 2009 teachers piloted only one Pearson Interactive Science chapter, the 2010 teachers piloted one module which contains 4-8 chapters.
ranged from 8% to 19%. Students also showed significant growth on the Earth’s Structure and Ecology and the Environment tests across all the different types of test items: multiple choice, fill-in-the-blank and constructed response. However, mixed findings were obtained on the Forces and Energy test. Students who took the Forces and Energy test showed significant improvement on the multiple choice and fill-in-the-blank items, but showed no significant change on constructed response items. These findings are somewhat consistent with the findings of the Spring 2009 pilot study and may suggest that the content of this module is more challenging than the other modules used in the pilot study and that students experienced greater difficulties communicating and applying concepts related to Physical Science.
Performance on the TerraNova3, a national norm-referenced exam, was also examined. It should be noted that substantial gains were not expected since TerraNova3 assessment contains items across all content areas of science, many of which were not covered within the modules used during the study. With this caveat in mind, results indicate that across all grades, students showed a marginally significant learning gain from pre to post testing, p<.10. In addition, while the percentile gain is small at .2%, it is noteworthy when one considers that it is a general rule of thumb that if a student makes a year’s growth for a year of instruction, then the percentile rank will remain the same. To more closely examine the relationship between TerraNova3 student science performance and the Pearson Interactive Science program, researchers also analyzed separately TerraNova3 questions that were more directly aligned to the specific science areas taught during the study. Results showed significant gains for life and earth science students. No
Prepared by PRES Associates, Inc. – An Independent Evaluation Company 7
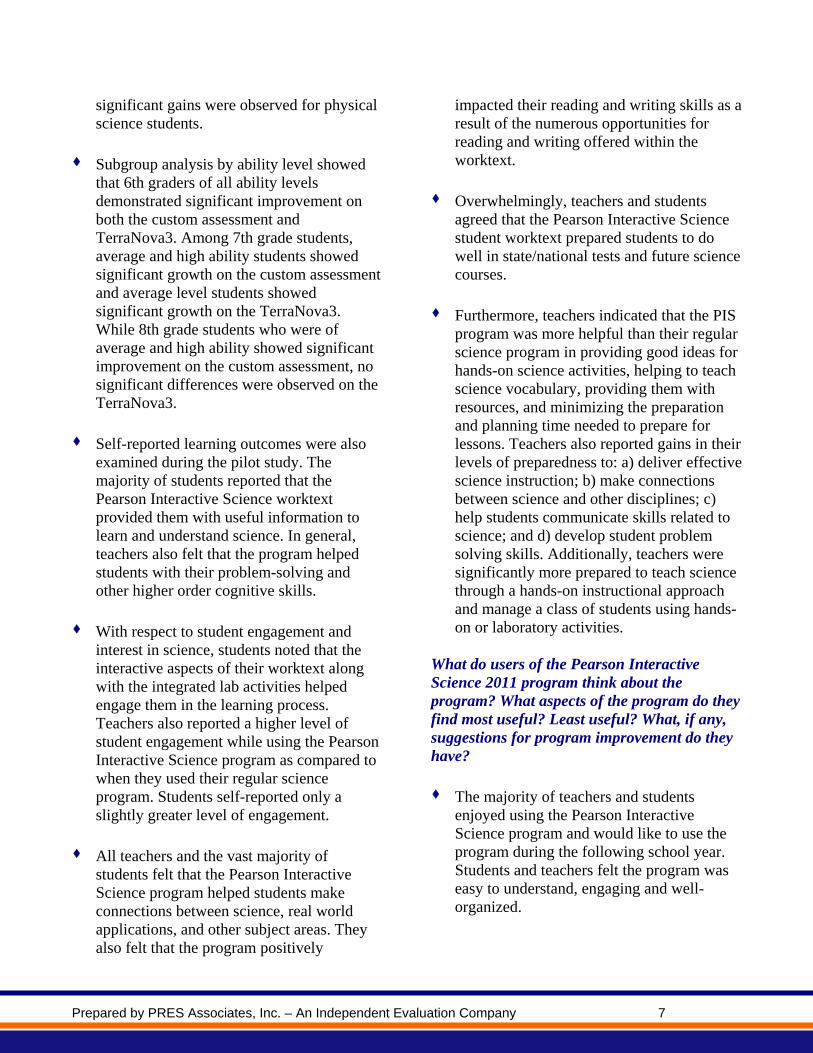
significant gains were observed for physical science students.
Subgroup analysis by ability level showed that 6th graders of all ability levels demonstrated significant improvement on both the custom assessment and TerraNova3. Among 7th grade students, average and high ability students showed significant growth on the custom assessment and average level students showed significant growth on the TerraNova3. While 8th grade students who were of average and high ability showed significant improvement on the custom assessment, no significant differences were observed on the TerraNova3.
Self-reported learning outcomes were also examined during the pilot study. The majority of students reported that the Pearson Interactive Science worktext provided them with useful information to learn and understand science. In general, teachers also felt that the program helped students with their problem-solving and other higher order cognitive skills.
With respect to student engagement and interest in science, students noted that the interactive aspects of their worktext along with the integrated lab activities helped engage them in the learning process. Teachers also reported a higher level of student engagement while using the Pearson Interactive Science program as compared to when they used their regular science program. Students self-reported only a slightly greater level of engagement.
All teachers and the vast majority of students felt that the Pearson Interactive Science program helped students make connections between science, real world applications, and other subject areas. They also felt that the program positively
impacted their reading and writing skills as a result of the numerous opportunities for reading and writing offered within the worktext.
Overwhelmingly, teachers and students agreed that the Pearson Interactive Science student worktext prepared students to do well in state/national tests and future science courses.
Furthermore, teachers indicated that the PIS program was more helpful than their regular science program in providing good ideas for hands-on science activities, helping to teach science vocabulary, providing them with resources, and minimizing the preparation and planning time needed to prepare for lessons. Teachers also reported gains in their levels of preparedness to: a) deliver effective science instruction; b) make connections between science and other disciplines; c) help students communicate skills related to science; and d) develop student problem solving skills. Additionally, teachers were significantly more prepared to teach science through a hands-on instructional approach and manage a class of students using hands-on or laboratory activities.
What do users of the Pearson Interactive Science 2011 program think about the program? What aspects of the program do they find most useful? Least useful? What, if any, suggestions for program improvement do they have?
The majority of teachers and students enjoyed using the Pearson Interactive Science program and would like to use the program during the following school year. Students and teachers felt the program was easy to understand, engaging and well-organized.

Prepared by PRES Associates, Inc. – An Independent Evaluation Company 8
When asked to directly compare the Pearson Interactive Science program with their regular science program, teachers rated the PIS program more favorably. Students, however, rated both science programs similarly overall. However, when asked about specific components of curricula, students and teachers rated the overall presentation of the student worktext and ease of use as better than their regular program. Teachers also rated the Pearson Science Interactive program more favorably than their regular science program with respect to: 1) math activities, 2) format of the student book, 3) writing opportunities in the worktext, 4) how science is explained, 5) science labs, and 6) types of exercises and questions in the program.
In general, teachers commented that they thought that all pedagogical components of the Pearson Interactive Science program were useful. Teachers especially liked the Figures/Activity Art/Animations, “Do the Math”, Big Questions, “Apply It!”, and “Explore the Big Question.”
With respect to the worktext specifically, the majority of students loved that they could write in their worktext, that they “owned” the book, and could keep all their notes in one place. They also liked the portability of the worktext. However, about 33% of students felt indifferent towards the worktext.
Teachers and students liked the labs and investigations they used from the Pearson Interactive Science program and felt the lab zones kept students interested in science class. When asked to rate each of the various types of labs, teachers rated the Inquiry Warm-Up Labs the most favorably followed by the Quick Labs and Lab Investigations.
How do teachers use the Pearson Interactive Science 2011 program in their classroom?
Participating teachers did well in following the implementation guidelines and Teacher’s Edition (TE). The only required activity that was not used as directed by the implementation guidelines was the My Planet Diary feature. In addition, while many teachers reported using supplemental activities, they were mostly digital resources, computer programs and teacher developed labs and worksheet.
When asked to compare their engagement in various instructional activities during the Fall semester (when they used their regular science program) versus the Spring semester (when they used the PIS program), both students and teachers reported that students answered textbook or worksheet questions, used mathematics as a tool with science problems, and explained in writing their answers to questions in science class more often while using the Pearson Interactive Science program as compared to when they used their regular science program. Teachers reported that they introduced new science topics by exploring Big Questions and assigning a hands-on lab activity more often while using the Pearson Interactive Science program as compared to when they used their regular science program. In addition, teachers felt that they were better able to assess their students’ level of understanding during and after the lesson while using the PIS program.
For the most part, it was feasible for students to complete one Inquiry Warm Up and Quick Lab per lesson and one Lab Investigation per chapter. Teachers also reported that the lab time estimates were fairly accurate. However, similar to the 2009 pilot, some teachers noted that it did not

Prepared by PRES Associates, Inc. – An Independent Evaluation Company 9
include time for teacher preparation which could be considerable.
How should the Pearson Interactive Science 2011 program best be used in order to maximize its impact on student performance?
Based on the information gathered during the two pilot studies, it is recommended that teachers use the program as outlined in the 2010 pilot study implementation guidelines. As noted, it was feasible for students to complete one Inquiry Warm Up and Quick Lab per lesson and one Lab Investigation per chapter. In addition, most teachers were able to complete the required components of the program as outlined in the guidelines while maintaining a reasonable pace. Moreover, for the most part pilot teachers agreed that the key components noted in the guidelines were essential for student understanding. The only exceptions were use of the My Planet Diary, Assess Your Understanding and the Lab Investigations. Nevertheless, these components are considered critical by the authors as they engage, evaluate, and allow students to explore – all aspects of the research-based 5Es pedagogy.
What type(s) of training and preparation is needed in order to promote effective implementation of the Pearson Interactive Science 2011 program? Are the built-in teacher resources useful to teachers in helping them prepare to effectively deliver science instruction in their classroom?
Teachers commented that there were sufficient resources to effectively implement the Pearson Interactive Science program. They also reported that they enjoyed the training and were adequately prepared to use the Pearson Interactive Science program. Their preparedness to use the program was also facilitated by how the program was
designed and organized – teachers noted that it was easy to use, including the labs.
Recommendations for future trainings include: (1) develop and employ a training model to promote consistency in trainings; (2) begin with the program’s research base and philosophy as it would be helpful for teachers to fully understand the background related to why/how Pearson created this program to improve student science skills; (3) provide a general overview of all the teaching resources available as part of the Pearson Interactive Science program, where to find them and how to use them, including a modeling of the lesson; (4) schedule trainings approximately 1-2 weeks prior to implementation so that information conveyed is fresh in their minds; and (5) provide additional training on the digital path that will focus on detailed information on what is available and how to incorporate the technology into their activities.
Which types of assessments and outcome measures will be most sensitive to picking up the effects of the Pearson Interactive Science 2011 program? What is the reliability, validity and sensitivity of data collection instruments used during the pilot study?
On the custom assessments students did equally well on multiple choice and constructed response test items. Furthermore, they showed the greatest improvement on the fill-in-the-blank test items which for the most part focused on vocabulary words. This finding is consistent with the findings of the small-scale pilot conducted in Spring 2009 in which students showed the greatest improvement on the fill-in-the-blank test items. In addition, and as expected, the custom assessments were also more sensitive to the measurement of student growth than the TerraNova3. That said, the TerraNova3 is important to include

Prepared by PRES Associates, Inc. – An Independent Evaluation Company 10
in the RCT as it will provide normative data (e.g., percentile rankings) on student performance so that comparisons can be made to a national sample.
The custom tests used in the pilot study showed high levels of internal consistency (Chronbach’s alpha) and split half reliability, indicating they are psychometrically sound. Furthermore, the custom assessments were correlated with the TerraNova3 assessments to obtain information on the concurrent validity of the custom assessment. The obtained correlations are adequate and suggestive of concurrent validity.
In sum, researchers were able to obtain
additional information that suggests that the Pearson Interactive Science program is associated with positive student outcomes. However, these findings are only preliminary and not conclusive. That said, the upcoming full year randomized control trial has been designed to produce rigorous quantitative evidence upon which strong conclusions could be drawn regarding the effects of the Pearson Interactive Science program on student learning.
Prepared by PRES Associates, Inc. – An Independent Evaluation Company 11
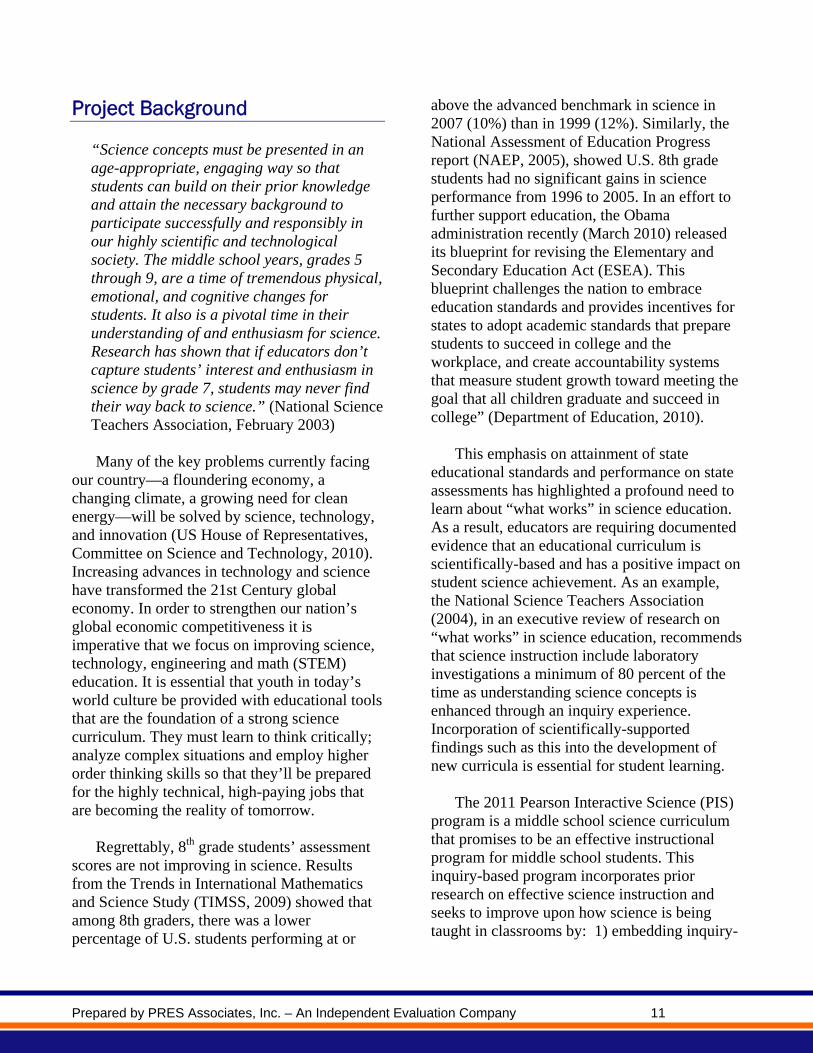
Project Background
“Science concepts must be presented in an age-appropriate, engaging way so that students can build on their prior knowledge and attain the necessary background to participate successfully and responsibly in our highly scientific and technological society. The middle school years, grades 5 through 9, are a time of tremendous physical, emotional, and cognitive changes for students. It also is a pivotal time in their understanding of and enthusiasm for science. Research has shown that if educators don’t capture students’ interest and enthusiasm in science by grade 7, students may never find their way back to science.” (National Science Teachers Association, February 2003) Many of the key problems currently facing
our country—a floundering economy, a changing climate, a growing need for clean energy—will be solved by science, technology, and innovation (US House of Representatives, Committee on Science and Technology, 2010). Increasing advances in technology and science have transformed the 21st Century global economy. In order to strengthen our nation’s global economic competitiveness it is imperative that we focus on improving science, technology, engineering and math (STEM) education. It is essential that youth in today’s world culture be provided with educational tools that are the foundation of a strong science curriculum. They must learn to think critically; analyze complex situations and employ higher order thinking skills so that they’ll be prepared for the highly technical, high-paying jobs that are becoming the reality of tomorrow.
Regrettably, 8th grade students’ assessment scores are not improving in science. Results from the Trends in International Mathematics and Science Study (TIMSS, 2009) showed that among 8th graders, there was a lower percentage of U.S. students performing at or
above the advanced benchmark in science in 2007 (10%) than in 1999 (12%). Similarly, the National Assessment of Education Progress report (NAEP, 2005), showed U.S. 8th grade students had no significant gains in science performance from 1996 to 2005. In an effort to further support education, the Obama administration recently (March 2010) released its blueprint for revising the Elementary and Secondary Education Act (ESEA). This blueprint challenges the nation to embrace education standards and provides incentives for states to adopt academic standards that prepare students to succeed in college and the workplace, and create accountability systems that measure student growth toward meeting the goal that all children graduate and succeed in college” (Department of Education, 2010).
This emphasis on attainment of state educational standards and performance on state assessments has highlighted a profound need to learn about “what works” in science education. As a result, educators are requiring documented evidence that an educational curriculum is scientifically-based and has a positive impact on student science achievement. As an example, the National Science Teachers Association (2004), in an executive review of research on “what works” in science education, recommends that science instruction include laboratory investigations a minimum of 80 percent of the time as understanding science concepts is enhanced through an inquiry experience. Incorporation of scientifically-supported findings such as this into the development of new curricula is essential for student learning.
The 2011 Pearson Interactive Science (PIS) program is a middle school science curriculum that promises to be an effective instructional program for middle school students. This inquiry-based program incorporates prior research on effective science instruction and seeks to improve upon how science is being taught in classrooms by: 1) embedding inquiry-

Prepared by PRES Associates, Inc. – An Independent Evaluation Company 12
based teaching strategies into science instruction to promote higher-order thinking skills and student engagement; 2) designing a science curriculum that addresses the latest state and national science standards; and 3) promoting real-world connections so that students have ample opportunity to apply what they learn – thereby continually reinforcing and emphasizing the relevance of science in their everyday life.
The 2011 Pearson Interactive Science program consists of 12 modules in the areas of Earth Science, Life Science and Physical Science, which are distributed as interactive worktexts2. The program contains nearly 1,000 individual lessons – allowing schools and teachers a great deal of flexibility in tailoring content, scope and sequence so as to address state and local standards and ensure that necessary content is covered prior to state assessment cycles.
For teachers, the Pearson Interactive Science program provides a comprehensive resource for lesson planning, devising lab activities, and engaging students in science content that may be outside their area of expertise or training. The program incorporates Understanding By Design, an instructional model that places big science ideas into student-friendly all encompassing questions about science. In addition, lessons are organized around an inquiry-based process which focuses upon the 5Es: 1) Engage; 2) Explore; 3) Explain; 4) Extend; and 5) Evaluate. Together, these features represent a model of inquiry-learning that lends itself to higher-order thinking skills, understanding and critical thinking. For students, the Pearson Interactive Science program presents real-world information that is personally relevant and socially engaging. The text is designed so students can make their own
2 “Worktexts” are a combination of a student text and a workbook. Students are able to use their worktext in an interactive manner, including writing in their worktext and keeping it as a journal of their science learning.
interpretations of the material and self-assess their understanding of the information presented.
Other key features of the Pearson Interactive Science program include:
Engaging content and active learning opportunities to help teachers engage students along the road to scientific understanding.
Each lesson features rich content, daily ongoing assessment, built-in student help, problem solving, and vocabulary support, all of which facilitate increased student confidence and independence in science.
Focuses on helping teachers provide clear, effective, differentiated instruction to reach all learners through the program’s many technology and print resources available for planning, teaching, and assessing.
Integrated Lab Zones allow the teacher to engage students in hands-on activities applying what they have learned to real-world problem solving scenarios.
Prepared by PRES Associates, Inc. – An Independent Evaluation Company 13
Project Overview
Planning Research and Evaluation Services (PRES) Associates3, conducted a pilot study on the new Pearson Interactive Science 2011 program in the Spring, 2010. This 2010 pilot study was designed to expand on the 2009 pilot study by gathering quantitative and qualitative data during a more extended period of time4 to provide a more comprehensive picture of program implementation as well as preliminary outcome data on a diverse set of student and teacher outcomes. In addition, information obtained from this pilot study is being used to inform the design of the more rigorous experimental study on the effectiveness of this program to be undertaken during the 2010-2011 school year. Specifically, additional potential outcome measures, including custom assessments were piloted to insure that assessments used during the 2010-2011 RCT are sensitive to the Pearson Interactive Science program.5
It should be noted that the pilot study was
not designed to produce conclusive evidence on the effectiveness of the Pearson Interactive Science program. That is, due to the short duration of the pilot study (2-4 months) and the fact that randomization did not take place, strong conclusions cannot be drawn with respect to the effects of the program on student science learning. However, researchers were able to obtain additional information on the relationship between the new Pearson Interactive Science program and student science performance.
3 PRES Associates Inc. is an external independent educational research firm with over 20 years of experience in applied education research and evaluation. 4 In particular, while the 2009 teachers piloted only one Pearson Interactive Science chapter, the 2010 teachers piloted one module which contain 4-8 chapters. 5 Notably, the results from this pilot study and the previous pilot study conducted in Spring 2009 will enhance the likelihood that the RCT will be designed in such a fashion so as to detect any positive effects that occur as a result of using the Pearson Interactive Science program.
The pilot study was designed to address the
following research questions:
1. What preliminary relationships are observed between use of the Pearson Interactive Science 2011 program and key student and teacher outcomes?
2. What do users of the Pearson Interactive
Science 2011 program think about the program? What aspects of the program do they find most useful? Least useful? What, if any, suggestions for program improvement do they have?
3. How do teachers use the Pearson
Interactive Science 2011 program in their classroom?
4. How should the Pearson Interactive
Science 2011 program best be used in order to maximize its impact on student performance?
5. What type(s) of training and preparation
is needed in order to promote effective implementation of the Pearson Interactive Science 2011 program? Are the built-in teacher resources useful to teachers in helping them prepare to effectively deliver science instruction in their classroom?
6. Which types of assessments and
outcome measures will be most sensitive to picking up the effects of the Pearson Interactive Science 2011 program? What is the reliability, validity and sensitivity of data collection instruments used during the pilot study?
This report provides information on the
procedures used for the pilot study, background information on the pilot sites (including teachers and students), and the findings of the pilot

Prepared by PRES Associates, Inc. – An Independent Evaluation Company 14
study. In addition, when relevant, results from the prior pilot study are incorporated and triangulated with the present study results. The report concludes by highlighting the implications these findings will have for the large-scale randomized control trial (RCT) to occur next year.
Methodology
The Pearson Interactive Science (PIS) pilot study commenced in mid-January 2010 and concluded in mid-June, 2010. Three middle schools located in Missouri, Utah and Washington participated in the pilot study. These schools included 381 students spanning grades 6-8 and eight middle school science teachers.
The Pearson Interactive Science program includes 12 modules covering Life, Earth, Physical Science and Science and Technology. For the pilot study, the following three modules were used:
Earth’s Structure (Earth Science) Ecology and the Environment (Life
Science) Forces and Energy (Physical Science)
Participating teachers selected one module
and taught this science topic using the new PIS program during Spring semester, 2010. Teachers were provided with the following PIS resources during the pilot study:
Student Edition worktext
Teacher’s Edition
Lab resources book and lab materials
Digital path materials
Ancillary materials
The ancillary tools which can be used for differentiated instruction and other supplemental
activities included: 1) Big Ideas of Science Reference Library; 2) Accelerated Progress for ELL; 3) Chapter Activities and Projects; 4) Inquiry Skill Activities books; 5) Interdisciplinary Activities; and 6) Math Skill and Problem Solving Activities.
It should be noted that the digital path materials and science videos were limited and only available for one chapter in each of the three modules that were used for this pilot study. The chapters with digital path materials available were as follows:
Earthquakes (in Earth’s Structure)
Populations and Communities (in Ecology and the Environment)
Work and Machines (in Forces and Energy)
It is anticipated that most of the digital path components will be available for the duration of the 2010-2011 RCT. PROCEDURES
To ensure that all teachers participating in the pilot study had sufficient knowledge and skills to successfully implement the Pearson Interactive Science program, pilot teachers were given study implementation guidelines and training prior to implementation. In addition, monitoring procedures (i.e., classroom observations, monthly activity logs, and communications with teachers/liaisons) were employed to determine how teachers were using the program.
For the implementation guidelines, Pearson
staff identified key components of the Pearson Interactive Science program that are considered essential for use. The guidelines offer detailed direction on how the program should be used in the classroom as well as what parts of the program are considered key (and required), versus which program elements are considered

Prepared by PRES Associates, Inc. – An Independent Evaluation Company 15
optional. The key components of the program include:
The Big Question Check Your Understanding My Planet Diary Vocabulary Figures/Activity Art/Animations Apply It! Do the Math! Assess Your Understanding Inquiry Warm-Up Lab (1 per lesson) Quick Lab (1 per lesson) Lab Investigation (1 per chapter)
A copy of the Implementation Guidelines is included in Appendix B. DATA COLLECTION METHODS
A range of data was collected in the pilot study, including descriptive information, program implementation data, and preliminary outcome data. Data from both quantitative and qualitative sources were triangulated to identify recurrent themes. The following presents details on the types of data collected during the pilot study. Quantitative Methods Teacher Survey: All participating teachers completed a teacher survey before and after using the Pearson Interactive Science module. The survey created by PRES Associates, was developed to collect information on:
Science related knowledge and attitudes Environment and Organizational
Support Classroom Practices Attitudes about curriculum Attitudes about the training Demographic information
Student Survey: Participating students also completed a student survey before and after using the Pearson Interactive Science module. The survey created by PRES Associates was developed to collect information on:
Students attitudes towards science School and education related attitudes Attitudes towards their teachers Attitudes toward their learning and home
environment Classroom practices Usefulness of the science curriculum
Student Assessments: In order to obtain preliminary information on: a) student outcomes, and b) the sensitivity of the assessment package planned for use in the 2010-11 RCT, a combination of the norm-referenced TerraNova3 and custom developed science assessments were used in the pilot study.
Custom science assessments were created in order to more precisely measure content taught in the three modules used during the pilot study: Ecology & the Environment, Earth’s Structure, and Forces & Energy. Items were drawn from released state science assessments, TIMSS, NAEP, and in some instances custom-developed to measure content taught. The assessments were worth 50 points and contained 35 multiple choice items, 5 completion items and 5 short answer items. Of note is that 35 items were directly aligned to the module taught and the other 15 items were questions derived from additional science modules covering the same content area (Life, Earth and Physical science). These additional questions were developed so as to inform the development of the final assessment package to be used during the 2010-2011 study. A scoring guide was also developed for each of the assessments.
The TerraNova, Third Edition Complete
Battery Science test was also administered so that information on student performance could

Prepared by PRES Associates, Inc. – An Independent Evaluation Company 16
be obtained using a national standardized science test. The TerraNova3 exam is a norm referenced achievement test developed by CTB McGraw-Hill. The science portion of the test was evaluated in a series of pilot studies to determine grade-level appropriateness and only items with statistics confirming grade-level appropriateness and instructional relevance were included in the test. The science test consists of 40 multiple choice questions measuring the following science areas: Science Inquiry, Physical Science, Life Science, Earth and Space Science, Science and Technology, and Personal and Social Perspectives in Science. It should be noted that this assessment covers topics beyond those that were covered throughout the pilot study and therefore, it was not expected that students would achieve great gains on this assessment given the lack of direct alignment.
Students were administered the science
portion of the TerraNova3 Level 16, 17 and 18 tests for grades 6, 7 and 8, respectively. Assessments were administered to students at the beginning of the study period for the respective schools (pre) and at the end of the study period (post) to obtain preliminary information on the effects of the program. Of note is that more rigorous data, including comparison groups will be collected as part of the randomized control trial to be undertaken during the 2010-2011 school year. Qualitative Methods Classroom Observations: One classroom observation was conducted at the UT and WA school sites and two classroom observations were conducted at the MO school site. Observations focused on how teachers used Pearson Interactive Science in their classrooms and the characteristics and behaviors of the students, including student engagement as they used Pearson Interactive Science.
Teacher Interview: An interview was conducted with all participating teachers following the classroom observation and at the conclusion of the study. The purpose of the interview was to gather detailed information on teacher perceptions of the Pearson Interactive Science program and its various components (e.g. Labs, worktexts, etc.) and their use of the program in study classrooms – including frequency of component use, perceived strengths and weaknesses and any implementation barriers they encountered. Teachers were also asked about the organization and design of the program, ease of use, pacing and the extent to which the program helped their students’ understanding of science and overall engagement. Additionally teachers were asked about the technology that was available and the training they received as part of the study. Teacher Activity Logs: Teachers were asked to complete monthly online activity logs so instructional activities and content covered could be monitored. Teachers were asked to report the completed laboratory activities in a chapter, indicate the time in minutes to complete the lab activity and rate the lab activity on a scale of 1-5. Teachers also reported the frequency in which they used the various components of the Pearson Interactive Science program as well as the amount of homework and in class assignments that were assigned. Finally teachers were asked to report any supplemental materials they may have used.
Prepared by PRES Associates, Inc. – An Independent Evaluation Company 17
Sites and Sample Characteristics ABOUT THE SCHOOLS
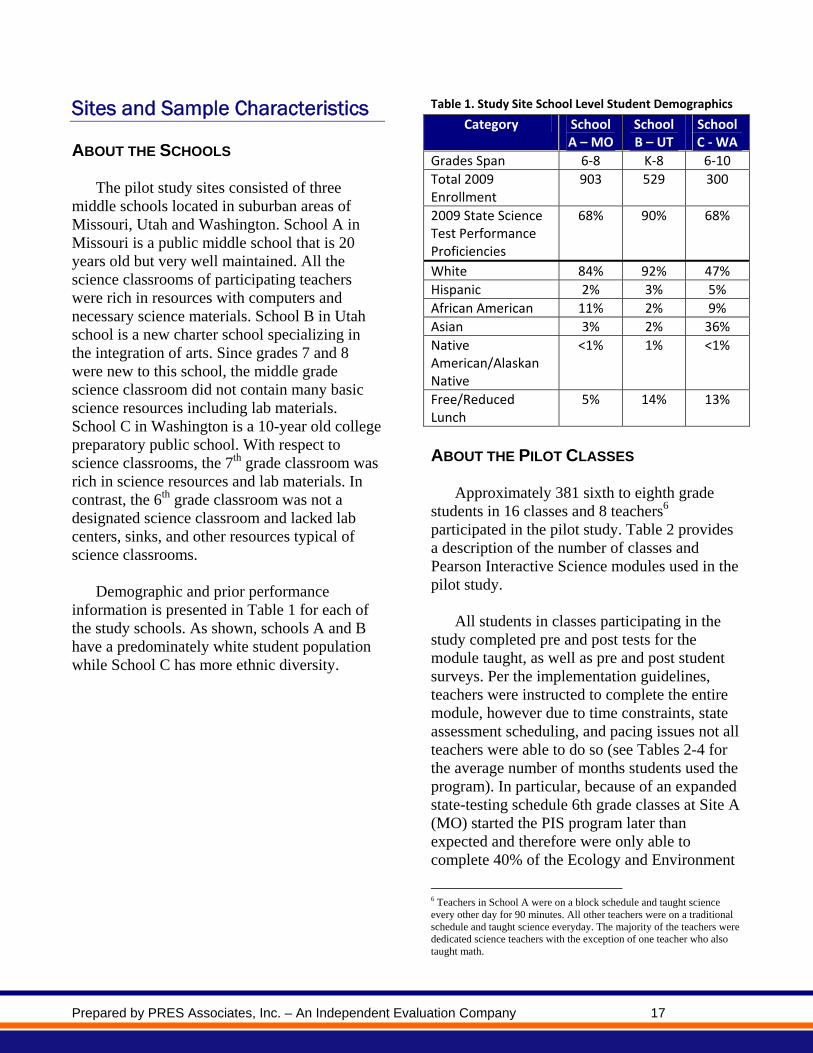
The pilot study sites consisted of three middle schools located in suburban areas of Missouri, Utah and Washington. School A in Missouri is a public middle school that is 20 years old but very well maintained. All the science classrooms of participating teachers were rich in resources with computers and necessary science materials. School B in Utah school is a new charter school specializing in the integration of arts. Since grades 7 and 8 were new to this school, the middle grade science classroom did not contain many basic science resources including lab materials. School C in Washington is a 10-year old college preparatory public school. With respect to science classrooms, the 7th grade classroom was rich in science resources and lab materials. In contrast, the 6th grade classroom was not a designated science classroom and lacked lab centers, sinks, and other resources typical of science classrooms.
Demographic and prior performance
information is presented in Table 1 for each of the study schools. As shown, schools A and B have a predominately white student population while School C has more ethnic diversity.
Table 1. Study Site School Level Student Demographics
ABOUT THE PILOT CLASSES
Approximately 381 sixth to eighth grade students in 16 classes and 8 teachers6 participated in the pilot study. Table 2 provides a description of the number of classes and Pearson Interactive Science modules used in the pilot study.
All students in classes participating in the
study completed pre and post tests for the module taught, as well as pre and post student surveys. Per the implementation guidelines, teachers were instructed to complete the entire module, however due to time constraints, state assessment scheduling, and pacing issues not all teachers were able to do so (see Tables 2-4 for the average number of months students used the program). In particular, because of an expanded state-testing schedule 6th grade classes at Site A (MO) started the PIS program later than expected and therefore were only able to complete 40% of the Ecology and Environment
6 Teachers in School A were on a block schedule and taught science every other day for 90 minutes. All other teachers were on a traditional schedule and taught science everyday. The majority of the teachers were dedicated science teachers with the exception of one teacher who also taught math.
Category School A – MO
School B – UT
School C ‐ WA
Grades Span 6‐8 K‐8 6‐10
Total 2009 Enrollment
903 529 300
2009 State Science Test Performance Proficiencies
68% 90% 68%
White 84% 92% 47%
Hispanic 2% 3% 5%
African American 11% 2% 9%
Asian 3% 2% 36%
Native American/Alaskan Native
<1% 1% <1%
Free/Reduced Lunch
5% 14% 13%

Prepared by PRES Associates, Inc. – An Independent Evaluation Company 18
module. Similarly, 8th grade teachers at Site A (MO) were forced to suspend regular teaching in the middle of the PIS program for required state assessment preparation and therefore were only able to complete 30% of the Forces and Energy module. Additionally, the 8th grade classes had previously covered some of the topics in the module and had planned in advance that they would not cover these topics again. The teacher at site B (UT) was required to cover specific topics in order to prepare for end of level tests and meet the adopted core requirements. As a result the UT teacher covered 70% of the Forces and Energy module. Teachers at Site C (WA) were able to complete 100% of the Ecology and Environment and Earth’s Structure modules in 6th and 7th grades, but stated that the last chapter was “rushed”. In addition, teachers stated that their pacing was slower than normal as they adjusted to the new program. Table 2. Number of Teachers and Study Classes that Used the Ecology and the Environment Module
Table 3. Number of Teachers and Study Classes that Used the Earth’s Structure Module
Table 4. Number of Teachers and Study Classes that Used the Forces and Energy Module
Prior to using the PIS program, teachers
used various curricula and science resources in their respective science classes. Table 5 shows a description of science programs used by the participating pilot teachers. Additional information on these programs is presented in Appendix C. Table 5. Regular Science Program used by Participating Pilot Teachers
School Regular Science Program
School A – MO 6th Grade
Prentice Hall Science Explorer, 2005 edition
School A – MO 8th Grade
Holt, Rinehart and Winston Science and Technology: Physical Science, 2007 edition
School B – UT 8th grade
Holt, Rinehart and Winston Science and Technology: Physical Science, 2007 edition
School C – WA 6th Grade
Prentice Hall Science Explorer, 2000 edition
School C – WA 7th Grade
Teacher created inquiry based science program
School (Number of
months module taught) Grade
# of teachers
# of classes
School A – MO (2 months)
6 3 5
School C – WA (4 months)
6 1 2
School (Number of
months module taught) Grade
# of teachers
# of classes
School C – WA (4 months)
7 1 2
School (Number of
months module taught) Grade
# of teachers
# of classes
School A – MO (2 months)
8 2 5
School B – WA (3 months)
8 1 2

Prepared by PRES Associates, Inc. – An Independent Evaluation Company 19
ABOUT THE PROGRAM
The philosophy behind the Pearson Interactive Science program is Understanding By Design (UbD), a lesson strategy that puts the big ideas of science into student-friendly big or essential questions about science. This backward design process begins with identifying the desired long term results prior to designing a program with activities, materials, or textbook content. Implementing the backwards design process takes place in three stages:
Stage 1: Identify desired results of instruction Stage 2: Determine acceptable evidence Stage 3: Plan learning experiences and instruction
In the UbD framework, the desired
accomplishments serves as the focal point for the planning of all curriculum, instruction, and assessment and helps avoid superficial coverage. The goal of this UbD frame work is that students achieve deep understanding of ideas-not just for "the test," but for life.
The chapters and lessons within the Interactive Science program are organized around the 5E’s: engage, explore, explain, extend and evaluate. The user utilizes the 5e’s to unlock the Big Question and facilitate Enduring Understanding, see figure below. The Big Question is designed to promote discussion, connect prior learning, foster a deeper understanding, promote inquiry and stimulate re-thinking.
Figure A. The 5 E’s in the Pearson Interactive Science Program
Explore
Unlock the Big ?
EnduringUnderstanding
Engage
Explain
Elaborate
Evaluate
The activities included in the program as they relate to the 5e’s are listed in the figure below.
Other unique aspects of the Pearson Interactive Science program includes, student self assessment as embedded in the Assess Your Understanding feature, the variety of interactivity as embedded in the Figure Activities, math review integration embedded in the Do the Math Activity, a large choice of lab activities, as well as the support of reading and vocabulary development.
Figure B. 5E’s Lesson Components Engage
ExtendExplain
ExploreEvaluate
•Chapter opener – The Big Question
•Untamed Science Video –addressing misconception
•Lesson Opener – Planet Diary
•Inquiry warm up in Teacher Lab Resource
•Quick Labs in Lab Resource
•Scenario Based Activities
•Reading and discussion of the lesson in student worktext
•Activities in worktext – apply it, “Do the Math” Keys to Understanding”
•Visuals in Worktext: active art, animation, simulation
•Open Inquiry labs in Teacher Lab Resource
•“More to Explore” in Open Inquiry Lab in Lab Resource
•Scenario Based Investigations
•Virtual Labs
•Assess Your Understanding
•Performance-Based Assessments
•End of Chapter Study Guide, Review and Assessments, State-SpecificTest Prep

Prepared by PRES Associates, Inc. – An Independent Evaluation Company 20
Results This section is organized by the key
questions from the Spring 2010 pilot study and reviews major findings first, followed by a more detailed presentation of results. Major Findings What preliminary relationships are observed between use of the Pearson Interactive Science 2011 program and key student and teacher outcomes?
Students showed significant growth from pre- to post-testing on the Earth Structure, Ecology and the Environment, and Forces and Energy custom assessments. Gains ranged from 8% to 19%. Students also showed significant growth on the Earth’s Structure and Ecology and the Environment tests across all the different types of test items: multiple choice, fill-in-the-blank and constructed response. However, mixed findings were obtained on the Forces and Energy test. Students who took the Forces and Energy test showed significant improvement on the multiple choice and fill-in-the-blank items, but showed no significant change on constructed response items. These findings are somewhat consistent with the findings of the Spring 2009 pilot study and may suggest that the content of this module is more challenging than the other modules used in the pilot study and that students experienced greater difficulties communicating and applying concepts related to Physical Science.
Performance on the TerraNova3, a national norm-referenced exam, was also examined. It should be noted that substantial gains were not expected since TerraNova3 assessment contains items across all content areas of science, many of which were not
covered within the modules used during the study. With this caveat in mind, results indicate that across all grades, students showed a marginally significant learning gain from pre to post testing, p<.10. In addition, while the percentile gain is small at .2%, it is noteworthy when one considers that it is a general rule of thumb that if a student makes a year’s growth for a year of instruction, then the percentile rank will remain the same. To more closely examine the relationship between TerraNova3 student science performance and the Pearson Interactive Science program, researchers also analyzed separately TerraNova3 questions that were more directly aligned to the specific science areas taught during the study. Results showed significant gains for life and earth science students. No significant gains were observed for physical science students.
Subgroup analysis by ability level showed that 6th graders of all ability levels demonstrated significant improvement on both the custom assessment and TerraNova3. Among 7th grade students, average and high ability students showed significant growth on the custom assessment and average level students showed significant growth on the TerraNova3. While 8th grade students who were of average and high ability showed significant improvement on the custom assessment, no significant differences were observed on the TerraNova3.
Self-reported learning outcomes were also examined during the pilot study. The majority of students reported that the Pearson Interactive Science worktext provided them with useful information to learn and understand science. In general, teachers also felt that the program helped students with their problem-solving and other higher order cognitive skills.

Prepared by PRES Associates, Inc. – An Independent Evaluation Company 21
With respect to student engagement and interest in science, students noted that the interactive aspects of their worktext along with the integrated lab activities helped engage them in the learning process. Teachers also reported a higher level of student engagement while using the Pearson Interactive Science program as compared to when they used their regular science program. Students self-reported only a slightly greater level of engagement.
All teachers and the vast majority of students felt that the Pearson Interactive Science program helped students make connections between science, real world applications, and other subject areas. They also felt that the program positively impacted their reading and writing skills as a result of the numerous opportunities for reading and writing offered within the worktext.
Overwhelmingly, teachers and students agreed that the Pearson Interactive Science student worktext prepared students to do well in state/national tests and future science courses.
Furthermore, teachers indicated that the PIS program was more helpful than their regular science program in providing good ideas for hands-on science activities, helping to teach science vocabulary, providing them with resources, and minimizing the preparation and planning time needed to prepare for lessons. Teachers also reported gains in their levels of preparedness to: a) deliver effective science instruction; b) make connections between science and other disciplines; c) help students communicate skills related to science; and d) develop student problem solving skills. Additionally, teachers were significantly more prepared to teach science through a hands-on instructional approach
and manage a class of students using hands-on or laboratory activities.
What do users of the Pearson Interactive Science 2011 program think about the program? What aspects of the program do they find most useful? Least useful? What, if any, suggestions for program improvement do they have?
The majority of teachers and students enjoyed using the Pearson Interactive Science program and would like to use the program during the following school year. Students and teachers felt the program was easy to understand, engaging and well-organized.
When asked to directly compare the Pearson Interactive Science program with their regular science program, teachers rated the PIS program more favorably. Students, however, rated both science programs similarly overall. However, when asked about specific components of curricula, students and teachers rated the overall presentation of the student worktext and ease of use as better than their regular program. Teachers also rated the Pearson Science Interactive program more favorably than their regular science program with respect to: 1) math activities, 2) format of the student book, 3) writing opportunities in the worktext, 4) how science is explained, 5) science labs, and 6) types of exercises and questions in the program.
In general, teachers commented that they thought that all pedagogical components of the Pearson Interactive Science program were useful. Teachers especially liked the Figures/Activity Art/Animations, “Do the Math”, Big Questions, “Apply It!”, and “Explore the Big Question.”

Prepared by PRES Associates, Inc. – An Independent Evaluation Company 22
With respect to the worktext specifically, the majority of students loved that they could write in their worktext, that they “owned” the book, and could keep all their notes in one place. They also liked the portability of the worktext. However, about 33% of students felt indifferent towards the worktext.
Teachers and students liked the labs and investigations they used from the Pearson Interactive Science program and felt the lab zones kept students interested in science class. When asked to rate each of the various types of labs, teachers rated the Inquiry Warm-Up Labs the most favorably followed by the Quick Labs and Lab Investigations.
How do teachers use the Pearson Interactive Science 2011 program in their classroom?
Participating teachers did well in following the implementation guidelines and Teacher’s Edition (TE). The only required activity that was not used as directed by the implementation guidelines was the My Planet Diary feature. In addition, while many teachers reported using supplemental activities, they were mostly digital resources, computer programs and teacher developed labs and worksheet.
When asked to compare their engagement in various instructional activities during the Fall semester (when they used their regular science program) versus the Spring semester (when they used the PIS program), both students and teachers reported that students answered textbook or worksheet questions, used mathematics as a tool with science problems, and explained in writing their answers to questions in science class more often while using the Pearson Interactive Science program as compared to when they used their regular science program. Teachers reported that they introduced new science
topics by exploring Big Questions and assigning a hands-on lab activity more often while using the Pearson Interactive Science program as compared to when they used their regular science program. In addition, teachers felt that they were better able to assess their students’ level of understanding during and after the lesson while using the PIS program.
For the most part, it was feasible for students to complete one Inquiry Warm Up and Quick Lab per lesson and one Lab Investigation per chapter. Teachers also reported that the lab time estimates were fairly accurate. However, similar to the 2009 pilot, some teachers noted that it did not include time for teacher preparation which could be considerable.
How should the Pearson Interactive Science 2011 program best be used in order to maximize its impact on student performance?
Based on the information gathered during the two pilot studies, it is recommended that teachers use the program as outlined in the 2010 pilot study implementation guidelines. As noted, it was feasible for students to complete one Inquiry Warm Up and Quick Lab per lesson and one Lab Investigation per chapter. In addition, most teachers were able to complete the required components of the program as outlined in the guidelines while maintaining a reasonable pace. Moreover, for the most part pilot teachers agreed that the key components noted in the guidelines were essential for student understanding. The only exceptions were use of the My Planet Diary, Assess Your Understanding and the Lab Investigations. Nevertheless, these components are considered critical by the authors as they engage, evaluate, and allow students to explore – all aspects of the research-based 5Es pedagogy.

Prepared by PRES Associates, Inc. – An Independent Evaluation Company 23
What type(s) of training and preparation is needed in order to promote effective implementation of the Pearson Interactive Science 2011 program? Are the built-in teacher resources useful to teachers in helping them prepare to effectively deliver science instruction in their classroom?
Teachers commented that there were sufficient resources to effectively implement the Pearson Interactive Science program. They also reported that they enjoyed the training and were adequately prepared to use the Pearson Interactive Science program. Their preparedness to use the program was also facilitated by how the program was designed and organized – teachers noted that it was easy to use, including the labs.
Recommendations for future trainings include: (1) develop and employ a training model to promote consistency in trainings; (2) begin with the program’s research base and philosophy as it would be helpful for teachers to fully understand the background related to why/how Pearson created this program to improve student science skills; (3) provide a general overview of all the teaching resources available as part of the Pearson Interactive Science program, where to find them and how to use them, including a modeling of the lesson; (4) schedule trainings approximately 1-2 weeks prior to implementation so that information conveyed is fresh in their minds; and (5) provide additional training on the digital path that will focus on detailed information on what is available and how to incorporate the technology into their activities.
Which types of assessments and outcome measures will be most sensitive to picking up the effects of the Pearson Interactive Science 2011 program? What is the reliability, validity and sensitivity of data collection instruments used during the pilot study?
On the custom assessments students did equally well on multiple choice and constructed response test items. Furthermore, they showed the greatest improvement on the fill-in-the-blank test items which for the most part focused on vocabulary words. This finding is consistent with the findings of the small-scale pilot conducted in Spring 2009 in which students showed the greatest improvement on the fill-in-the-blank test items. In addition, and as expected, the custom assessments were also more sensitive to the measurement of student growth than the TerraNova3. That said, the TerraNova3 is important to include in the RCT as it will provide normative data (e.g., percentile rankings) on student performance so that comparisons can be made to a national sample.
The custom tests used in the pilot study showed high levels of internal consistency (Chronbach’s alpha) and split half reliability, indicating they are psychometrically sound. Furthermore, the custom assessments were correlated with the TerraNova3 assessments to obtain information on the concurrent validity of the custom assessment. The obtained correlations are adequate and suggestive of concurrent validity.

Prepared by PRES Associates, Inc. – An Independent Evaluation Company 24
Detailed Findings WHAT PRELIMINARY RELATIONSHIPS ARE
OBSERVED BETWEEN USE OF THE
PEARSON INTERACTIVE SCIENCE 2011
PROGRAM AND KEY STUDENT AND
TEACHER OUTCOMES? Student Learning Outcomes
As a reminder, during the 2010 pilot study teachers used the program for a range of 2 months to 4 months with pre and post assessments administered at the beginning and end of their respective study participation. Of note is that while this is a more extensive use of the program as compared to the Spring 2009 pilot, this study also does not include a comparison group. Similar to the 2009 pilot, it was designed to obtain information on preliminary performance gains that may be associated with the program and does not allow for causal inferences to be made in regards to the effectiveness of the program. Although no conclusive findings about the effectiveness of the program can be drawn, analyses were performed to provide preliminary information on the relationship between the Pearson Interactive Science program and student learning outcomes.
Pre-post data from the custom assessments were analyzed via paired sample t-test to determine if students showed significant growth in their science performance. Results indicate that students showed significant growth from pre- to post-testing on all 3 custom assessments, see Figures 1-37. The greatest gains were observed on the Earth’s Structure test, followed by the Ecology and the Environment, and Forces and Energy test. These findings are similar to the Spring 2009 pilot in which significant growth was observed for the Earthquakes (Earth’s Structure) and Populations
7 Detailed statistical tables are presented in Appendix A.
& Communities (Ecology and the Environment) chapter tests. Figure 1. Student Performance on the Pearson
Interactive Science Assessment: Earth’s Structure
Earth's Structure Test*
62.4%
43.3%
20.0%
30.0%
40.0%
50.0%
60.0%
70.0%
80.0%
Pre Post
Per
cen
t C
orr
ect
Significant growth was observed for the
Earth’s Structure Custom Assessment, t(47)=14.153, p<.01, with a 19.1% average increase from pre- to post- test.
Figure 2. Student Performance on the Pearson Interactive Science Assessment: Ecology and the Environment
Ecology and the Environment Test*
57.8%
40.5%
20.0%
30.0%
40.0%
50.0%
60.0%
70.0%
80.0%
Pre Post
Per
cen
t C
orr
ect
Students using the Ecology and
Environment module showed significant growth, t(122)=12.092, p<.01, with an average increase of 17.3% from pre- to post- testing.
19.1% Gain
17.3% Gain

Prepared by PRES Associates, Inc. – An Independent Evaluation Company 25
Figure 3. Student Performance on the Pearson Interactive Science Assessment: Forces and Energy
Forces and Energy Test*
47.8%
39.9%
20.0%
30.0%
40.0%
50.0%
60.0%
70.0%
80.0%
Pre Post
Significant growth was observed for the Forces and Energy custom assessment, t(116)=8.835, p<.01, with an average gain of 7.9% from pre- to post- testing.
Students showed significant growth from pre- to post-testing on the Earth
Structure, Ecology and the Environment, and Forces and Energy
custom assessments.
In addition to examination of overall test
scores, researchers also conducted analyses on the different portions of the tests. That is, growth scores were calculated for the three types of items contained in the tests: a) multiple choice; b) constructed response; and c) fill-in-the-blank. The results are presented in Figures 4-6.
Figure 4. Student Performance on the Pearson Interactive Science Earth’s Structure Test by Type of Test Items
Earth's Structure Test
53.0%
12.9%
35.8%
69.3%
39.8%
59.2%
0.0%
10.0%
20.0%
30.0%
40.0%50.0%
60.0%
70.0%
80.0%
90.0%
100.0%
Mulitple Choice* ConstructedResponse*
Fill in the Blank*
Per
cen
t C
orr
ect
Pre Post
Students who took the Earth’s Structure Custom Assessment showed significant improvement as measured by multiple choice, t(47)=10.752, p<.01, fill-in-the-blank, t(47)=7.943, p<.01, and constructed response, t(47)=8.485, p<.01, test items.
Figure 5. Student Performance on the Pearson Interactive Science Ecology and the Environment Test by Type of Test Items
Ecology and the Environment Test
46.5%
18.2%
35.3%
60.3%
42.6%
64.8%
0.0%
10.0%
20.0%
30.0%
40.0%
50.0%
60.0%
70.0%
80.0%
90.0%
100.0%
Mulitple Choice* ConstructedResponse*
Fill in the Blank*
Per
cen
t C
orr
ect
Pre Post
Significant growth was observed for students who took the Ecology and Environment Custom Assessment as measured by multiple choice; t(122)=9.416,
p<.01, fill-in-the-blank, t(119)=9.504, p<.01, and constructed response; t(122)=10.308, p<.01, test items.
7.9% Gain
Prepared by PRES Associates, Inc. – An Independent Evaluation Company 26
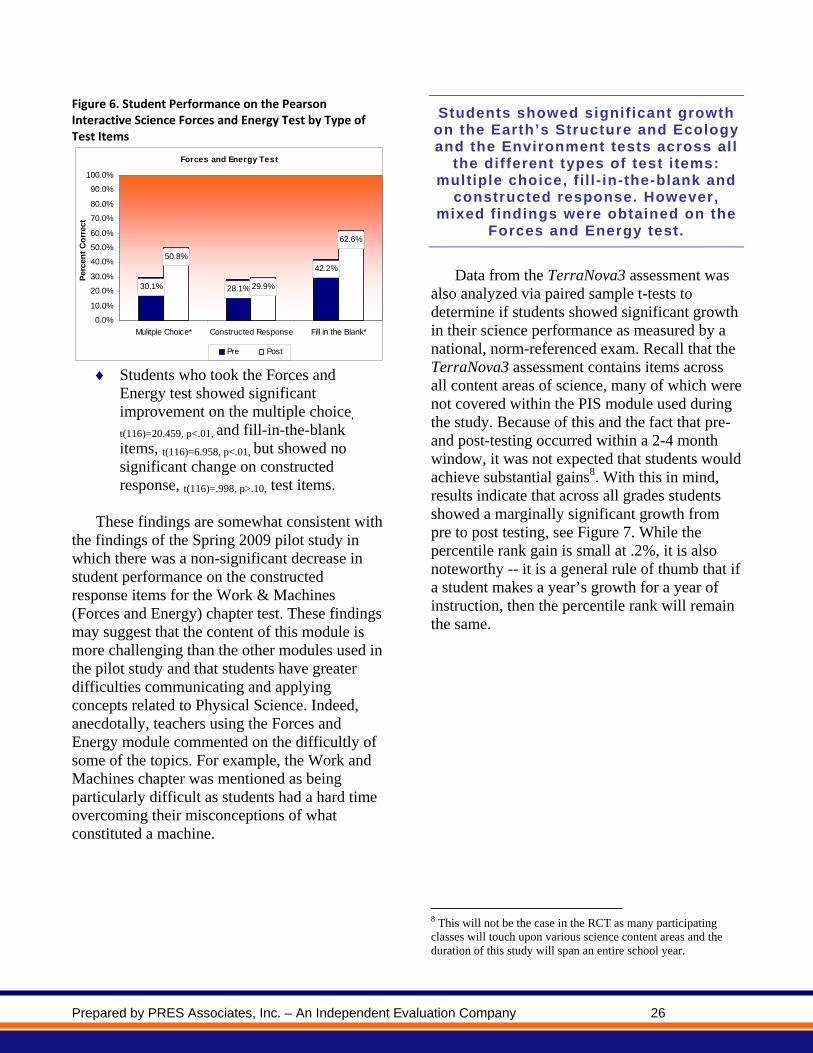
Figure 6. Student Performance on the Pearson Interactive Science Forces and Energy Test by Type of Test Items
Forces and Energy Test
28.1%
42.2%
50.8%
29.9%
62.6%
30.1%
0.0%
10.0%
20.0%
30.0%
40.0%
50.0%
60.0%
70.0%
80.0%
90.0%
100.0%
Mulitple Choice* Constructed Response Fill in the Blank*
Per
cen
t C
orr
ect
Pre Post
Students who took the Forces and Energy test showed significant improvement on the multiple choice,
t(116)=20.459, p<.01, and fill-in-the-blank items, t(116)=6.958, p<.01, but showed no significant change on constructed response, t(116)=.998, p>.10, test items.
These findings are somewhat consistent with
the findings of the Spring 2009 pilot study in which there was a non-significant decrease in student performance on the constructed response items for the Work & Machines (Forces and Energy) chapter test. These findings may suggest that the content of this module is more challenging than the other modules used in the pilot study and that students have greater difficulties communicating and applying concepts related to Physical Science. Indeed, anecdotally, teachers using the Forces and Energy module commented on the difficultly of some of the topics. For example, the Work and Machines chapter was mentioned as being particularly difficult as students had a hard time overcoming their misconceptions of what constituted a machine.
Students showed significant growth on the Earth’s Structure and Ecology and the Environment tests across all
the different types of test items: multiple choice, f i l l- in-the-blank and
constructed response. However, mixed findings were obtained on the
Forces and Energy test.
Data from the TerraNova3 assessment was
also analyzed via paired sample t-tests to determine if students showed significant growth in their science performance as measured by a national, norm-referenced exam. Recall that the TerraNova3 assessment contains items across all content areas of science, many of which were not covered within the PIS module used during the study. Because of this and the fact that pre-and post-testing occurred within a 2-4 month window, it was not expected that students would achieve substantial gains8. With this in mind, results indicate that across all grades students showed a marginally significant growth from pre to post testing, see Figure 7. While the percentile rank gain is small at .2%, it is also noteworthy -- it is a general rule of thumb that if a student makes a year’s growth for a year of instruction, then the percentile rank will remain the same.
8 This will not be the case in the RCT as many participating classes will touch upon various science content areas and the duration of this study will span an entire school year.
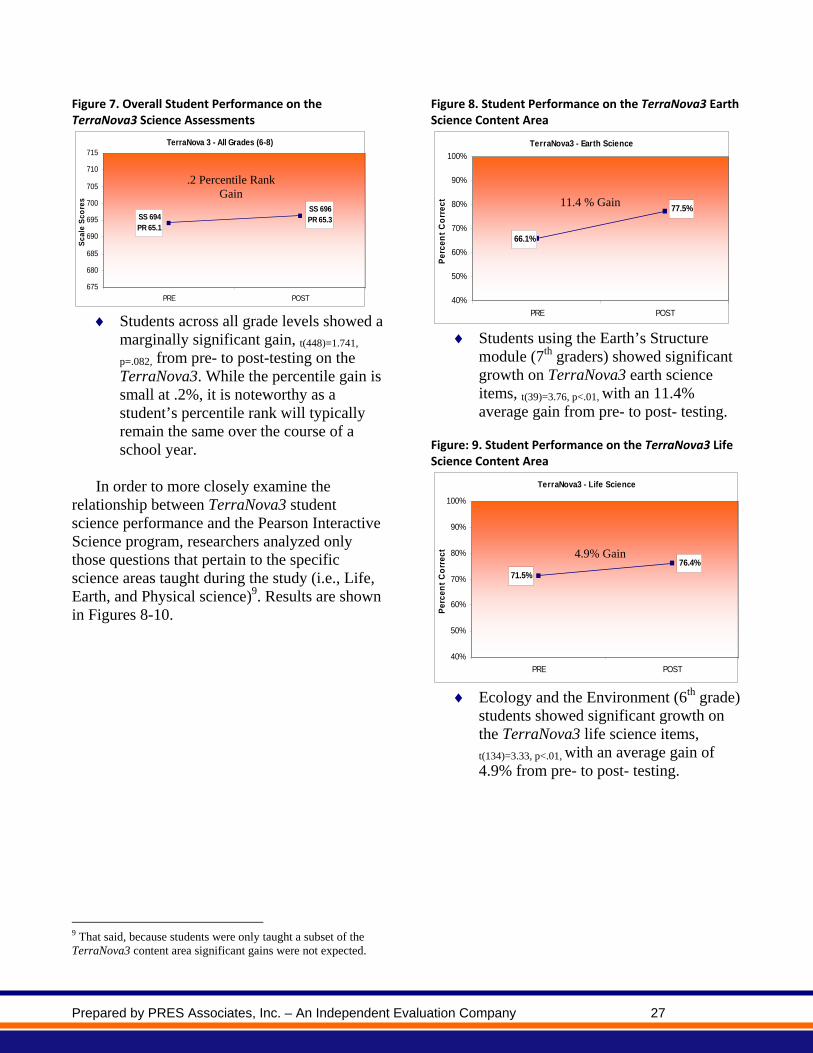
Prepared by PRES Associates, Inc. – An Independent Evaluation Company 27
Figure 7. Overall Student Performance on the TerraNova3 Science Assessments
TerraNova 3 - All Grades (6-8)
SS 694PR 65.1
SS 696PR 65.3
675
680
685
690
695
700
705
710
715
PRE POST
Sca
le S
core
s
Students across all grade levels showed a
marginally significant gain, t(448)=1.741,
p=.082, from pre- to post-testing on the TerraNova3. While the percentile gain is small at .2%, it is noteworthy as a student’s percentile rank will typically remain the same over the course of a school year.
In order to more closely examine the
relationship between TerraNova3 student science performance and the Pearson Interactive Science program, researchers analyzed only those questions that pertain to the specific science areas taught during the study (i.e., Life, Earth, and Physical science)9. Results are shown in Figures 8-10.
9 That said, because students were only taught a subset of the TerraNova3 content area significant gains were not expected.
Figure 8. Student Performance on the TerraNova3 Earth Science Content Area
TerraNova3 - Earth Science
77.5%
66.1%
40%
50%
60%
70%
80%
90%
100%
PRE POST
Per
cen
t C
orr
ect
Students using the Earth’s Structure
module (7th graders) showed significant growth on TerraNova3 earth science items, t(39)=3.76, p<.01, with an 11.4% average gain from pre- to post- testing.
Figure: 9. Student Performance on the TerraNova3 Life Science Content Area
TerraNova3 - Life Science
76.4%
71.5%
40%
50%
60%
70%
80%
90%
100%
PRE POST
Per
cen
t C
orr
ect
Ecology and the Environment (6th grade)
students showed significant growth on the TerraNova3 life science items, t(134)=3.33, p<.01, with an average gain of 4.9% from pre- to post- testing.
.2 Percentile Rank Gain
4.9% Gain
11.4 % Gain
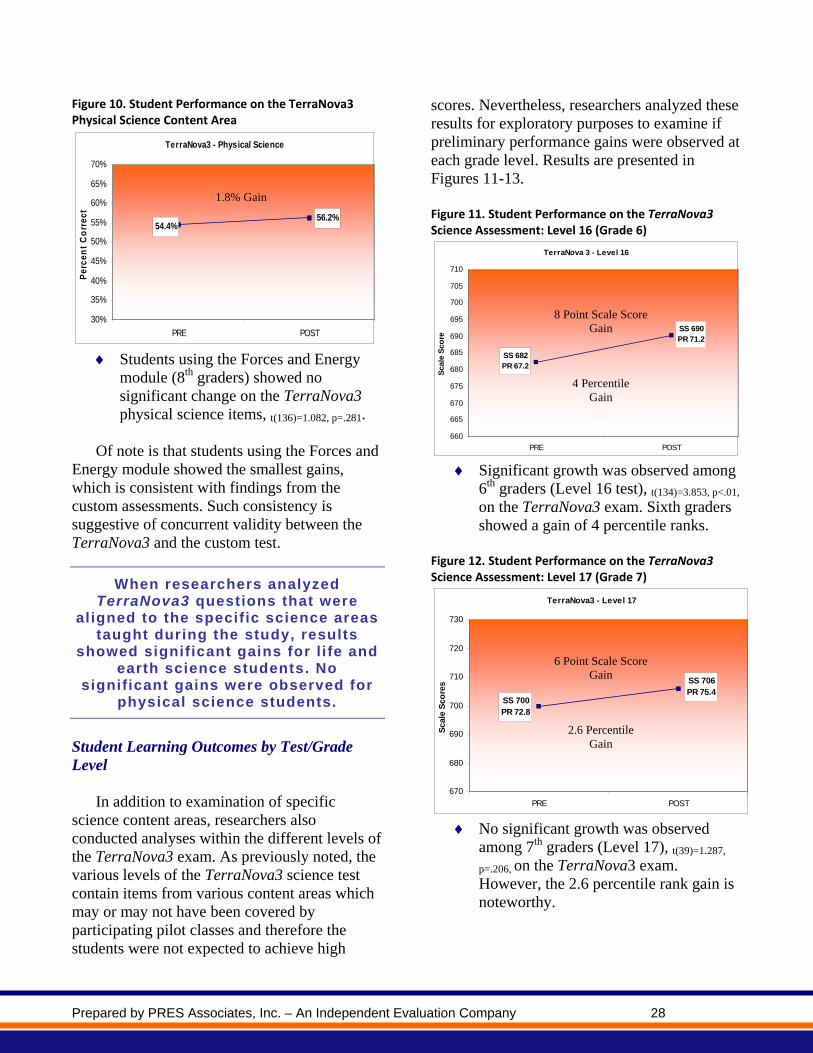
Prepared by PRES Associates, Inc. – An Independent Evaluation Company 28
Figure 10. Student Performance on the TerraNova3 Physical Science Content Area
TerraNova3 - Physical Science
56.2%54.4%
30%
35%
40%
45%
50%
55%
60%
65%
70%
PRE POST
Per
cen
t C
orr
ect
Students using the Forces and Energy
module (8th graders) showed no significant change on the TerraNova3 physical science items, t(136)=1.082, p=.281.
Of note is that students using the Forces and
Energy module showed the smallest gains, which is consistent with findings from the custom assessments. Such consistency is suggestive of concurrent validity between the TerraNova3 and the custom test.
When researchers analyzed TerraNova3 questions that were
aligned to the specific science areas taught during the study, results
showed significant gains for l ife and earth science students. No
significant gains were observed for physical science students.
Student Learning Outcomes by Test/Grade Level
In addition to examination of specific science content areas, researchers also conducted analyses within the different levels of the TerraNova3 exam. As previously noted, the various levels of the TerraNova3 science test contain items from various content areas which may or may not have been covered by participating pilot classes and therefore the students were not expected to achieve high
scores. Nevertheless, researchers analyzed these results for exploratory purposes to examine if preliminary performance gains were observed at each grade level. Results are presented in Figures 11-13. Figure 11. Student Performance on the TerraNova3 Science Assessment: Level 16 (Grade 6)
TerraNova 3 - Level 16
SS 690PR 71.2
SS 682PR 67.2
660
665
670
675
680
685
690
695
700
705
710
PRE POSTS
cale
Sco
re
Significant growth was observed among
6th graders (Level 16 test), t(134)=3.853, p<.01,
on the TerraNova3 exam. Sixth graders showed a gain of 4 percentile ranks.
Figure 12. Student Performance on the TerraNova3 Science Assessment: Level 17 (Grade 7)
TerraNova3 - Level 17
SS 706PR 75.4
SS 700PR 72.8
670
680
690
700
710
720
730
PRE POST
Sca
le S
core
s
No significant growth was observed
among 7th graders (Level 17), t(39)=1.287,
p=.206, on the TerraNova3 exam. However, the 2.6 percentile rank gain is noteworthy.
1.8% Gain
8 Point Scale Score Gain
4 Percentile Gain
6 Point Scale Score Gain
2.6 Percentile Gain

Prepared by PRES Associates, Inc. – An Independent Evaluation Company 29
Figure 13. Student Performance on the TerraNova3 Science Assessment: Level 18 (Grade 8)
TerraNova3 - Level 18
SS 698PR 61.0
SS 699PR 62.9
670
675
680
685
690
695
700
705
710
715
720
PRE POST
Sca
le S
core
No significant growth was observed for
8th graders (Level 18), t(136)=.654, p=.514, on the TerraNova3 exam from pre- to post- testing.
Exploratory analysis by grade level showed that 6t h grade students made
significant learning gains on the TerraNova3 . No significant gains were observed among 7t h and 8t h
grade students.
Student Learning Outcomes by Ability level
Data was also analyzed to examine if there was significant growth among students of various student ability levels (low, average, and high) as categorized by the TerraNova3 pre-test percentile ranks. In particular, students scoring at the bottom 33rd percentile were categorized as low-performing, students scoring between the 34th and 66th percentile were categorized as average, and those scoring above the 66th percentile were categorized as high-performing. Results showed that, generally, students of all ability levels improved in science performance as measured by the TerraNova3 and custom assessments, see Figures 14-18.
Figure 14. Student Performance on the TerraNova3, Science Assessment: Level 16 (Grade 6) by Ability Level
TerraNova3 - Level 16
SS 649PR 37
SS 701PR 84
SS 663PR 52
SS 627PR 21
SS 673PR 60
SS 705PR 84
580
600
620
640
660
680
700
720
Pre Post Pre Post Pre Post
Low Average High
Results showed that 6th grade students
significantly improved across all three ability levels on the TerraNova3 (Level 16) exam, t(17)low=2.080, p<.05; t(30)average=2.681,
p<.01; t(85)high=2.276, p<.05. Figure 15. Student Performance on the Pearson Interactive Science Assessment: Ecology and the Environment by Ability Level of 6th Graders
Ecology and the Environment Test
42.7%
54.4%
63.1%
46.9%
34.8%
29.9%
0%
10%
20%
30%
40%
50%
60%
70%
Pre Post Pre Post Pre Post
Low Average High Sixth grade students of all ability levels
also showed significant improvement on the custom Ecology and the Environment assessment, (t(13)low=3.874,
p<.01; t(23)average =6.146, p<.01; t(70)high=9.168, p<.01.
1 point Scale Score Decrease
1.9 Percentile Decrease

Prepared by PRES Associates, Inc. – An Independent Evaluation Company 30
Figure 16. Student Performance on the TerraNova3, Science Assessment: Level 17 (Grade 7) by Ability Level
TerraNova3 - Level 17
SS 694PR 69
SS 676PR 54
665
670
675
680
685
690
695
700
Pre PostAverage
Among 7th grade students, subgroup
analysis could only be conducted on average and high-level students as there were no low ability students within this grade level. Results showed that only the average level students significantly improved on the TerraNova3 exam, t(13)=5.001, p<.01.
Figure 17. Student Performance on the Pearson Interactive Science Assessment: Earth’s Structure by Ability Level of 7th Graders
Earth's Structure Test
57.1%
68.8%
46.7%40.2%
0%
10%
20%
30%
40%
50%
60%
70%
80%
Pre Post Pre Post
Average High
Both average and high level 7th grade students showed significant growth on the Earth’s Structure custom assessment, t(18)average=7.487, p<.01; t(23)high=12.439, p<.01.
Figure 18. Student Performance on the Pearson Interactive Science Assessment: Forces and Energy by Ability Level of 8th Graders
Forces & Energy Test
41.2%
57.9%
48.8%
33.9%
0%
10%
20%
30%
40%
50%
60%
70%
Pre Post Pre Post
Average High Eighth grade students of average and
high ability levels showed significant improvement on the custom Forces and Energy assessment, t(43)average=4.731, p<.01;
t(53)high=7.550, p<.01. However, on the TerraNova3 assessment, 8th grade students of all ability levels showed no significant growth, p>.05.
Generally, students of all ability levels showed improvement in
science performance as measured by the custom assessments and
TerraNova3 assessment.
Student Perceptions of Learning Outcomes
Results showing improvement on the custom assessment and TerraNova3 are also supported by information from the student surveys. As shown in Figure 19, the majority of students (77%) reported that the Pearson Interactive Science worktext provided them with useful information to learn and understand science. Furthermore a little over half of students (76%) also reported that they learned a lot in science class this Spring semester while using the new Pearson Interactive Science program. Students noted that learning was facilitated by the organization and interactive components of the program including the diagrams (82%) and lab activities (81%). In sum, students felt that the Pearson Interactive
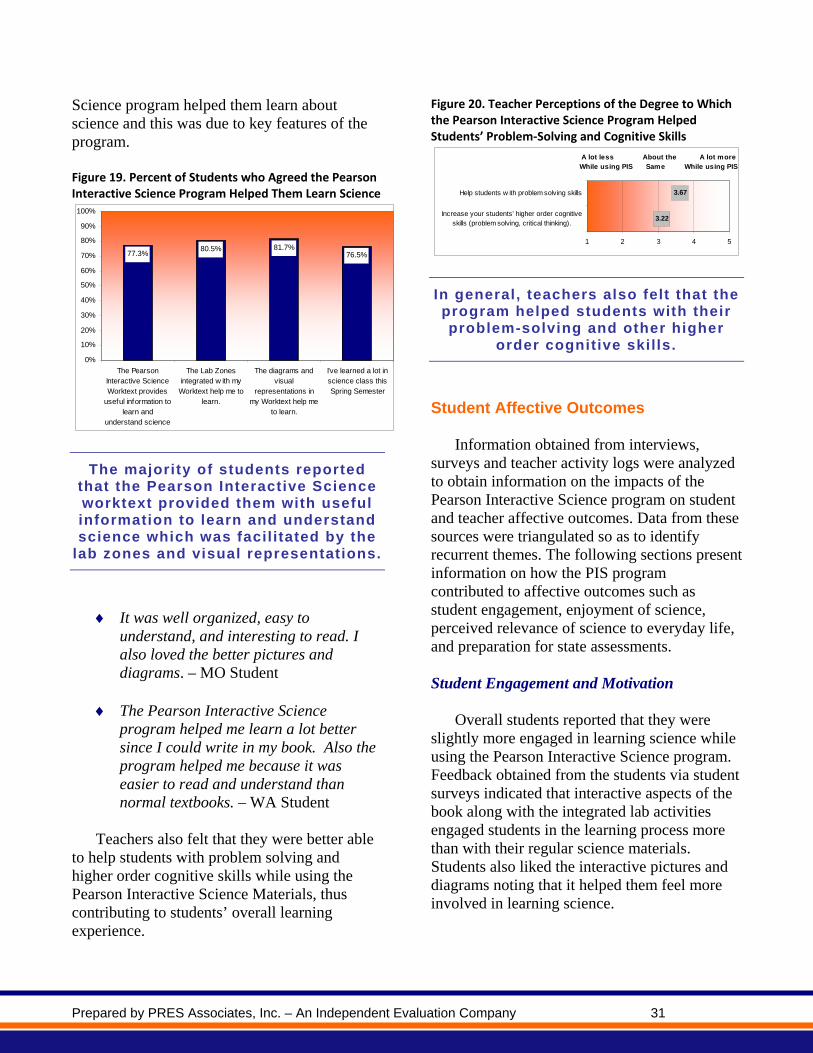
Prepared by PRES Associates, Inc. – An Independent Evaluation Company 31
Science program helped them learn about science and this was due to key features of the program. Figure 19. Percent of Students who Agreed the Pearson Interactive Science Program Helped Them Learn Science
77.3%80.5% 81.7%
76.5%
0%
10%
20%
30%
40%
50%
60%
70%
80%
90%
100%
The PearsonInteractive ScienceWorktext provides
useful information tolearn and
understand science
The Lab Zonesintegrated w ith myWorktext help me to
learn.
The diagrams andvisual
representations inmy Worktext help me
to learn.
I've learned a lot inscience class thisSpring Semester
The majority of students reported that the Pearson Interactive Science worktext provided them with useful information to learn and understand science which was facil itated by the
lab zones and visual representations.
It was well organized, easy to understand, and interesting to read. I also loved the better pictures and diagrams. – MO Student
The Pearson Interactive Science
program helped me learn a lot better since I could write in my book. Also the program helped me because it was easier to read and understand than normal textbooks. – WA Student
Teachers also felt that they were better able
to help students with problem solving and higher order cognitive skills while using the Pearson Interactive Science Materials, thus contributing to students’ overall learning experience.
Figure 20. Teacher Perceptions of the Degree to Which the Pearson Interactive Science Program Helped Students’ Problem‐Solving and Cognitive Skills
A lot less About the A lot moreWhile using PIS Same While using PIS
3.22
3.67
1 2 3 4 5
Increase your students' higher order cognitiveskills (problem solving, critical thinking).
Help students w ith problem solving skills
In general, teachers also felt that the program helped students with their problem-solving and other higher
order cognitive skills.
Student Affective Outcomes
Information obtained from interviews, surveys and teacher activity logs were analyzed to obtain information on the impacts of the Pearson Interactive Science program on student and teacher affective outcomes. Data from these sources were triangulated so as to identify recurrent themes. The following sections present information on how the PIS program contributed to affective outcomes such as student engagement, enjoyment of science, perceived relevance of science to everyday life, and preparation for state assessments. Student Engagement and Motivation
Overall students reported that they were slightly more engaged in learning science while using the Pearson Interactive Science program. Feedback obtained from the students via student surveys indicated that interactive aspects of the book along with the integrated lab activities engaged students in the learning process more than with their regular science materials. Students also liked the interactive pictures and diagrams noting that it helped them feel more involved in learning science.

Prepared by PRES Associates, Inc. – An Independent Evaluation Company 32
Pearson Interactive Science helped me learn better because it gave me more visuals and experiments. These help me because I think I can learn things better if I see a visual – MO Student
This helped me learn better because it
was more interactive and the labs got me connected with the science lesson. – WA Student
It wasn't boring and I looked forward to
science class every day – WA Student
The Pearson Interactive Science materials helped me learn a lot about the topic we were learning that day. On our last science book there was never any tool or materials to experiment with. I really enjoyed the new program. – WA Student
Students noted that the interactive aspects of their book along with the
integrated lab activities helped engage them in the learning process.
As shown in Figure 21, when students were
asked to compare their experiences while using the Pearson Interactive Science program to when they used their other science program, they reported they were slightly more engaged in science while using the Pearson Interactive Science program as compared to their regular science program (see blue bars). Most teachers also reported that they felt their students were more engaged while using the Pearson Interactive Science program as compared to their regular science program (see gray bars in Figure 21). Teachers noted that students paid attention more to science lectures and were more engaged in the worktext. Teachers also noted that the kids seemed far more engaged with regard to the interactive diagrams within the worktext. That said, the 8th grade physical science teachers at School A commented that
while they felt the students learned from the Pearson Interactive Science worktext, they were not as engaged. This may be due to the more challenging content of the Forces and Energy module as both students and teachers noted that they had difficulty with some of the topics. Figure 21. Teacher and Student perceptions of the Degree to Which They Were Engaged in Science While Using Pearson Interactive Science Relative to their Regular Science Program.
A Lot About A Lot Less the Same More
3.05
2.85
3.11
3.01
3.10
3.67
3.56
3.44
3.44
3.89
2.97
The program engaged students in learning aboutscience. (Teacher)
The program increased students' interest inscience. (Teacher)
The program influenced students to formulatequestions about science content. (Teacher)
The program interested students in conductinghands-on activities or lab work. (Teacher)
The content present in the Worktext keepsstudents interested in science class.
Students paid attention when the teacher gavescience lectures (Students)
Students were interested in what was learned inscience class (Students)
Students felt more invo lved in learning aboutscience (Students)
Science materials kept students interested duringscience class (Students)
Students looked forward to science class(Students)
Students (Blue) Teachers (Gray)
Teachers reported a higher level of student engagement while using the Pearson Interactive Science program as compared to when they used their
regular science program. Students self-reported only a slightly greater
level of engagement.
Students were more engaged using the
program as compared to the beginning of the year. I did have good reading engagement with good discussion on the diagrams. – WA Teacher
Engagement is better. Also,
incorporation of illustration and art is

Prepared by PRES Associates, Inc. – An Independent Evaluation Company 33
providing them with a more enriched experience analyzing graphs. – MO Teacher
I just felt like they really listened more
than I usual, although kids always enjoy science. – WA Teacher
When asked about interest and enjoyment of
science while using the Pearson Interactive Science program, 62% of students and 78% of teachers agreed that students enjoyed reading the science worktext to learn. Over 70% of students and teachers also agreed that the activities from the program were fun and interesting. Students and teachers also noted that students looked forward to science while using the PIS program and took pride in their science work while using this program, see Figure 22. In particular, both students and teachers indicated that the ability to write in the worktext provides students with a sense of ownership of their book and thereby students took more pride in their science work while using the Pearson Interactive Science program. Figure 22. Percent of Teachers and Students Who Agreed that the Pearson Interactive Science Program Affected Student Interest in Science
62.3%
71.6%
63.3%59.6%
79.4%77.8% 77.8% 77.8% 77.8%
55.6%
0%
10%
20%
30%
40%
50%
60%
70%
80%
90%
100%
Students enjoyreading the
sciencew orktext to
learn
The scienceactivities from
the program arefun and
interesting
Students lookedforw ard to
science classw hile using the
PearsonInteractiveScienceprogram
Students stayinterested w hen
answ eringquestions or
problemspresented in the
Sciencew orktext
My studentstook pride intheir science
w ork
Students Teachers
The abil ity to write in the worktext provides students with a sense of
ownership of their book. This promoted a sense of pride in their
science work while using the Pearson Interactive Science program.
In awe that it [the worktext] is theirs,
they get excited to take home, love the ownership. They want their book to be good and accurate and it focuses them more on trying harder. – MO Teacher
It should be noted that while the vast
majority of teachers and students appreciated the writing and drawing opportunities within the student worktext and agreed that this was engaging for students, some also noted that this could be distracting as some students would “doodle” in their worktexts instead of working on the science assignments.
I got a little distracted by being able to write in it. – MO Student
I had several students who would prefer
to "doodle" or draw in the workbooks rather than highlight important passages or complete written sections. – MO Teacher
Perceived Relevance of Science
Overwhelmingly, 100% of teachers felt that the Pearson Interactive Science program increased students’ understanding about the relevance of science to everyday life and stated that the program helped them make connections to real-world and other subject areas, see Figure 23. Students also reported that the Pearson Interactive Science worktext helped them to see connections between science and real world applications (77%) and helped them see connections between science and other subject areas (74%). In addition, all teachers (100%) reported that the Pearson Interactive Science

Prepared by PRES Associates, Inc. – An Independent Evaluation Company 34
helped in the development of reading/writing skills relevant to science. In particular, teachers commented that the numerous writing opportunities in which students are asked to explain their understanding positively impacted these skill areas. Figure 23. Percent of Teachers and Students Who Agreed the Pearson Interactive Science Program Helped Students with Science Connections and Applications
77.0%73.7% 71.8%
100.0% 100.0% 100.0%
0%
10%
20%
30%
40%
50%
60%
70%
80%
90%
100%
Help make connectionsbetw een science content
and real-w orld applications
Help make connectionsbetw een science and other
subject areas
Help developreading/w riting skillsrelevant to science
Students Teachers
All teachers and the vast majority of students felt that the Pearson
Interactive Science program helped students make connections between science, real world applications, and
other subject areas. They also felt that the program positively impacted their reading and writing skills as a
result of the numerous opportunities for reading and writing offered within
the worktext.
I liked it more because it related science
to the real world. Also, I liked the fact that we could write in our books. Last, it had fun activities and cool articles too. – WA Student
Overall I think the program would increase student awareness in applying science in their everyday lives. – WA teacher
Preparation for State Assessments
The majority of teachers and students agreed that the Pearson Interactive Science program helped prepare students to perform well on future science tests as well as state/national test, see Figure 24. Furthermore, 82% of students and 89% of teachers reported that the Pearson Interactive Science worktext prepared them to do well in future science courses. Figure 24. Percent of Teachers and Students Who Agreed the Pearson Interactive Science Program Helped Students on Tests and Future Science Classes
76.9%73.2%
82.5%
100.0%
88.9% 88.9%
0%
10%
20%
30%
40%
50%
60%
70%
80%
90%
100%
The science w orktexthelps prepare to do w ell
on science tests
The science w orktexthelps prepare to do w ellon state/national tests
The science w orktextprepares to do w ell in
future science courses
Students Teachers
Overwhelmingly, teachers and students agreed that the Pearson
Interactive Science student worktext prepared students to do well in state/national tests and future
science courses.

Prepared by PRES Associates, Inc. – An Independent Evaluation Company 35
Teacher Knowledge and Preparedness
When analyzing teacher specific outcomes such as knowledge of science and preparedness to deliver effective science instruction, results from teacher surveys indicated that the Pearson Interactive Science program was associated with positive changes. For instance, as shown in Figure 25, the majority of teachers felt that the Pearson Interactive Science program provided them with useful information to effectively teach science (89%). Indeed, teachers commented that the program was rich in resources and that it was seamless to implement—this ease of use and the ability to draw upon various resources helped make their instruction more effective.
Figure 25. Percent of Teachers Who Agreed the Pearson Interactive Science Program Provided Useful Information to Effectively Teach Science
88.9%
0%
10%
20%
30%
40%
50%
60%
70%
80%
90%
100%
The Pearson Interactive Science program provided me w ithuseful information to effectively teach science.
The majority of teachers agreed that that the Pearson Interactive Science program provided them with useful
information to effectively teach science.
I really like the Pearson Interactive
Science lessons along with the text and labs. I felt like as a beginner to this subject area it explained things clearly for me to understand and teach it. – UT Teacher
The TE is great because it gives you a
little extra to prepare you when you aren’t as comfortable with the content – MO Teacher
I feel like I did a better job or that these
kids learned the main points a little better.– WA Teacher
Furthermore teachers indicated that the
Pearson Interactive Science program was more helpful than their regular science program in providing good ideas for hands-on science activities, helping to teach science vocabulary, providing them with resources, and minimizing the preparation and planning time needed to prepare for lessons, see Figure 26. It is also interesting to note that on other areas measured (e.g., helping with the assessment of student knowledge, pacing of lessons, understanding of science material, etc.), results showed that teacher ratings of the helpfulness of the program are skewed in favor of the PIS program—that is, in general teachers felt that PIS program was more helpful in their instruction than their regular science program. Figure 26. Teacher Perceptions of the Degree to Which the Pearson Interactive Science Program Helped Them With Their Science Instruction Relative to Their Regular Science Program
Regular Science About the PIS helpedProgram Helped More Same More
3.2
3.3
3.4
3.4
3.4
3.8
4.0
4.0
4.2
3.1Help you assess student understanding of material
after the lesson
Increase your interest in important science topics.
Help you assess student understanding of materialduring the lesson
Increase your know ledge of science concepts andtopics.
Provide an adequate pace for coverage of material
Teach science effectively to your students
Help you teach science vocabulary
Minimize preparation and planning time
Provide you w ith good ideas for hands-on scienceactivities
Provide you w ith suff icient resources to teach lessons
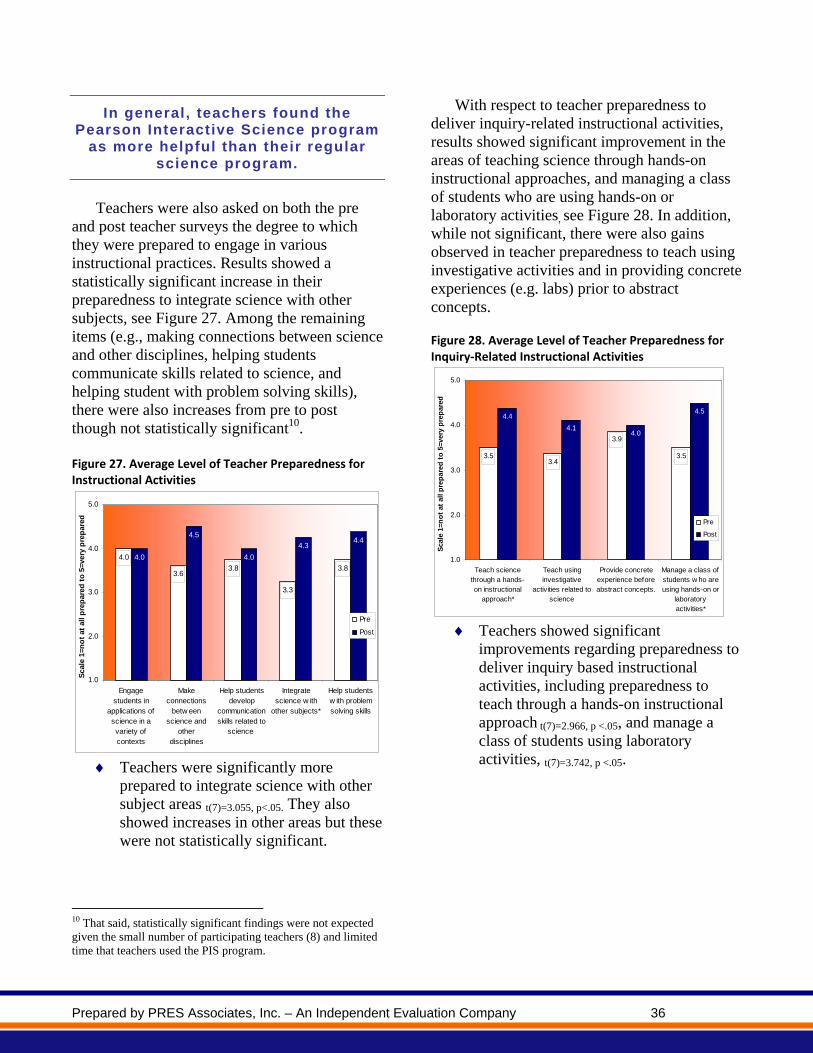
Prepared by PRES Associates, Inc. – An Independent Evaluation Company 36
In general, teachers found the Pearson Interactive Science program
as more helpful than their regular science program.
Teachers were also asked on both the pre
and post teacher surveys the degree to which they were prepared to engage in various instructional practices. Results showed a statistically significant increase in their preparedness to integrate science with other subjects, see Figure 27. Among the remaining items (e.g., making connections between science and other disciplines, helping students communicate skills related to science, and helping student with problem solving skills), there were also increases from pre to post though not statistically significant10.
Figure 27. Average Level of Teacher Preparedness for Instructional Activities
4.0
3.63.8
3.3
3.8
4.0
4.5
4.0
4.34.4
1.0
2.0
3.0
4.0
5.0
Engagestudents in
applications ofscience in avariety ofcontexts
Makeconnections
betw eenscience and
otherdisciplines
Help studentsdevelop
communicationskills related to
science
Integratescience w ith
other subjects*
Help studentsw ith problemsolving skills
Sca
le 1
=no
t at
all
pre
par
ed t
o 5
=ver
y p
rep
ared
Pre
Post
Teachers were significantly more
prepared to integrate science with other subject areas t(7)=3.055, p<.05. They also showed increases in other areas but these were not statistically significant.
10 That said, statistically significant findings were not expected given the small number of participating teachers (8) and limited time that teachers used the PIS program.
With respect to teacher preparedness to deliver inquiry-related instructional activities, results showed significant improvement in the areas of teaching science through hands-on instructional approaches, and managing a class of students who are using hands-on or laboratory activities, see Figure 28. In addition, while not significant, there were also gains observed in teacher preparedness to teach using investigative activities and in providing concrete experiences (e.g. labs) prior to abstract concepts. Figure 28. Average Level of Teacher Preparedness for Inquiry‐Related Instructional Activities
3.53.4
3.9
3.5
4.4
4.14.0
4.5
1.0
2.0
3.0
4.0
5.0
Teach sciencethrough a hands-on instructional
approach*
Teach usinginvestigative
activities related toscience
Provide concreteexperience beforeabstract concepts.
Manage a class ofstudents w ho areusing hands-on or
laboratoryactivities*
Sca
le 1
=no
t at
all
pre
par
ed t
o 5
=ver
y p
rep
ared
Pre
Post
Teachers showed significant
improvements regarding preparedness to deliver inquiry based instructional activities, including preparedness to teach through a hands-on instructional approach t(7)=2.966, p <.05, and manage a class of students using laboratory activities, t(7)=3.742, p <.05.

Prepared by PRES Associates, Inc. – An Independent Evaluation Company 37
Teachers reported gains in their levels of preparedness to deliver
effective science instruction, make connections between science and
other disciplines, helping students communicate skills related to
science, and helping student with problem solving skills. Additionally,
teachers were significantly more prepared to teach science through a hands-on instructional approach and
manage a class of students using hands-on or laboratory activities.
Teachers also reported that the Pearson
Interactive Science program provided them with assistance to provide differentiated instruction to students at all levels (low, average and advanced) – however, when asked to rate the level of assistance relative to their regular science program, teachers noted that it was about the same, see Figure 29. All teachers noted that they provide differentiated instruction to higher performing students by supplementing them with enrichment activities. With students of below average ability, responses were mixed. Some teachers felt that they had ample resources available within the program to assist these students whereas others noted that they did not find useful instructional activities within the book and more often referred students to remediation activities they had developed over years of teaching. It should be noted that in the upcoming 2010-2011 RCT, the digital path materials will contain three different Lexile versions of the text that teachers can assign to students depending on their reading level. This resource was not available to pilot teachers.
Figure 29. Teacher Perceptions of the Degree to which the Pearson Interactive Science Program Helped with Individualizing Instruction Relative to Other Science Programs
Regular Science About the PIS HelpedHelped More Same More
3.3
3.2
3.1Help provide differentiatedinstruction to students of
above-average ability
Help provide differentiatedinstruction to students of
below-average ability
Help provide differentiatedinstruction to students of
average ability
In general, teachers felt that the Pearson Interactive Science program
provided them with assistance to provide differentiated instruction to students at various levels. However, some teachers also commented that the resources used during the pilot study were sometimes not adequate in meeting the needs of their lower
level students.
This textbook is useful for all readiness
levels. – MO Teacher
The graphics and pictures within the program are useful in simplifying the text for lower leveled readers. – WA Teacher
Once they get all the internet stuff
worked out it will be easier to adapt for somebody like you could give them an alternate thing to read. I didn’t find it any more adaptable than any other book. – WA Teacher
I like the options for the lower
functioning students as well as the higher functioning students [Differentiated Instruction]. It is nice to challenge them rather than let them be bored with what they already know.—UT Teacher

Prepared by PRES Associates, Inc. – An Independent Evaluation Company 38
Varying ability level students either thought it was too simple or too difficult but as the teacher I could help make the appropriate accommodations for success. – WA Teacher
One thing I wished I would have seen is
in the Response to Intervention section. If there was a student who needed more information or a different explanation I wish the book would have provided that. Just referring back to the text to read it again is not super helpful. If they didn't get it the first time in that format, it is likely they won't understand it just because they read it again. – UT Teacher
WHAT DO USERS OF THE PEARSON
INTERACTIVE SCIENCE 2011 PROGRAM
THINK ABOUT THE PROGRAM? WHAT
ASPECTS OF THE PROGRAM DO THEY FIND
MOST USEFUL? LEAST USEFUL? WHAT, IF
ANY, SUGGESTIONS FOR PROGRAM
IMPROVEMENT DO THEY HAVE?
Feedback from teachers and students indicated that in general, they liked the Pearson Interactive Science program. As shown in Figure 30, the majority of pilot teachers enjoyed using the Pearson Interactive Science program (89%) and agreed that they would like to use the program next year (89%). Similarly, the majority of students (67%) agreed that they liked the Pearson Interactive Science program and would like to use the program next school year (68%). Figure 30. Percent of Teachers and Students Who Liked the Pearson Interactive Science Program
67.6% 66.9%
88.9% 88.9%
0%
10%
20%
30%
40%
50%
60%
70%
80%
90%
100%
I w ould like to use the PearsonInteractive Science programduring the upcoming school
year.
Overall, I liked the PearsonInteractive Science materials w e
have been using.
Student Teacher
The majority of teachers and students enjoyed using the Pearson
Interactive Science program and would l ike to use the program during
the following school year.
Overall, they felt that the program was easy
to understand, engaging and well-organized.

Prepared by PRES Associates, Inc. – An Independent Evaluation Company 39
Many students also commented that they liked the portability of the program as the book was small and therefore, less intimidating. Other student comments included that the book was fun, interactive and helped them to learn science better. Teachers also commented that the program was very easy to use and would be especially helpful for new teachers.
The worktext was more fun than our other textbook because we could write in the books and there was less to carry. I liked PIS worktext better because it was more interactive. – WA Student
At the beginning they were feeling
excited about it, they liked the idea of writing in a textbook, they liked the idea of having a smaller textbook. If it’s really big it’s daunting, but if its small that’s not as daunting to them and they feel that’s more acceptable. – WA Teacher
I really like the Pearson Interactive
Science lessons along with the text and labs. I felt like as a beginner to this subject area it explained things clearly for me to understand and teach it. – UT Teacher
Students and teachers felt the program was easy to understand,
engaging and well-organized.
Teachers were asked to directly compare the
Pearson Interactive Science program to the other science program used regularly throughout the year. As shown in Figure 31, teachers rated the overall Pearson Interactive Science program as being better than their regular science program (i.e., average rating is above the midpoint). In contrast, when students were asked to directly compare the Pearson Interactive Science program to their regular science program,
students rated the programs as being about the same (i.e., average rating is at the midpoint). Figure 31. Teacher and Student Ratings of Preference for Pearson Interactive Science Program vs. Regular Science Program
Pearson Interactive Science Program
is much better
3.1
3.8
1.0 2.0 3.0 4.0 5.0
Regular ScienceProgram is much
better
Students (Blue) Teachers (Gray)
When asked to directly compare the Pearson Interactive Science program with their regular science program,
teachers rated the PIS program more favorably. Students, however, rated
both science programs similarly.
Students were also asked to rate the Pearson
Interactive Science program according to specific adjectives. Specifically, students were asked to rate the program on a scale from interesting to boring, easy to difficult, useful to useless, fun to not fun, and good to bad. Figure 32 shows the results of these ratings. In general, students rated the program as being somewhat easy, useful, and good, and about average in terms of being interesting and fun. Figure 32. Average Descriptive Ratings by Students on the Pearson Interactive Science Program
4.02
4.09
4.47
4.64
4.65
1.00 4.00 7.00
Bad
Not Fun
Useless
Diff icult
Boring Interesting
Easy
Useful
Fun
Good
Students rated the program as somewhat easy, useful, and good. In addition, they felt the program was
only slightly interesting and fun.
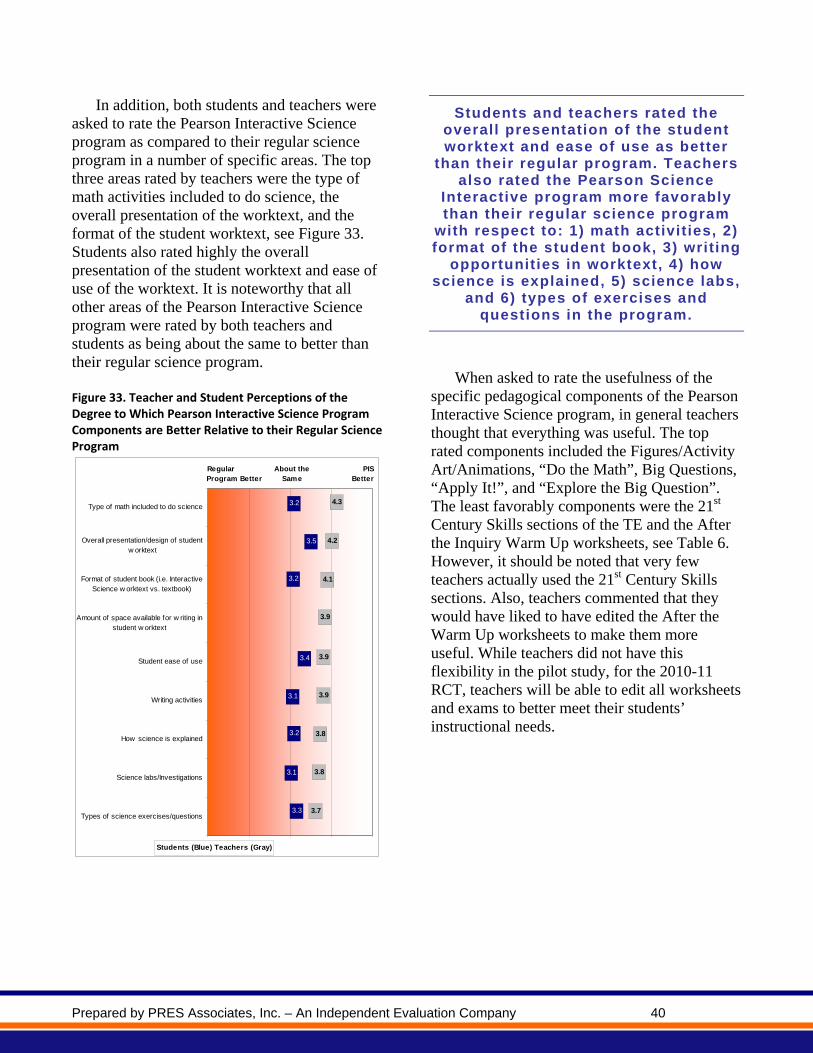
Prepared by PRES Associates, Inc. – An Independent Evaluation Company 40
In addition, both students and teachers were asked to rate the Pearson Interactive Science program as compared to their regular science program in a number of specific areas. The top three areas rated by teachers were the type of math activities included to do science, the overall presentation of the worktext, and the format of the student worktext, see Figure 33. Students also rated highly the overall presentation of the student worktext and ease of use of the worktext. It is noteworthy that all other areas of the Pearson Interactive Science program were rated by both teachers and students as being about the same to better than their regular science program. Figure 33. Teacher and Student Perceptions of the Degree to Which Pearson Interactive Science Program Components are Better Relative to their Regular Science Program
Regular About the PISProgram Better Same Better
4.1
4.2
4.3
3.3
3.1
3.2
3.1
3.4
3.2
3.5
3.2
3.8
3.8
3.9
3.9
3.9
3.7Types of science exercises/questions
Science labs/Investigations
How science is explained
Writing activities
Student ease of use
Amount of space available for w riting instudent w orktext
Format of student book (i.e. InteractiveScience w orktext vs. textbook)
Overall presentation/design of studentw orktext
Type of math included to do science
Students (Blue) Teachers (Gray)
Students and teachers rated the overall presentation of the student worktext and ease of use as better
than their regular program. Teachers also rated the Pearson Science
Interactive program more favorably than their regular science program
with respect to: 1) math activities, 2) format of the student book, 3) writing
opportunities in worktext, 4) how science is explained, 5) science labs,
and 6) types of exercises and questions in the program.
When asked to rate the usefulness of the specific pedagogical components of the Pearson Interactive Science program, in general teachers thought that everything was useful. The top rated components included the Figures/Activity Art/Animations, “Do the Math”, Big Questions, “Apply It!”, and “Explore the Big Question”. The least favorably components were the 21st Century Skills sections of the TE and the After the Inquiry Warm Up worksheets, see Table 6. However, it should be noted that very few teachers actually used the 21st Century Skills sections. Also, teachers commented that they would have liked to have edited the After the Warm Up worksheets to make them more useful. While teachers did not have this flexibility in the pilot study, for the 2010-11 RCT, teachers will be able to edit all worksheets and exams to better meet their students’ instructional needs.
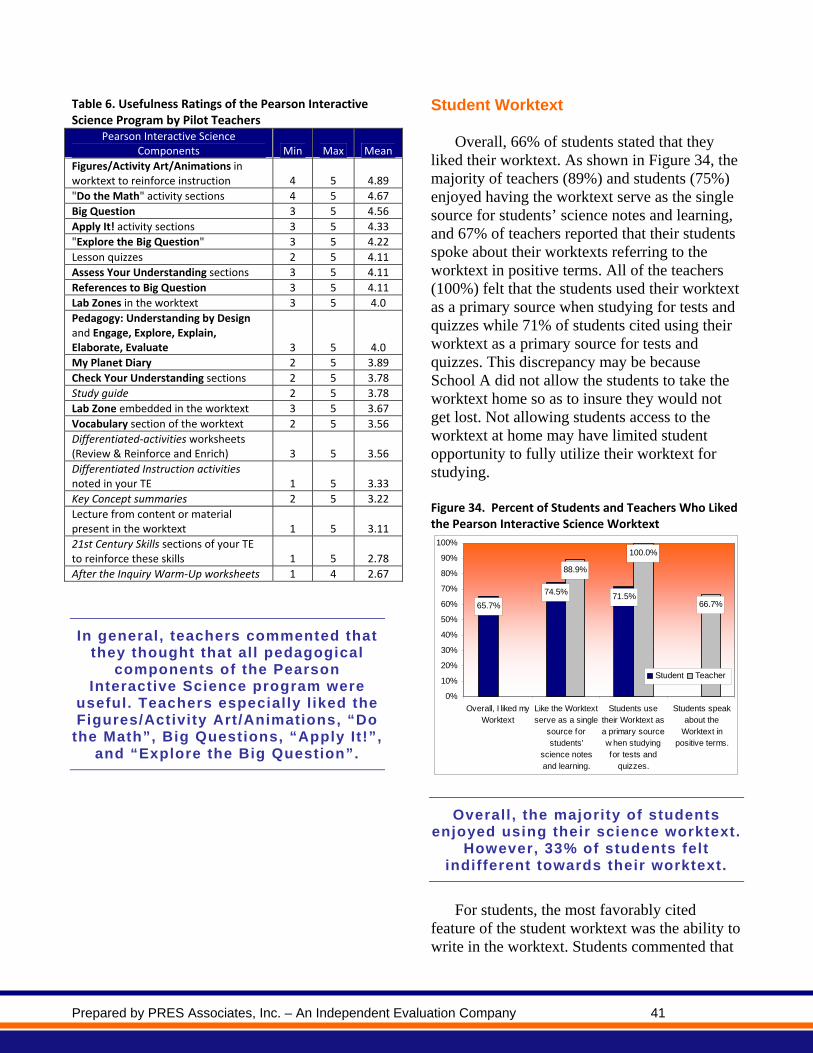
Prepared by PRES Associates, Inc. – An Independent Evaluation Company 41
Table 6. Usefulness Ratings of the Pearson Interactive Science Program by Pilot Teachers
Pearson Interactive Science Components Min Max Mean
Figures/Activity Art/Animations in worktext to reinforce instruction 4 5 4.89
"Do the Math" activity sections 4 5 4.67
Big Question 3 5 4.56
Apply It! activity sections 3 5 4.33
"Explore the Big Question" 3 5 4.22
Lesson quizzes 2 5 4.11
Assess Your Understanding sections 3 5 4.11
References to Big Question 3 5 4.11
Lab Zones in the worktext 3 5 4.0
Pedagogy: Understanding by Design and Engage, Explore, Explain, Elaborate, Evaluate 3 5 4.0
My Planet Diary 2 5 3.89
Check Your Understanding sections 2 5 3.78
Study guide 2 5 3.78
Lab Zone embedded in the worktext 3 5 3.67
Vocabulary section of the worktext 2 5 3.56
Differentiated‐activities worksheets (Review & Reinforce and Enrich) 3 5 3.56
Differentiated Instruction activities noted in your TE 1 5 3.33
Key Concept summaries 2 5 3.22
Lecture from content or material present in the worktext 1 5 3.11
21st Century Skills sections of your TE to reinforce these skills 1 5 2.78
After the Inquiry Warm‐Up worksheets 1 4 2.67
In general, teachers commented that they thought that all pedagogical
components of the Pearson Interactive Science program were
useful. Teachers especially l iked the Figures/Activity Art/Animations, “Do
the Math”, Big Questions, “Apply It!”, and “Explore the Big Question”.
Student Worktext
Overall, 66% of students stated that they liked their worktext. As shown in Figure 34, the majority of teachers (89%) and students (75%) enjoyed having the worktext serve as the single source for students’ science notes and learning, and 67% of teachers reported that their students spoke about their worktexts referring to the worktext in positive terms. All of the teachers (100%) felt that the students used their worktext as a primary source when studying for tests and quizzes while 71% of students cited using their worktext as a primary source for tests and quizzes. This discrepancy may be because School A did not allow the students to take the worktext home so as to insure they would not get lost. Not allowing students access to the worktext at home may have limited student opportunity to fully utilize their worktext for studying. Figure 34. Percent of Students and Teachers Who Liked the Pearson Interactive Science Worktext
65.7%
74.5% 71.5%
88.9%
100.0%
66.7%
0%
10%
20%
30%
40%
50%
60%
70%
80%
90%
100%
Overall, I liked myWorktext
Like the Worktextserve as a single
source forstudents'
science notesand learning.
Students usetheir Worktext asa primary sourcew hen studyingfor tests and
quizzes.
Students speakabout the
Worktext inpositive terms.
Student Teacher
Overall , the majority of students enjoyed using their science worktext.
However, 33% of students felt indifferent towards their worktext.
For students, the most favorably cited
feature of the student worktext was the ability to write in the worktext. Students commented that

Prepared by PRES Associates, Inc. – An Independent Evaluation Company 42
they liked the fact that they “owned” the book and could keep a record of their science instruction beyond the classroom. Students liked that they could keep their notes all in one place with a minimal amount of extra worksheets. Other students commented that they like that the book was lightweight and portable. That said, 1/3 of students did not feel strongly about the worktext. Since liking for science was not measured during the post-survey, it is unclear whether this reflects a general dislike for science or the program specifically. This can be further explored via the RCT.
It was more interesting, and the fact that
you got to write in the book really did improve the learning experience. – WA Student
Overall, I prefer the Pearson Interactive
Science Worktext better because I like the simplicity of it. It is much easier to take notes and I feel like it gets right to the point about what you are learning. This makes it easier for me to learn. Plus, this book is much smaller and lighter than our old regular textbook, so I like how it is much easier to carry around throughout the day. – MO Student
These science workbooks are nice, but
they didn't help me understand science or learn science any faster than I already did in science class. I liked being able to keep my notes and my textbook all in one place, but I never needed them to review for any tests or quizzes. Some of the analogies and comparisons made it more confusing to learn.– MO Student
The majority of students loved that they could write in their worktext, that they “owned” the book, and could keep all their notes in one
place. They also liked the portability of the worktext.
Teachers also noted that the organization of
the worktext facilitated student learning of science. All of the teachers (100%) and 75% of the students in the pilot study agreed that the organization of the worktext around the Big Questions helped to organize the information for science instruction and learning, see Figure 35. The majority of teachers (78%) and students (80%) also agreed that having a complete record of science work and learning was important to students. Regarding the assessments within the worktext, 89% of teachers and 76% students agreed that they helped to determine students’ understanding of the science content. In sum, teachers and students felt that overall organization the student worktext positively contributes to science learning and engagement because it helps them to grasp information more easily. While this was true of most students, some students also commented that while they liked that they could keep their notes and textbook all in one place they did not feel that it helped them to learn any better.

Prepared by PRES Associates, Inc. – An Independent Evaluation Company 43
Figure 35. Percent of Students and Teachers Who Agreed That They Liked the Organization of the Pearson Interactive Science Worktext
74.8%80.2%
76.3%
100.0%
77.8%
88.9%
0%
10%
20%
30%
40%
50%
60%
70%
80%
90%
100%
Organization of theWorktext around BigQuestions helps to
organize theinformation.
Having a completerecord of sciencew ork and learningw as important to
students.
The shortassessments in the
Worktext helpdetermine students'understanding of the
content.
Student Teacher
Overall , teachers and students felt that the organization the student worktext positively contributes to science learning and engagement
because it helps them to grasp information more easily.
I think the Pearson Interactive Science is
better than the old science materials because you always know where your notes are, what chapter you are in, and it is a little easier to follow. – MO Student
Students are able to grasp things and
use knowledge faster because of how it is chunked. – MO Teacher
It [worktext] helped me organize my
work. – UT Student In addition to the organization and being
able to write in the worktext students really enjoyed the fact that they were able to interact with their worktext. They especially liked the figures, activity art, and animations sections which allowed them to take more of an active
role in the learning process. For example, rather than just seeing a diagram with lines or arrows, the text allowed them to draw the connecting line, thus reinforcing the connection.
In the Pearson Interactive Science book, it included a lot of diagrams and pictures. In my previous textbook, there were a few pictures irrelevant to the topic. The pictures and diagrams in the Pearson's book helped me because I am a very visual person, so I learn best by seeing it. – MO Student
I liked the little keys [Key Concepts] that
would tell you the important things. And how you had to answer the questions from the key – UT Student
I like the idea of having the various activities inside the text. What I found very useful was that having the interactive diagram piece was very valuable to my students in helping to build their understanding of some of the more basic concepts. Having to draw the arrow in place and make a label gave them the ability to make that connection. – WA Teacher
Students loved the figures, activity art, animations sections which
allowed them to take more of an active role in the learning process.
Lab Activities
In general, teachers and students enjoyed using the Pearson Interactive Science labs for the modules that were piloted. Teachers noted that most labs were fun and engaging and helped students to obtain a better understanding of the science content. Teacher and students both noted that they especially liked the labs that allowed them to use everyday items as students really enjoyed seeing these items from

Prepared by PRES Associates, Inc. – An Independent Evaluation Company 44
a different perspective. Students also mentioned that they enjoyed the lab activities because they could do them in interactive groups and share their ideas with groups.
I think that the labs that I did with my science class were pretty fun. Getting to put what we learned into action is the fun part of the class. – MO Student
I like the labs/investigations while using
the Pearson Interactive Science program because they usually had us doing them in groups. – MO Student
I like that it uses everyday things to help
me learn. – MO Student
I think they liked it pretty well, they enjoyed science everyday. When I said we were having a lab today they got really excited. – WA Teacher
Teachers noted that most labs were fun and engaging, and helped
students to obtain a better understanding of the science
content.
This qualitative feedback is supported by the
survey data as well. As shown in Figure 36, 89% of teachers and 77% of students liked the labs and investigations they used from the PIS program and felt that the lab zones kept students interested in science class.
Figure 36. Percent of Teachers and Students Who Liked the Labs Activities in the Pearson Interactive Science Program
77.1% 77.3%
88.9% 88.9%
0%
10%
20%
30%
40%
50%
60%
70%
80%
90%
100%
The lab zones integrated w ith theWorktext keeps students
interested in science class.
I liked the labs and investigationsw e used from the Pearson
Interactive Science program.
Student Teacher
Teachers and students l iked the labs and investigations they used from
the Pearson Interactive Science program and felt the lab zones kept
students interested in science class.
They learned the nitrogen cycle; I really
liked the activity the lab that was for that one, I’ve never had kids understand the nitrogen cycle until this year. – WA Teacher
I think they are fun and help
demonstrate science concepts. – MO Student
I really like how the Lab Investigations
have direct and open-ended inquiry. –MO teacher
I really liked the labs because we didn’t
just read about the topic, but we also experimented with it.—WA Student
Teachers were asked to rate the different
types of labs on a scale of 1=very poor to 5=excellent. Results showed that the Inquiry Warm-Up Labs were rated the most positively followed by the Quick Labs and Lab

Prepared by PRES Associates, Inc. – An Independent Evaluation Company 45
Investigations. It is interesting to note that the Ecology and Environment Lab Investigations were rated least favorably. This is in contrast to the 2009 pilot study in which the pilot teachers rated the Populations and Communities Lab Investigation (from the Ecology and the Environment module) the most favorably.
Figure 37. Teacher Ratings of the Pearson Interactive Science Labs by Type
4.3
3.83.7
3.8 3.7
3.0
4.0
3.6 3.7
1
2
3
4
5
Inquiry Warm Up Quick Lab Lab Investigation
Sca
le 1
=Ver
y P
oo
r to
5=E
xcel
len
t
Earth's Structure Ecology & the Environment Forces and Energy
Across all modules, teachers rated the Inquiry Warm-Up Labs the most
favorably followed by the Quick Labs and Lab Investigations.
Among the many labs used during the pilot
study, teachers noted specific labs that they felt were the strongest at demonstrating the intended science concepts. These labs are listed below:
The “Jello lab” (How Can Seismic Waves Be Detected?) I love that one, you have to take the idea of energy traveling though material so its hard to do that with book and paper, with jello its so nice except students are always asking if they can eat the jello. That lab was very very useful.—WA Teacher
The students really enjoy the labs and they do seem to be strongly correlated to the concept being taught that day. They especially enjoyed the Adaptation and Competition labs – WA Teacher
[Labs] that were really good were the puzzle one [Quick Lab: Elbow Room] and the population bean counter [Quick Lab: Human Population Growth]. I referred back to those a lot and that made me think they were really good because I kept referring back to it. –WA Teacher
Populations Warm-Up - Great warm-up. Students could apply what the recently learned in math to estimate pop. size. Lots of discussion over various strategies. Good student engagement. Adaptations for survival - My favorite. Great discussions about variations within a traits. Types of symbiosis - I did not use this lab because of the extensive prep work involved. – MO Teacher
The Hide a Butterfly was a hit with the kids. Elbow Room was fun but the opposite effect happened - the more space - the faster the completion of the puzzle. We talked about how they cooperated because they were trying to complete the same task but in a real ecosystem they might be competing.—MO Teacher
The nitrogen cycle role playing [Quick Lab: Playing Nitrogen Cycle Roles] was awesome - it helped bring to life something the kids had never had experience with. – MO Teacher
Quick lab "Identifying Motion". I used this during class time to show an example of reference points. The visual was excellent in showing how the ball falls depending on what the reference point was. All the kids had a sort of, "Oh....yeah! I see it!" moment. –UT Teacher

Prepared by PRES Associates, Inc. – An Independent Evaluation Company 46
Pacing
Pacing of the program was outlined in the Implementation Guidelines provided to teachers at the onset of the study. A pacing recommendation is also included in the Teacher’s Edition for each lesson in the program. Based on qualitative feedback received from the teachers, the majority felt that the Pearson Interactive Science program was appropriately paced for the content. However, although teachers stated that they felt the pacing of the program and the implementation guidelines were appropriate and feasible, a few teachers stated that they were often pressed for time and could not always teach the program as prescribed. This pilot study took place during the Spring semester and for most of the schools, was the last major topic covered in the school year. As often occurs, teachers do not always have the opportunity to get through all the material that they planned due to activities and events that occur in Spring, such as state testing, spring break, etc. Indeed, as previously noted, school events limited planned classroom time thus impacting the amount of instructional activities that could be completed. That said, the majority of the teachers were able to closely follow the implementation guidelines without incident. Teachers did, however, note that they felt the
It is hard to get through every Apply It, and quick lab in a lesson. I could have spent 2-3 blocks on each lesson, but time does not allow for us to go that slowly. – MO Teacher
The pacing is a good recommendation,
but it comes back to the individual teacher making decisions based on the students needs. – WA Teacher
I think its more feasible than I thought it
was to begin with, although I move pretty fast. I was usually able to do a
lesson in two days if not one. – WA Teacher
Teachers noted that the pacing of the program and the implementation guidelines were appropriate and
feasible but a few stated that they were often pressed for time and
could not always teach the program as prescribed.
Recommendations
Teachers were asked to give feedback with regard to any areas in which they would recommend changes. The following provides a summary of their recommendations for improvement of the Pearson Interactive Science program. Teacher Recommendations
Provide a stronger response to intervention section for remediation.
Change blackline worksheets so not
shaded in grey as this uses up excess printer ink. One concern I have is with the
dark colored areas on the worksheets that go with the labs. They use a great deal of ink to copy or make a transparency of, could they be redone without the dark rectangles?. – WA Teacher
Integrate My Planet Diary with the rest
of the lesson. [My Planet Diary] is a good
starting activity, I would like to see it integrated into the rest of the lesson as a flashback, a clear conceptual connection –WA Teacher

Prepared by PRES Associates, Inc. – An Independent Evaluation Company 47
Have digital path components available. Used the Untamed Science Video
which was great and I wish there were more – WA Teacher
Would like more of a rationale or
explanation for lab worksheet answers.
HOW DO TEACHERS USE THE PEARSON
INTERACTIVE SCIENCE 2011 PROGRAM IN
THEIR CLASSROOM? Student Classroom Activities
Teachers and students were asked to compare how often typical classroom activities occurred with the Pearson Interactive Science program relative to when using their regular science program. Both teachers and students agreed that students answered textbook or worksheet questions, used mathematics as a tool with science problems, and explained in writing their answers to questions in science class more often while using the Pearson Interactive Science program, see Figure 38. Teachers also stated that students more often orally explained their answers to questions and applied what they learned in science to other real world scenarios.
Figure 38. Teacher and Student Perceptions of the Degree to Which Students Engaged in Activities While Using the Pearson Interactive Science Program
A Lot Less About the A Lot MoreWhile using PIS Same While using PIS
3.6
3.3
3.3
3.6
3.1
3.2
3.4
3.2
3.3
2.9
2.8
3.0
3.1
3.2
3.6
3.6
3.6
3.8
4.4
3.9
Students listened and took notes during ascience presentation.
Students worked in groups with other students.
Students discussed science topics with otherstudents.
Students did hands-on/laboratory scienceactivities.
Students applied what they learned to other real-world scenarios.
Students orally explained their answers toquestions in science class.
Students answered textbook or worksheetquestions.
Students used mathematics as a tool whenworking on science problems.
Students explained, in writing, their answers toquestions in science class.
Students read from a science Worktext/textbookin class.
Student (Blue) Teacher (Gray)

Prepared by PRES Associates, Inc. – An Independent Evaluation Company 48
According to both students and teachers, students answered
textbook or worksheet questions, used mathematics as a tool with
science problems, and explained in writing their answers to questions in science class more often while using
the Pearson Interactive Science program as compared to when they used their regular science program.
Teacher Instructional Activities and Practices Teacher Perspective
Teachers were also asked to rate how their classroom activities and practices were impacted by the Pearson Interactive Science program. Of note was that teachers more often introduced new science topics by exploring Big Questions and assigning a hands-on lab activity while using the Pearson Interactive Science program than when they used their regular science program, see Figure 39. Teachers also felt that they were better able to assess their students’ level of understanding during and after the lesson while using PIS.
Figure 39. Teacher Perceptions of the Degree to Which Their Classroom Activities and Practices Were Effected by the Pearson Interactive Science Program
A Lot Less About the A Lot MoreWhile using PIS Same While using PIS
3.2
3.2
3.8
3.7
3.4
3.1
3.1
3.1
3.0I w as able to individualize instruction for the
advanced student (e.g. enrichment/challange).
I spent time teaching new science vocabulary.
I w as able to clearly identify w hich studentsneeded more help in science
I w as able to individualize instruction for hte belowaverage student (e.g. remediation).
I help my students prepare for tests (e.g. stateexams).
I w as able to individualize instruction for the"average" student.
I w as able to assess my students' level ofunderstanding during and after each lesson.
I introduced new science topics by assigning a labor hands-on activity.
I introduced new science topics by exploring big-picture quesitons.
Teachers more often introduced new science topics by exploring Big
Questions and assigning a hands-on lab activity while using the Pearson
Interactive Science program as compared to when they used their
regular science program. In addition, they felt that they were better able to
assess their students’ level of understanding during and after the
lesson while using the PIS program.
Student Perspective
Students were asked to rate the frequency at which their teachers engaged them in various classroom activities while using the Pearson Interactive Science program relative to their regular science program. As shown in Figure 40, students noted that their teachers tended to place more emphasis on giving tests and quizzes, reviewing science work in class, assigning homework, and demonstrating lab activities while using the Pearson Interactive

Prepared by PRES Associates, Inc. – An Independent Evaluation Company 49
Science program as compared to when they used their regular science program. Figure 40. Student Perceptions on the Degree to Which Teachers Engaged in Various Classroom Activities While Using Pearson Interactive Science
A lot less About the A lot moreWhile using PIS Same While using PIS
3.6
3.4
3.3
3.3
3.2
3.0I got extra help from my science teacher w hen
I didn't understand something.
We focused on learning science vocabularyterms
My science teacher demonstrates how tocomplete lab activities/experiments
My science teacher regularly assignedhomew ork
My science teacher review ed science w ork inclass
My science teacher gave tests and quizzes
Students felt that their teachers gave tests and quizzes, reviewed science work in class, assigned homework, and demonstrated how to complete
labs more often while using the Pearson Interactive Science program as compared to when they used their
regular science program.
Use of Specific Pearson Interactive Science Components
In general, teachers reported that they adhered to the implementation guidelines provided to them at the onset of the study. These implementation guidelines followed the layout of the book as organized by the Understanding By Design philosophy. These guidelines also provided descriptions of the various components and activities that are included in the student worktext. Because there are many features and components of the PIS program, for the purposes of the study only certain components and activities were deemed as required. All other aspects of the program, as well as how they were used, were to be considered optional and left to the discretion of the teacher. On average all activities that were deemed required were completed for most part with a few teachers noting that they could not always complete all activities due to time constraints.
Teachers were asked to report how often they used the various components of the Pearson Interactive Science Program11, see Table 7. Results indicate that the activities that were used everyday to once or twice a week, included the Big Question, Assess Your Understanding and Do the Math. Other commonly cited activities included: Figures/Activity Art/Animations, Check Your Understanding, Apply It! and the embedded Lab Zones. The only required activity that was not used as directed by the implementation guidelines was the My Planet Diary feature. These teachers commented that they did not use this feature as they did not find value in the activity.
11 Teachers were asked via both survey and monthly logs. Results from the logs are reported in Appendix A.

Prepared by PRES Associates, Inc. – An Independent Evaluation Company 50
Table 7. Frequency of Use of Pearson Interactive Science Components
Never‐Rarely
Sometimes (1‐2 times per chapter)
Often (1‐2 times per week)
Very Often (Everyday or
almost everyday)
Often‐Very Often
Introduce the Big Question at the beginning of a new topic 0% 0% 33% 67% 100%
Review answers to Assess Your Understanding sections of the worktext
0% 0% 33% 67% 100%
Assign the "Do the Math" activity sections in the worktext 0% 0% 33% 67% 100%
Use Figures/Activity Art/Animations in worktext to reinforce instruction
11% 0% 11% 78% 89%
Have students complete the Check Your Understanding sections of the chapter
11% 0% 22% 67% 89%
Assign the Apply It! activity sections in the worktext 11% 0% 22% 67% 89%
Use embedded Lab Zones in the worktext to reinforce your instruction or lecture
11% 0% 67% 22% 89%
Introduce a new topic or lesson by using a Lab Zone embedded in the worktext
11% 11% 22% 56% 78%
Assign the "Explore the Big Question" activity sections in the worktext
0% 22% 33% 44% 78%
Use the lesson quizzes 0% 22% 56% 22% 78%
Reference the Big Question throughout the chapter 11% 22% 33% 33% 67%
Plan your lessons according to Understanding by Design (Engage, Explore, Explain, Elaborate, Evaluate)
11% 22% 44% 22% 67%
Begin each lesson with My Planet Diary 33% 11% 11% 44% 56%
Lecture from content or material present in the worktext 22% 22% 11% 44% 56%
Review the vocabulary section of the worktext 22% 22% 22% 33% 56%
Use the differentiated‐activities worksheets (Review & Reinforce and Enrich)
33% 11% 44% 11% 56%
Use the study guide 22% 33% 22% 22% 44%
Use the Key Concept summaries 33% 22% 22% 22% 44%
Use the 21st Century Skills sections of your TE to reinforce these skills 78% 0% 11% 11% 22%
Use the Differentiated Instruction activities noted in your TE 44% 33% 22% 0% 22%
Use the After the Inquiry Warm‐Up worksheets 56% 22% 22% 0% 22%
100% of teachers used the Big Question, Assess Your Understanding and Do the Math activities at least 1-2 times per week or more frequently.
More than half (56%) of the teachers never or rarely used Differentiated Instruction Activities noted in the TE, 21st Century Skills, and the After the Inquiry Warm-Up Worksheets.
The activities that were used most often included the Big Question, Assess Your Understanding and
Do the Math. In addition, teachers did well in following the
implementation guidelines and completing all the required
activities, with the exception of the My Planet Diary.

Prepared by PRES Associates, Inc. – An Independent Evaluation Company 51
The monthly activity logs also asked teachers whether they supplemented the program each month. While teachers noted that they used supplementary activities over 80% of the time, this did not include supplements from another curriculum, see Figure 41. Instead, teachers cited supplementary activities including digital resources, computer programs and teacher-developed labs and worksheets. Many teachers also used video clips from Discovery Education and the Science Channel. All teachers stated that they used the supplements in conjunction with the PIS lesson and activities.
Figure 41. Percentage of Teachers Who Assigned Supplemental Activities While Using Pearson Interactive Science
80% 80%86%
0%
10%
20%
30%
40%
50%
60%
70%
80%
90%
100%
Did you use any materials NOT included in the PearsonInteractive Science 2011 program materials/resources (e.e.
original materials created by you, science resources from otherpublishers or earlier versions of Pearson, etc)?
Earth's Structure Ecology & the Environment Forces and Energy
While many teachers reported using supplemental activities, they were mostly digital resources, computer
programs and teacher developed labs and worksheet.
Lab Implementation
In general, labs were conducted as whole group activities and small group activities. In a typical lab activity, the teacher would review the instructions for the lab and set up/distribute equipment kits. Students would then begin the lab within their small group while the teacher walked around to observe the groups and offer help or clarification where needed. During labs, students were often engaged in group discussions with ideas being generated back and forth. When they completed the lab activity students would answer the questions together in their worksheets and clean up. The teacher then led the class as a whole group to discuss the lab and the answers to the lab worksheet. Of note is that the teachers encouraged students to generate their own ideas about how and why the lab worked as it did and come up with their own conclusions.
When asked about the degree to which
teachers engaged students in inquiry-based activities while using the Pearson Interactive Science program, both teachers and students agreed that students more often wrote explanations about observations they made during activities or experiments, see Figure 42. Teachers also reported that they had students follow instructions on lab activities, and recorded and represented data more often while using the PIS program. It was also noted that students came up with hypothesis or predictions, and designed or planned experiments less often while using the PIS program. This may be because many of the labs included in the Pearson Interactive Science program are scripted and teacher-directed. That said, the program also contains open-inquiry lab investigations that allow for students to do their own experimentation. Teachers participating in the RCT will be encouraged to use these types of labs as well as the teacher-directed labs in order to further explore how these different types of labs function in the classroom.

Prepared by PRES Associates, Inc. – An Independent Evaluation Company 52
Table 8. Average Number of Labs and Time to Complete Labs and Chapters During the 2010 Pilot Study.
Earth Structure Ecology and the Environment
Forces & Energy
Noted in Program
2010 Pilot
Noted in Program
2010 Pilot
Noted in Program
2010 Pilot
Count 18 14 22 18 27 11 Inquiry Warm Up Lab
Time 10 to 20 minutes
23.5 5 to 20 minutes 13.4 10 to 20 minutes
12.5
Count 30 [18] 23 42 [22] 23 50 [27] 9 Quick Lab Time 10 to 25
minutes 18.29 5 to 25 minutes 13.9 10 to 20
minutes 10.1
Count 5 4 5 3 7 3 Lab Investigation
Time 30 to 60 minutes
43.5 15 to 60 minutes
43.8 30 to 60 minutes
50.0
*Numbers in brackets are the minimum number of Quick Labs that should have been completed. This is because in general, there are more than one Quick Labs available per lesson and teachers were asked to complete one per lesson.
Figure 42. Teacher and Student Perception of the Degree to Which Inquiry Related Activities Occurred While Using Pearson Interactive Science Relative to their Regular Science Program
A Lot Less About the A Lot MoreWhile using PIS Same While using PIS
2.7
2.8
3.2
3.3
3.3
3.0
2.7
2.6
3.8
3.1
Students designed or planned experiments.
Students came up w ith hypotheses or predictionsto be tested during an experiment.
Students recorded, represented, and/or analyzeddata.
Students follow ed specif ic instructions in labactivities or investigations.
Students w rote explanations about observationsthey made during activities/experiments.
Students (Blue) Teachers (Gray)
Students tended to write explanations about observations they
made during activities or experiments and follow specific
instructions more often while using the Pearson Interactive Science
program as compared to when they used their regular science program. In addition, students came up with
hypothesis or predictions, and designed or planned experiments
less often while using the PIS program. This is because many of the
labs that teachers completed while using the program were teacher-
directed.
Most teachers aimed to have students complete the lab activities as directed in the implementation guidelines. However, some teachers stated that they were not able to complete all labs as directed due to time constraints. As the program was new and many components are still being developed some teachers did not have lab kits in time to begin the program. That said, some teachers noted that they did the labs that they had materials for.
Table 8 shows detailed information on the
average number of labs completed during the pilot study and the average amount of time it took to complete. For reference, the number of labs per module and average completion time as noted in the instructions are displayed. As previously noted, teachers were asked to complete Inquiry Warm Up and Quick Labs per lesson and one Lab Investigation per chapter. As shown in Table 8, teachers using the Earth’s Structure, and Ecology and Environment modules completed many of the required labs. In contrast, Forces and Energy teachers had a more difficult time completing the required number of labs due to time constraints. It should be noted that on average teachers were able to complete the labs within the estimated time frame. Teachers also reported that the time estimates for the labs were fairly accurate and realistic. The teachers of the Forces and Energy module, however, noted that the time estimates

Prepared by PRES Associates, Inc. – An Independent Evaluation Company 53
did not include time for teacher preparation which sometimes was considerable.
The [lab] timings are a good baseline, but the end of the day it depends on the students’ moods and what’s going on in the rest of the universe that particular day. You could say the timings are reasonable, they are suggested timings, it all depends on how you as the teacher are deciding to run it. – WA Teacher
Across all lab activities, time allotted
does not include "prep" time by teacher. Cutting and stripping wires, preparing Sparks flying plates, etc. took time; sometimes significant if you're preparing 8+ labs set-ups. –MO Teacher
For the most part, it was feasible for students to complete one Inquiry
Warm Up and Quick Lab per lesson and one Lab Investigation per
chapter. Teachers also reported that the lab time estimates were fairly accurate. However, similar to the
2009 pilot, some teachers noted that it did not include time for teacher
preparation which could be considerable.
HOW SHOULD THE PEARSON INTERACTIVE
SCIENCE 2011 PROGRAM BEST BE USED IN
ORDER TO MAXIMIZE ITS IMPACT ON
STUDENT PERFORMANCE?
Results from the pilot study indicate that most teachers can and will likely use the program as directed in the Teacher’s Edition. Recall that for the 2010 pilot study implementation guidelines were provided to the teachers based on the feedback received from the 2009 pilot study. While for the most part teachers used the required components frequently, some components were used more often than others. In particular, teachers tended to engage in the following activities several times per week, all of which are noted as required components:
Introduce the Big Question at the beginning of a new topic
Assign the Do the Math activity sections Review answers to Assess Your
Understanding sections Check Your Understanding sections Use embedded Lab Zones in the
worktext to reinforce instruction Assign the Apply It! Activity sections Use Figures/Activity Art/Animations in
the worktext to reinforce instruction Introduce a new topic or lesson by using
a Lab Zone Assign the Explore the Big Question
activity sections Use the Lesson Quizzes
In addition teachers were asked to identify
key program components that they felt were essential to teach students effectively about science. Specific key components noted by teachers included the Big Questions, vocabulary, activity art/animations throughout the worktext, and questions under the 5Es as noted in the Teachers Edition. The following are

Prepared by PRES Associates, Inc. – An Independent Evaluation Company 54
comments teachers made with respect to the key components of the program.
Liked the Unlock the Big Questions, that was a really nice way of presenting it ahead of time, what were you going to learn in this, I think that’s always helpful. I like those parts of it that were interactive [Activity art] that weren’t just asking questions but they would be things like circle the parts of this or draw lines to this, I think those were really good.. – WA Teacher
[In the Teacher’s Edition] where it has
the Explain and Elaborate questions, those are quite good and the kind of questions I would normally ask. For someone who isn’t as comfortable with the topic or new at it they would be really helpful. – WA Teacher
Really like the review and reinforcement
pieces. I found these to be very strong in helping students make the connections that I wanted. – WA Teacher
[The Big Question] helps them focus and
the program keeps coming back to it. It gives them purpose for reading – MO Teacher
(Apply Its) Similar to what was in the old
book but it was actually in the book so they could just do it right there and I thought that was good. – WA Teacher
Taught me the power of visuals. Was
formally more activity driven and this allows me to use the textbook in a more positive way. –MO Teacher
I did really enjoy the Unlocking the Big
question. I think it is an effective way to stay on track and keep kids focused on the end result. – UT Teacher
The Getting Started section at the
beginning of the chapter is helpful to go over background info and the vocabulary. Putting it in context whether actual meaning or word origins helps students to remember. – UT Teacher
The key program components of the Pearson Interactive Science that
teachers felt were essential included the Big Questions, vocabulary,
activity art/animations throughout the worktext, and the questions
under the 5Es.
During the exit interview, teachers were
asked if they would use the program differently next year when they are not part of the study and subject to the implementation guidelines. Nearly all teachers stated that they would use the program the same as they found all required components to be very useful. However, three teachers commented that would skip certain activities or use them differently as they did not find them to be as useful. These consisted of My Planet Diary, Assess Your Understanding and the Lab Investigations.
I would skip the My Planet Diary and use the key questions as the study guide rather than the built in study guide –MO Teacher
[My Planet Diary] was not really an integral part of the lesson. It’s more like current events and I do that in my classroom anyway. Didn’t have time to do it all, so started leaving it out as a time saver – WA Teacher
I didn’t like at the end of every lesson the Assess Your Understanding. It was just a repeat. All you had to do was look

Prepared by PRES Associates, Inc. – An Independent Evaluation Company 55
at the top of the page and there it was, maybe I just didn’t use it right but I didn’t think they got that much value out of it. And I was initially really excited about that and I thought it was good because it would help them solidify what they were supposed to get today. It just got brushed under the carpet and it was just a matter of them spiting back the bold words on the page. – WA Teacher
I thought [Got Its] were going to be one of the most useful things and many students didn’t respond to it in a way that I would find most useful. All students responded that they “got it” but on a secondary assessment they clearly didn’t “get it”. – WA Teacher
I was really excited about the Lab Investigations especially in the last two chapters and they just weren’t as good as I thought they were going to be. Before you started doing it, it was obvious what was going to happen. There wasn’t any big “ah-ha” moment, the questions were just so obvious. Nothing ever really made anybody think very much. – WA Teacher
I did not do any of the investigations. I did read them all carefully and I understand what they are about and I’ve actually done similar ones in my classes before, but I didn’t think they were worth, only devoting 2 hours to a concept. Didn’t seem like a valuable use of time to me. – WA Teacher
Components noted by teachers that they would be less l ikely to use
during the upcoming school year included My Planet Diary, Assess Your Understanding and the Lab
Investigations.
In sum, based on the information gathered during the two pilot studies, it is recommended that teachers use the program as outlined in the 2010 pilot study implementation guidelines. As previously noted, it was feasible for students to complete one Inquiry Warm Up and Quick Lab per lesson and one Lab Investigation per chapter. In addition, most teachers were able to complete the required components of the program as outlined in the guidelines while maintaining a reasonable pace. Moreover, for the most part pilot teachers agreed that the key components noted in the guidelines were essential for student understanding. The only exceptions were use of the My Planet Diary, Assess Your Understanding and the Lab Investigations. Nevertheless, these components are considered critical by the authors as they engage, evaluate, and allow students to explore – all aspects of the research-based 5Es pedagogy.

Prepared by PRES Associates, Inc. – An Independent Evaluation Company 56
WHAT TYPE(S) OF TRAINING AND
PREPARATION IS NEEDED IN ORDER TO
PROMOTE EFFECTIVE IMPLEMENTATION OF
THE PEARSON INTERACTIVE SCIENCE
2011 PROGRAM? ARE THE BUILT-IN
TEACHER RESOURCES USEFUL TO
TEACHERS IN HELPING THEM PREPARE TO
EFFECTIVELY DELIVER SCIENCE
INSTRUCTION IN THEIR CLASSROOM?
Initial training for the Pearson Interactive Science program took place prior to implementing the program. Each school participating in the pilot study received training from a different Pearson Trainer. The training schedule is noted in Table 9. Table 9. Training Schedule
As shown, an in-person training was held for
School A one week before the 8th grade teachers were set to begin the program in January. Sixth grade teachers participated in the initial training as well and then received a follow up webinar in March as they were beginning to implement the program. The follow up training for the 6th grade teachers served as a refresher as the initial
training was two months before implementation. School B received training in-person three weeks before implementation of the program. This school also received a follow up Webinar training about a month after implementation. School C received initial training in-person one month prior to implementation as well as a follow up webinar about a month after implementation.
The initial training for all three schools was
approximately 3 hours long and the follow up webinar for each school was about 1.5 hours long. The initial trainings consisted of Pearson trainers walking the teachers through the various components of the program and emphasizing the Understanding by Design philosophy and the organization around the 5Es. The trainer then reviewed the implementation guidelines explaining the various components of the program and which components were required and optional.
Following the review of the textbook and its components the trainer was able to demonstrate the digital path items and provide the teachers with the access codes needed to create their PearsonSuccessNet accounts. The teachers were excited about the prospects of the digital path and its potential but seemed somewhat disappointed as to the limited items that were available (only one chapter per module and very limited components within that chapter). One of the things they would have liked to have seen was the ability to assign homework using the digital path and have it save a record of their work; this feature was not available during the pilot.
The follow-up training for each school
consisted of a review of the program and its components, and served as an opportunity for teachers to discuss any issues they were having with implementation and digital path components. This training also served as a reminder as to the implementation guidelines
School First Training Follow‐Up Webinar
School A (MO) January: 1 week prior to implementation for 8th grade teachers and 7 weeks prior to implementation for 6th grade teachers
1.5 months after implementation for 8th grade teachers and 2 days after implementation for 6th grade teachers
School B (UT) January: 3 weeks prior to implementation
1 month after implementation
School C (WA) February: 1 month prior to implementation
1 month after implementation

Prepared by PRES Associates, Inc. – An Independent Evaluation Company 57
and which components were in fact required. While teachers at School A and School B felt that the follow up training was extremely useful, the teachers at School C seemed to feel that it was more of a “check-in” to make sure the teachers were implementing the program correctly. Feedback on Resources and Training
After the respective trainings, teachers commented that they enjoyed the training and most teachers (77.8%) felt that they were adequately prepared to begin using the Pearson Interactive Science program, see Figure 43. The user-friendliness of the Teacher’s Edition allowed for easy implementation and lesson planning and teachers (89%) felt that the Teacher’s Edition served as useful resource for implementation. In addition, teachers commented that they received timely answers to their inquiries when they had questions regarding the use of a few components from their respective trainers.
Figure 43. Percent of Teachers Who Felt Training and the Teacher’s Edition Were Helpful
77.8% 77.8%
88.9%
0.0%
10.0%
20.0%
30.0%
40.0%
50.0%
60.0%
70.0%
80.0%
90.0%
100.0%
The training I receivedprepared me to implement thePearson Interactive Science
program.
The training I receivedcovered all aspects of the
Pearson Interactive Scienceprogram I used during the
study.
The Teacher Edition w as ahelpful resource w hen I hadquestions or concerns about
implementation.
At the conclusion of the study, teachers were
asked if they had any comments or recommendations for future trainings. Teachers unanimously agreed that they wished more of the digital path had been available and that they would have liked more training on those components. In addition, a few teachers would have liked that the follow-up training had
occurred sooner (within a couple of weeks of implementation).
If the technology is going to work, the best thing is to get the teacher in front of the computer and have them access it themselves. – WA Teacher
Many of the components were not
available or up and running yet – MO Teacher
Since this was the pre pilot study, many
of the interactive components were not functional. This proved to be a challenge to the students and to me as I think they would really enjoy learning with technology. – UT Teacher
The only suggestion I would make is to
get the digital path finished and accessible so teachers/students could use. Otherwise, it was wonderful! – MO Teacher
I think it would be good to have a follow
up within a week or two, that’s when you can really get your questions answered because now you’ve been in the book. After the first couple of lessons that’s when you have all the questions. – WA Teacher
Teachers commented that they enjoyed the training and that they were adequately prepared to begin
using the Pearson Interactive Science program.

Prepared by PRES Associates, Inc. – An Independent Evaluation Company 58
Recommendations for Future Training
Effective and consistent implementation of the Pearson Interactive Science program is essential to the success of the 2010-11 RCT. In order for teachers to effectively implement the program during the RCT, it is important for teachers to understand which components of the program are required and which are optional. This also needs to be clearly communicated to teachers to ensure that teachers implement the program with fidelity.
The following are items that are
recommended to be incorporated in trainings. These recommendations reflect information gathered from the pilot studies and the researchers’ prior study experiences.
A training model should be developed to
promote consistency in trainings across different trainers. The model should be clearly defined and articulated, and should include follow-up sessions to help facilitate successful use of the program as well as implementation fidelity. Trainings should also make use of all the scheduled time.
Training should include a thorough
discussion of the program’s research base and philosophy. It would be helpful for teachers to more fully understand the background related to why/how Pearson created this program in order to obtain a greater buy-in from them; if a teacher understands why the program was designed the way it is, they are more likely to emphasize important components and direct more attention towards implementing the program as prescribed. In addition, this will help set the stage for how the program works to improve student science skills.
Teachers would also benefit from having a
general overview of all the teaching resources available as part of the Pearson
Interactive Science program, where to find them and how to use them. Trainers should walk teachers through the typical instruction of a chapter while being open to modifications according to teachers’ needs or preferences.
Trainings should include modeling of a
lesson in order to demonstrate how to utilize the components designated as essential to implementation, as well as those that are optional. As noted by pilot teachers, this helps teachers obtain a clear grasp of how to actually use the program.
To the extent that it is feasible, the initial
training should occur at least 2 weeks prior to the start of the study and teachers should have access to the materials at least one month prior to this training so that they can review the materials. The closer to implementation that the training occurs, the more “fresh” the information is to the teachers.
It will also be very important to plan for
training on the technology to be released as part of the Pearson Interactive Science program. So as not to overwhelm teachers during their initial training, it is recommended that a brief overview be conducted and that teachers be provided with assistance for accessing PearsonSuccessNet, which includes registering teachers and students. The follow up training can then focus on detailed information on what is available and how to incorporate the technology into their activities. These recommendations will help ensure
that teachers participating in the RCT are ready to begin implementing the Pearson Interactive Science program effectively at the start of the study.

Prepared by PRES Associates, Inc. – An Independent Evaluation Company 59
WHICH TYPES OF ASSESSMENTS AND
OUTCOME MEASURES WILL BE MOST
SENSITIVE TO PICKING UP THE EFFECTS OF
THE PEARSON INTERACTIVE SCIENCE
2011 PROGRAM? WHAT IS THE
RELIABILITY, VALIDITY AND SENSITIVITY OF
DATA COLLECTION INSTRUMENTS USED
DURING THE PILOT STUDY?
Examination of the percentage of change by various types of test items from pre to post testing showed that with the exception of the Forces and Energy assessment, students did equally well on multiple choice and constructed response test items, as displayed in Figure 44. Furthermore, they showed the greatest improvement on the fill-in-the-blank test items which for the most part focused on vocabulary words. This finding is consistent with the findings of the small-scale pilot conducted in Spring 2009 in which students showed the greatest improvement on the fill-in-the-blank test items. Such consistencies in the findings suggest that the PIS program may be especially useful at improving students’ science terminology.
While the Forces and Energy test exhibited
the largest growth for fill-in-the-blank and multiple choice test items, it exhibited the poorest growth on the constructed response items. This is somewhat consistent with the findings of the Spring 2009 pilot in which student performance on the Work & Machines chapter test showed a significant decrease as measured by the constructed response items. As previously noted the disparagement on the Forces and Energy constructed response test items may be due to the more challenging topics contained in the module as opposed to the other modules used in the pilot study. While students were able to recall specific information and vocabulary terms from the program, they may have had more difficulty in fully grasping and understanding the physical science concepts
within the module, and applying what they had learned. Figure 44. Student Performance on the Pearson Interactive Science Assessments by Type of Test Items
% Gains by Item Type
16.3%
26.9%
23.4%
13.8%
24.4%
29.5%
20.7%
1.8%
34.3%
0%
5%
10%
15%
20%
25%
30%
35%
40%
Multiple Choice Constructed Response Fill-in-the-Blank
Earth's Structure Ecology and the Enviornment Forces and Energy
.
Students across all modules showed the
largest growth in fill-in-the blank test items, which primarily measures science vocabulary.
Researchers also examined the psychometric
properties of the custom assessments as it is anticipated that questions from these tests will be used in the RCT planned for the 2010-2011 school year. First, reliability analyses were run on each of the tests. Note that it is a general rule of thumb that instruments with a reliability coefficient of .70 and above are considered reliable. As shown in Table 10, the custom tests used in the pilot study showed high levels of internal consistency (alpha) and split half reliability. Table 10. Psychometric Properties of the Pearson Interactive Science Custom Assessments
Ecology and the
Environment
Forces & Energy
Earth’s Structure
Alpha .861 (n=120)
.809 (n=145)
.735 (n=62)
Split‐half .841 (n=120)
.743 (n=145)
.751 (n=62)

Prepared by PRES Associates, Inc. – An Independent Evaluation Company 60
In addition, custom assessments were correlated with the TerraNova3 assessments to obtain information on the concurrent validity of the custom assessment. Researchers examined the correlation coefficients between the custom assessment and all items from the TerraNova3 science assessment. Note that specific TerraNova3 content area items (e.g. only Life Science items) were not pulled and analyzed as there were only a small number of specific content items within the TerraNova3 which could artificially reduce the correlation. Instead the correlations were calculated within each grade level. For example, correlations were calculated among 6th graders who took the Ecology and Environment custom test and Level 16 TerraNova3. Results indicate that the assessments were moderately correlated, see Table 11. Given that all items of the TerraNova3 science assessment were included in the analyses, the obtained r’s are considerably adequate and demonstrate concurrent validity. Table 11. Correlation Between Pearson Interactive Science Custom Assessments and the TerraNova3, Science Assessments
Forces & Energy
& TerraNova3 8th grade
Earth’s Structure & TerraNova3 7th Grade
Ecology and the
Environment &
TerraNova3 6th grade
Correlation (r)
.653 (n=131)
.650 (n=39)
.546 (n=135)
Conclusion
The pilot study allowed researchers to obtain preliminary efficacy data on teacher and student outcomes associated with using the Pearson Interactive Science program as well as inform the design of the more rigorous experimental study on the effectiveness of this program to be undertaken during the 2010-2011 school year. It also allowed researchers to develop and test custom assessments to insure that assessments used during the 2010-2011 RCT are sensitive to picking up the effects of the Pearson Interactive Science program. In this section, we summarize the key findings, the lessons we learned and their implications for the RCT.
KEY FINDINGS
Preliminary efficacy data was obtained from students which showed significant growth across all three grade levels from pre- to post-testing on the custom assessments developed for the pilot study. Students noted that their learning of science was facilitated by the program’s visual diagrams and lab activities. These interactive aspects of the program increased students’ engagement in science and helped them make connections between science and the real world.
Examination of performance on the
TerraNova3, a national norm-referenced exam, showed that across all students, there was a marginally significant learning gain from pre- to post-testing.
Across both outcome measures (custom
assessment and TerraNova3), students showed greater gains in the areas of life science (Ecology and the Environment) and earth science (Earth’s Structure) as compared to physical science (Forces and Energy). It should be noted that this

Prepared by PRES Associates, Inc. – An Independent Evaluation Company 61
is consistent with what was observed during the 2009 pilot study. In particular, students in that study performed least well on the Work & Machines (Forces and Energy) chapter test. These findings, along with anecdotal information from teachers, suggest that the content of this module is more challenging and difficult to teach due to the reported lack of student prerequisite knowledge and skills. Given the consistency in findings, it is suggested that the Forces and Energy module be closely examined by publishers and revised. Otherwise, students may continue to have difficulty with the physical science content--and this may become more evident during the RCT (i.e., no significant differences may be observed among physical science students).
Teachers and students agreed that the
Pearson Interactive Science program better prepared students for future science tests including state/national tests and future science courses.
The triangulation of data from multiple
sources revealed that teachers liked the Pearson Interactive Science program as it better prepared them to teach science and provided them with useful information to effectively teach science. Furthermore teachers found the Pearson Interactive Science program to be more helpful in teaching science vocabulary, providing ideas for more hands on student activities and minimizing planning and preparation time. Teachers were also significantly more prepared to integrate science with other subjects, teacher via a hands-on instructional approach, and manage a class of students using lab activities.
With respect to how participants used the program, pilot teachers stated that they used the program as outlined by the Implementation Guidelines. Most teachers agreed that all the components were useful in teaching science in their classroom and would continue to use the program the same. They also commented that the guidelines, including lab requirements, were feasible.
Teachers found the training to be useful
and agreed that the training prepared them to begin using the Pearson Interactive Science program. All teachers also felt that they would have liked to have seen more digital path activities available.
The custom assessments developed for
the pilot study demonstrated significant levels of internal consistency and concurrent validity with the Terranova3. As expected, the custom assessments were also more sensitive to the measurement of student growth.
LESSONS LEARNED & IMPLICATIONS FOR
RCT
Outcome measures by teacher pedagogy could not be analyzed as all participating teachers reported similar pedagogical approaches. As a relationship between student outcomes and teacher pedagogy was suggested in the Spring 2009 pilot study, to the extent possible, this will need to be re-examined in the upcoming RCT in order to obtain definitive information on this potential relationship.
As pointed out by the 2009 pilot
study, inclusion of assessments using multiple types of items is important

Prepared by PRES Associates, Inc. – An Independent Evaluation Company 62
to ensure that the battery of assessments utilized are sensitive to different skill areas. Results from the present pilot study showed that students performed equally well on multiple-choice and constructed response items (with the exception of Forces and Energy), and showed the greatest change with fill-in-the-blank items which measured science vocabulary. Such variation in test items is important because a key aspect of the Pearson Interactive Science program is to teach students how to read and write about science.
More formative feedback on the
digital path activities should be obtained in the 2010-2011 RCT. Because the digital path was not complete, and only a few activities were available for one chapter only, many teachers found it very limiting and could not provide adequate feedback. The full digital path is expected to be available for the upcoming RCT and it will be important to obtain feedback from the teachers and students as this is a new component of the program.
In sum, researchers were able to obtain additional information that suggests that the Pearson Interactive Science program is associated with positive student outcomes. However, these findings are only preliminary and not conclusive. That said, the upcoming full year randomized control trial has been designed to produce rigorous quantitative evidence upon which strong conclusions could be drawn regarding the effects of the Pearson Interactive Science program on student learning.

Prepared by PRES Associates, Inc. – An Independent Evaluation Company 63
References National Assessment of Educational Progress (2005). The Nation’s Report Card. Washington,
DC: National Center for Education Statistics. National Science Teachers Association (2003). NSTA Position Statement: Science Education for
Middle Level Students. Retrieved online June 30, 2010 from http://www.nsta.org/about/positions/middlelevel.aspx?lid=ms.
National Science Teachers Association (2004). NSTA Position Statement: Scientific Inquiry.
Retrieved online June 30, 2010 from http://www.nsta.org/about/positions/inquiry.aspx. U. S. Department of Education National Center for Education Statistics (2009). TIMSS: Science
Achievement of Fourth- and Eighth-Graders between 1995 and 2007. Washington, DC. Retrieved online June 2, 2009 from http://nces.ed.gov/timss/results07_science95.asp.
U.S. Department of Education (2010). A Blueprint for Reform: The Reauthorization of the
Elementary and Secondary Education Act. Washington, DC. Retrieved online June 30, 2010 from http://www2.ed.gov/policy/elsec/leg/blueprint/index.html.
U.S. House of Representatives Committee on Science and Technology (2010). Strengthening
American Competitiveness in the 21st Century Global Economy. Washington, DC. Retrieved online June 30, 2010 from http://science.house.gov/.

Prepared by PRES Associates, Inc. – An Independent Evaluation Company 64
Appendix A: Tables of Statistical Results Table A1. Pre and Post Pearson Interactive Science Custom Test Statistics by Item Type
Timing Mean N Std. Deviation t df Sig.
Ecology and the Environment
Pre 46.46 123 17.74
Multiple-Choice Post 60.35 123 17.15 -9.42 122 0.00
Pre 18.19 123 16.50
Constructed Response Post 42.58 123 27.85 -10.31 122 0.00
Pre 35.33 120 25.76
Fill in the Blank Post 64.83 120 23.76 -9.50 119 0.00
Pre 40.50 123 15.87
Overall Post 57.83 123 17.14 -12.09 122 0.00
Earth’s Structure
Pre 52.98 48 9.56
Multiple-Choice Post 69.29 48 11.68 -10.75 47 0.00
Pre 12.92 48 13.68
Constructed Response Post 39.79 48 20.78 -8.49 47 0.00
Pre 35.83 48 17.96
Fill in the Blank Post 59.17 48 17.96 -7.94 47 0.00
Pre 43.25 48 8.55 Overall Post 63.38 48 12.19
-14.15 47 0.00
Forces and Energy
Pre 30.07 117 10.14
Multiple-Choice Post 50.77 117 15.77 -20.46 116 0.00
Pre 28.12 117 24.70
Constructed Response Post 29.91 117 19.72 -0.998 116 0.32
Pre 42.22 117 31.05
Fill in the Blank Post 62.56 117 30.57 -6.96 116 0.00
Pre 39.91 117 15.12
Overall Post 47.78 117 15.77 -8.84 116 0.00

Prepared by PRES Associates, Inc. – An Independent Evaluation Company 65
Table A2. PRE and Post TerraNova3 Test Statistics Timing Mean N Std. Deviation t df Sig.
TerraNova3 Level 16 (6th Grade)
Pre 682.26 135 30.43
Scale Score Post 690.31 135 33.14 3.853 134 0.00
Pre 67.21 135 23.39
National Percentile Rank Post 71.21 135 21.63 2.849 134 0.01
TerraNova3 Level 17 (7th Grade)
Pre 699.95 40 25.06
Scale Score Post 705.95 40 24.32 1.29 39 0.21
Pre 72.80 40 16.80
National Percentile Rank Post 75.38 40 16.27 .811 39 0.42
TerraNova3 Level 18 (8th Grade)
Pre 699.29 137 26.88
Scale Score Post 697.89 137 35.89 -0.65 136 0.51
Pre 62.92 137 21.69
National Percentile Rank Post 60.99 137 26.04 -1.31 136 0.19
All Grades (6-8)
Pre 694.23 449 28.85
Scale Score Post 696.33 449 34.39 1.74 448 0.08
Pre 65.09 449 21.98
National Percentile Rank Post 65.34 449 24.61 0.31 448 0.76
Table A3. Pre and Post TerraNova3: Content Specific Results
Timing Mean N Std. Deviation t df Sig.
TerraNova3 Level 16 (Life Science Items)
Pre 71.52 135 18.74
Scale Score Post 76.38 135 16.81 -3.33 134 0.00
TerraNova3 Level 17 (Earth Science Items)
Pre 66.07 40 17.63
Scale Score Post 77.50 40 18.55 -3.76 39 0.00
TerraNova3 Level 18 (Physical Science Items)
Pre 54.43 137 15.25
Scale Score Post 56.20 137 15.02 -1.08 136 0.28
Table A4. Frequency of use of Pearson Interactive Science Components Required by Implementation Guidelines as reported by Teacher Activity Logs – Earth’s Structure Never –
Rarely Some (more than 5 times during the
month
Often (once or twice per week)
All or almost all science classes
Often – All the time
Vocabulary 0% 0% 20% 80% 100%
Do the Math! 0% 0% 60% 40% 100%
Assess Your Understanding 0% 0% 60% 40% 100%
The Big Question 0% 20% 40% 40% 80%
Check Your Understanding 20% 0% 40% 40% 80%
Figures/Activity Art/Animations 20% 0% 40% 40% 80%
Apply It! 20% 0% 60% 20% 80%
My Planet Diary 20% 20% 20% 40% 60%

Prepared by PRES Associates, Inc. – An Independent Evaluation Company 66
Table A5. Frequency of Use of Pearson Interactive Science Components Optional Activities by Implementation Guidelines as Reported by Teacher Activity Logs‐Earth’s Structure Rarely /never
– Couple of times per month
Once per week
A few times per week
Everyday or almost everyday
Often – All the time
Study Guide 0% 0% 60% 40% 100%
Key Concepts Summaries 0% 20% 40% 40% 80%
After the Inquiry Warm‐Up Worksheet 20% 20% 40% 20% 60%
Differentiated activities worksheet 40% 0% 40% 20% 60%
21st Century Skills 80% 0% 0% 20% 20%
Lesson Quizzes 40% 40% 20% 0% 20%
Table A6. Frequency of use of Pearson Interactive Science Components Required by Implementation Guidelines as reported by Teacher Activity Logs – Ecology and the Environment Never –
Rarely Some (more than 5 times during the
month
Often (once or twice per week)
All or almost all science classes
Often – All the time
Do the Math! 0% 0% 20% 80% 100%
Assess Your Understanding 0% 0% 10% 90% 100%
Vocabulary 0% 10% 60% 30% 90%
The Big Question 10% 10% 40% 40% 80%
Apply It! 10% 20% 0% 80% 80%
Check Your Understanding 30% 10% 10% 50% 60%
Figures/Activity Art/Animations 40% 0% 0% 60% 60%
My Planet Diary 30% 10% 10% 50% 60%
Table A7. Frequency of Use of Pearson Interactive Science Components Optional Activities by Implementation Guidelines as Reported by Teacher Activity Logs—Ecology and the Environment Rarely /never
– Couple of times per month
Once per week
A few times per week
Everyday or almost everyday
Often – All the time
Study Guide 30% 20% 30% 20% 50%
Lesson Quizzes 30% 30% 20% 20% 40%
After the Inquiry Warm‐Up Worksheet 50% 20% 10% 20% 30%
Differentiated activities worksheet 40% 30% 30% 0% 30%
Key Concepts Summaries 70% 10% 0% 20% 20%
21st Century Skills 80% 10% 10% 0% 10%
Table A8. Frequency of use of Pearson Interactive Science Components required by Implementation Guidelines as Reported by Teacher Activity Logs – Forces and Energy Never –
Rarely Some (more than 5 times during the
month
Often (once or twice per week)
All or almost all science classes
Often – All the time
Apply It! 0% 0% 86% 14% 100%
Check Your Understanding 0% 0% 57% 43% 100%
Do the Math! 14% 0% 43% 43% 86%
Assess Your Understanding 14% 0% 43% 43% 86%
Vocabulary 29% 0% 57% 14% 71%
The Big Question 29% 14% 0% 57% 57%
My Planet Diary 14% 29% 14% 43% 57%
Figures/Activity Art/Animations 29% 29% 0% 43% 43%

Prepared by PRES Associates, Inc. – An Independent Evaluation Company 67
Table A9. Frequency of Use of Pearson Interactive Science Components Optional Activities by Implementation Guidelines as Reported by Teacher Activity Logs‐Forces and Energy Rarely /never
– Couple of times per month
Once per week
A few times per week
Everyday or almost everyday
Often – All the time
Study Guide 43% 14% 29% 14% 43%
Lesson Quizzes 43% 29% 14% 14% 29%
Differentiated activities worksheet 29% 43% 14% 14% 29%
Key Concepts Summaries 86% 0% 0% 14% 14%
After the Inquiry Warm‐Up Worksheet 86% 0% 14% 0% 14%
21st Century Skills 100% 0% 0% 0% 0%
Prepared by PRES Associates, Inc. – An Independent Evaluation Company 68
Appendix B: Implementation Guidelines

Prepared by PRES Associates, Inc. – An Independent Evaluation Company 69
Introduction Welcome and thank you for participating in the pilot study being conducted by PRES Associates on the Pearson Interactive Science 2011 program. We believe your experience with our study will be rewarding and enjoyable. Not only will you contribute to cutting-edge research, but you will also benefit from first-rate professional development provided by Pearson Education professional training specialists. We understand that it may be challenging to change former practices and implement portions of a new science program. Therefore, we greatly appreciate the time and effort you will contribute into making this study a success. However, we also realize that there may be obstacles and challenges as you begin to implement this program. Under these circumstances, we want and need to hear from you; we will guide you through those challenges. In fact, it is critical that any problems you encounter be addressed as soon as possible to ensure that this program is being implemented to its full potential. Feel free to contact PRES Associates via e-email at [email protected] if you have any questions, problems or concerns. The following provides answers to some common questions teachers may have related to this study. Please read through all of these questions/answers. Again, should you have further questions, please contact PRES Associates. Why Is This Research Being Done?
As you are aware, the No Child Left Behind Act (NCLB) of 2001 requires that educational materials and strategies used by educators in the classroom must be proven by scientific research to improve student achievement in the classroom. Pearson Education has developed a strong research model for determining that their programs are scientifically-based. As part of this research agenda, Pearson Education has contracted with PRES Associates12, an external educational research firm, to conduct a pilot study focused on obtaining in-depth qualitative information and preliminary data on the impact of the program on the science knowledge and skills of middle school students (grades 6-8). The information obtained during this pilot study will be used to improve the quality of the program and will inform future large-scale, rigorous quantitative evaluations of the Pearson Interactive Science program’s effectiveness. Why Do I Need Professional Development? It takes more than a good curricular program to raise students’ knowledge of science. It also takes good teachers with a thorough understanding of the curriculum, who are supported by professional development, school administrators, and parents/guardians. To this end, it is hoped
12 PRES Associates is an external, independent, educational research firm with an established track record in conducting large-scale, rigorous evaluations on the effectiveness of research materials.
Pearson Interactive Science 2011 Pilot Study
Implementation Guidelines

Prepared by PRES Associates, Inc. – An Independent Evaluation Company 70
that through the professional development training session provided by Pearson Education on the use of its science program, all teachers participating in the study will gain the knowledge and skills to successfully implement this program right from the start.
As you will soon learn, this science program provides numerous teaching resources and supports. In order to implement this program successfully, it is essential that teachers have a thorough understanding of the resources provided by the Pearson Interactive Science 2011 program. Rather than having teachers figure it out on their own, professional trainers will guide you through this process, offering examples of when to use certain materials, how to manage and supplement classroom instruction, what types of assessments to administer, and so forth. Why Do I Need To Follow These Implementation Guidelines? The Teacher Implementation Guidelines were developed as part of the Pearson Interactive Science 2011 Pilot Study. The guidelines are designed for teachers to use when implementing the new program in their class(es). The guidelines point out key program components that must be implemented during science lessons. These key program components have the greatest influence on student learning and performance, and therefore should be implemented. In addition, it is critical to ensure that all teachers are implementing a similar instructional model. That is, if teachers are modifying the program to an extent that it no longer resembles the original program, the study will not provide accurate information reflective of the Pearson Interactive Science 2011 program. In sum, by providing these implementation guidelines, we are attempting to (1) maximize the potential of this science program to help your students, and (2) ensure that the program is being implemented with fidelity across all teachers using the program. To reiterate, it is essential that all teachers using the program fully apply the following implementation guidelines as prescribed. That being said, there are optional parts to the program as well as ancillary materials that provide you with the flexibility you need to address unique student needs or contexts. We trust your professional judgment and ask that you try to implement the program as best you possibly can while meeting your students’ instructional needs. Again, thank you for your participation in this study. You are an integral part of this study and we appreciate your assistance. We look forward to working with you.

Prepared by PRES Associates, Inc. – An Independent Evaluation Company 71
Pearson Interactive Science 2011
Implementation Guidelines
Organization of the Program Pearson Interactive Science 2011 program is an inquiry-based instructional methodology organized around the 5Es:
1) engage 2) explore 3) explain 4) extend 5) evaluate
The program is designed to be used by teachers with varying levels of comfort with an inquiry-based model of instruction. Teachers less comfortable with inquiry-based learning can use the text as an instructional guide, whereas teachers more comfortable with inquiry-based learning can use more self-directed instruction through hands-on labs and student independent reading on topics. The lessons are organized so that step-by-step movement through the lesson ensures that each of the 5Es is engaged during student learning. Understanding by Design is an organizational strategy that puts the big ideas of science into kid-friendly, big-picture questions about science. Each chapter poses a big-picture question designed to engage student in the upcoming material. Within each lesson, framework questions are posed to organize the presentation of material. These questions are aligned so that coverage of the associated material will help ‘unlock’ the answer to the Big Question. Write-in student editions contain all of the rich content of a textbook combined interactivities to enhance student engagement and comprehension designed to enable students to read, write, draw, graph, apply, and assess all between the covers of a single book. Utilization of the various features or sections of the write-in student edition (Assess Your Understanding, Apply It!, Lab Zone, etc.) will ensure that instruction is framed around the 5Es, and will institute an inquiry-based mode of instruction. Materials Please note that you will have a variety of materials to draw from as you implement the Pearson Interactive Science 2011 program. We do not expect you to use every lab activity or hands-on activity, but we ask that you incorporate each program component into your classes when feasible, including student completion of the Worktext, use of labs, and Scenario-based Investigations. Within each lesson, your Teacher’s Edition (TE) Worktext will reference the Lab Zones, Animations, and activities when appropriate for use.

Prepared by PRES Associates, Inc. – An Independent Evaluation Company 72
Pacing Each Pearson Interactive Science 2011 module is organized into chapters that are further organized into lessons. Each chapter focuses on an overall content area; each lesson within a chapter breaks down the larger content area into instructional units. Typically, there are 5 chapters per module and there are 4 lessons per chapter, with each lesson requiring approximately 3 days of instructional time. Thus, a chapter should be covered in approximately 15 days (or 3 weeks), which includes an additional 2-3 days for a chapter project, review of content, and assessment. Each module has about 5 chapters so overall it is estimated that one module should take about 15-18 weeks (or 3 ½ to 4 months) to complete. Preparing to Teach the Topic & Lesson 1. Be sure to review all of the material in the Teacher Edition (TE) Worktext, Lab Zone kits, and Scenario-Based Investigations aligned with the upcoming lesson. Pay particular attention to the Big Questions and Lab Zones to see how you can incorporate hands-on learning into your instruction, and how the activities relate to the overall theme of the chapter and lesson. Also review the Apply It! and Assess Your Understanding sections to understand when these informal assessments will occur. Assess Your Understanding sections can be printed out, administered, and collected for ease of use. 2. Pay particular attention to upcoming Animation activities in the Worktext, and Lab Zones, to ensure quick and efficient implementation of these activities during class. Teaching the Topic & Lesson Chapter Opener: The Big Question is the big-picture, Understand By Design question that is designed to engage students in the upcoming work of the lessons. This question serves as the over-arching theme for the entire chapter, and each lesson is designed to present the content necessary to ‘unlock’ the answer to the Big Question.
Check for Understanding – ask students to check their own understanding by completing the short assessment at the beginning of each chapter
Vocabulary Skill – helps students compare every day meaning of important vocabulary to scientific meanings
Chapter Preview presents the skills and vocabulary to be learned, organized by lessons. This should be reviewed with your students
Lessons: Questions aligned to the overall chapter Big Question are presented to organize the content of the lesson. In support of these questions, instructional content is presented to students in text and picture form. Embedded in the Worktext around the primary text content are various sub-sections aligned to the 5Es:

Prepared by PRES Associates, Inc. – An Independent Evaluation Company 73
ENGAGE The Big Question – Introduce the Big Question at the beginning of a new topic and
reference the Big Question throughout the chapter. Assign the Explore the Big Question activity sections in the Worktext
Check Your Understanding – Have students complete the Check Your Understanding sections of the chapter
My Planet Diary – Begin each lesson with My Planet Diary EXPLORE Inquiry Warm-Up Lab – We ask that you complete the Inquiry Warm-Up Lab in
EACH lesson. Labs are used as an introduction to an upcoming lesson or chapter. After the Inquiry Warm-Up worksheet (optional) – Use the After Inquiry Warm-Up
worksheet to show what students learned EXPLAIN Vocabulary – review vocabulary section of Worktext Figures/Activity Art/Animations – use these to reinforce instruction Key Concept Summaries (optional) 21st Century Skills (optional) – Use 21st Century Skills section of your TE to reinforce
these skills Differentiated Instruction (optional) – use the Differentiated Instruction activities noted
in your TE ELABORATE Apply It! – Assign the Apply It! Activity sections in the Worktext Quick Lab – Complete 1 Quick Lab per lesson (Note: there may be multiple labs per
lesson, please select one per lesson). Do the Math! – Assign Do the Math! Activity sections in the Worktext Lab Investigation – Complete 1 Lab Investigation per chapter
EVALUATE Assess Your Understanding – Review answers to Assess Your Understanding sections of
the Worktext Study Guide (optional)
Reorganizing the Program The chapters within each module available for instruction during the pilot of the Pearson Interactive Science 2011 program can be taught in any order. However, lessons within each chapter should be covered in the order in which they are organized, with each lesson providing content and inquiry-based learning in support of the chapter Big Questions. The TE Worktext will alert the teacher when it is the appropriate time to incorporate labs or other hands-on activities into lessons.

Prepared by PRES Associates, Inc. – An Independent Evaluation Company 74
Some Final Things to Remember Remember that a chapter lesson should take approximately 3 days to cover. Be sure to
incorporate at least 1 Inquiry Warm Up Lab and 1 Quick Lab per lesson, while maintaining a 3-day pace per lesson. Also, be sure to complete 1 Lab Investigation per chapter. The labs and other applied activities are the key to engaging students in learning.
Please note that the Pearson Interactive Science 2011 program is designed to “have it all” and teachers should not need to go to other sources for their problems or activities. In fact, the activities and problems included in the Pearson Interactive Science 2011 program have a clear rationale and thought process behind them and therefore are considered essential to the program. While it is sometimes common that teachers substitute their own activities instead of using the ones included in a program, we ask that you use the activities and problems included in the program and do not substitute them during the pilot study.
Following the lessons as outlined, and making use of the various hands-on activities and labs ensures that you are instructing in a way that models the 5Es and an inquiry-based instructional process capable of engaging students in higher-order learning.
It is important that students complete and use the SE Worktext in their entirety, including the Check Your Understanding sections at the beginning of each chapter and the Assess Your Understanding and Apply It! sections embedded throughout the lessons. These worktexts serve as a record or journal of their learning throughout the chapters.

Prepared by PRES Associates, Inc. – An Independent Evaluation Company 75
Appendix C: Description of the Regular (Non-Pearson Interactive Science) Science Curriculum and Resources
The curriculum used by the 6th grade teachers at School A and School C consisted of the Prentice Hall Science Explorer program, 2005 edition and 2000 edition, respectively. Both teacher and student texts provided by the program were comprised of a variety of ancillary resources including lab materials, videos and other resources. The program features integrated math and reading support activities and differentiated instruction. The teachers at School A also relied on teacher created and collected lab activities to supplement the Science Explorer textbooks in order to meet the needs of students. In contrast, the 6th grade teacher at School C relied more heavily on the Prentice Hall Science Explorer book.
It should be noted that the new Pearson Interactive Science program represents a major
departure from the prior Prentice Hall Science Explorer program. The new program is specifically based on Understanding by Design and 5Es (Engage, Explore, Explain, Extend, and Evaluate) conceptual framework for instructional design. The program provides a format that creates and focuses on a variety of opportunities for students to think and write about science. For example, students are able to depart from standard note taking practices and are actually encouraged to write in their worktexts. As well, features like Big Ideas and the Big Question expose students to critical questions and statements throughout the chapter versus at the end only. Another unique feature of the new Pearson Interactive Science program is the uniform lab format and teacher lab resources that are provided together in the lab book. The combination of these distinct program components separates the Pearson Interactive Science program from the 2005 Science Explorer program.
The curriculum used by the 7th grade teacher at School C consisted of teacher developed
materials and lab activities. The teacher has taught earth science for 12 years and stated that he had been unsatisfied with the earth science materials available and developed his own instructional materials over the years based on state standards. This teacher prefers an inquiry-based approach and regularly utilizes questioning strategies to develop higher-order thinking skills as well as custom lab activities for instruction.
The curriculum used by the 8th grade teachers at School A and School B consisted of the
2007 edition of the Holt, Rinehart and Winston Science and Technology: Physical Science book. This program contains chapter labs for skills practice and model making, as well as quick labs. The program has a strong focus on math as well as an essential understanding component focusing on making connections to other sciences and real world activities. Online Internet activities are also associated with each chapter. Online activities include resources for the teacher and student, reference materials, and links for related science information.

PO Box 10730 Jackson, WY 83002 Phone: 307-733-3255, Fax: 307-222-0312 [email protected]
PRES Associates, Inc.