a photoelectric recording interferometer for … method is given for the photoelectric recording of...
TRANSCRIPT

Journal of Research of the National Bureau of Standards Vol. 47, No. 2, Augusll951 Research Paper 2230
A Photoelectric Recording Interferometer for Measurement of Dimensional Changes 1
Richard N. Work
A method is given for the photoelectric reco rding of light intensity at a refere nce point in an imarre of an interference pattern for the automatic plotting of friDge count versus thermocouple elcctromotive force in interferometric dilatometry. Application of the technique to the measurement of coefficicnts of expan sion and to the determination of t ransit ion temperatures in rubber-like materials over a temperature range of - 185 0 to + 1850 C is given. Transitions can be located to a precision of ± 0.5 degree C and coefficients of expansion found to a precision of ± 5 percent.
1. Introduction
Many investigations require a study of the changes in dimension of a substance that take place upon a change in temperature. The temperatures at which phase transitions or second-order tran3itions occur may be located from such data, and the values of the expansivities at various temperatures may be found.
Crystallization in rubber, for instance, has been studied by means of X-ray diffraction, birefringence, specific heat, interferometric, and volume dilatometric methods. The second-order transition of rubber has been studied by volume dilatometry, interferometry, specific heat, and index of refraction measurements.
The study of transition phenomena by the interferometric method requires no confining liquid, may be a<;lapted. to. wide te~pera,t:~ll'e ranges , . and. is. s~miautomatlc 111 operatIOn. I he applIcatIOn ]s lImI ted only to materials that do not flow under small stress.
This paper deals with an improved interferometric method of determining the relationship between length and temperature of solid materials. Novel features of the present work inelude the photoelectric counting of fringes, the automatic plotting of fringe count against thermocouple emf, and the easy adjustmen t of the fringe pattern. Illustrative .data obtained from measurements on rubber are glVen, but the appli cation of the method described is not restricted to this type of material.
M erritt [1] 2 and Saunders [2] have described in detail the interferometric apparatus and procedure. The application of the method to m~asurements on rubber-like materials has been descnbed by Wood, Bekkedahl, and Peters [3]. The method may . be described very briefly as follows. If tl:e separa.tIOn of two optically flat, transparent plates ]s de.te,rmll1ed by the thickness of thl'ee spacers, a few llllllImeters thick but equal in thickness to within a few wavelengths of light, and if thes~ pl.ates are illuminated with parallel monochromatlc hg.ht normal to. the plane of their faces , a pattern of 111t~rference frmges will be observed. If, now, the tlucknesses of the specimens are caused to change by a variation in
1 The work reported here was supported by the Office of ""aval Research and the Office of the Quartermaster General as part of Project ONR (QMC) NR-
03~1i~tres in brackets indicate the literature references at the end of this paper.
temperature, the separation of the plates will be altered, and there will be a corresponding variation in the fringe pattern evidenced by a motion of the fringes. The change in separation of the plates at a given point is related to the motion of the fringes by the following relation
(1)
where M is the change in separation; t::.N is the number of fringes passing the point of reference ; and " is the wavelength of light used. By the use of a suitable illuminating and viewing instrument, the motions of the fringe pattern can be measured quantitatively, and the chango in dimension associated with a given temperature interval can be obtained from eq 1.
The visual interferometric method requires continuous and undivided attention, which may account for the fact that its adoption has been limited. Variolls photographic methods of recording the changes in the fringe pattern have been developed [4, 5, 6] to eliminate this objection. A photoelectric method of recording the fringe count shows certain advantages over the photographic methods, ineluding the elimination of film-processing and the presentation of data on a strip chart in a form suitable for immediate determination of tran3ition temperatures and estimates of expansivitie<;. The quantitative determination of the coefficients of expansion requires less processing than other interferometric methods. The course of a measurement can be followed and the procedme modified when it is seen to be necessary. The speed to this photoelectric method can be mado sufficiently high to be able to count the rapidly moving fringes during rapid change in volume that accompany phase transitions.
The photoelectric method utilizes the changes in light intenaity at a reference point in the fringe pattern as the fringes move past this point. These changes are detected by a photomultiplier tube, and the amplified output of the tube is automatically plotted against time on a strip-chart recorder. A switch, actuated by the recorder movement, produces a current pulse upon the passage of each
80

5 4 3 1 2 9 12 fall above or below the opening and ar e stop ped.
~8 FIGURE 1. Optics of the inte1Ieromet1'ic illu minating-viewing
instl'ument. Src text for ex planation of numbered ite ms. Enlarged section of 6, i. and 8 is
shown at the right..
fringe. Simultaneously, the temperaLure of Lbe speeimen, as indica Led by Lbe emf of a Lhermocouple embedded in a piece of maLerial of sim ilar size to Lhespecimen, is ploLLed against fringe co unL on a second s tripchart r ecorder , which has been so modified that Lhe curren t pulse from Lhe time-intensi ty recorder actuates a mechanism that moves the char t a unit distance for each fringe.
2. Apparatus
2.1. Interferometer
A Pulfrich type [7] viewing instrument, similftr to that described by :'ferrit t and modified according to figure 1 forms the opLical par t of Lhe apparaLus used here. The ligh t source is a helium t ube, 1, located above a small ri gh t-angle reflecLing prism, '2, which places tbe cfl"ecLive source very near to the optic axis of the ins Lrument. After traversing an iris diaphngm, 3, which limits the effective size of the source, the rays are rendered parallel by the lens, 4. The lighL is deviated t bTough a pproximately 90° and dispersed in passing through the Pellin-Broca prism, 5. By rotating this prism about an axis perpendicular to the plane of the paper , ligh t of a wavelength corresponding to anyone of the spectral lines in th e source may be made to fall perpendicularly upon the interferometer plates, separated by three samples, 6. The rays reflected from the bottom surface of the top plate, 7, and from the top surface of the bot tom plate, 8, in terfere in a manner determined by the separation of the plates and form a pattern of interference fringes. The two surfaces of eaeh interferometer plate are inclined at an angle of 20 minutes to eliminate unwanted reflections from the upper surface of the top pla te and the lower surface of the bo ttom plate . The refleeted light return') through the prism and collimating lens to form an image of the effective source in the lower half of the iris diaphragm, through which the light passes to t he photoelectric detector. Images corresponding to other wavelengths present in the souree
81
An image of the interferometer phtes is formed by lens, 9, and falls upon a minor, 10, inclin ed at an angle of 45° to the beam. This mirror, which contains a small aperture about 0.1 mm in diameter, permi ts inspect ion of the image Lhrough the side tu be with the aid of lens, 11. Light passing t hrough the aper ture , which is about one-fiftieth th e diameter of the image, falls upon the photosensitive surface of the photo-multiplier tube, 12.
Of t he various spectral lines presen t in th e 1igh t from the helium discharge tube, the yellow line, 5876 A, is used because of its good visibility and beeause it shows the highest sensi tivity-intensi ty product for the photo tube used.
2 .2 . Specimen Holder
Th e specimen holder , figure 2, is des igned for use ,,"ith rubber and rubber-like maLerials to be measured over a temperaLure range f rom - 185° Lo + 185° C. The discussion of th e apparatus is divided for conveni ence into two sect ions, optical ancl thermal.
a. Optical
For Lhis expe riment, a useful fri nge pattern is obtained when the surfaces of the two transparent plates are nat wiLhin Lwo to three wavelengths and parallel within 20 wavelengths. If these surfaces a rc noL parallel within th is limi t, 40 or more fringes will be seen to Lraverse the 2-cm-diam eter plates making visual observations diiflCult . A more serious efrect li es in the fact that Lh e aperLure in the inclined mirror becomes large compared to the wid th of each fringe. The variation in transmitted light upon the passage of a fringe then beeomes too small to b e cl etec ted photoelectrically .
If the material under test is hard , say a m etal or ceramic, a specimen may be ground to one of the rorms recommended by aunders [2], making three connected , supporLing structures the sam e length within a few wavelengths. However, there is co nsiderable difficulty in cutting or molding three specimens of a soft rubber-him material to the same Lhi ckness wiLhin the required tolerance. Accordingly, the specimen hold er has been designed so tha t the three specimens are suppor ted by fused-quartz wedges, which in turn rest upon the bottom in terferometer plate. Then , if th e specimens are fi xed laterally wbile the wedges are movable along a radius, a ver tical adjustment. of the top plate is possible. This motion enables one to bring the top plate in to parallelism with Lhe bottom plate without having to cut the specimens to close tolerances.
The wedges a re 5 mm in width and 15 mm in length and vary in thickness from 2.00 to 2.15 mm. The m aximum travel of the wedge is of the order of 5 mm, allowing a maximum vertical adjustment of 0.05 mm. In practice, the maximum adjustment is used only for material that flows or creeps under the weigh t of the top plate, in which ease the finding of an acceptable fringe pattern is fortui tous. Usually, however, vulcanized rubber samples and many unvulcanized materials ean be easily cut or molded
\

3
A- A
9
12
" 13
I I I L-14 I I
II
6
7
15
5
4
8
10
FIG URE 2. Sample holder. Sec text [or explanation of numbered iiems. E nlarged section of A- A is shown
above .
to wi thin 0.02 mm. The uncertainty in thickness is, therefore, less than 1 percent of the usual thickness of the specimens (2 to 5 mm).
The details of the wedge-adjusting mechanism are shown in figure 2. The wedges, 1, may be moved in radial slots milled in the brass plate, 2. The central
82
portion of this brass plate has been cut out to allow light to reach the bottom interferometer plate. Square enclosures, or wells , 5 mm square, 3, are located above the inner end s of th e wedges, whi ch extend in to the open portion in the center of the brass plate. The specimens he upon the quartz wedges and in these wells, the waUs of which restrain the motion of the specimens when the ,,"edges ar e movcd .
Motion of tbe wedges is achieved by a lever drive, 4, which is coupled to the wedge by means of a wire link, 5. The shaft, 6, fastened to the lever extcnds to the top of the holder where a knob allows the operator to make adjustments when the specimen is inaccessible. The side openings of the holder are closed by means of sleeve, 7.
A window, 9, forms a closure at the top of the specimen holder. To avoid the redu ction in contrast of the image caused by refl ections from the window surfaces, the window is tilted at a small angle to deflect the light ou t of v iew.
Fogging and frosting of the window at 1m," tempera tures are eliminated by passing a stream of dr.v air over it. Frosting of the interferometer pla tes is avoided by circulating dry air in the specinwn chamber .
b . Thermal
The specimens arc cooled by liquid ni trogC'l1 pumpcd from a reservoir by means of a pressure bulb in to a D ewar, 14, surrounding t.he specimen holder. The rate of cooling is determined by the rate at which the liquid nitrogen is pumped into the D ewar. A triangular brass wedge, 10, % in. thick , 2 in . high, and 3-in. base is attached to the bottom of the specimen holder and acts as a h eat transfer patll of variable length and cross section to make the rate of cooling more nearly uniform with variation in liquidlevel. Unless such a device is used , the temperature in the sample chamber drops slowly un til the liquid nitrogen level reaches the bottom of the specimen holder, at which time the temperature falls rapidly, making temperature control difficult.
H eat transfer to the surroundings is reduced by the usc of a Bakeli te tube, 11 , as the center section of the specimen holder . Bakelite washers, 12, between the brass tie rods and the flange on th e top of the specimen hold er and b etween the wedge adjusting rods and the flange, reduce heat transfer along those paths. Further , closure of the space between the D ewar, 14, and the sampl e holder is made by m eans of a piece of Masonite, 13, lined with a soft plush cloth to mak e good contact with the edge of the D ewar . The amount of condensat.ion and frosting on the exposed metal surfaces is small even when the sample is held near liquid nitrogen temperatures for several hours.
The temperature of the sample may be increased by means of a current in a resistance elemen t located in the bottom of the Dewar. The h eater current is adjusted with a variable transformer to obtain a suitable rate of heating.
Dry air passes through a copper tube , 15, a 5-turn helix inside the sample chamber with which it makes
---------

> I
good thermal contact. Thc air strcam then flow in to the sample chamber and stirs the air, insuring a uniform Lemperature in the chamber.
2 .3. Amplifier
The fringe recording circuit consists of a 931Aphotomul tipli er tube to convert light changes in to electric signals, suitable amplifi er stages, and a stri p-chart recorder.
The power supply for the photomultiplier tube is controlled with a variable transformer, allowing a wide range of gain. It is usually operated at abou t 90 vjclynode for optimum signal-to-noise ratio.
The variation in the phototube current is about 5 X 10- 9 amp for the passage from a ligh t band to a dark band of an interference fringe when operated at the conditions noted above. Noise currents from various so urces, namely, the helium tube , pho toLube, stray flelds, eLc., arc of t,he same order of magniLude . Theroforc, a tuned cireuiL is employed in the amplifier to prevent the over loading of the amplifier by noise voltages. S ince the helium t u be is excited by a high-voltage transformer connected Lo Lhe 60-cycle line, the lighL is modula ted with a fund amenLal freq uency of 120 cis. A single-stage triode preamplifier is follo'wed by a two-stage amplifi er with negative feedback over a 120-c.vcle parallel T rejection network. This results in a sharp peak at 120 cycles in the gain-frequency characteristic of the amplifier. A redu cLion in noise du e Lo sLray coupling lo the line and poor ftl trring of the power supply could be made by a choice of some other frequency than the line frequ ency for the ('xcitaLion of the helium lamp. Such an expedient wa found to be unnecessary. Th e tuned ampli fier is followed by a phase inverter-detecLor sLage, which converts a single ended al ternating-current signal to a balanced direct-current outpu t" whose level is proportional to the peak input-signal vol tage. The detector stage is followed by a balanced direct-current amplifier with an adjustable time constant. A Lime constant of 1, 2, 4, 6, Ot' 8 src may be chosen by means of a selector switch . The relatively long time constants average any flu ctuations (noi se) in the output that are of higher frequency than 1 to 1/8 cis. The available range permits the operator to choose a time constan t that mostly corresponds to t he frequency of variation of the desired signal , and that is sufficiently shor t so the signal is not appreciably attenuated. Normally Lh e temperature is varied at a rate b etween 1/2 and 1 cleg/min, which corresponds roughly to a fringe per minu te for r ubber specimens 2 to 5 mm thi ck. In this case the 8-sec time constant is llsed. However , if Lhe sample undergoes rapid crystalli zation, Lhe fringes may move at rates up to 10 or 20/min, in whi ch case the 8-sec time constant would appreciably redure the ampli tude of the output. In this case, a shorter time constant is u sed .
The output of the amplifi er act uates a strip-chart recorder yielding a plot of ligh t in tensity at the phototube aperture against time. The recorder
83
mechanism is fitted with a switcil thn,t is closed once pel' fringe. The switch consisLs simply of a vertical wire, the end of which is engaged by a proj ection on th e recorder movement so as to make a momentary connection with a fixed contact. Contact is made only for motions in one direct ion. The momen tary closing of the switrh operates a re lay, which in turn operates th e fringe-counting solenoid on the temperature recorder.
The temperatme of th e specimrlls is ind icatecl by the emf of two coppcr-constanLan t hermocouples in se ries. Th e reference jun ctions are in an icc-water bath , whereas Lhe other j unctions arc placed in specimens of the same or similar materia l and of sim ilar size to tbose under test. These specimens are placed in t he t llermoeouple wells, 16, figure 2. T he emf is recorded con tinuousl.\· on a recol'ding-poLentiometel'. The recorder scale was expanded to ('over the temperature range - 185° to + 185 0 C in Lhree spans. A precisio n of ± 0.5 cleg at th e low-temperature end and ± 0.2 deg at the hi gh end is attainable. Th e potentiomeLel'-recorde r was calibrated with a lahoralory poten tiometer , a nd calibration scales were made . Emf's co rresponding to tempera lures at 1 deg intervals, the values of wlli ch were Laken from the International CriLical T able, were impressed upon the inpu t terminals of the recording-potentiometer. The poLentiomete r was alJ owed to come to balance at each value of emf and a mark made. Th e temperature corresponding to any point on th e ehar t can then be found simpl.v by aligning the scale on the chart and reading th e temperature "from the scale corresponding to the point on the chart.
The chart paper drive of th e recorder was mocl i6ed so that an im.pulse from Lhe fringe eo unling sole110id would move the papcr a consLan t distance. Th e Brown Electronik r eco rder, model 153Xll , was found Lo be well suited for this modification of the chart mechanism. Other re('orders are undoubteclly as well su ited, but fo r explicitness , th e details of t be modification of the Brown recorder will be given.
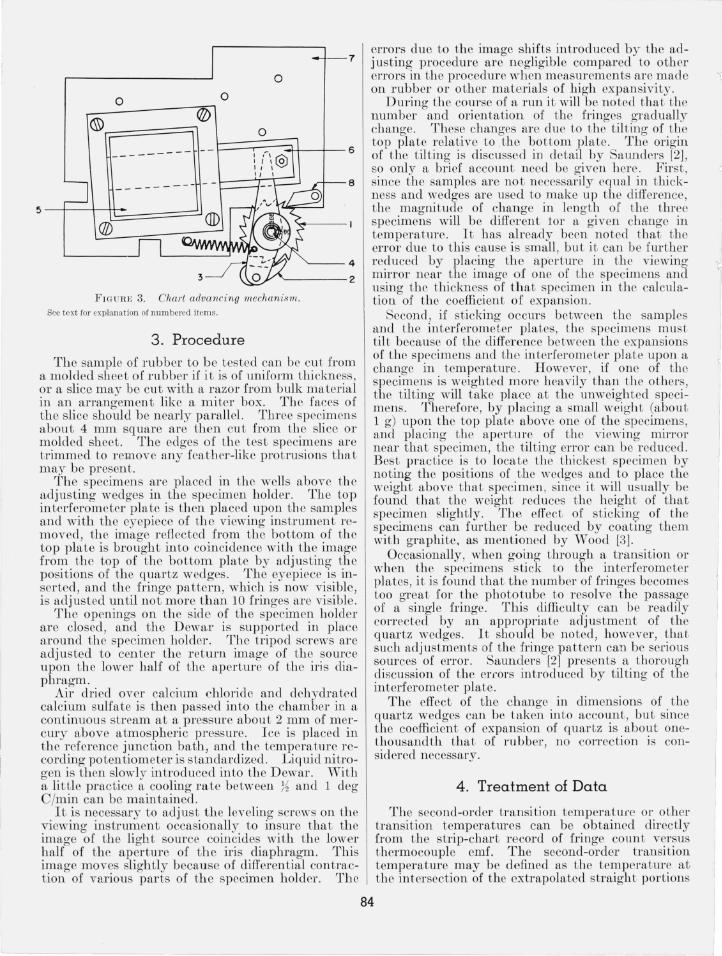
The last six gears of th e charl drive train were removed from th eir suppor ting shafts , th e gear shafts and the automatic s tandardizaLion gears being loft in place. An adapter, figure 3, wa.s made to mount a 17-tooth ratchet gear, 1, drive pawl , 2, and lever, 3, upon the shaft, 4, of the driving gear of tb e chart drum. The solenoid magnet, 5, and armature, 6, which operates the rachet lever is mounted upon a %-in. aluminum plate, 7, whi ch in turn is screwed to the reco rder chass is, using existing tapped holes in the chassis. A hold pawl, 8, has been mounted upon the aluminum plate to preven t th e chart drum from being pulled back by the tension of the unwinding paper .
It is planned to replace the 17 -tooth gear with a 48-tooth rach et and equip the solenoid with an acl.i us table stop. In this way the paper can be advanced in steps of multiples of 0 .025 in. , according to the number of ratchet teeth taken per step .
I t is further planned to add a time-marking pen to the recorder so that th e ehar t record will be complete, including temperature, fringe coun t, and time
o o
o
5,-t1!;:::====::==:J (J])
7
o
8
'------- 4
'------2
FJGURE 3. Chart a.dvancing mechanism. Sec text for explanation of n umbered items.
3. Procedure
The sample of rubber to b e tested can be cu t from a molded sheet of rubber if i t is of uniform thickness, or a slice may be cut with a razor from bulk material in an arrangement like a miter box. The faces of th e slice should b e nearly parallel. Three specimens about 4 mm square are then Cll t from th e sliee or molded sheet. The edges of th e test specimens are trimmed to remove any feather-like protrusions tha t may be presen t.
The specimens ar e placed in th e wells above th e adj usting wedges in the specimen holder . The top interferometer pla te is then placed upon the samples and with th e eyepiece of th e viewing instrumen t removed, th e image reflected from the bo t tom of the top plate is brought into coincidence with the image from th e top of the bottom plate by adjusting th e positions of th e quartz wedges . The eyepiece is inserted, and the fringe pattern, which is now visible, is adjusted until no t more th an 10 fringes are visible.
The openings on the side of th e specimen holder ar e closed , and the D ewar is supported in place around the specimen holder . The tripod screws are adjusted to center the return image of the source upon th e lower half of the aperture of the iris diaphragm .
Air dried over calcium chloride and dehydra ted calcium sulfa te is then passed into the chamber in a continuous stream a t a pressure abou t 2 mm of mercury above atmospheri c pressure. I ce is placed in th e reference junction bath , and th e tempera ture recording potentiometer is standardized. Liquid nitrogen is then slowly introduced in to the D ewar. With a li ttle practice a cooling ra te between Hand 1 deg C/min can be maintained.
It is necessary t o adjust th e leveling screws on th e viewing instrument occasionally to insure that th e image of th e ligh t source coincides with th e lower half of th e aper ture of th e iris diaphragm . This image moves slightly because of differen tial contract ion of various parts of th e specimen holder. The
errors due to the image shifts in troduced by the adjusting procedure are negligible compared to other errors in the procedure when measurements are made on rubber or other materials of high expansivity.
During th e course of a run it will be noted that the number and ori en tation of the fringes gradually change . These changes are du e to the til t ing of the top plate relative to the bottom plate. The origin of the til ting is discussed in detail by Saunders [2], so only a brief account need be given here. First, since the samples arc no t necessarijy equal in thi ckness and wedges are used to make up the difference, the magnitude of change in length of the three specimens will be differ ent 101' a given change in temperature. It has already been noted that the error due to this cause is small, bu t i t can be further r edu ced by placing the ap'erture in the viewing mirror near the image of one of the specimens and using the thickness of that specimen in the calculation of the coefficien t of expansion.
Second, if sticking occurs bctwcen the samples and th e interferometer pla tes, the specimens must til t becau se of thc difference between the expansions of the specimens and the interferom eter plate upon a change in temperature. However, if one of the specimens is weighted more heavily than the others, the tilting 'will take place at the unweigh tecl specimens. Therefore, by p1acing a small weigh t (abou t 1 g) upon the top plate above one of the specimens, and placing the apertme of the viewing mirror near that specimen , the tilting error can be reduced. Bes t practice is to locate th e thickes t specimen by noting the positions of t he wedges and to place the weight above tha t specimen , since it will usually be found that the weight reduces the heigh t of that specimen slightly. The effec t of s ticking of the specimens can further b e redu ced by coa ting them with graphite , as mentioned by Wood [3].
Occasionally, when going through a transition 0 1'
wh en the specimens sti ck to the in terferometer plates, it is found that the number of fringes becomes too grea t for the phototube to resolve the passage of a single fringe . This difficul ty can be readily corrected by an appropriate adjustment of the quartz wedges. It should be noted, however , that such adjustments of th e fringe pattern can be serious sources of error. Saunders [2] presents a thorough discussion of the errors introduced by til ting of the interferometer plate.
84
The effect of the ch ange in dimensions of the quartz wedges can be taken into account, but since the coefficient of expansion of qu ar tz is about onethousandth that of rubber, no correction is considered necessary.
4. Treatment of Data
The second-order transition temperature or other transition temperatures can be obtained directly from the strip-chart record of fringe count versus thermocouple emf. The second-order transi tion tempera ture may be defined as the temperature at the intersection of the extrapolated straight portion

>
W I
IN :~~ I,
I
I I
I I
,
0 0 0
11:25 I
I ,
, I
, q
,
I , t t
r: 54. ~ °c 11:00 , I
+ , m II 11 I
~ I 1
I
l I 1 Ii
,
II' ,
I I'
10: 00
" II
I I I I
I I I
I I , '
I I I, 9 :35
I I' I I I I
-54.5 °c , , i
I
, 9: 15
, ~
,
I
I
9:00 A.M.
I I
I I I
I " , 11 1'1 I, ' I' I.
'i 1: 8:45
I 1illIlTITI
F I GU RB 4. Strip chart record, sodium-potassium cataly zed polybutadiene.
85
of the record above and below tb e [ran ition. The value of the emf corresponding Lo thi s point and the corresponding temperature may then be read direc tly from the char t with the aid of a cali brated scale.
A typical experimental strip-char t record showing the second-order transition at - 54.5° C is given in fig . 4. The material tested is a polyb u Ladiene polymerized at 5° C with a mixture of sodium and potassium as catalyst in a diluen t composed of 150 parts pentane and 50 parLs methylcyclohexane. The specimen thieknes,; was 2.90 mm. T he illumination was the yellow helium line, 5876 A. The top interferometer plate , 2 em in diameLe r weighed 1.58 g. T he second-order transi Lion temperature has been indicated . Tim e Il fl,S also been recorded at. intervals during Lhe run to indicate Lhe rate of cooling or heating.
The data have been replotted as shown in fig. 5. T he temperature had been ob tained from the strip-char t by means of the calibrated scale for every tenth fr inge in the lineal' pOl'Lions and for every other fringe in the curved r C'gions. The change in length in mi cron pel' centimeter, as computed by the meLhod ;;;hown below, was Lhen plotted against temperaL,u['e. It is necessary that the data be treated in tllis manner if valu es of the coeffi cient of expal13ion are desired, as this method of calculation corrects for the nonlineari ty of the temperature-emf curve of the thermoco llple> and for Lhe change in wavE'length of light as the index of refraction of the air in the intE' r-feromdE'I" ('h an ~E''' with tpmperaturE'.
0
-5
E u -10 ":::l..
z o iii z r1. -15 x w
0
0
n
-200
-25 0 -120
/'
I V
f
/ I ,
/ V
/ /
-80 I
-40
TEMPERATURE. °C
/ I
If
I
o 40
FIG UR B 5. Di mensional changes in sodi1Im-potassiu1n catalyzed polybutadiene.
e. Increasing temperature; 0 . decreasing temperature.
1

The expansion in microns per centimeter is calculated according to the following expression
(2)
where D.L is the expansion of the sample over the temperature range To to T ; D.N is the number of fringes passin g the r efer ence point, coun ting from To, between To and T ; A is the wavelength of the light used in air at room temperature; Lo is the length of th e sample at To; and 0 is the correction for change in wavelength with temperature obtained from a table prepared by M erri tt [1].
Experience shows the location of transition temperatures to be reproducible to ± 0.5 deg C, wh ere the transi tion itself is sharp enough Lo be defined with equal or better precision. .Measurements of cxpansivities of rubber show devia tions of about ± 5 percent.
S . Other Applications
In th e case of rubber-like materials of a given sample thickness, say 0 .3 cm, th e passage of 1 to 2 fringes correspond s to a 1 deg C change in temperature above the transition tempera ture while below the transi tion temperature, abou t half as many fringes correspond to the sam e temperature interval. Metals, however, have a coefficient about one-tenth and glasses about one twenty-fifth that of rubber . In tests on metals , th e number of frin ges passing the referen ce mark is reduced by th e same factor for samples of the same thickness, and the number of experimen tal po in ts along an expansion curve is correspondingly reduced . If the expansion curve is linear or only slighLly curved, Lhis is no disadvantage; however, in reg ions of high curvature it is desirable to have a sufficien t number of points to define th e curve with reasonable accuracy. The number of experimental points can be increased by increasing th e thickness of the sample, but there is a limit to th e thickness that can be used without too great a
loss in fringe contrast unless a differential arrangemen t [8] is used . It is possible to in crease the number of experimental points by arranging a number of switches on the time-intensi ty recorder spaced to coun t fractional fringes. It would b e n ecessary before introducing this modification to provide addi tional stabiliza tion of the power supply to prevent errors clue to dri ft of the output indicator.
The m easurem en t of creep under cons tan t load and the m easurem en t ·of Young's modulus und er light compressive loads suggest th emselves as addi tional applications of the photoelectric recording device.
6. Conclusions
The photoelectric fringe coun ting m ethod can be used to advantage in survey work where it is desired to locate transitions in a large number of materials both rapidly and convenien tly. The da ta can be processed wi th a minimum of effor t and a precision of ± 0.5 deg C or better in the location of transition points can be realized. Values of coefficien t of expansion in the case of rubber-like materials are reprodu cible to at least ± 5 percen t.
7 . References [1] G. E. Merritt, An in te rference method of measuring
therma l ex pa nsion , J. Research NBS 10, 59 (1933) RP515. [2] J. B. Saunders, Improved in te rferometric procedure "'ith
appli cation to expansion measureme nts, J. Research NBS 23, 179 (1939) RP1227.
[3] L. A. Wood, N. Bekkedahl, an d C. G. Peters, App li ca.tioll of t he inte rferometer to t he measurement of dimen sional changes in rubber, J. Research NBS 23, 571 (1939) RP1253.
[4] J. B . Saund ers , An in strument for photographing in terference phenomena, J . Research NBS 35, 157 (1945) RP1668.
[5] F. C. ~i x and D. MacNair, In terferomet ri c dilatometer \yith photographic reco rdin g, Rev. Sci. In st r . 12, 66 (1941) .
[6] A. Trobriclge, Photograph of moving in t erference fr inges, J . Opt. Soc. Am. 6, 195 (1922) .
[7] C. P ulfri ch, The Abbe-Fizeau d ilato meter, Z. Inst r umen tenk. 18, 26l (1898),
[8] J. B. Saun ders, Expansivit v o f Vycor brand glaf's, J . Resea rch N BS 28, 51 (l9.J2) RP IH5.
\V AS HINGTON , Drcem bel' 14, ] 950.
86
c: