a performance-based sustainability assessment tool for...
TRANSCRIPT
www.superitn.eu
A Performance-based Sustainability Assessment tool for Road pavements and Railway tracks
João Santos, Sara Bressi, Stefanie Brodie, James Bryce, Veronique Cerezo, Tony Parry, Davide Lo Presti and Gaetano Di Mino
[avniR] Conference, Lille, 9 November, 2017

SUP&R ITN Research Project
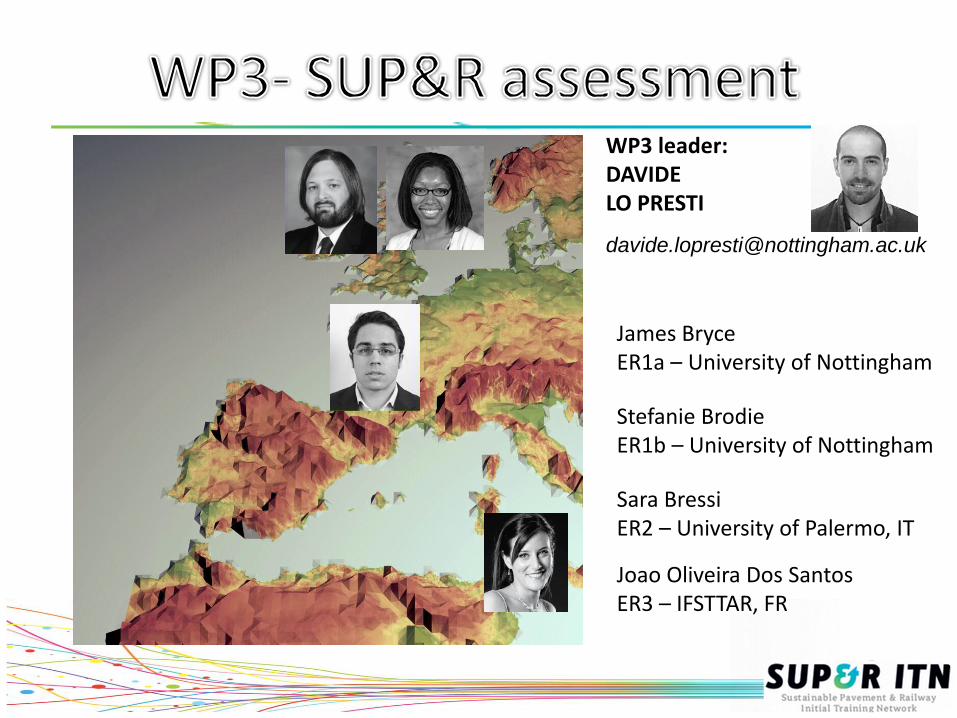
James BryceER1a – University of Nottingham
Stefanie BrodieER1b – University of Nottingham
Sara BressiER2 – University of Palermo, IT
Joao Oliveira Dos Santos ER3 – IFSTTAR, FR
WP3 leader:DAVIDE LO PRESTI
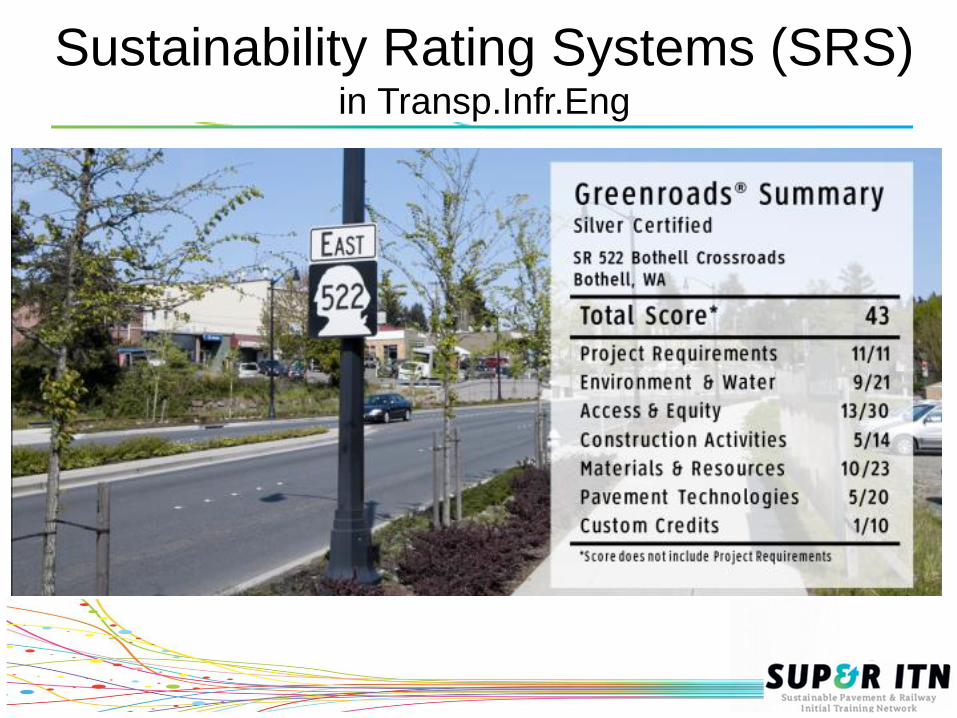
Sustainability Rating Systems (SRS) in Transp.Infr.Eng

EU Stakeholders survey
Tailored methodology with literature review
CASE STUDY
MC
DA
TO
OL
Sustainability performance-based DSSMethodology & Tool development
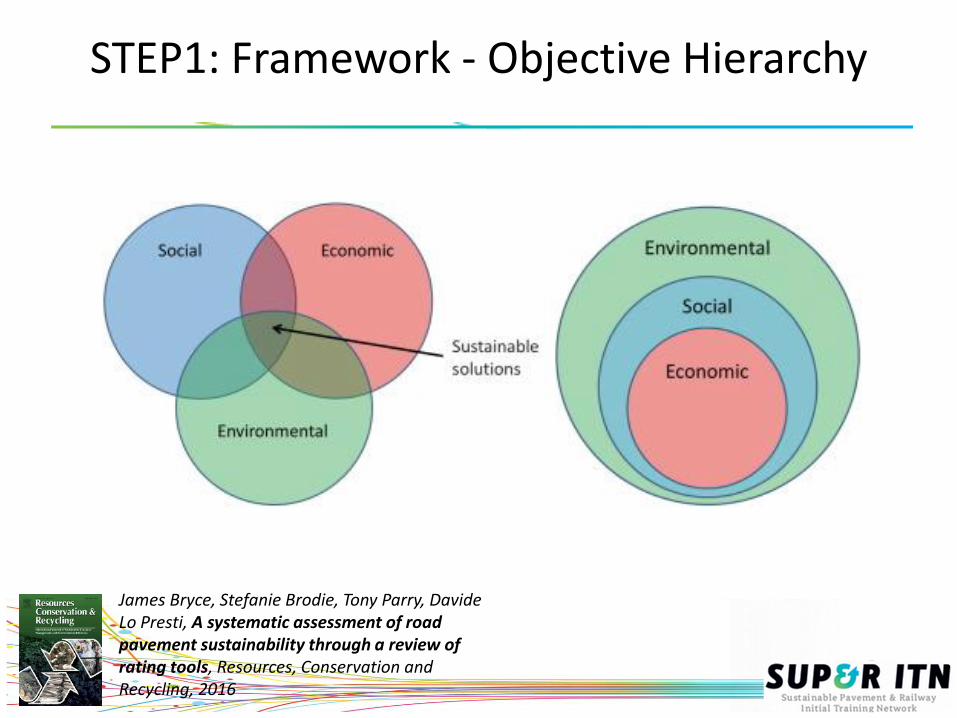
STEP1: Framework - Objective Hierarchy
James Bryce, Stefanie Brodie, Tony Parry, Davide Lo Presti, A systematic assessment of road pavement sustainability through a review of rating tools, Resources, Conservation and Recycling, 2016
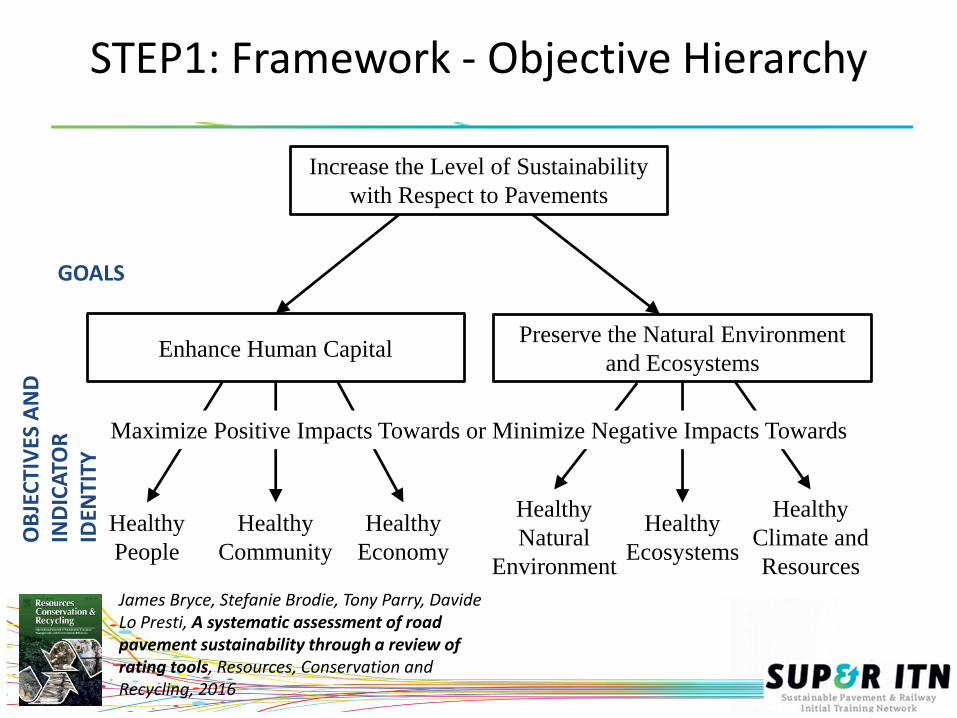
STEP1: Framework - Objective Hierarchy
Increase the Level of Sustainability
with Respect to Pavements
Enhance Human CapitalPreserve the Natural Environment
and Ecosystems
Healthy
Economy
Healthy
People
Healthy
Community
Healthy
Natural
Environment
Healthy
Ecosystems
Healthy
Climate and
Resources
Maximize Positive Impacts Towards or Minimize Negative Impacts Towards
James Bryce, Stefanie Brodie, Tony Parry, Davide Lo Presti, A systematic assessment of road pavement sustainability through a review of rating tools, Resources, Conservation and Recycling, 2016
GOALS
OB
JEC
TIV
ES A
ND
IN
DIC
ATO
R
IDEN
TITY

STEP1: Framework - Concept
DPSIR
&
Performance Management
Responses
Impacts
State
Pressures
Drivers
Performance
Indicators
Targets
Data
Evaluation
Objectives
Goals
James Bryce, Stefanie Brodie, Tony Parry, Davide Lo Presti, A systematic assessment of road pavement sustainability through a review of rating tools, Resources, Conservation and Recycling, 2016
Smeets, E., Weterings, R., 1999. Environmental Indicators: Typology and Review.European Environment Agency, Copenhagen.

Framework - Concept

STEP 2: Definition of indicators (short list)
10
66 indicators
FINAL LIST
(threshold)

11
Indicator Means objectives Description
Greenhouse GHG (primarly
CO2 emission)
Healthy Climate and
Resources
Various gaseous compounds (principally carbon dioxide) that
absorb infrared radiation and trap heat in the atmosphere.
Energy consumptionHealthy Climate and
Resources
Amount of energy consumed in the process of construction or
maintenance.
Recycled content (Slag and
ashes, RAP)Healthy Natural Environment
Recycled content recovered from existing structure of total
discarded/waste material.
Water depletion Healthy Natural EnvironmentAmount of water used for the required operations of
construction or maintenance.
Acidification potential Healthy Natural Environment
Increase in the concentration of the hydrogen ions (H+) in water
and soil. This alters the pH of that medium which may cause
damage to the organic and inorganic materials.
Eutrophication potential (EP) Healthy Ecosystems
Potential presence of nutrients that can cause over-fertilisation
of water and soil which in turn can result in increased growth of
biomass.
Ozone depletion potential
(ODP)Healthy Ecosystems
Indicates the potential for emissions of chlorofluorocarbon
(CFC) compounds and other halogenated hydrocarbons to
deplete the ozone layer.
Safety impact Healthy People Accidents in property damage, medical, and legal costs.
User comfort Healthy PeopleFactor that evaluates passenger’s feeling about vibration
environment.
Noise or vibration reduction Healthy CommunityReduction of noise/vibration level in order to reduce the
acoustic impact on the users and population.
Life cycle cost Healthy EconomyThe total cost of the purchase and installation, and the use and
the maintenance during the life cycle.
STEP 2: Definition of indicators (railways)
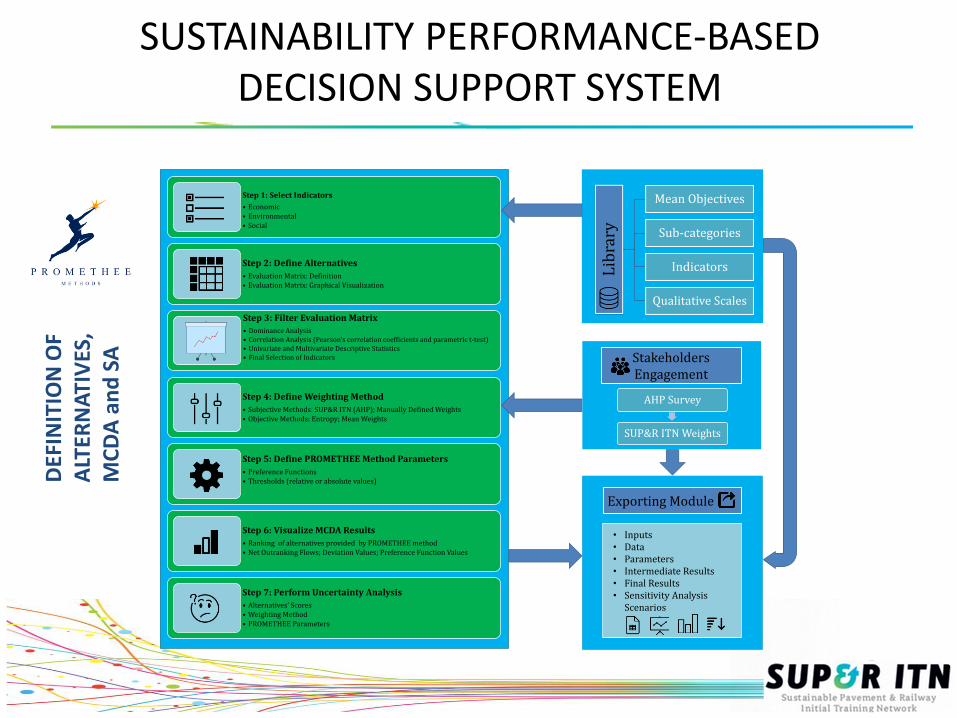
SUSTAINABILITY PERFORMANCE-BASED DECISION SUPPORT SYSTEM
Step 1: Select Indicators
• Economic• Environmental• Social
Step 2: Define Alternatives
• Evaluation Matrix: Definition• Evaluation Matrix: Graphical Visualization
Step 3: Filter Evaluation Matrix
• Dominance Analysis• Correlation Analysis (Pearson’s correlation coefficients and parametric t-test)• Univariate and Multivariate Descriptive Statistics• Final Selection of Indicators
Step 4: Define Weighting Method
• Subjective Methods: SUP&R ITN (AHP); Manually Defined Weights• Objective Methods: Entropy; Mean Weights
Step 5: Define PROMETHEE Method Parameters
• Preference Functions• Thresholds (relative or absolute values)
Step 6: Visualize MCDA Results
• Ranking of alternatives provided by PROMETHEE method• Net Outranking Flows; Deviation Values; Preference Function Values
Step 7: Perform Uncertainty Analysis
• Alternatives’ Scores• Weighting Method• PROMETHEE Parameters
Lib
rary
Mean Objectives
Sub-categories
Indicators
Qualitative Scales
Exporting Module
• Inputs• Data• Parameters• Intermediate Results• Final Results• Sensitivity Analysis
Scenarios
AHP Survey
SUP&R ITN Weights
Stakeholders Engagement
DEF
INIT
ION
OF
ALT
ERN
ATI
VES
, M
CD
A a
nd
SA
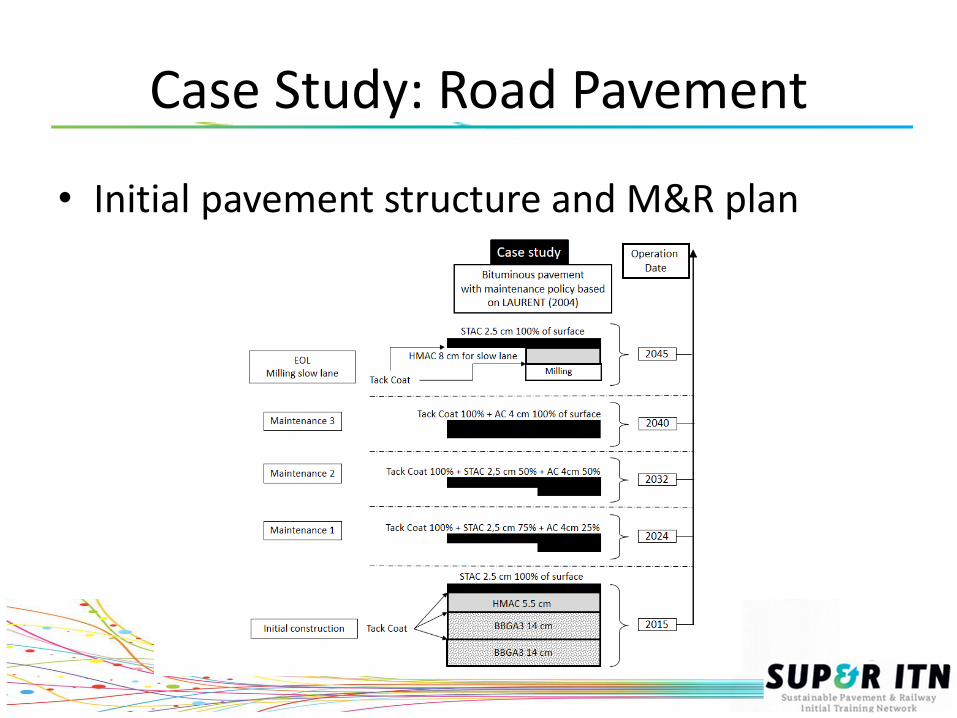
Case Study: Road Pavement
• Initial pavement structure and M&R plan

Definition of the alternative (asphalt mixtures for road surface)
Item
Type of mixture
HMA, 0%
RAP
WMA-
CECABASE®,
0% RAP
Foamed
WMA, 0%
RAP
HMA,
50%
RAP
WMA-
CECABASE®,
50% RAP
Foamed
WMA,
50% RAP
Virgin aggregate
Quantity (%/m) 94.4 94.4 94.4 48.4 48.37 48.36
Water content
(%/a) 3 3 3 3 3 3
RAP
Quantity (%/m) - - - 48.4 48.37 48.36
Water content
(%/RAP) - - - 3 3 3
Bitumen
Penetration grade 35/50 35/50 35/50 35/50 35/50 35/50
Quantity (%/m) 5.4 5.4 5.4 3.2 3.2 3.2
WMA agent
Type - surfactant water - surfactant water
Quantity (%/m) - 0.054 0.077 - 0.054 0.077
Mixture density
(kg/m3) 2360 2340 2260 2370 2360 2360
1

Evaluation matrix

Step 4: Define Weighting Method
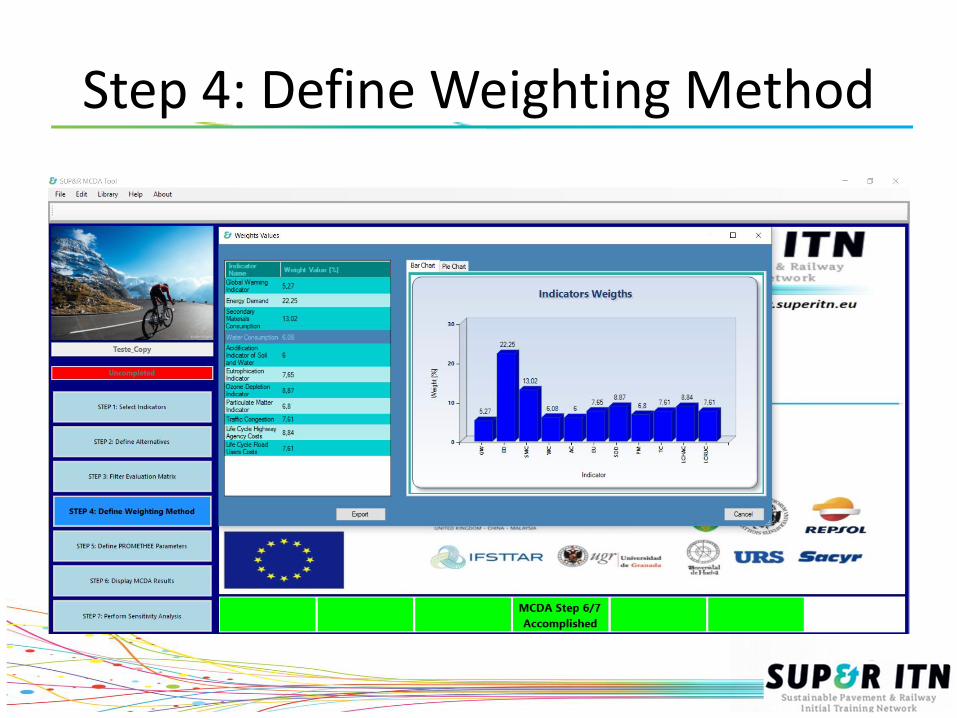
Step 4: Define Weighting Method
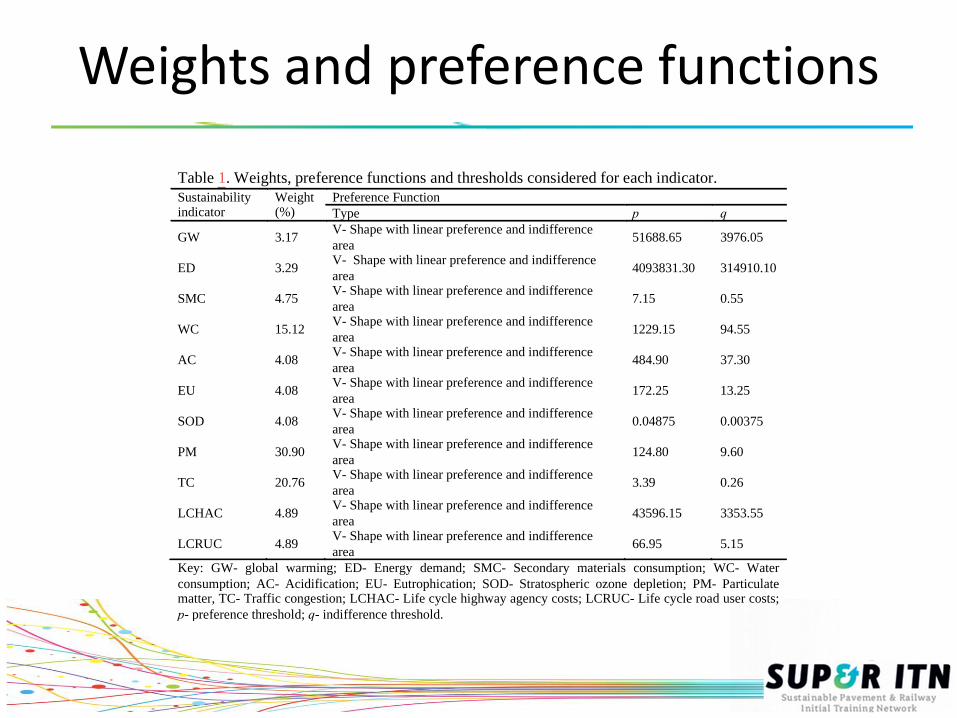
Weights and preference functions
Table 1. Weights, preference functions and thresholds considered for each indicator. 1
Sustainability indicator
Weight (%)
Preference Function
Type p q
GW 3.17 V- Shape with linear preference and indifference
area 51688.65 3976.05
ED 3.29 V- Shape with linear preference and indifference
area 4093831.30 314910.10
SMC 4.75 V- Shape with linear preference and indifference
area 7.15 0.55
WC 15.12 V- Shape with linear preference and indifference
area 1229.15 94.55
AC 4.08 V- Shape with linear preference and indifference
area 484.90 37.30
EU 4.08 V- Shape with linear preference and indifference
area 172.25 13.25
SOD 4.08 V- Shape with linear preference and indifference
area 0.04875 0.00375
PM 30.90 V- Shape with linear preference and indifference
area 124.80 9.60
TC 20.76 V- Shape with linear preference and indifference
area 3.39 0.26
LCHAC 4.89 V- Shape with linear preference and indifference
area 43596.15 3353.55
LCRUC 4.89 V- Shape with linear preference and indifference
area 66.95 5.15
Key: GW- global warming; ED- Energy demand; SMC- Secondary materials consumption; WC- Water 2 consumption; AC- Acidification; EU- Eutrophication; SOD- Stratospheric ozone depletion; PM- Particulate 3 matter, TC- Traffic congestion; LCHAC- Life cycle highway agency costs; LCRUC- Life cycle road user costs; 4 p- preference threshold; q- indifference threshold. 5

Sustainability Ranking
-0,9
-0,7
-0,5
-0,3
-0,1
0,1
0,3
0,5
0,7
0,9
1 2 3 4 5 6
Flo
w
Alternatives
Positive flow Negative flow Net flow
HMA, 0%RAP
WMA,
CECABASE
0%RAP
Foamed WMA,
0%RAPHMA, 50%RAP
WMA,
CECABASE
50%RAP
Foamed WMA,
50%RAP
6th 5th 4th 3rd 2nd 1st
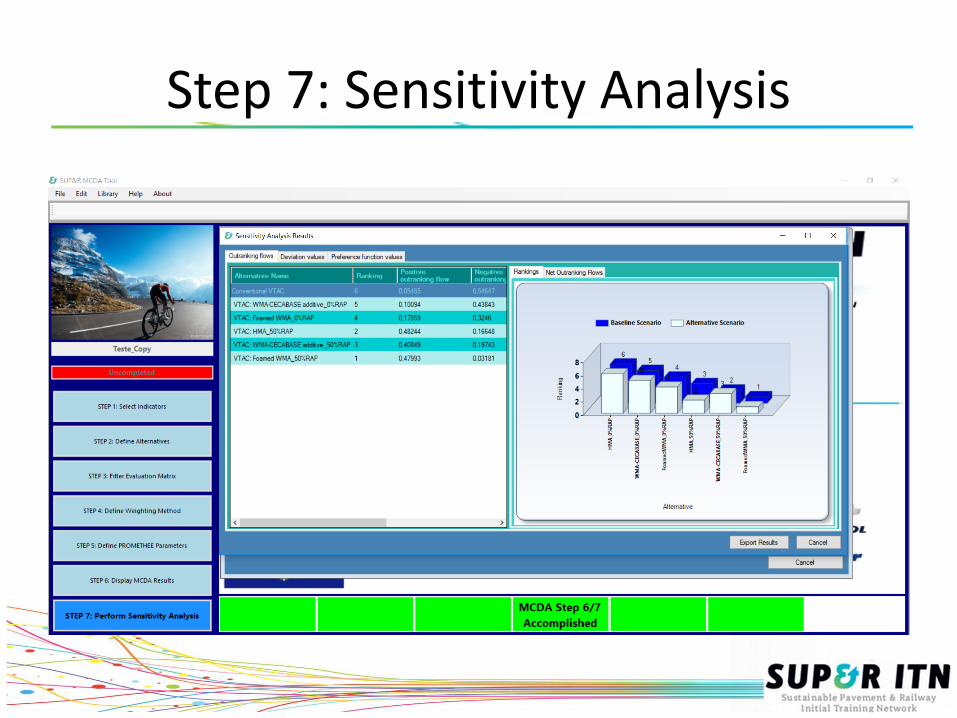
Step 7: Sensitivity Analysis
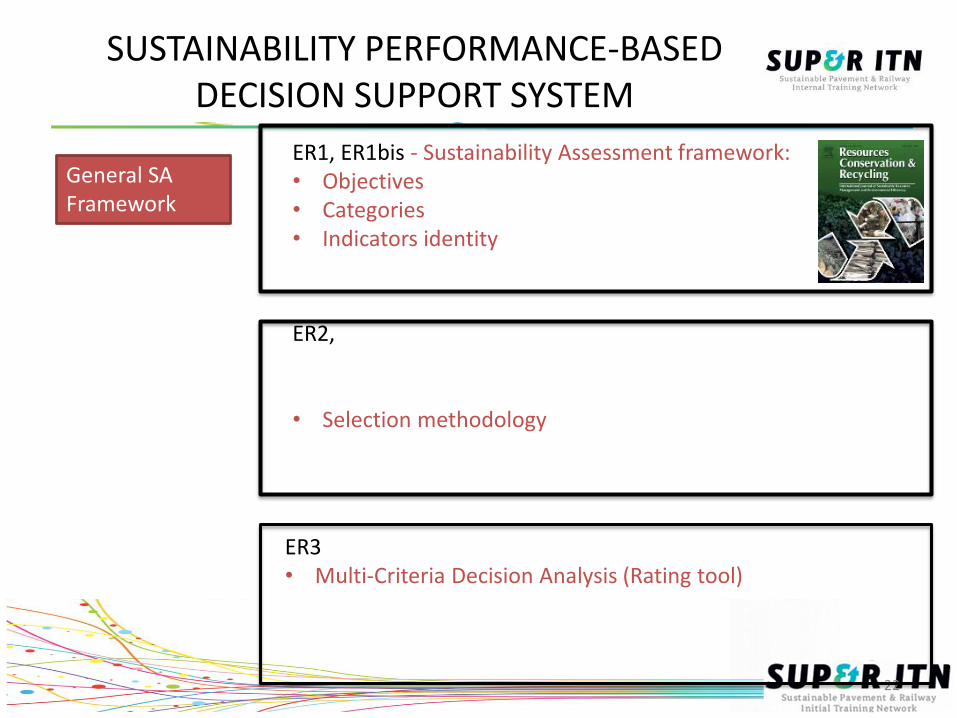
ER1, ER1bis - Sustainability Assessment framework:• Objectives• Categories• Indicators identity
General SA Framework
SUSTAINABILITY PERFORMANCE-BASED DECISION SUPPORT SYSTEM
22
ER2, • Review of system specific scientific papers,
reports, etc• Selection methodology• Railway indicator selection• Sust Assess SUP&R railway technologies
ER3• Multi-Criteria Decision Analysis (Rating tool)• Review of papers, reports, SRS• Pavement indicator selection• Sust Assess SUP&R railway technologies
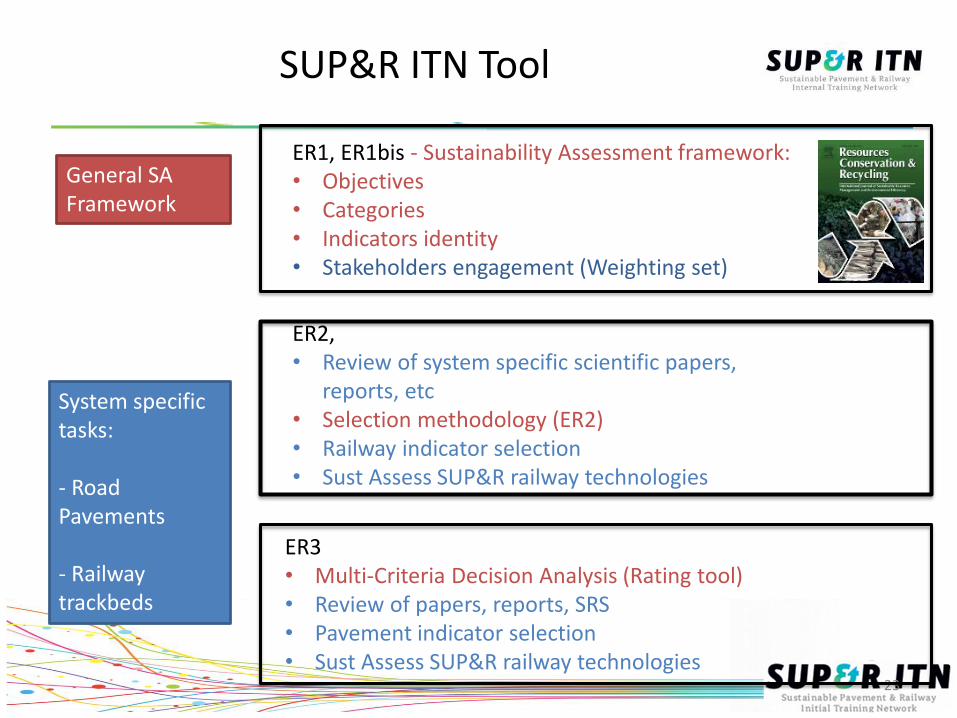
SUP&R ITN Tool
23
ER1, ER1bis - Sustainability Assessment framework:• Objectives• Categories• Indicators identity• Stakeholders engagement (Weighting set)
System specific tasks:
- Road Pavements
- Railway trackbeds
ER2, • Review of system specific scientific papers,
reports, etc• Selection methodology (ER2)• Railway indicator selection• Sust Assess SUP&R railway technologies
ER3• Multi-Criteria Decision Analysis (Rating tool)• Review of papers, reports, SRS• Pavement indicator selection• Sust Assess SUP&R railway technologies
General SA Framework
Acknowledgements
The research presented in this presentation was carried out as part of the Marie Curie Initial Training Network (ITN) action, FP7-PEOPLE-2013-ITN.
This project has received funding from the European Union’s Seventh Framework Programme for research, technological development and demonstration under grant agreement number 607524.
