a perceptive evaluation of volume rendering techniques · destinée au dépôt et à la diffusion...
TRANSCRIPT

A Perceptive Evaluation of Volume RenderingTechniques
Christian Boucheny Georges-Pierre Bonneau
LJK - Grenoble University - INRIA
and
Jacques Droulez
LPPA - CNRS - College de France
and
Guillaume Thibault Stephane Ploix
EDF
The display of space filling data is still a challenge for the community of visualization. DirectVolume Rendering (DVR) is one of the most important techniques developed to achieve direct
perception of such volumetric data. It is based on semi-transparent representations, where the data
are accumulated in a depth-dependent order. However, it produces images that may be difficultto understand, and thus several techniques have been proposed so as to improve its effectiveness,
using for instance lighting models or simpler representations (e.g. Maximum Intensity Projection).In this paper we present two perceptual studies that question how DVR meets its goals, in either
static or dynamic context. We show that a static representation is highly ambiguous, even in simple
cases, but this can be counterbalanced by use of dynamic cues, i.e. motion parallax, provided thatthe rendering parameters are correctly tuned. Besides, perspective projections are demonstrated
to provide relevant information to desambiguate depth perception in dynamic displays.
Categories and Subject Descriptors: I.3.3 [Computer Graphics]: Picture/Image Generation;I.3.8 [Computer Graphics]: Applications; J.2 [Physical Sciences and Engineering]:
Additional Key Words and Phrases: Direct Volume Rendering, perception of transparency, staticand dynamic cues, Structure from Motion, Perspective projection
1. INTRODUCTION
Dense three-dimensional datasets represent a challenge for the visualization com-munity. Ideally, one would like to see at a glance all the data that fill the space, andhave a clear picture in mind of the spatial layout, of the organization within the
Authors’ address: [christian.boucheny, georges-pierre.bonneau]@inria.fr, jacques.droulez@college-
de-france.fr, [guillaume.thibault, stephane.ploix]@edf.frPermission to make digital/hard copy of all or part of this material without fee for personal
or classroom use provided that the copies are not made or distributed for profit or commercial
advantage, the ACM copyright/server notice, the title of the publication, and its date appear, andnotice is given that copying is by permission of the ACM, Inc. To copy otherwise, to republish,to post on servers, or to redistribute to lists requires prior specific permission and/or a fee.c© 20YY ACM 0000-0000/20YY/0000-0001 $5.00
ACM Transactions on Applied Perception, Vol. V, No. N, Month 20YY, Pages 1–0??.

2 · Boucheny et al.
volume of the displayed physical fields. However, such representations are not nat-ural, as the human visual system mainly experiences surfaces that hide one anotherthrough occlusion. Thus, early representations of scalar fields were based on theextraction of characteristic surfaces that could be displayed, for instance surfaces ofisovalues. But these methods require the viewer to mentally reconstruct a volumefrom a sequence of pictures, which is a very complex cognitive task.
To overcome this limitation, it has been suggested to consider dense scalar datafields as volumes of particles with emissive and absorptive properties, like drops ofwater that modify the light rays traversing a cloud. This led to the developmentof Direct Volume Rendering methods that highly rely on transparencies. Thesetechniques have been throughly developed and improved since their birth in thelate 80’s. However, it is surprising to notice that they do not seem to be intensivelyused by final users outside the medical community, as we could observe, despitetheir implementation in most visualization softwares. As was argued by [Hibbard2000], ”all 3D graphics suffer from ambiguity, with many 3D points projected ontoeach point of the 2D screen (or of the user’s 2D retina). This ambiguity is strongestin volume rendering, where the color of each screen pixel is determined by a (theo-retical) continuum of semi-transparent 3D points”, which could be one of the mainreason why scientists do not find volume rendering to be as accurate as other tech-niques. Produced images may look nice, but if no recognizable structure is presentin the data it can be really hard to extract spatial relationships. Another reason forthe lack of interest of scientists in volume rendering consists in the difficulty to tunethe Transfer Function (TF), which is the determinant of the final rendering but of-ten proves complex to adjust even for expert users. But strikingly, when [Kaufmanand Mueller 2004] give a thorough review of research in volume rendering, noneof the near 300 references are devoted to evaluation and validation based on userstudies.
In this paper, we address from the human visual system point of view the ques-tion of the perceived depth order of semi-transparent objects rendered by means ofDVR. The focus is on depth perception, as it is a very important aspect of volumerendering that can be quantified; we do not deal with other perceptive issues suchas pattern recognition or matching. To the best of our knowledge, this paper rep-resents the first insight on the perceptive problems of DVR. We do not intend toformulate definitive conclusions, but rather wish to orient future works on volumerendering. Computational costs related to volume rendering of large datasets oftenlead to quasi-static representations, whereas motion is a strong cue to depth percep-tion. Also, perspective transformations are likely to provide relevant informationto remove depth ambiguities. We thus carried out three experiments, in staticand dynamic contexts, testing the influence of the projection mode in the lattercase. Transparent renderings seem to generate depth order ambiguities, also foundin point-based rendering. Our main hypothesis is that if we are able to perceivetransparency per se, such as in clouds or water, understanding the spatial layoutof data in a translucent material cannot be done in static monocular presentations,but requires dynamic depth cues such as motion parallax. In this paper, monocularwill relate to representations without any binocular disparity, like when one looksACM Transactions on Applied Perception, Vol. V, No. N, Month 20YY.

A Perceptive Evaluation of Volume Rendering Techniques · 3
at a basic computer screen.
The paper is organized as follows: first, we propose an overall review of DirectVolume Rendering in computer graphics, and present some well-known results aboutthe perception of transparency. Then, in a first experiment, we examine how humansubjects are able to discriminate in depth two static objects displayed with DVRtechnique, when color transparencies and accumulations are the only sources ofinformation. To avoid perspective biases, we use orthographic projections. A secondexperiment focuses on the perception of depth in rotating semi-transparent volumes,and the effect of perspective projection for such displays is tested in a third study.
2. VOLUME RENDERING IN COMPUTER GRAPHICS
A complete overview of volume rendering is out of scope for this paper. The readercan refer to [Kaufman and Mueller 2004] for a thorough review. In this sectionwe give the main ideas and milestones, and cite the few papers concerned withperception, validation or user studies.
The idea to use transparencies to represent volumetric data has come from initialworks on clouds rendering in computer graphics ([Kajiya and Herzen 1984], [Max1995]). It has been proposed to use the same raytracing techniques to produceimages of a volumetric scalar field, considering the field as a density emitter withsingle level of scattering ([Sabella 1988]). Such representations aim at consideringall the data for the display, contrary to what is done in surfacic methods suchas isosurface (data thresholding) or cross-section (using cutting planes) renderingsthat require the viewer to mentally reconstruct the spatial structure of the fieldseen across a sequence of images.
The basic idea in DVR techniques, whatever their technical implementation mightbe, consists in an evaluation of the volume rendering integral. The luminancecorresponding to a ray ω cast from an image pixel and crossing the volume along asegment of length D (with parametrization x(λ) along the ray, λ is the distance tothe viewpoint and belongs to [0:D]), is given by:
I =∫ D
0
C(x(λ)).e−∫ λ
0τ(x(λ′)dλ′)
dλ (1)
where C(x) represents the voxel color at x, and τ(x) its extinction coefficient. Thisequation is often evaluated in back-to-front order based on the following simplifi-cation:
I ≈n∑i=0
Ci.
i−1∏j=0
(1− αj) (2)
where αi and Ci stand for the opacity and the color of the ith voxel in the ray.DVR requires the definition of a Transfer Function (TF) φ that maps the scalars(x) associated to voxel x onto luminance l and opacity α values:
φ : s→ (l, α) (3)ACM Transactions on Applied Perception, Vol. V, No. N, Month 20YY.
4 · Boucheny et al.
The Transfer Function critically determines how the data will be perceived in thefinal rendering. Its choice may be a very delicate problem, and some efforts havebeen carried out to automatize this process (for reference, see [Pfister et al. 2000]).Most often, piecewise linear functions are chosen.
Maximum Intensity Projection (MIP) and X-Ray constitute alternatives to optically-based DVR. In the former, only the maximum voxel on each ray is projected on thescreen, whereas the later corresponds to an unordered sum of all voxel values alongthe ray. MIP is very useful for datasets with well-segmented volumes, as is the casewith CT or MR medical data (e.g., angiography). MIP and X-Ray tend to generatemore contrasted images than DVR, improving the visibility of substructures; but,as they are order-independent, they provide no depth cues to the viewer. Contraryto DVR, images created with X-Ray and MIP have fronto-planar symmetry, whichmeans that volumes viewed from front and back result in the same images.
In computer graphics, a lot of work has been devoted to develop existing techniques,either to reduce the computational costs ([Lacroute and Levoy 1994]) or to betterapproximate the volume rendering integral and reduce image artifacts ([Engel et al.2001]). Some works have focused on the improvement of depth perception in vol-ume renderings. [Levoy 1988] implemented a volume rendering pipeline includinglighting calculations to strengthen the perception of surfaces within the volume.[Ebert and Rheingans 2000], in their volume illustration framework, introducedNPR techniques such as silhouette enhancement and tone shading in physics-basedvolume rendering. [Mora and Ebert 2004] suggest to improve MIP and X-Ray us-ing gradient signals inside the volume and stereo-images, whereas [Bruckner andGroller 2007] introduce halos in the volume rendering pipeline to facilitate depthperception. Generally, improvements are measured on the basis of the quality ofproduced images, compared with traditional techniques. For instance [Giesen et al.2007] designed an efficient user study to compare parameters for volume renderingwith a metric based on the perceived quality of produced images. Amongst the fewuser studies led to validate specific volume renderings, we can mention [Kerstenet al. 2006], who use atmospheric perspective and stereo to improve X-Ray-likerendering, and [Ropinski et al. 2006] with NPR-enhancement of MIP images inangiography. [Interrante et al. 1997] and more recently [Bair and House 2007] stud-ied how textured-transparent surfaces could convey depth information, but thisapproach is limited to two wrapped surfaces.
3. THE PERCEPTION OF TRANSPARENCY
Seeing dense and complex transparent media does not correspond to natural situa-tions. We can sometimes look at solid surfaces through translucent media, such asa window or a water surface, or observe complex translucent objects such as cloudsor crystals, but in this last case the layout of matter densities inside the volumedoes not seem obvious.
The perceptual aspects of transparency have been studied for a long time, withparticular focus on the required image conditions for producing the illusion of trans-parent layers. [Metelli 1974] developed a first model postulating that, for a diskACM Transactions on Applied Perception, Vol. V, No. N, Month 20YY.

A Perceptive Evaluation of Volume Rendering Techniques · 5
overlapping two vertical strips with different reflectance a and b and producing in-tersecting areas of reflectance p and q, the level of transparency is given by α = p−q
a−b ,with values close to 1 leading to full transparency. Interestingly, Metelli’s modelis firstly experimental and generative, as it corresponds to a disk (the episcotister)with a reflectance t and an open fraction of α that would rotate quickly over thetwo background strips (leading to p = αa+ (1−α)t and q = αb+ (1−α)t). It canbe noted that Metelli’s model of perceived transparency corresponds to the widelyused alpha-blending equation encountered in computer graphics. Metelli’s modelwas further developed in terms of luminance rather than reflectance by [Gerbinoet al. 1990]. More recently, Singh and Anderson [2002; 2004] developed an al-ternative achromatic model of transparency that relies on Michelson contrasts ofadjoining areas. Such variants are required to account for the two aspects of atransparent layer: its luminance and its transmittance, whereas Metelli’s modelfocuses only on the second aspect. As the conditions and ranges of achromatictransparencies have been assessed in many studies (for instance in [Kasrai andKingdom 2001]), very few works focused on the perceived layout of superimposedtransparent media. [Kersten et al. 1992] used two squares separated in depth androcking back and forth to show that the perceived transparency can bias the depthextracted from motion information, and even alter the impression of a rigid motion.
A fundamental condition for phenomenal transparency - namely the perception ofthe transparency of a surface - to occur consists in the presence of contour junctionsthat correspond to luminance steps between adjoining regions. The shape of thesejunctions (X-, T- or I-junctions) and the layout of luminances around determineif one is likely to perceive transparency, the objects perceived as transparent andthus the spatial layout of the objects ([Anderson 1997]). X-junctions, in which theborders of two objects cross in an ’X’ fashion, are considered as the most informativeregarding the perception of transparency, as they provide more information aboutcontrast variations between superimposed layers, but T-junctions can also elicit adistinct illusion of transparency ([Masin 2006]). The aforementioned perceptualstudies focus on achromatic transparency, i.e. regard objects with a luminance anda transmittance components, but color components can be added in the equations,and conditions for chromatic and achromatic transparencies can be jointly studied,like in [Fulvio et al. 2006].
4. EXPERIMENT 1: STATIC PERCEPTION IN DVR
4.1 Experimental setup
In this first experiment, we question our ability to perceive the spatial layout ofvolumetric objects rendered through texture-based DVR techniques. We conduct athree-alternative forced-choice experiment in which participants are asked to decidehow semi-transparent cylinders are organized in depth. The stimulus we use isintentionally simple, in order to promote transparencies as the unique cue to depth.
4.1.1 Stimulus description. The scene stimulus (Figure 1) is composed of twocylinders with different radii and same length, the larger one (LC) being twice
ACM Transactions on Applied Perception, Vol. V, No. N, Month 20YY.

6 · Boucheny et al.
(a) (b)
Fig. 1. The two-cylinder stimulus of experiment 1. Figure (a) shows a 3/4 perspec-tive view of the two filled cylinders at different depths, with the large one beingempty at its central end. The six main stimuli subjects see during the experimentare illustrated on Figure (b), with the large cylinder being either bright (top) ordark (bottom); for each brightness condition, the large cylinder stands in front (leftcolumn) or in the back (right column) of the small one, or the two cylinders arepositioned at the same depth (central column).
as thick as the smaller one (SC). In frontal view, the two cylinders lie horizontally,vertically centered; one stands on the left side of the display, the other on the rightside. They overlap in image space in a small region that looks like a square-shapeintersection area in the middle of the screen. Three dispositions in depth are pos-sible: large cylinder in front of the small cylinder (depth condition Depthlarge),small cylinder in front of the large cylinder (Depthsmall), and the two cylinders atsame depth (Depthintersect). In this last case, the small cylinder partially extendswithin the large one.
The two cylinders are filled with a constant scalar value s, making them appeareither bright (s = 1) or dark (s = 0.2). All voxels outside the cylinders are set tos = 0, and the part of the LC intersected by SC in frontal view is extruded in allcases, with s = 0, so that the intersection image always correspond to the sameamount of matter accumulated in depth, whatever the geometric organization of thecylinders might be. Preliminary tests pointed out the need to reinforce the volumeappearance of the cylinders when filled with scalar value s = 0.2. To achieve this,we simulated pseudo-lighting in the volumes: the scalar value s(x) of a voxel x in acylinder is given by: s(x) = s0 + aR(x).L, where R(x) is the normalized directionof x from cylinder axis and L the direction of a pseudo-light (s0 = 0.2 or s0 = 1,a = 0.1, light coming from above). Values of s(x) are clamped to [0; 1].
There are thus six predefined position conditions for the cylinders: two for later-ality (large on the left or on the right) and three for ordering in depth, and twoconditions of luminance: LC bright and SC dark, and the converse. Volume datawere precomputed on a regular grid, and the required configuration was loaded on a3D texture before each trial, and displayed in real-time using OpenGL shaders. Forrendering, 100 planes regularly spaced out in the scene cube were blended in backto front order. The Transfer Function we use is linear in luminance and constantin alpha: φ(s)→ (s, 0.25) (see Section 2).ACM Transactions on Applied Perception, Vol. V, No. N, Month 20YY.

A Perceptive Evaluation of Volume Rendering Techniques · 7
As mentioned in introduction, we choose to use orthographic projection; this is im-portant, as otherwise the cylinders would vary in apparent size in the different depthconfigurations, due to linear perspective. Besides, that permits to limit importantcontour information to a few junctions, which constitute fundamental conditionsfor phenomenal transparency (see Section 3), and to remove potential 3D mentalreconstructions interpolated from apparent sizes and intersections configurations.In our images, only X-junctions and luminance information of the intersection areaprovide relevant information for decision. Also, in an attempt to limit the influ-ence of the contribution of the background color, we place a white-noise image atthe rear; the noise is centered at a value corresponding to the average of screenintensities within dark and bright cylinders (white-noise defined in range [0.2 : 1]).
4.1.2 Experimental procedure. Subjects are asked for each stimulus to decide howthe cylinders are organized in depth. Proposed answers are: ”Left cylinder infront”, ”Two cylinders intersecting”, ”Right cylinder in front”.
During the experiment, subjects’ gaze fixations are monitored with an EyeLink R©IIeyetracking system, that also ensures they are correctly looking at the screen. Theysit 0.8 m from a 19-inch LCD screen (resolution 1280x1024), head reposing on achin-rest. Stimulus image subtends approximately 17◦ of visual angle, and theintersection of the cylinders 2◦. For each participant, a calibration of the eyetrackeris performed, then the experiment can start.
An experimental session consists of 5 presentations of each of the 12 possible con-figurations, the full sequence being randomized. In each of the 60 trials, a red crossfirst appears in the center of a blank screen, during 1 to 3 seconds (random time).The subject is asked to fixate the cross, then the stimulus is presented for twoseconds, followed by the answer screen; gaze positions on the screen are monitoredduring stimulus display. The subject makes his choice by mouse-clicking on one ofthe three answers that are displayed on the screen. Then, the next trial starts. Atthe end of the experiment, subject’s reactions and impressions about the task arerecorded.
Finally, a small test is carried out, to determine if the difficulty to perform the taskcan be related to a non-discriminable difference of contrasts between the intersectionareas in the different trial configurations. For each of the two luminance conditions(LC dark or LC bright), the three images corresponding to the square intersectionarea in the separate depth conditions are extracted, and the subject is asked toorder these images from brighter- to darker-looking. As these images correspondonly to the cylinders intersection area, and thus do not contain any transparencycues, subjects are not disturbed by the depth judgments they have made previously.All subjects answered immediately and correctly.
Stimulus presentations last 2 seconds each. A pilot study showed that longer times(we tested 5 seconds duration) bias answers. From our observations, subjects elab-orate more complex per- and between-image cognitive strategies. We thus reducedpresentation times to 2 seconds, in an attempt to reinforce the part of perceptionagainst conceptual reasoning in subjects’ decisions, as we focus on the ability of the
ACM Transactions on Applied Perception, Vol. V, No. N, Month 20YY.

8 · Boucheny et al.
human visual system to perceive depth-organization of semi-transparent objects.
4.1.3 Participants. Ten subjects, ranging in age from 22 to 39, participated inthe experiment. They were all naive as to the goals of the study, and only two ofthem had experience with volume rendering. All had normal or corrected-to-normalvision. Before they went through the true trial sequence, they read the experimentalprotocol, practiced on a few trials without head-tracking (trials order differed fromthe real experience) and then were shown again top-front three-quarter views ofsome of the stimuli (Figure 1, (a)). This ensured they correctly understood thetask, and would keep in mind all the geometric and volumetric properties of thestimuli.
4.2 Results
Overall and per-condition mean performances are computed for each participant.Four of the 10 subjects passed a second experimental session with a different trialsorder after a few minutes break. In this case, we compute the average scores forthe two sessions considered as one; we thus end with 10 result sheets.
Averages are illustrated in Figure 2(a). In this depth-ordering task, subject perfor-mances are low, with only 48,1% average correct answers, but clearly above chancelevel (Student’s t-test, p < 0.01). If we analyze the results with respect to depthconfiguration, we notice levels of 71% for case Depthlarge, 29.3% for Depthsmalland 44% for Depthintersect. These results are above chance-level when the largecylinder is presented in front of the small (p < 0.01) or when the two intersect, butnot when the small lies in front of the scene.
Fig. 2. (a) Mean correct answers averaged over all participants and detailed for the three depth
configuration in experiment 1. Error bars represent 95% confidence intervals. Participants overallperformances were low, only slightly above chance level. More correct answers are recorded whenthe large cylinder lies in front, whereas guesses for the small cylinder in front do not differentiatefrom chance. Intersecting cylinders were detected with little more than chance level. (b) Partici-pants mean answers for the three depth configurations in experiment 1. Error bars represent 95%
confidence interval. An important bias towards seeing the large cylinder in front can be noticed,
whereas subjects are less keen on placing the small cylinder closer to the eye.
ACM Transactions on Applied Perception, Vol. V, No. N, Month 20YY.

A Perceptive Evaluation of Volume Rendering Techniques · 9
Fig. 3. In experiment 1, mean correct answers are coherent across the two brightness conditions
(large cylinder bright or dark).
A first explanation of these global results can be found in the mean reported an-swers (Figure 2(b)). In the experiment, participants are biased toward seeing thelarge cylinder in front of the display (48.4% of all answers) or the two cylindersintersecting (40.4%), and reluctant to imagine the small cylinder lying closer to theeye (only 11.2% of answers). We also investigated if the respective luminosity ofthe two cylinders have any influence on subjects’ choices, but performances whenthe large cylinder appears dark or bright look very similar (Figure 3).
It could be argued at first sight that the globally low level of answers giving thesmall cylinder closer to the eye can be explained by the fact that the large cylin-der, occupying more screen space (twice as much as the small does), is likelier toattract viewer’s attention, which could force ”large in front” answers. However,a visual analysis of participants’ gaze trajectories during the trials reveals that inaverage more saccades fall into the small cylinder than into the large. Four typesof ocular trajectories are mainly observed: fixations limited to the intersection area(EMin), center-to-small cylinder exploration (EMsmall), center-to-large cylinderexploration (EMlarge) and between-cylinders exploration (EMboth). Examples ofeach category are illustrated on Figure 4. For all subjects but one, EMsmall dom-inate over EMlarge, with an approximate 3:1 average ratio (EMsmall = 15.1 andEM large = 5.2, with 60 trials per experiment). EMlarge and EMboth are glob-ally equal in size, but with noticeable between-subjects disparities. Gaze fixationslimited to the central intersection area represent approximately half of the trials;they generally correspond to a fixation of either the lateral borders of the cylinder,either one of the two X-junctions present in the stimulus.
ACM Transactions on Applied Perception, Vol. V, No. N, Month 20YY.

10 · Boucheny et al.
(a) (b)
(c) (d)
Fig. 4. Examples of the main gaze profiles recorded across trials in experiment 1. Subjects wouldfocus on the intersection area (a), or visit the small (b) or the large (c) cylinder exclusively, or
jump from one to another (d).
4.3 Discussion
In this experiment, we try to evaluate our visual ability to perceive the correctorganization in depth of semi-transparent objects presented statically and renderedthrough DVR. Such static presentations are likely to occur for large datasets inscientific visualization, due to the computational costs associated with DVR. Thestimulus we use is very simple and results in images that clearly differentiate inregard to contrast, but overall performances prove to be relatively poor, althoughabove chance-level. Results collected in this experiment show that our perceptionof the organization in depth of overlapping semi-transparent objects is weak, andinfluenced by factors other than the sole combination of luminances.
Useful visual information is limited to contrast levels at objects borders and in-tersections, mainly at the central ends of both cylinders. Orthographic projectioneliminates all potential geometric cues. The stimulus was chosen as simple as pos-sible to reduce the influence of complex cognitive strategies on the results. Scenesbuilt from more complex objects may reveal more borders, but the relative spatialcontinuity of the data often leads to a blurring of these information that weakenseven more depth perception.
Thus, traditional static transparent renderings may not appear as effective can-didates to provide a clear understanding of the spatial structure of a volumetricdataset, even if the rendering equation takes into account the depth ordering of thedata, as DVR does.
Some factors might explain at least part of our results. Firstly, the stimulus weuse is highly asymmetric, due to the difference in size of the two cylinders. Wetried to compensate for this point by alternatively presenting the large cylinder onthe left and on the right of the display. On the other hand, this asymmetry isa desired artifact, as it provides viewers with two X-junctions, a very importantcue to transparency (see Section 3). These X-junctions correspond in our case tothe intersections between the vertical end of the large cylinder and the horizontallimit of the small cylinder. Subjects may be biased toward seeing the X-junctionsas the unique transparency border, whereas the central end of the small cylinderis also a transparency border itself. An overview of gaze trajectories limited tothe intersection area make us think this is not the case, but we cannot be totallyconfident on this point. If subjects find it easier – consciously or not – to interpretthe image as containing only one transparent cylinder, the fact that at the X-ACM Transactions on Applied Perception, Vol. V, No. N, Month 20YY.

A Perceptive Evaluation of Volume Rendering Techniques · 11
junction the horizontal border of the small cylinder is larger than the vertical borderof the large cylinder might facilitate the perception of LC as more transparent thanSC. Also, the large cylinder offers a wider surface through which more backgrounddetails can be seen, which might strengthen this effect. And if only one cylinder isperceived as transparent, then it will definitely appear in front of the other.
By reducing stimulus presentation time to only two seconds, we wished to limitas much as possible the influence of more cognitive approaches in the decisionprocess. However, these cannot be totally rejected, as post-experiment introspectivequestions showed. For instance, many participants reported that one stimulusoften influenced the decision they made for the following, which was possible whenconsecutive stimuli were close enough (only depth condition modified). On the otherhand, all but two participants also stated that they were highly uncertain aboutthe answers they gave, and that consecutive stimuli could as well disturb themabout previous answers they gave. The limited presentation time also restricts thepossibility to build firmly anchored strategy based on progressive classification ofthe luminance configurations. We cannot reject the assumption that short-termmemory plays a role in the present experiment, but its effect is not expected tomodify consistently the recorded performances.
Answer times were monitored during the experiment, but not taken into account forthe analysis. Subjects were however instructed to answer as fast as possible, whichwas generally the case (average answer time: 1.9 seconds), but no mechanism wasintroduced to force quick answers. However, mean reaction times show no linearcorrelation with overall performances (R2 = 10−4). We observed a limited biasduring experimental sessions, with participants sometimes positioning the mouseon the answer corresponding to ”small in front”, and then switching to anotherchoice.
5. EXPERIMENT 2: IMPORTANCE OF DYNAMIC INFORMATION IN DIFFERENTDVR TECHNIQUES
Experiment 1 focuses on the perception of depth order of semi-transparent objectsdisplayed statically. However, it has been known for a long time now that we canrecover the three-dimensional structure of an object projected on a 2D screen whena perspective motion is applied to it. This ability to perceive 3D structures from2D velocity fields has been labeled the Kinetic Depth Effect (KDE, [Wallach andO’Connell 1953]) or recovery of Structure from Motion (SfM, [Ullman 1979]). Stim-uli based on a weak perspective or parallel projection are likely to induce a bistableperception, as in the Necker cube : the object is either seen in its correct config-uration and rotating direction or inverted in depth with and opposite motion. Anobserver viewing the stimulus continuously rotating will often experience randomlyoccuring reversals of the rotation direction and object configuration. Extractionof structure from motion can be influenced by other visual cues, such as stereopsis(e.g. [Nawrot and Blake 1989]), but the interplay between transparency and motioninformation has not been thoroughly studied, as most of the works related to KDEimplement point clouds or wire objects. [Kersten et al. 1992] studied how phenom-
ACM Transactions on Applied Perception, Vol. V, No. N, Month 20YY.

12 · Boucheny et al.
(a) (b)
Fig. 5. The rotating cylinder filled with Perlin noise used in experiment 2, seen from top, with
DVR rendering (a). To choose acceptable rendering parameters, we required that a sub-cylinderfilled with maximal value be always visible (b).
enal transparency can alter the perception in depth of two overlapping squares, and[Kersten et al. 2006] analyzed the influence of stereo and atmospheric perspectiveto improve the perception of depth in the X-RAY rendering of a rotating cylinder.
In this second experiment, we look at how volume rendering techniques can conveyinformation about the spatial layout of the supported data in a dynamic context.More precisely, we test the influence of the Transfer Function that associates anopacity and a luminance to every voxel scalar value in order-dependent DVR (seeSection 2), and compare performances to order-independent methods, namely X-Ray and MIP. We try to measure the conditions for volume rendering techniquesto provide non-ambiguous depth cues in a dynamic display. MIP and X-Ray canbe faster techniques, as they don’t require any ordering of data in depth, but assuch they don’t provide any depth cues, which produces strong ambiguities in thedisplay.
5.1 Experimental setup
5.1.1 Stimulus description. For all rendering conditions, the same stimulus is used,based on [Kersten et al. 2006] previous work: a vertical cylinder, orthographicallyprojected on the screen, rotates either to the left or to the right in frontal view(rotation speed: 34◦/s). The cylinder is filled with volume data generated fromPerlin noise functions [Perlin 1985], while exterior is set to 0. The advantage of thisfunction is to provide non-homogeneous data that vary continuously, without anyidentifiable structures in the volume that could cognitively bias subject’s decisions.The Perlin noise value P (x) in a voxel x is defined by:
P (x) =n−1∑i=0
N(bix)ai
(4)
where N(x) is the basic Perlin noise function, and b and 1/a define the relativefrequency and persistence of the summed harmonics, respectively. We chose a =b = 2 and n = 4. Volume data are stored in a 3D texture, and rendering isperformed through 100 planes accumulated back to front. Animation images of therotating cylinders are precomputed, to guarantee that the stimuli will effectivelyACM Transactions on Applied Perception, Vol. V, No. N, Month 20YY.

A Perceptive Evaluation of Volume Rendering Techniques · 13
(a) (b) (c) (d)
(e) (f)
Fig. 6. The 6 cylinder renderings implemented in experiment 2, in frontal view.(a) and (b) correspond to DVR with TF linear in luminance (conditions DV R1and DV R2), (c) and (d) to DVR with TF linear in opacity (conditions DV R3 andDV R4), (e) is MIP rendering and (f) X-Ray.
be presented with a constant refresh rate of 60 images/s. The display appears asa flat rectangle in a static presentation, but motion generates the impression ofa rotating cylinder through KDE. The experienced motion direction (clockwise orcounter-clockwise) straightly correlates with perception of depth within the volume.
Six rendering conditions are defined: X-Ray, MIP and four DVR with differentparameters for the Transfer Function. TF tuning remains a very delicate problemin volume rendering, due to the huge number of candidates. In this experiment,we decided to test two particular cases, one Transfer Function linear in luminance(which we will refer to as DV Rl), the other linear in opacity (DV Rα):
(DV Rl) l(s) = s , α(s) = αl (5)(DV Rα) l(s) = 1 , α(s) = αas (6)
Two values are chosen for α in each condition, based on a simple transparency test:we placed inside our main cylinder, tangent to its border, a small cylinder of sameheight but four times less thick. Scalars inside this test cylinder were given a valueof 1, and values of α were chosen such that this cylinder could be seen when locatedin front and at the rear of the main cylinder. This approximately corresponds tosituations where maximal values can always be perceived, no matter where theystand. We ended with αl = 0.01 and αl = 0.025 in DV Rl condition, and αa = 0.015and αa = 0.025 in DV Rα condition. We will further refer to these conditions asDV R1 and DV R2 (DV Rl equations), and DV R3 and DV R4 ((DV Rα equations)),respectively.
Each of the six rendering conditions is implemented for a cylinder rotating to theACM Transactions on Applied Perception, Vol. V, No. N, Month 20YY.

14 · Boucheny et al.
left and to the right of the display, which results in 12 conditions.
5.1.2 Experimental procedure. Subjects are asked to determine the perceived di-rection of rotation of the cylinder, by clicking with the mouse on the icon corre-sponding to their choice (either ”to the left” or ”to the right”, as they could perceiveit for the ’front surface’ of the volume).
Experimental setup is the same as in experiment 1 (Section 4.1.2), with subject’sgaze position tracked during stimulus presentation. The rotating cylinder occupies14◦ fov vertically, 10◦ fov horizontally, resulting in a maximum speed of 3◦/s invisual field.
An experimental session consists of 5 presentations of each of the 12 possible con-figurations, the sequence of trials being randomized. Each of the 60 trials startswith the red cross fixation, followed by a presentation of the rotating stimulus inone of the defined conditions. After 0.5 second, the answer screen is displayed andthe subject decides the rotation direction. Then the following trial immediatelystarts. At the end of the experiment, subject’s reactions and impressions about thetask are recorded.
The short presentation time – half a second – prevents the occurence of rever-sals.This eliminates the influence of perception bias in case of ambiguities; for in-stance, if two directions were successively experienced for the same stimulus, thenone might tend to answer more frequently ”to the right” than the converse. Sucha preference has been noticed in the experiment, with 65% answers correspondingto ”to the right”.
5.2 Results
Ten subjects participated in this experiment, the same who volunteered for exper-iment 1.
Performances for MIP and X-Ray conditions are very close to chance-level (48%and 54% correct answers, respectively), which is not a surprise as they don’t provideviewers with any depth cues, being order-independent techniques. This validatesthat our stimulus does not include any cue that can be used to solve the task.
DVR leads to very different performance levels, depending on the nature of theimplemented TF. Condition DV Rl (α constant) presents no ambiguity, with 99.5%correct answers. On the contrary, performances for an alpha linear with respectto the scalar value are much more contrasted, with 11% and 79% correct answersfor conditions DV R3 (α(s) = 0.015) and DV R4 (α(s) = 0.025), respectively. Thevalue 0.015 shows a strong ambiguity in the visual display, as performances lie farbelow chance level, which can be interpreted as: ”data at the rear of the volume areperceived closer to the eye as those in front”. A value of 0.025 reveals more correctdepth perception within the volume, but this rendering is still prone to ambiguities,as performances clearly differentiate from perfection (Student’s t-test, p < 0.01).ACM Transactions on Applied Perception, Vol. V, No. N, Month 20YY.

A Perceptive Evaluation of Volume Rendering Techniques · 15
Fig. 7. Correct answers in experiment 2 for the different rendering conditions, with pooling over
both levels for DV Rl. Only DVR with luminance-based Transfer Function provide non-ambiguousdepth perception within the cylinder, whereas linear-alpha TF can be highly unreliable.
5.3 Discussion
Results obtained in this experiment prove that in a dynamic context DVR can leadto a strong perception of the organization in depth of volumetric data, but thatthis can be achieved only through a careful tuning of the Transfer Function (TF).Given the size of potential TF space (for integer scalar values in range [0:255]mapped to 1-byte luminance and 1-byte alpha, there are already (256 ∗ 256)256
possibilities !), we restricted our analysis to as few as two TF sub-classes, thoselinear in luminance and constant in opacity, and the converse. We have shownthat the former produce reliable renderings, whereas the latter are more prone toelicit ambiguous perception of the spatial layout of the data. In general cases, thetuning of the TF is a very complex problem that is solved empirically, even if someattempts to propose automatic methods have been proposed (for reference, see[Pfister et al. 2000]). Today TF are getting more and more complex; non-linearitiesare often introduced, as well as multiple dimensions. Our results, obtained on thevery simple case of linear unidimensional functions, cannot be easily generalized toall potential TF. However, we explicitly show that, even for order-dependent volumerendering, a Transfer Function resulting in a correct discrimination of objects withina volume can disturb our perception of the spatial layout of these objects.
The different techniques and sets of parameters produce renderings with differentcontrast ratios, that were not equalized over the conditions (see Table I). This couldbe a factor modifying the perception of the cylinder motion. For instance, a movingtarget with very low contrast is likely to embed areas seen as flat in luminance,and fixations to such patterns would lead to a percept close to immobility. Inthe present experiment, however, participants reported that they always perceived
ACM Transactions on Applied Perception, Vol. V, No. N, Month 20YY.

16 · Boucheny et al.
Rendering MIP X-Ray DV R1 DV R2 DV R3 DV R4
Mean pixel intensity 170 145 73 114 128 176(in [0:255])
Michelson contrast 0.174 0.235 0.219 0.155 0.1245 0.113
Table I. Michelson contrasts for the different renderings implemented in experiment2.
motion, and only few of them felt that speed might have varied across trials, withslower rotations in condition DV R3, which of course was not the case.
6. EXPERIMENT 3: THE INFLUENCE OF PROJECTION FOR DEPTH PERCEP-TION IN A DYNAMIC CONTEXT
In experiment 2, we voluntary restricted our study to parallel projection, in order tolimit available depth information to the accumumation of transparencies. Indeed,most studies about the kinetic depth effect make use of parallel projections, withthe observation that linear pespective constitutes a reasonable approximation ofparallel projection for small visual angles. However, if this condition is suitable toelicit a three-dimensional percept, the perceived depth in the display often appearsambiguous. A bistable state exists, and subjects are likely to perceive reversals ofthe rotation direction and depth order while continuously observing the motion.
Replacing parallel by perspective projection is likely to positively impact one’s abil-ity to make correct depth judgments, due to the modification of projected velocitiesin the display induced by perspective foreshortening. Indeed, [Rogers and Rogers1992] observed a clear disambiguation by perspective in a task of depth judgmenton translating bands of dots. [Eagle and Hogervorst 1999] pointed out that subjectsbetter discriminate dihedral angles between two sheets in rotation for large displayswith perspective projection. More recently, [Petersik and Dannemiller 2004] pre-sented to naive observers a rotating sphere filled with dots and sometimes reversedits rotation direction during the motion; using different levels of perspective, theydemonstrated that the average number of correctly perceived switch of rotationdirection was clearly influenced by the selected projection.
In the present experiment, we thus test how the use of a natural or exaggeratedperspective projection can facilitate the correct perception of depth in ambiguoustransparent renderings. We also implement renderings based on dots to bridge thegap with stimuli traditionnally found in KDE-SfM litterature.
6.1 Experimental setup
6.1.1 Stimulus description. The stimulus is basically the same as in experiment 2,consisting of a cylinder filled with Perlin noise, with the six volume renderings illus-trated in Figure 6. Two rendering conditions are added to the previously describedones, based on classical stimuli used in KDE experiments (e.g. [Green 1961]). Theyconsist of 2000 white solid dots (one-pixel size) randomly positioned either on thesurface of the cylinder (condition CLOUD-SURF) or inside the volume (conditionACM Transactions on Applied Perception, Vol. V, No. N, Month 20YY.
A Perceptive Evaluation of Volume Rendering Techniques · 17
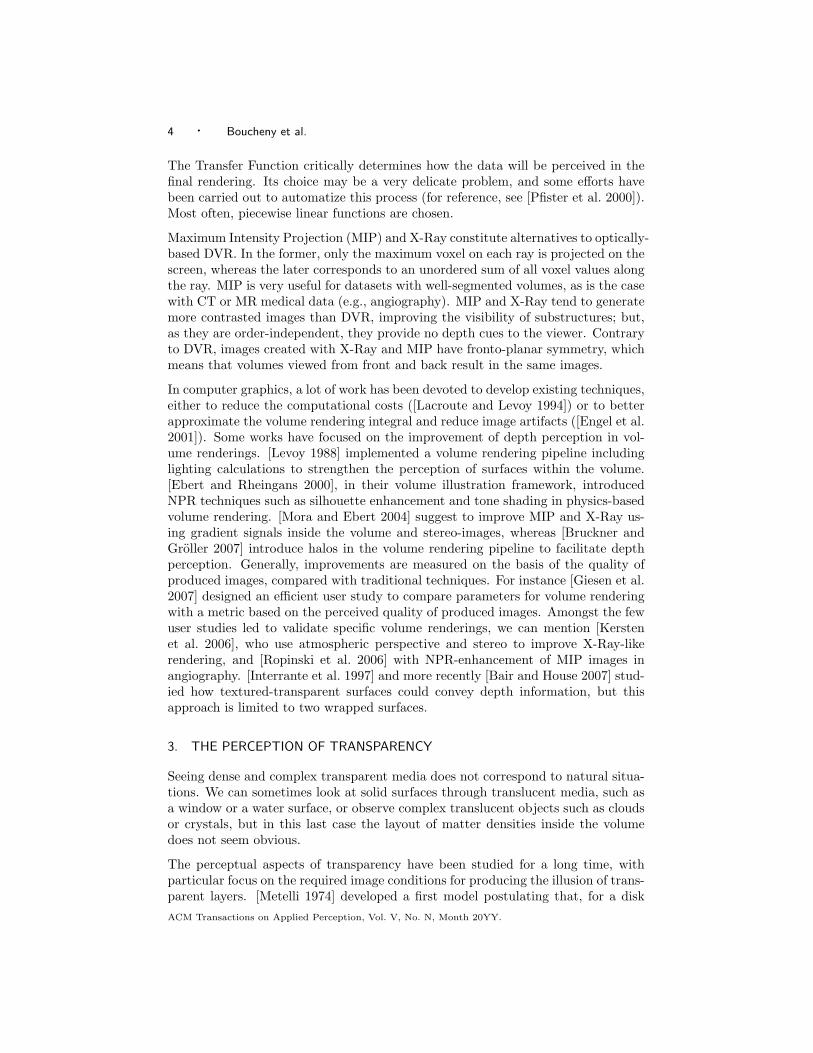
Fig. 8. (a) To limit information extracted from borders in non-orthographic viewing, only the
central part of the cylinder is visible, whereas the rest of the display is masked by a black win-dow (displayed in transparent-blue in the picture). (b) Three projections conditions are used,
corresponding to a virtual viewer placed at infinity (O), 0.8 m (P1) and 0.3 m (P2) from the
cylinder.
CLOUD-VOL). In addition to the orthographic projection (O) implemented in ex-periment 2, we also built two perspective views of the cylinder, corresponding insubject’s space to a viewing distance of approximately 80 cm (condition P1, approx-imation of a natural perspective for the viewer) and 30 cm (condition P2, amplifiedperspective). Perspective projection generates a noticeable difference of speeds be-tween voxels lying at the rear and at the front of the object, which provides subjectswith an additional kinetic depth cue. The ratio of maximal rear and front speedsat screen were computed to be 0.86 and 0.62 in condition P1 and P2, respectively.The virtual positions of the viewer are explicited in Figure 8(b).
The new perspective conditions imply that top and bottom surfaces of the cylinderare visible on screen for transparent renderings. This new information would prob-ably provide subjects with artifactual cues for detecting the rotation direction, aswell as perturbate them when jumping from one trial to the following. To limit suchobject-structure biases, the extremities of the volume are masked, as illustrated inFigure 8(a), so that only the same on-screen center part of the cylinder remainsvisible in each display. As a consequence, it must be noted that some of the relevantinformation for perceptual decision might be removed, which importance cannot beassessed in advance.
6.1.2 Testing for artifactual 2D cues. In conditions P1 and P2, due to the per-spective projection, elements of the volume placed closer to the viewer will movefaster on screen than those located at the rear. This is the key information thatone can use to remove any ambiguity in depth perception, like those arising inexperiment 2 for MIP and XRAY renderings. However, due to the structure ofour stimulus, this also results in an average horizontal screen-speed of the volumebiased towards the direction of rotation of the front surface. As stated by [Sperlingand Landy 1989], we cannot exclude that subjects would answer, consciously ornot, on the basis of this 2D artifactual pattern, thus ignoring or not perceiving the3D structure of the displayed stimulus.
To assess this, we add to the main experimental session test trials in which ahorizontal translation of the cylinder opposes the rotation bias. These tests areimplemented in the amplified perspective display (P2), for the volumetric cloud
ACM Transactions on Applied Perception, Vol. V, No. N, Month 20YY.

18 · Boucheny et al.
(CLOUD-VOL). Three translation conditions are defined: no translation at all(T0), a translation that nulls the mean velocity of the cloud on screen (T1) and atranslation that equalizes the absolute values of maximal rear and front projectedspeeds (T2). As the cylinder in perspective is clipped by the rectangular mask, morepoints can be seen at the rear of the volume than in front, so that condition T2 leadsto an inverted mean speed on screen (if subjects are guided by the average screen-speed of points, they are likely to give false answers). Details of the computationsof the translation are given in Appendix A.
These test conditions are presented to the subjects in two equivalent blocks, beforeand after the main session. Each block contains 5 trials per condition and perrotation direction, which results in 30 randomized trials. Among the potentialreasons for errors in these sessions, errors at the beginning will probably reveala global difficulty with the task while errors at the end might stem from visualtiredness.
6.1.3 Experimental procedure. As in experiment 2, subjects are asked to determinethe perceived direction of rotation of the cylinder, by clicking with the mouse onthe icon corresponding to their choice. They sit 0.8 m from a 19-inch LCD screen(resolution 1280x1024), but contrary to previous experiments their gaze was nottracked in the present study. No feedback about performances is provided duringthe experiment. Before the experiment starts, subjects are explained the taskthrough the presentation of a solid rotating cylinder, and they are told that thenumber of trials with ’to the right’ and ’to the left’ rotations are not necessarilyequalized, in an attempt to limit hysteresis biases. Also, subjects are explicitlyasked to answer as quickly as possible, on the basis of their first visual impression.These two points are made clear so as to limit as much as possible the influence ofperceptual reasoning in the construction of the answers.
The visible part of the cylinder through the mask, not depending on the projection,occupies 10.4◦ fov vertically and 8.4◦ fov horizontally.
An experimental session consists of 3 blocks of trials: beginning test session, mainsession and end test session. Breaks are programmed between sessions, and inthe middle of the main session to impede the occurrence of visual fatigue. Themain session gathers 240 randomized trials, each configuration (rotation directionx rendering x perspective) being presented 5 times. Each trial consists of a redfixation cross followed by a 0.5 s presention of the stimulus followed by the answerscreen. When the subject makes his decision, the following trial starts.
At the end of the experiment, subject’s reactions and impressions about the taskare recorded. In particular, the subject is asked if he perceived more rotations ina specific direction, if the rotation speed appeared constant between trials and if aspecial motion was detected during the test trials.
6.1.4 Participants. Twenty four new subjects, ranging in age from 22 to 58, par-ticipated in this experiment. They were all naive as to the goals of the study, andpresented a great variability of expertise regarding general 3D graphics, from totallyACM Transactions on Applied Perception, Vol. V, No. N, Month 20YY.

A Perceptive Evaluation of Volume Rendering Techniques · 19
naive to daily users. All had normal or corrected-to-normal vision.
6.2 Results
Overall, increasing perspective distortions clearly leads to a facilitation of the per-ception of the correct depth ordering within the volume, as illustrated by Figure9. To assess this, we perform a series of Wilcoxon oriented tests to compare foreach rendering paired conditions P1 vs O and P2 vs P1, with the respective alter-native hypotheses: P1 > O and P2 > P1. Except for DVR1 and DVR2 condi-tions, for which orthographic projection already stands as unambiguous, all testsare significative at 5% level. For renderings that do not provide any depth cue inorthographic projection, namely MIP, X-RAY, CLOUD-SURF and CLOUD-VOL,baseline performances consistently lie around the 50% chance level. RegardingDVR3 and DVR4, mean results in O-projection clearly differ from those obtainedearlier (see Section 5.2 and Figure 7), with 38.7% and 53.3% correct answers thistime against 11% and 79% in experiment 2, respectively. This discrepancy mightreveal an increased diffilculty to perform the task due to the mask hiding importantinformation at the lateral sides of the cylinder in these renderings.
The importance of the perspective factor highly depends on the rendering condi-tion, as shown in Figure 10. For instance, performances for the volumetric cloudrendering increase almost linearly up to 94.6% correctness in P2 condition wherethe surfacic stimulus exhibits only 73.5% mean correct answers. Performances forDVR4 highly resemble those of CLOUD-SURF, while those for DVR3 always lieunder the others. MIP and X-RAY exhibit more complex bahaviours. The formerclearly benefits from a light perspective (P1), following CLOUD-VOL with perfor-mances significantly above DVR4, CLOUD-SURF and X-RAY (Wilcoxon pairedtest, p=0.037), but increasing the perspective produces only little improvement(P2). On the contrary, X-RAY rendering is significantly affected by an exaggeratedperspective (P2) where it significantly outperforms MIP (p=0.036).
The tests explicited in Section 6.1.2 show high performances: in average 95.2%,93.8% and 93.3% before the experiment for T0, T1 and T2 translation conditions,respectively, and 97.1%, 95.7% and 94.3% at the end. These data remain close tothe 94.6% average observed for CLOUD-VOL in P2 projection during the centralexperiment. This demonstrates that subjects clearly understood the task, andat least for this rendering condition answered on the basis of a three-dimensionalperception, which reveals a true KDE effect. None of the participants but onenoticed the additional translation in some of the trials.
6.3 Discussion
Perspective foreshortening induces a difference in projected velocities, and thepresent experiment shows that subjects are able to use this cue to disambiguate thevolume they see rotating, independently of the rendering. For X-RAY, this resultcomplements the work by [Kersten et al. 2006] who tested the influence of stereoand atmospheric perspective on kinetic depth perception. It must be noted thatperspective plays a role even when the rendering does not provide substructures
ACM Transactions on Applied Perception, Vol. V, No. N, Month 20YY.

20 · Boucheny et al.
(a)
●
●
●
● ● ●
●
O P1 P2
0
20
40
60
80
100●
● ●
DVR1
Projection
% c
orre
ct
(b)
●
●●
●●● ●
O P1 P2
0
20
40
60
80
100 ● ● ●
DVR2
Projection
% c
orre
ct
(c)O P1 P2
0
20
40
60
80
100
●
●
●
DVR3
Projection
% c
orre
ct
(d)
●
O P1 P2
0
20
40
60
80
100
●
●
●
DVR4
Projection
% c
orre
ct
(e)O P1 P2
0
20
40
60
80
100
●
●
●
MIP
Projection
% c
orre
ct
(f)O P1 P2
0
20
40
60
80
100
●
●
●
XRAY
Projection
% c
orre
ct
(g)
●
●
●
●
●
●
●
●
●
O P1 P2
0
20
40
60
80
100
●
●
●
CLOUD−SURF
Projection
% c
orre
ct
(h)
●
●
●
●
●●
●
●
●
●
O P1 P2
0
20
40
60
80
100
●
●
●
CLOUD−VOL
Projection
% c
orre
ct
Fig. 9. Subjects performances for each rendering. Box-and-whisker diagrams em-phasize the variability of the results through the population (median, lower andupper quartiles and outliers), whereas the red lines describe the evolution of meanperformances in the three projection conditions. The projection mode reveals aclear influence whose strength greatly varies across renderings.ACM Transactions on Applied Perception, Vol. V, No. N, Month 20YY.

A Perceptive Evaluation of Volume Rendering Techniques · 21
●● ●
O P1 P2
0
10
20
30
40
50
60
70
80
90
100
Mean performances ranked per projection condition
Projection
Mea
n %
cor
rect
● DVR1DVR2DVR3DVR4MIPXRAYCLOUD−SURFCLOUD−VOL
Fig. 10. Mean performances for each rendering plotted against projection condition.
within the domain looking solid and stable in time, as is the case for all volume ren-dering techniques, and especially MIP and X-RAY. This is coherent with the workby [Todd 1985] who reported that KDE does not require projective correspondancein the display along the motion, and is quite robust to noise.
However, the effect of perspective greatly varies across rendering conditions andsubjects. Of particular interest, surfacic and volumetric point clouds are perceivedvery differently, the later presenting better depth discrimination than the former,and appear to enclose average results for MIP and X-RAY. With the Perlin noiseimplemented in the experiment, MIP rendering appears as sensitive as a volumetriccloud of points to a light perspective (P1), but then exaggerating the projectiondeformation has less impact than for points in the volume; this might be due tothe very noisy appearance of this rendering, sometimes described as a ”‘bunchof evanescent snowballs”’. The impact of exaggerated perspective on XRAY maysound quite surprising, as this rendering presents a very blurry, confusing image; itmay reveals subjects’ ability to rely also on second-order motion to compute depthinformation.
The variability in the results of this experiment can be partially explained by thefact that subject are very often biased toward seeing a specific rotation direction in
ACM Transactions on Applied Perception, Vol. V, No. N, Month 20YY.

22 · Boucheny et al.
case of relative ambiguity. For instance, the cylinder in O or P1 projections will bemore often perceived as rotating couterclockwise by some subjects, and clockwise byothers, independently of the actual motion. We measured for cloud renderings thecorrelation between the strength of this bias (measured for a subject and renderingcondition as the maximal number of answers in a particular direction, either righ orleft) and the overall number of correct answers, and found non-neglictible links forCLOUD-SURF and CLOUD-VOL in P1 projection with R = −0.65 and R = −0.67(Spearman’s rank correlation coefficient). This means that a subject’s naturalpreference for a specific rotation direction is sometimes a strong effect that limitsthe impact of perspective cues for correct depth judgments. Though this effect hasbeen reported earlier (e.g. in [Sereno and Sereno 1999]), we are not aware of anyexplanations about it.
To disrupt shape information present in the top and bottom borders of the cylinderin non-orthographic projections, we implemented a mask revealing only the centralpart of the cylinder. However, this mask also increased the complexity of thetask, as can be seen from the difference in orthograhic projection performances forDVR3 and DVR4 compared to results in experiment 2. Also, subjects reported thatthey sometimes perceived more a blurry 2D stimulus composed of floating surfacesthan a real 3D cylinder. Tests performed before and after the main experimentdemonstrated that sujects performed the task on the basis of a 3D perception forthe volumetric cloud in exaggerated perspective, but we cannot assert this is alwaysthe case for other conditions.
7. GENERAL DISCUSSION AND CONCLUSION
The display of space filling data remains a challenge, as it requires on the one handto find renderings that does not hide much of the data to the viewer, which is themain drawback of surfacic techniques, while unambiguously unveiling the organi-zation in depth of these data. Various methods have been proposed, the majorclass being based on physical (optical) models. However complex and informativethey might appear, these renderings implicitly assume that the human visual sys-tem produces accurate perceptions of transparent volumes, whereas we seldom facesuch visual images in our daily life. Interestingly, we find the same physical rootsin early psychological works on the perception of transparency, that were based onthe experimental framework of the episcotister. But, as mentioned by [Singh andAnderson 2002], the relationship between perceptual theory and generative modelsis often left rather vague, and their experimental work emphasizes the deviation be-tween perceptual transparency and Metelli’s episcotister model. In a similar way,we showed that using models of light propagation in dense matter does not nec-essarily elicit a correct perception of the spatial layout of even simple structuresthrough static presentations. Indeed, it appeared that the human visual system isnot tuned to interpret correctly such representations, and may be strongly biased.
Nevertheless, these order-dependent methods operate reasonably well in a dynamiccontext, provided that Transfer Functions are carefully chosen. Exaggerating theperspective proved to be quite efficient in disambiguating depth perception, evenACM Transactions on Applied Perception, Vol. V, No. N, Month 20YY.

A Perceptive Evaluation of Volume Rendering Techniques · 23
for order-independent methods. These results underly the need to focus on methodsthat generate fast renderings, with at least 15 frames per second to preserve shortrange motion ([Georgeson and Harris 1990]) necessary to elicit recovery of Structurefrom Motion ([Dick et al. 1991]). As the underlying algorithms are very costly,requiring intensive per-pixel computations, two approaches can be considered. Atfirst, the development of programmable graphic hardwares (generalized shaders)opens new prospects on the speed of computations. Several works have alreadybeen performed in this direction (e.g., [Roettger et al. 2003]). On the other hand,it is possible to reduce the amount of data displayed per image, considering that ourattention has limited capacity. For instance, psychological experiments have shownthat we are unable to track more than four objects at once, due to the limitation ofour attentional system ([Sears and Pylyshyn 2000]). The definition of objects in avolumetric data field can be quite difficult, and it should also not reduce to classicalisosurface computations. New methods have to be found to facilitate the analysisof space filling data, and this will be all the more crucial as scientific visualizationwill face larger and larger amounts of data, due to reduced computational costs:perceptually enhanced visualizations will become one of the major challenges oftomorrow’s engineering systems.
The results described in the present paper are tuned to a specific task, the judgmentof relative depths of meaningless objects displayed statically or during a 3D motion.Using motion might not always be suitable in the practice of engineers, when staticviews are likely to facilitate the recognition of specific objects or substructures in thedata. The exaggerated perspective we tested in experiment 3 introduces importantdistortions in shape and size, and might be disturbing when comparing phenomenascattered within the volume. Forthcoming perceptual studies might explore morepractical aspects related to volume rendering, such as the accurateness of perceptionof solid objects embedded in a transparently rendered context.
Future works will include further analysis of our perception of depth in transparentmedia. In particular, it would be interesting to understand more thoroughly the biastoward seeing large objects in front of smaller ones that was observed in experiment1. Also, we will clarify the results of experiment 2, and analyze the reasons ofthe reversal or attenuation of depth perception for dynamic displays with alpha-linear TF. Finally, it is also worth mentioning the development of easier-to-usestereoscopic displays; further experiments exploring the power of stereoscopy inDVR have to be carried out.
Acknowledgments
This work was funded by EDF and a CIFRE grant from Association Nationale dela Recherche Technique. The authors thank the persons who kindly gave time toparticipate in the experiments.
REFERENCES
Anderson, B. L. 1997. A theory of illusory lightness and transparency in monocular and binocularimages: the role of contour junctions. Perception 26, 4, 419–453.
ACM Transactions on Applied Perception, Vol. V, No. N, Month 20YY.

24 · Boucheny et al.
Bair, A. and House, D. 2007. Grid with a view: Optimal texturing for perception of layered
surface shape. IEEE Transactions on Visualization and Computer Graphics 13, 6, 1656–1663.
Bruckner, S. and Groller, E. 2007. Enhancing depth-perception with flexible volumetric halos.
IEEE Transactions on Visualization and Computer Graphics 13, 6, 1344–1351.
Dick, M., Ullman, S., and Sagi, D. 1991. Short- and long-range processes in structure-from-
motion. Vision Res 31, 11, 2025–2028.
Eagle, R. A. and Hogervorst, M. A. 1999. The role of perspective information in the recovery
of 3d structure-from-motion. Vision Res 39, 9 (May), 1713–1722.
Ebert, D. and Rheingans, P. 2000. Volume illustration: Non-photorealistic rendering of volume
models. In Proceedings Visualization 2000, T. Ertl, B. Hamann, and A. Varshney, Eds. IEEE
Computer Society Technical Committee on Computer Graphics, 195–202.
Engel, K., Kraus, M., and Ertl, T. 2001. High-quality pre-integrated volume rendering
using hardware-accelerated pixel shading. In HWWS ’01: Proceedings of the ACM SIG-GRAPH/EUROGRAPHICS workshop on Graphics hardware. ACM Press, New York, NY,
USA, 9–16.
Fulvio, J. M., Singh, M., and Maloney, L. T. 2006. Combining achromatic and chromatic cuesto transparency. J Vis 6, 760–776.
Georgeson, M. A. and Harris, M. G. 1990. The temporal range of motion sensing and motionperception. Vision Res 30, 4, 615–619.
Gerbino, W., Stultiens, C. I., Troost, J. M., and de Weert, C. M. 1990. Transparent layerconstancy. J Exp Psychol Hum Percept Perform 16, 1 (Feb), 3–20.
Giesen, J., Mueller, K., Schuberth, E., Wang, L., and Zolliker, P. 2007. Conjoint analysisto measure the perceived quality in volume rendering. IEEE Transactions on Visualization
and Computer Graphics 13, 6, 1664–1671.
Green, B. F. 1961. Figure coherence in the kinetic depth effect. J Exp Psychol 62, 272–282.
Hibbard, B. 2000. Confessions of a visualization skeptic. Computer Graphics 34, 3 (Aug.), 11–13.
Interrante, V., Fuchs, H., and Pizer, S. M. 1997. Conveying the 3D shape of smoothly curving
transparent surfaces via texture. IEEE Trans. Vis. Comput. Graph 3, 2, 98–117.
Kajiya, J. T. and Herzen, B. P. V. 1984. Ray tracing volume densities. In SIGGRAPH ’84:Proceedings of the 11th annual conference on Computer graphics and interactive techniques.
ACM, New York, NY, USA, 165–174.
Kasrai, R. and Kingdom, F. A. 2001. Precision, accuracy, and range of perceived achromatic
transparency. J Opt Soc Am A Opt Image Sci Vis 18, 1 (Jan), 1–11.
Kaufman, A. and Mueller, K. 2004. The Visualization Handbook. Academic Press, Chapter 7,
127–174.
Kersten, D., Bulthoff, H. H., Schwartz, B. L., and Kurtz, K. J. 1992. Interaction betweentransparency and structure from motion. Neural Comput. 4, 4, 573–589.
Kersten, M., Stewart, J., Troje, N. F., and Ellis, R. E. 2006. Enhancing depth perceptionin translucent volumes. IEEE Trans. Vis. Comput. Graph 12, 5, 1117–1124.
Lacroute, P. and Levoy, M. 1994. Fast volume rendering using a shear-warp factorization ofthe viewing transformation. In SIGGRAPH. ACM, 451–458.
Levoy, M. 1988. Display of surfaces from volume data. IEEE Computer Graphics and Applica-tions 8, 3, 29–37.
Masin, S. C. 2006. Test of models of achromatic transparency. Perception 35, 12, 1611–1624.
Max, N. 1995. Optical models for direct volume rendering. IEEE Transactions on Visualization
and Computer Graphics 1, 2, 99–108.
Metelli, F. 1974. The perception of transparency. Sci Am 230, 4 (Apr), 90–98.
Mora, B. and Ebert, D. S. 2004. Instant volumetric understanding with order-independent
volume rendering. Comput. Graph. Forum 23, 3, 489–498.
Nawrot, M. and Blake, R. 1989. Neural integration of information specifying structure from
stereopsis and motion. Science 244, 4905 (May), 716–718.
Perlin, K. 1985. An image synthesizer. Computer Graphics 19, 3 (July), 287–296.
ACM Transactions on Applied Perception, Vol. V, No. N, Month 20YY.

A Perceptive Evaluation of Volume Rendering Techniques · 25
Petersik, J. T. and Dannemiller, J. L. 2004. Factors influencing the ability to detect motion
reversals in rotation simulations. Spat Vis 17, 3, 201–234.
Pfister, H., Lorensen, B., Schroeder, W., Bajaj, C., and Kindlmann, G. 2000. The transfer
function bake-off (panel session). In VIS ’00: Proceedings of the conference on Visualization
’00. IEEE Computer Society Press, Los Alamitos, CA, USA, 523–526.
Roettger, S., Guthe, S., Weiskopf, D., Ertl, T., and Strasser, W. 2003. Smart hardware-
accelerated volume rendering.
Rogers, S. and Rogers, B. J. 1992. Visual and nonvisual information disambiguate surfacesspecified by motion parallax. Percept Psychophys 52, 4 (Oct), 446–452.
Ropinski, T., Steinicke, F., and Hinrichs, K. H. 2006. Visually supporting depth perception in
angiography imaging. In Proceedings of the 6th International Symposium on Smart Graphics
(SG06). Springer, Vancouver, 93–104.
Sabella, P. 1988. A rendering algorithm for visualizing 3d scalar fields. In SIGGRAPH ’88:
Proceedings of the 15th annual conference on Computer graphics and interactive techniques.
ACM Press, New York, NY, USA, 51–58.
Sears, C. R. and Pylyshyn, Z. W. 2000. Multiple object tracking and attentional processing.
Can J Exp Psychol 54, 1 (Mar), 1–14.
Sereno, M. E. and Sereno, M. I. 1999. 2-d center-surround effects on 3-d structure-from-motion.J Exp Psychol Hum Percept Perform 25, 6 (Dec), 1834–1854.
Singh, M. 2004. Lightness constancy through transparency: internal consistency in layered surface
representations. Vision Res 44, 15, 1827–1842.
Singh, M. and Anderson, B. L. 2002. Toward a perceptual theory of transparency. PsycholRev 109, 3 (Jul), 492–519.
Sperling, G. and Landy, M. S. 1989. Kinetic depth effect and identification of shape. J Exp
Psychol Hum Percept Perform 15, 4 (Nov), 826–840.
Todd, J. T. 1985. Perception of structure from motion: is projective correspondence of moving
elements a necessary condition? J Exp Psychol Hum Percept Perform 11, 6 (Dec), 689–710.
Ullman, S. 1979. The interpretation of visual motion. Ph.D. thesis, Mass. Inst. of Technol.,Dept. of Elect. Eng. Comput. Sci.
Wallach, H. and O’Connell, D. N. 1953. The kinetic depth effect. J Exp Psychol 45, 4 (Apr),
205–217.
A. COMPUTING THE COMPENSATING TRANSLATION IN EXPERIMENT 3
In experiment 3, points in the foreground appear to move faster than those inthe background due to perspective foreshortening. Thus, the average projectedhorizontal speed of the stimulus is biased toward the correct rotation direction, andsubjects’ decisions might simply reflect this 2D signal, not a true 3D perception.Note however that this effect is weakened by the clipping mask that preserves morepoints at the background than at the foreground.
To assess this, we implement test trials for the volumetric point cloud in P2 perspec-tive condition. These include an additional horizontal translation of the cylinderopposite to the aforementioned bias. Two speeds of translation are defined: T1nulls the average projected speed of the point cloud, while T2 equalizes the maxi-mal speed at the foreground and background of the volume. This appendix explicitsthe formula used to compute the values of T1 and T2.
A point M(x, y, z) (in cylindrical coordinates: M(ρcos(θ), y, ρsin(θ)) within thecylinder is projected on the plane orthogonal to the viewing direction and passingthrough the center of the cylinder on Mp(X,Y, 0). The center of projection C is
ACM Transactions on Applied Perception, Vol. V, No. N, Month 20YY.

26 · Boucheny et al.
Fig. 11. Notations and reference frame used to compute the amount of translationnecessary to null 2D average speed of the stimulus in experiment 3.
positioned at distance d from the center O of the cylinder (radius R), where thereference frame is placed. These notations are depicted in Figure 11.
With y = 0 for both rotation and translation, Mp position and speed are definedby:
Mp
X = x d
d−zY = y d
d−zZ = 0
and Mp
X = x d
d−z + xz d(d−z)2
Y = xz d(d−z)2
Z = 0(7)
The average motion over the point cloud is the weigthed sum of the unitary meanrotation (XR) and unitary mean translation (XT ) over the volume:
X = ω XR + δ XT (8)
with:
XR =∫ H/2
y=−H/2
∫ 2π
θ=0
∫ R
ρ=0
−ρθ sin(θ)d
d− ρ sin(θ)+ρ2θ cos(θ)2
d
(d− ρ sin(θ))2dρdθ dy
(9)
XT =∫ H/2
y=−H/2
∫ 2π
θ=0
∫ R
ρ=0
xd
d− ρ sin(θ)dρdθ dy (10)
As these equations are not integrable, and since we must restrict our computationsto the points that belong to the visible part of the cylinder (clipped by the fourplanes defined by the mask, see Figure 8(a)), we relied on a Monte Carlo simulation(10 millions points) to compute the values of ω and δ.
ACM Transactions on Applied Perception, Vol. V, No. N, Month 20YY.