a penny for your tweets: campaign contributions and...
TRANSCRIPT

A Penny for your Tweets: Campaign Contributions and Capitol Hill Microblogs
Tae Yano Dani Yogatama Noah A. SmithSchool of Computer ScienceCarnegie Mellon UniversityPittsburgh, PA 15213, USA
{taey,dyogatama,nasmith}@cs.cmu.edu
AbstractWho influences a politician’s public statements? In this pa-per, we explore one plausible explanation: that financialincentives from campaign contributors affect what politi-cians say. Based on this idea, we design text-driven modelsfor campaign contribution profile prediction. Using a largecorpus of public microblog messages by members of theU.S. Congress, we find evidence for such an association, atthe level of contributing industries. We find complementarystrengths in a simple model (which has better predictive ac-curacy) and a more complex model (which gives a more intu-itive, human-interpretable explanation).
IntroductionIn the 2012 U.S. general presidential election, each candi-date’s campaign spent more than one billion dollars. There isno question that the American political landscape is shapedby the vast amount of money spent by campaigns. To whatextent can we measure or characterize the precise nature ofcampaign contributors’ influence on elected officials? In thispaper, we consider a new way of measuring such influenceby exploring the connection between the campaign contri-butions a member of Congress receives and his or her publicmicroblog messages.
Microblogs, especially Twitter, have become an integralpart of political campaigns, public outreach by politicians,and political discourse among citizens. Automatic analysisof microblog text has the potential to transform our under-standing of public opinion (O’Connor et al. 2010), com-munication between elected officials and their constituents(Golbeck, Grimes, and Rogers 2010), and information flowin society more generally (Lerman and Ghosh 2010). Herewe use probabilistic modeling to infer associations betweencampaign contributions, as made available by the FederalElection Committee, and the text of tweets from membersof Congress.
We begin with the assumption that the extent to whichcampaign contributions influence politicians should be mea-surable in the predictability of those contributions, given thetext. Further, judicious use of latent variables can help reveallinguistic cues associated with contributions from specificindustries and interest groups.
Copyright c� 2013, Association for the Advancement of ArtificialIntelligence (www.aaai.org). All rights reserved.
DataOur dataset consists of two parts: messages (tweets) fromthe accounts officially associated with members of Congress(MCs) and 2012 electoral campaign contributions.
Tweets from Capitol HillDuring the period from May 15–October 31, 2012, we col-lected through Twitter’s search API publicly available tweetsposted by Twitter handles officially associated with MCs.These handles were collected from Tweet Congress (http://www.tweetcongress.org). We manually filteredfrom this set MCs who were not seeking reelection in 2012.Although we do not know who authored any of these tweets,we assume that they are, for the most part, rationally andcarefully crafted by the MC’s staff. Golbeck et al. (2010)manually coded a large corpus of MC tweets and found themajority of messages to be public relations and promotion,not personal. Our (less systematic) analysis of the data leadsto a conclusion consistent with their finding.
Each tweet was lightly preprocessed. Hashtags and at-mentions were retained; URLs, non-alphabetic strings, and134 common stopwords were not. Downcasing was applied,and regular expressions were used to normalize some seg-mentation and lengthening variation. Finally, words occur-ring less than 10 times in the corpus were removed, resultingin a vocabulary of 19,233 word types, and an average tweetlength of 9 word tokens. More details follow:
# MCs # tweets # wordsRepublicans 249 166,520 1,574,636Democrats 189 98,661 949,862Independents 2 818 7,312Total 440 265,999 2,531,810
Below, c will always index MCs. We let wc be the com-plete collection of word tokens tweeted by c; wc,t is the tthmessage by c, and wc,t,n is the nth word in that message.
Electoral Campaign ContributionsFor each of the MCs in our tweet dataset, we collected 2012general election campaign contribution data from the pub-licly available database maintained by the Center for Re-sponsible Politics (CRP; http://www.opensecrets.org). These data were originally released by the Federal
General ContractorsPro−Israel
Computers/InternetHosp./Nursing Homes
Mfg./DistributorsElectric Utilities
Commercial BanksBusiness Services
TV/Movies/MusicPharm./Health Products
Oil/GasMisc Finance
Leadership PACsInsuranceLobbyists
Real EstateHealth Pro.
Sec./InvestmentRetired
Lawyers/Law Firms
$0 $25
$50
$75
(in millions of USD)
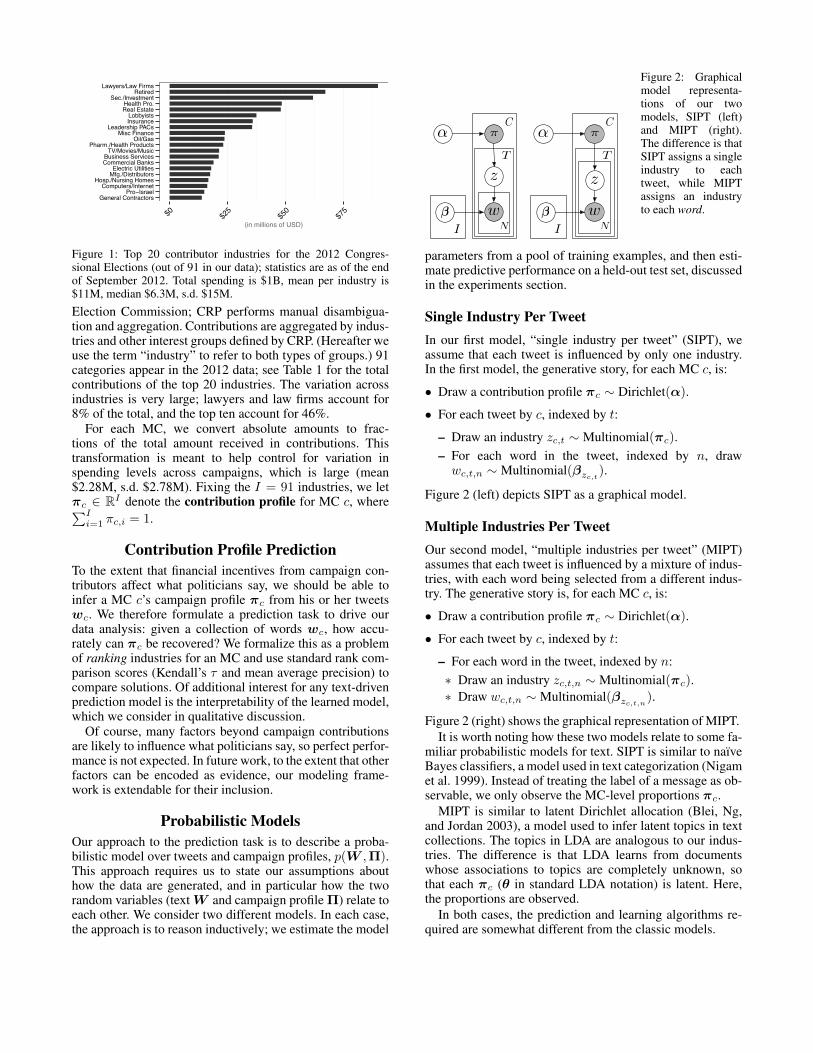
Figure 1: Top 20 contributor industries for the 2012 Congres-sional Elections (out of 91 in our data); statistics are as of the endof September 2012. Total spending is $1B, mean per industry is$11M, median $6.3M, s.d. $15M.Election Commission; CRP performs manual disambigua-tion and aggregation. Contributions are aggregated by indus-tries and other interest groups defined by CRP. (Hereafter weuse the term “industry” to refer to both types of groups.) 91categories appear in the 2012 data; see Table 1 for the totalcontributions of the top 20 industries. The variation acrossindustries is very large; lawyers and law firms account for8% of the total, and the top ten account for 46%.
For each MC, we convert absolute amounts to frac-tions of the total amount received in contributions. Thistransformation is meant to help control for variation inspending levels across campaigns, which is large (mean$2.28M, s.d. $2.78M). Fixing the I = 91 industries, we let⇡c 2 RI denote the contribution profile for MC c, wherePI
i=1 ⇡c,i = 1.
Contribution Profile PredictionTo the extent that financial incentives from campaign con-tributors affect what politicians say, we should be able toinfer a MC c’s campaign profile ⇡c from his or her tweetswc. We therefore formulate a prediction task to drive ourdata analysis: given a collection of words wc, how accu-rately can ⇡c be recovered? We formalize this as a problemof ranking industries for an MC and use standard rank com-parison scores (Kendall’s ⌧ and mean average precision) tocompare solutions. Of additional interest for any text-drivenprediction model is the interpretability of the learned model,which we consider in qualitative discussion.
Of course, many factors beyond campaign contributionsare likely to influence what politicians say, so perfect perfor-mance is not expected. In future work, to the extent that otherfactors can be encoded as evidence, our modeling frame-work is extendable for their inclusion.
Probabilistic ModelsOur approach to the prediction task is to describe a proba-bilistic model over tweets and campaign profiles, p(W ,⇧).This approach requires us to state our assumptions abouthow the data are generated, and in particular how the tworandom variables (text W and campaign profile ⇧) relate toeach other. We consider two different models. In each case,the approach is to reason inductively; we estimate the model
�
z
N
C
I
T
⇡�
w �
z
N
C
I
T
⇡�
w
Figure 2: Graphicalmodel representa-tions of our twomodels, SIPT (left)and MIPT (right).The difference is thatSIPT assigns a singleindustry to eachtweet, while MIPTassigns an industryto each word.
parameters from a pool of training examples, and then esti-mate predictive performance on a held-out test set, discussedin the experiments section.
Single Industry Per TweetIn our first model, “single industry per tweet” (SIPT), weassume that each tweet is influenced by only one industry.In the first model, the generative story, for each MC c, is:
• Draw a contribution profile ⇡c ⇠ Dirichlet(↵).
• For each tweet by c, indexed by t:
– Draw an industry zc,t ⇠ Multinomial(⇡c).– For each word in the tweet, indexed by n, draw
wc,t,n ⇠ Multinomial(�zc,t).
Figure 2 (left) depicts SIPT as a graphical model.
Multiple Industries Per TweetOur second model, “multiple industries per tweet” (MIPT)assumes that each tweet is influenced by a mixture of indus-tries, with each word being selected from a different indus-try. The generative story is, for each MC c, is:
• Draw a contribution profile ⇡c ⇠ Dirichlet(↵).
• For each tweet by c, indexed by t:
– For each word in the tweet, indexed by n:⇤ Draw an industry zc,t,n ⇠ Multinomial(⇡c).⇤ Draw wc,t,n ⇠ Multinomial(�zc,t,n).
Figure 2 (right) shows the graphical representation of MIPT.It is worth noting how these two models relate to some fa-
miliar probabilistic models for text. SIPT is similar to naıveBayes classifiers, a model used in text categorization (Nigamet al. 1999). Instead of treating the label of a message as ob-servable, we only observe the MC-level proportions ⇡c.
MIPT is similar to latent Dirichlet allocation (Blei, Ng,and Jordan 2003), a model used to infer latent topics in textcollections. The topics in LDA are analogous to our indus-tries. The difference is that LDA learns from documentswhose associations to topics are completely unknown, sothat each ⇡c (✓ in standard LDA notation) is latent. Here,the proportions are observed.
In both cases, the prediction and learning algorithms re-quired are somewhat different from the classic models.

Model ⌧ MAP@5 MAP@10 MAP@15fixed pred. .49 .52 .60 .65log. reg. .49 .41 .49 .55
SIPT .55 .58 .66 .70MIPT .44 .42 .51 .57
Table 1: Experimental results. ⌧ is Kendall’s ⌧ statistic, andMAP@k is mean average precision at relevance cutoff k.
PredictionGiven a new MC c (not included in the training data), wewish to predict ⇡c from messages wc. During prediction,↵ and � are fixed. For both models, exactly solving for ⇡c
given the parameters and wc, and summing out all possi-bilities for zc, is intractable. For SIPT, we apply a singleround of message passing, calculating each zc,t based on �,then ⇡c.1 For MIPT, which involves a more complex latentvariable space, we apply mean field variational inference, anapproximate technique widely used in Bayesian modeling(Wainwright and Jordan 2008). The details are omitted forspace; the algorithm alternates between estimating posteri-ors over zc and over ⇡c.
Learning by Parameter EstimationDuring learning, for a collection of MCs c, ⇡c is observedalong with words wc, and the goal is to maximize likelihoodwith respect to ↵ and �. Because ⇡c is observed, we canestimate ↵ and � separately.2
For ↵, we seek the maximum likelihood estimate of theDirichlet parameters given {⇡c}c. There is no closed-formsolution for the MLE, so we apply a well-known fixed-pointiterative method (Minka 2000).
For SIPT, we learn � using a single round of messagepassing, calculating each zc,t based on ⇡c, then maximizing�. For MIPT, our algorithm is quite similar to the learningalgorithm for LDA given by Blei et al. (2003), but with-out having to estimate posteriors over tweet-level propor-tions (since they are observed). As in standard LDA, thereis a closed-form solution for maximization over �. We put asymmetric Dirichlet prior on � (“add-one” smoothing).
ExperimentsOur experiments are based on 44-fold cross-validation. Ineach of 44 trials, we held out five (distinct) MCs with tweetvolume between the 25th and 75th percentiles. The remain-der of the MCs’ data were used to estimate parameters, andthen predictions were made for the held-out MCs. Each pre-diction is a ranked list of industries.
We include a fixed prediction that ignores tweet con-tent. This is the ranking of industries based on the train-ing data for the fold. We also include a multinomial logisticregression-inspired discriminative model as a simpler ma-chine learning technique. This model is trained using ⇡c todefine a fractional assignment of MC c across industries.3
1Additional rounds were not helpful in preliminary trials.2This follows from the “d-separation” property observable in
Fig. 2: there is no active path between ↵ and �.3The regularized maximum likelihood estimator is:
Industry Associated TermsComputersand Internet
#sopa, internet, sopa, rights, tech, ag, property,judiciary, holder, oppose, federal, open
Defense(Electronics)
security, border, homeland, cyber, subcommit-tee, hearing, defense, air, nuclear, briefing,mike, turner, military
Defense(Aerospace)
defense, afghanistan, armed, appropriations,services, inouye, subcommittee, committee,budget, secretary, military, fort
Agr. Ser-vices/Products
harkin, iowa, farm, announces, farmers, qs, ag,nebraska, drought, webcast, nelson, agricul-ture
Agr. Tobacco nc, #ncsen, burr, #nc7, hours, carolina, office,schedule, #ncpol, north, county, staff
Fisheries andWildlife
#alaska, alaska, #ak, murkowski, alaskans, an-chorage, photo, ak, weekend, air, fairbanks,office, native
Energy(Misc)
energy, gas, natural, oil, clean, resources, for-ward, #utpol, #energy, looking, wind, forest
Energy(Mining)
#4jobs, energy, epa, bills, gas, @housec-ommerce, #energy, passed, regulations, gop,#jobs, #stopthetaxhike
CommercialBanks
hearing, committee, financial, subcommittee,oversight, services, reform, @financialcmte,consumer, cmte, chairman, secretary
Securitiesand Invest-ment
bipartisan, senate, bill, pass, extension, cut,compromise, house, tax, passed, #4jobs, jobs,gop
CreditUnions
tax, ur, mortgage, recession, generation, hon-est, blog, people, rate, terrorist, don, self
HealthProfessionals
health, medicare, care, obamacare, #oba-macare, reform, republicans, repeal, seniors,healthcare, americans, democrats
Casinos andGambling
inouye, senator, lujn, hawaii, nevada, heck,joe, nv, berkley, meeting, attending, #hawaii
Pro-Israel iran, women, rights, nuclear, israel, ben, vio-lence, gop, senate, security, #vawa, cardin
Women’s Is-sues
hagan, nc, women, stabenow, mo, #hawaii,contracting, vets, #mo, #women, game, #nc
Table 2: MIPT’s word-industry associations, for some manually se-lected industries.
Results, averaged across folds, are shown in Table 1. OnlySIPT improves over the baseline (statistical significance atp < 0.001, Wilcoxon signed rank test, for all metrics). Thisincreased predictability indicates a connection between con-tribution profiles and public messages. Of course, a causalrelationship cannot be inferred (in either direction).
The dramatic difference in predictive performance acrossmodels suggests the importance of careful model design.The discriminative model posits a similar word-industry as-sociation to our model but ignores the message level, assum-ing all messages are equally explained proportional to ⇡c.MIPT posits a very high dimensional latent structure thatmay not be learnable from the amount of training data avail-able here. SIPT strikes a better balance.
We found the MIPT model gives qualitatively better
argmax✓P
c
Pi ⇡c,i log p✓(i|wc) + �k✓k22 where the multino-
mial logit distribution p✓ is based on the same unigram featuresconsidered by our generative models. � is tuned using the 10% ofthe training data as the development set.

word-industry associations with greater face validity, despiteits inadequacy as a predictor. This is not uncommon in un-supervised topic modeling; similar observations have beenmade before (Boyd-Graber et al. 2009).
Table 2 shows words MIPT associates with some indus-tries. We emphasize that these associations were revealed us-ing only campaign contribution data coupled with tweets byMCs. Many terms appear that are topically related to issuesof interest to these industries. We also see states where theseindustries do business (NC/tobacco, AK/fishing), and thenames of MCs who head committees relevant to the indus-try’s interests (Harkin/agriculture, Inouye/casinos). Devia-tions are also interesting; Sen. Hagan’s name associates withwomen’s issues (EMILY’s List is one of her top donors),but not tobacco, despite her NC constituency. In the energysector, jobs appear to be of special importance to miners.Subjectively, we found the industry-word associations dis-covered by SIPT and the discriminative model to be farless interpretable. So while MIPT does not perform wellas a predictive model, it more successfully infers human-interpretable associations. We also ran LDA on just the text(without campaign contribution data); the topics were diffi-cult to distinguish from each other.
Related WorkTweets have gained interest as observational data relevantto social science questions, including demographic associa-tions with linguistic variation (Eisenstein, Smith, and Xing2011) and the formation of social norms (Kooti et al. 2012).Golbeck et al. (2010) conducted a comprehensive analysisof the use of Twitter by MCs, and White and Counts (2012)incorporated Twitter data in a spatial model of political ide-ology. Slightly farther afield, Twitter data has also servedas a social “sensor” for detecting flu epidemics (Paul andDredze 2010) and earthquakes (Sakaki, Okazaki, and Mat-suo 2010), for measuring public opinion (O’Connor et al.2010), and (perhaps less successfully) for predicting elec-tions (Tumasjan et al. 2010; Gayo-Avello 2012; Jungherr,Jurgens, and Schoen 2012). The general use of text as data inpolitical science is an active area of research, often makinguse of latent-variable models like ours (Quinn et al. 2006;Grimmer 2010; Grimmer, Messing, and Westwood 2012).Evaluation of such models through prediction was exploredin predicting Congressional roll call votes (Gerrish and Blei2011) and bill survival in Congressional committees (Yano,Smith, and Wilkerson 2012).
ConclusionUsing a probabilistic model, we have found evidence of aconnection between what members of Congress say on Twit-ter and contributions to their campaigns; using another, wecan explore the nature of that connection. In future work,we might consider modeling temporal dynamics in contri-butions and messages, which might give evidence for causalrelationships. Social and individual attributes (e.g., region,party, followers) might help identify additional factors thathelp explain politicians’ message content.
ReferencesBlei, D. M.; Ng, A. Y.; and Jordan, M. I. 2003. Latent Dirichletallocation. JMLR 3:993–1022.Boyd-Graber, J.; Chang, J.; Gerrish, S.; Wang, C.; and Blei, D.2009. Reading tea leaves: How humans interpret topic models.In NIPS.Eisenstein, J.; Smith, N. A.; and Xing, E. P. 2011. Discoveringsociolinguistic associations with structured sparsity. In ACL.Gayo-Avello, D. 2012. No, you cannot predict elections with twit-ter. IEEE Internet Computing 16(6):91–94.Gerrish, S., and Blei, D. 2011. Predicting legislative roll calls fromtext. In Proc. of ICML.Golbeck, J.; Grimes, J.; and Rogers, A. 2010. Twitter use by theU.S. congress. Journal of the American Society for Information
Science and Technology 61(8).Grimmer, J.; Messing, S.; and Westwood, S. 2012. How wordsand money cultivate a personal vote: The effect of legislator creditclaiming on constituent credit allocation. American Political Sci-
ence Review 106(4).Grimmer, J. 2010. A Bayesian hierarchical topic model for polit-ical texts: Measuring expressed agendas in Senate press releases.Political Analysis 18(1).Jungherr, A.; Jurgens, P.; and Schoen, H. 2012. Why the pirateparty won the german election of 2009 or the trouble with pre-dictions: A response to Tumasjan et al. Social Science Computer
Review 30(2):229–234.Kooti, F.; Yang, H.; Cha, M.; Gummadi, P. K.; and Mason, W. A.2012. The emergence of conventions in online social networks. InICWSM.Lerman, K., and Ghosh, R. 2010. Information contagion: An em-pirical study of the spread of news on Digg and Twitter social net-works. In ICWSM.Minka, T. 2000. Estimating a Dirichlet distribution. http://
bit.ly/XTEJFu.Nigam, K.; McCallum, A. K.; Thrun, S.; and Mitchell, T. 1999.Text classification from labeled and unlabeled documents usingEM. Machine Learning 39:103–134.O’Connor, B.; Balasubramanyan, R.; Routledge, B. R.; and Smith,N. A. 2010. From tweets to polls: Linking text sentiment to publicopinion time series. In ICWSM.Paul, M., and Dredze, M. 2010. You are what you tweet : Analyz-ing Twitter for public health. In ICWSM.Quinn, K. M.; Monroe, B. L.; Colaresi, M.; Crespin, M. H.; andRadev, D. R. 2006. An automated method of topic-coding leg-islative speech over time with application to the 105th–108th U.S.Senate. Midwest Political Science Association Meeting.Sakaki, T.; Okazaki, M.; and Matsuo, Y. 2010. Earthquake shakesTwitter users: real-time event detection by social sensors. In WWW.Tumasjan, A.; Sprenger, T. O.; Sandner, P. G.; and Welpe, I. M.2010. Predicting elections with Twitter: What 140 characters revealabout political sentiment. In ICWSM.Wainwright, M. J., and Jordan, M. I. 2008. Graphical models,exponential families, and variational inference. Foundations and
Trends in Machine Learning 1(1–2):1–305.White, J. M., and Counts, S. 2012. Improving spatial models of po-litical ideology by incorporating social network data. In Workshop
on Information in Networks.Yano, T.; Smith, N. A.; and Wilkerson, J. D. 2012. Textual predic-tors of bill survival in congressional committees. In NAACL.