a. pawelczyk Æ f. s. gilbert Æ factors affecting the ...ecology.nottingham.ac.uk/~plzfg/s/2004...
TRANSCRIPT

ORIGINAL PAPER
A. Pawelczyk Æ A. Bajer Æ J. M. Behnke
F. S. Gilbert Æ E. Sinski
Factors affecting the component community structureof haemoparasites in common voles (Microtus arvalis)from the Mazury Lake District region of Poland
Received: 20 July 2003 / Accepted: 15 October 2003 / Published online: 9 January 2004� Springer-Verlag 2004
Abstract The prevalence and abundance of infectionswith haemoparasites were studied over a 4-year period inMicrotus arvalis (common vole, n =321) sampled fromfallow grassland sites in north-eastern Poland. Totalspecies richness was five (prevalence= Haemobartonellasp. 63.9%, Bartonella spp. 27.7%, Babesia microti 9.0%,Trypanosoma sp. 8.4% and and Hepatozoon lavieri3.1%) with 76.9% of the voles carrying at least onespecies and a mean infracommunity species richness of1.1. Variation in species richness was determined pri-marily by season and year, the interaction of these fac-tors, and that of year with host age. The observedfrequency distribution of infracommunity species rich-ness did not differ from that predicted by a null model,suggesting that there were no marked associations be-tween the species. Analyses of prevalence and abun-dance of infection with each species in turn, revealedthat overall the principal causes of variation were tem-poral and seasonal, their interaction, and interactionswith intrinsic factors (age and sex), the latter playingonly a minor role in their own right. However, the rel-ative importance of these combinations varied and wasdistinct for each of the species in the study. Prevalencedata revealed eight sets of two- and three-way associa-tions between species, mostly dependent to some extenton one of the intrinsic and extrinsic factors in the model.Analysis of quantitative associations suggested two setsof positive two-way interactions, none of which re-mained after controlling for the effect of extrinsic andintrinsic factors on the abundance of each species. These
data are discussed in the context of the changing eco-logical profiles in this region of Eastern Europe and, in awider context, in relation to current understanding ofthe factors that shape component community structuresof haemoparasites in wild rodents.
Introduction
Wild rodents play an important role in nature as reser-voir hosts for many pathogens, including some that canbe transmitted to other animals including humans.Infections with haemoparasites are widespread in wildrodents and are dependent on zoonotic cycles that alsoinvolve arthropod vectors. Our understanding of thetransmission cycles involved is still incomplete, particu-larly in respect of the key factors that regulate trans-mission. In contrast to helminth communities,haemoparasites of small wild rodents have received rel-atively little attention in Europe and published studieshave largely reported on rodent communities in Westernand Northern Europe (Baker et al. 1963; Baker 1974;Krampitz 1981; Birtles et al. 1994). In this respectCentral and Eastern Europe have been relatively ne-glected, but there is now growing interest in the occur-rence of haemoparasites in wild rodents from EasternEurope (Karbowiak and Sinski 1996a, 1996b; Kar-bowiak et al. 1999) and our earlier studies in the MazuryLake District region of Poland have drawn attention tothe high prevalence of both haemoparasites and Cryp-tosporidium spp. in the dominant woodland rodents ofthe region (Paweczyk and Sinski 2000; Bajer et al. 2001,2002).
Recently we demonstrated that in woodland andmeadow habitats of northern Poland, the rodent speciesApodemus flavicollis, Clethrionomys glareolus and Mi-crotus arvalis are important hosts for two groups ofparasitic arthropods: fleas and mites, especially imma-ture stages of Ixodes ricinus (Pawelczyk 2003). The levelof infestation in small rodents was very high. Fleas
A. Pawelczyk Æ A. Bajer Æ E. SinskiDepartment of Parasitology, Institute of Zoology,University of Warszawa, Miecznikowa 1 Street,02–096 Warszawa, Poland
J. M. Behnke (&) Æ F. S. GilbertSchool of Biology, University Park,University of Nottingham,Nottingham, NG7 2RD, UKE-mail: [email protected].: +44-115-9513208Fax: +44-115-9513252
Parasitol Res (2004) 92: 270–284DOI 10.1007/s00436-003-1040-1

(Siphonaptera), ticks ( Ixodida) and many mesostigmaticmite species constitute an abundant and frequent com-ponent of ectoparasite communities of rodents in Cen-tral and Eastern Europe (Sinski and Paweczyk 1999,Stanko and Miklisova 2002). They are major vectors ofvarious diseases and infest a wide range of hosts (Bala-shov 1995) with important consequences for transmis-sion and epidemiology of relevant species ofhaemoparasites among rodent populations. Our previ-ous investigations in woodland habitats in the MazuryLake District region of Poland have shown that hae-moparasitic infections are frequent among bank volesand we documented the relative importance of intrinsicand extrinsic factors in structuring these communities(Bajer et al. 2001).
In contrast to woodland rodents, those inhabiting theopen meadows have been largely ignored. However, in asecond phase of our long-term study of haemoparasiticcomponent communities of wild rodents in Poland, wecollected data on haemoparasites of the common vole(M. arvalis), which is numerically the dominant rodentspecies inhabiting the open meadows adjoining ourwoodland study sites. In this paper we evaluate the role ofhost age and sex (intrinsic factors), and year and season(extrinsic factors), and the interactions between thesefactors, in structuring the component community ofhaemoparasites in M. arvalis and influencing both prev-alence and abundance of each of the species involved.
Materials and methods
Study sites
Our study site was located east of the nature reserve surroundingLake Luknajno, and north of Lake Sniardwy, near the town ofMikolajki in the Mazury Lake District region of north-easternPoland. Trapping was conducted in open grassland sites, locatedclose to our woodland study sites (Bajer et al. 2001). The formerwere intensively cultivated with cereals until 1991, and then aban-doned and have lain fallow ever since. The dominant species ofplants were: couch grass (Agropyron repens), hare’s foot (Trifoliumarvense), daisy fleabane (Erigeron canadensis) and several species ofgrasses. Among taller vegetation were motherworts (Artemisiavulgaris and A. absynthium) and young silver birches (Betulaverucosa) (Bajer 2002).
Collection of mice
Rodents were caught live in locally constructed wooden traps, witha small interior metal platform which, when triggered, released ametal door. These were set out at 15-m intervals in parallel lines,10 m either side of tracks running across the grassland. Trappingsessions comprised a minimum of 4 days, with traps being in-spected in the early morning and just before dusk. Fresh trapsreplaced any traps containing animals and the animals werebrought to the University of Warszawa’s field station at Urwitalt.Visits to the study sites varied, but generally comprised at least a4-day duration, at approximately 4-week intervals from late Marchuntil mid-November. For both practical and animal welfare rea-sons, it was not possible to visit the sites in the period betweenNovember and March because the ground was mostly frozen hardand deep snow covered our sites for most of the winter period. The
months between March and November were divided into threeseasons, comprising spring (March–early June), summer (lateJune–August) and autumn (September–November).
Sampling of hosts
At the field station in Urwitalt, all animals were inspected, identi-fied, sexed, relevant morphometric data were recorded and theywere weighed (to the nearest 0.5 g). Ectoparasites were removedfrom the ears and limbs (mostly larval and nymph ticks and somemites) and the fur was inspected carefully for fleas. Thin bloodsmears were prepared from drops of blood taken from the tail vein.After inspection most animals were marked and released as near aspossible to the original site of capture, whilst others were killed forrecovery of endoparasites (data to be published elsewhere).
Blood smears were air-dried, fixed in absolute methanol, stainedfor 45 min in Giemsa’s stain (diluted 1:3) in buffer at pH 7.2 andwere brought back to the Department of Parasitology at the Uni-versity of Warszawa for examination. Each smear was examinedunder oil immersion (using an Olympus AX70 microscope). Ini-tially sufficient fields of vision were examined to enable up to 50leukocytes to be inspected for presence of Hepatozoon lavieri(approximately 200 fields of vision under a ·100 objective lens).Each field of vision was also examined for the presence of otherspecies, although these were not quantified at this stage. If theblood smear revealed the presence of other species, during thisinitial phase of examination, an additional 1,000 erythrocytes wereinspected and the number of cells infected with Bartonella spp.,B. microti and Haemobartonella sp. were recorded and expressed asno. infected cells/100 erythrocytes. The concentration of trypano-somes was also expressed per 100 erythrocytes.
Age classes were established on the basis of weight (Morris1972) and sexual development as described by Adamczewska-Andrzejewska (1973). Age class 1 comprised immature, juvenilevoles <15 g in weight and approximately <1.5 months old. Ageclass 2 comprised young mature voles, 15–19.5 g in weight repre-senting animals approximately 1.5–2.5 months old. Age class 3comprised adult voles, weighing >19.5 g, ‡2.5 months old.
Statistical analysis
The frequency distribution of infracommunity species richness wastested for goodness-of-fit to the positive binomial distribution(assumption of the null model is a regular distribution), the Poissondistribution (assumption of the null model is a random distribution)and to the null model of Janovy et al. (1995) (assumption of the nullmodel is that, in the absence of associations and interactionsbetween species, the frequency distribution of infracommunityspecies richness is predicted by prevalence values). Goodness-of-fitin each case was tested by v2.
Prevalence (percentage of animals infected) was analysed bymaximum likelihood techniques based on log-linear analysis ofcontingency tables, implemented by the software package, Stat-graphics version 7. For each species in turn we entered prevalenceof infection as a binary factor (infected=1, not infected=0) andthen year (four levels: 1997, 1998, 1999 and 2000), season (threelevels: spring, summer and autumn), host age (three levels) and hostsex (two levels) as factors. Beginning with the most complex model,involving all possible main effects and interactions, those combi-nations not contributing significantly to an explanation for varia-tion in the data were eliminated stepwise, beginning with thehighest-level interaction. A minimum sufficient model was thenobtained, for which the likelihood ratio of v2 was not significant,indicating that the model was sufficient in explaining the data. Thestatistical analysis is presented in the legends, where significantinteraction terms are given alongside relevant figures, but it isimportant to remember that these represent tests of the individualterms in the minimum sufficient model simplified from the fullfactorial model that initially comprised four factors (year, season,age and sex) and the infection term.
271

Quantitative data reflecting parasite abundance within hostswere expressed as geometric means because the data were highlyoverdispersed (Elliott 1977; Dash et al. 1988). In some casesarithmetic means and SEMs are also provided. These means reflectthe abundance of infection as defined by Margolis et al. (1982) andinclude all subjects within the specified group, infected and notinfected, for which relevant data were available. The degree ofaggregation in quantitative data was calculated by the index ofdispersion (I; the variance to mean ratio) and the index of dis-crepancy (D) as described by Poulin (1993; a value of 0 indicates aneven distribution of counts across all hosts and a value of 1 indi-cates all parasites aggregated in a single host). Frequency distri-butions of individual species were also tested for goodness-of-fit tonegative binomial, positive binomial and Poisson models by v2 asdescribed by Elliott (1977) and the negative binomial exponent (k)is given as appropriate.
Parasite abundance was analysed by generalized linear inter-active modelling (GLIM 4, PC version, Royal Statistical Society1993) as described previously, using models with normal errorsafter normalization of the data by log10( x +1) transformation(Crawley 1993; Wilson and Grenfell 1997; Behnke et al.1999).Year, season, host age and host sex (see above for levels)were entered as factors. For models with normal errors the changein deviance is divided by the scale parameter and the result dividedby the change in df following each deletion, to give a variance ratio,F. All models were carefully scrutinised and only the significantterms and relevant F -values are presented in the legends to figuresor text. The residuals from all models were checked for approxi-mately normal distribution.
Quantitative associations between parasites were examined bymultiple correlation analysis (Spearman rank-order correlationtest) of raw parasite data from animals carrying both of two spe-cies, in each of the possible two-way combinations (excludingH. lavieri because of very low prevalence of this species). To avoidthe risk of type I errors we adopted the Dunn-Sidak correction,lowering the cut-off value of P, according to the number of com-parisons implemented (Sokal and Rohlf 1981).
We also examined the correlations between the residuals fromminimum sufficient three-, two- or one-way ANOVAs, as appro-priate for individual species, in order to control for establisheddifferences between the years, seasons, host age and sex.
Finally, we carried out a principal components analysis (Stat-graphics version 7) on the standardized residuals from each of thefive ANOVAs.
Results
M. arvalis
A total of 321 M. arvalis were sampled over a period of4 years. The structure of the sampled host population byyear, host sex and age is summarized in Table 1. Hostdensity was estimated to enable some comparison ofvole populations between the 4 years of the study (Ta-ble 2). Vole numbers were generally low in spring,peaking in most years in August–September and al-though there was some variation in the density of thepeak population in summer–autumn, the general patternwas very similar across all 4 years of the study.
Total species richness in the component community
Five species of blood parasites were recorded (Table 3)and 247 voles (76.9%) carried at least one of thesespecies. Haemobartonella sp. was the most common andH. lavieri the rarest.
Frequency distribution of infracommunityspecies richness
The observed distribution of infracommunity speciesrichness, illustrated in Fig. 1, conformed to the negativebinomial and did not differ significantly from that pre-dicted by the null model for interactions of parasitespecies in an assemblage (Janovy et al. 1995).
Table 1 The structure of the sampled Microtus arvalis populationby year of capture, host sex and age
Year Sex Age Totals by
1 2 3 Sex Year
1997 Male 10 10 13 33Female 12 3 12 27Combined 22 13 25 60
1998 Male 8 8 9 25Female 9 9 19 37Combined 17 17 28 62
1999 Male 13 13 34 60Female 12 14 27 53Combined 25 27 61 113
2000 Male 11 8 16 35Female 12 12 27 51Combined 23 20 43 86
Total by age 87 77 157Overall total 321
Table 2 Estimation of population density of M. arvalis in the studysite. ND Not determined
Month Relative population densitya
1997 1998 1999 2000
March 2.4 ND ND NDApril 0.6 1.6 2.5 NDMay 0.5 1.1 7.4 15.1June 6.4 0 ND 17.8July 10.0 22.6 19.4 NDAugust 14.8 5.4 30.1 39.4September 10.4 22.6 ND 41.0October 12.0 13.1 ND NDNovember 12.4 ND ND ND
aPopulation density was calculated as the number of voles trapped/trap hours·104
Table 3 Overall prevalence of infection with haemoparasites inmale and female common voles
Species Males Females Combined
Haemobartonella sp. 61.4 66.1 63.9Bartonella spp. 26.8 28.6 27.7Babesia microti 9.8 8.3 9.0Trypanosoma sp. 9.8 7.1 8.4Hepatozoon lavieri 2.0 4.2 3.1
272

Mean infracommunity species richness
The overall mean number of species of blood parasitesharboured per host was 1.1±0.05 (±SEM), with avariance to mean ratio of 0.625 suggesting a positivebinomial distribution, although as indicated above (andFig. 1) a test for goodness-of-fit revealed a significantdiscrepancy. There was a strong seasonal effect (Fig. 2A)generated by the increase in mean infracommunity spe-cies richness from spring, through the summer to au-tumn, and a weaker year effect, but neither was entirelypredictable and the significant interaction with year ar-ose because of the unexpected drop in autumn in meanspecies richness in 1997. Figure 2B shows that meanspecies richness declined with increasing age in 1998 and2000, while in 1997 and 1999 mean species richness in-creased with host age. Therefore season-dependentchanges in mean species richness were apparent andsimilar in 3 years but not entirely predictable (exceptionin 1997) and there were changing patterns in respect ofhost age across the 4 years of the study.
Prevalence of species
Table 3 summarizes the overall prevalence of each of thefive species detected in the study by host sex and com-bined. All prevalence data were analysed further bymaximum likelihood methods, testing respectivelymodels for each of the five species in relation to the fourquantified factors (year, season, host sex and age). Testsof the significance of the individual effects (interactionswith infection), together with overall goodness-of-fit ofthe complete minimum sufficient models are summarizedin the legends to Figs. 3 and 4.
H. lavieri was the least prevalent species in the study,but showed significant variation in relation to year(Fig. 3A) with higher prevalence in 1999 and 1997
compared with the other years. The age·season·infec-tion interaction (data not shown) arose because with theexception of one infected vole in age group 1, none ofthe other voles sampled in spring (n=35) showedinfection. The remaining nine infected voles were sam-pled in summer (n =212) and autumn (n =74) but insummer five were age cohort-3 animals, whereas in au-tumn three/four infected voles were in age cohort 1 andthe remaining animal in age cohort 3.
The prevalence of Trypanosoma sp. was dependent onyear: in 1997 prevalence was 20%, more than twice thevalue recorded in other years (Fig. 3B). To a lesser ex-tent prevalence also varied in relation to host age andseason (the season·age·infection interaction, data notshown). No infections were recorded in spring. Amongage cohorts 1, 2 and 3 prevalence was 4%, 4.9% and12.4% in summer and 5.6, 27.3 and 0% respectively inautumn. There was no significant difference in preva-lence between the sexes (Table 3).
Bartonella spp. were rare in the spring (preva-lence=5.7%) but more common in the summer andautumn months (prevalence=30.7 and 29.7%, respec-tively; the season·infection interaction in the legend toFig. 3C). Interestingly the relationships with age alsovaried between years. In 1998 and 2000 prevalence de-clined with age, whereas in 1997 and 1999 there was noclear pattern to age-related prevalence (Fig. 3C, theyear·age·infection interaction).
B. microti infections varied markedly with year andseason (Fig. 4A), a pattern generated through thedeclining prevalence of this species in the summermonths with successive years, and the unusually highprevalence in spring and autumn in 1998. The weakerinteraction with season and sex arose because in springand autumn prevalence was higher among females,whereas in the summer months males showed higherprevalence (Fig. 4C, Table 4).
Although Haemobartonella sp. generated a highlysignificant interaction in relation to year and season(Fig. 4b), the only consistent trend apparent was adeclining prevalence in summer across the years of thestudy. In other seasons prevalence varied unpredictablyfrom year to year. The season·sex interaction (Fig. 4D)is mainly attributable to the very low prevalence amongmale voles in spring (one of 13 voles carried the para-site), but otherwise prevalence showed little variationbetween the sexes (range 56.8–70.2%).
Frequency distribution of parasite burdensamong infracommunities
The extent of aggregation of each of the parasite specieswas examined by three tests as summarized in Table 5.The three species (H. lavieri, Trypanosoma sp. andB. microti) showing the lowest prevalence, all comprisedhighly aggregated data sets best described by the nega-tive binomial. Bartonella spp. did not conform to thenegative binomial, although the discrepancy with other
Fig. 1 Frequency distribution of infracommunity species richness.The predicted data are those predicted by the null model of Janovyet al. (1995) (comparison of these distributions gave v2=3.5, df=4,P >0.05). Test of goodness-of-fit of the observed data to thenegative binomial gave v2=4 (df =3, P= NS), to the Poissonv2=32.1 (df =4, P >0.001), and to the positive binomialdistribution v2=10.66 (df =3, P= 0.014)
273

distributions was greater (Poisson v2=117.3, P<0.0001; positive binomial v2=123.1, P <0.0001). Si-milarly Haemobartonella sp. did not conform to any ofthe distributions tested (Poisson v2=29.6, P= 0.001;positive binomial v2=38.4, P= 0.0001).
Abundance of infection among infracommunities
Too few animals were infected with H. lavieri to meritquantitative analysis.
Analysis of Trypanosoma sp. revealed much the sameas prevalence data with a marked variation betweenyears, the heaviest infections being detected in 1997(geometric mean=1.78/1,000 red blood cells), and low-est in 2000 (geometric mean=0.38/1,000 red bloodcells). There was also a significant effect of age, but this
was confounded by a season·age interaction (Fig. 5A).No voles were infected in spring, infections were firstevident in the summer and by the autumn infectionswere most intense in the age class 2, when older voleswere again without infection.
The overall prevalence of B. microti was similar toTrypanosoma sp. (Table 3) but quantitative analysisrevealed only a complicated picture with variationbetween all four factors (year, season, sex and age). Wehave illustrated only the main effects in Fig. 5B. As withprevalence, the abundance of infection was generallyhigher in 1998, and interestingly the heaviest infectionswere found in the oldest voles, but clearly this patternwas confounded by the influence of host sex and seasonof the year (data not shown).
Haemobartonella sp. showed strong seasonal andyear-related variation in abundance (Fig. 5C). As with
Fig. 2 A Annual and seasonalchanges in meaninfracommunity speciesrichness. (Four-way ANOVA ingeneralized linear interactivemodelling with normal errorsand year, season, host age andsex as factors, main effect ofseason= F2,314=6.72, 0.005>P >0.001, main effect of year=F3,315=2.65, 0.05> P >0.025 ;interaction between year andseason= F5,295=3.9, 0.005>P>0.001.) B Variation in meaninfracommunity speciesrichness between age classesand across the 4 years of thestudy (interaction between ageand year= F6,296=2.27, 0.05>P >0.025 ). Other terms in themodel were not significant andthe residuals were distributednormally
274

prevalence, the geometric mean abundance of Haemo-bartonella sp. declined in the summer months with suc-cessive years of the study, but varied unpredictably inspring and autumn months (Fig. 5C, and the significantyear·season interaction).
Quantitative analysis of Bartonella spp. yielded onlysignificant interaction terms and these are illustrated inFig. 6. In general, abundance of infection increased inmost age groups from very low levels in spring, but therewas a notable exception in 1997. Later in the season
changes were not predictable, with declining or risingabundance in different age groups depending on year ofstudy.
Associations between parasites basedon category data
Interactions between parasites should be reflected in co-occurrence or exclusion of species. We carried out a log-linear analysis entering data on the parasites (presence ofinfection/absence of infection) and three of the otherfactors (year, host age and sex). A model that includedseason did not converge satisfactorily. Therefore, ourmodel incorporated eight terms in total and this issummarized in Table 4. Eight of the 12 terms in thismodel were based on combinations of two or threeparasites and seven were context dependent involvingvarious combinations of extrinsic and intrinsic factors.We have illustrated only the two strongest combinationsin the model and the only three-way interaction notdependent on either intrinsic or extrinsic factors.
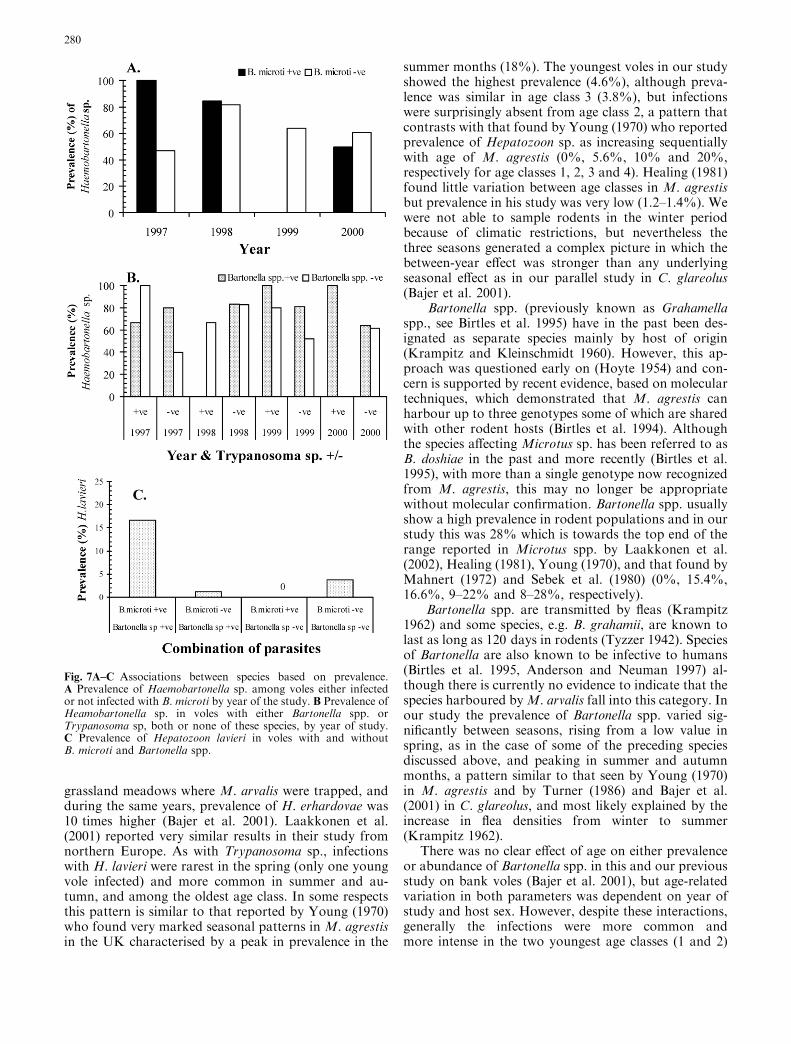
Figure 7A shows that in 1998 and 2000 the preva-lence of Haemobartonella sp. was very similar amongvoles irrespective of whether they harboured B. microtior not. However, in 1997, B. microti -infected animalswere more likely to be also infected with Haemobarto-nella sp. whereas in 1999 only voles without B. microticarried Haemobartonella sp.
The four-way interaction shown in Fig. 7B is basedon year, Trypanosoma sp., Bartonella spp. and Haemo-bartonella sp. and is more complex. The prevalence ofHaemobartonella sp. across the 4 years of the studyremained high in voles infected with Bartonella spp.irrespective of whether they carried Trypanosomasp.(66.7–100%) or not (64–83.3%). In contrast amongvoles without Bartonella spp., prevalence varied from 0to 100%. This variation was greatest among voles withTrypanosoma sp. (0–100%) and somewhat more limitedamong those without Trypanosoma sp. (39.5–83.9%).
The three-way interaction between B. microti,H. lavieri and Bartonella spp. (Fig. 7C) arose becausevoles with Bartonella spp. and B.microti were more likelyto be infected with H. lavieri than among the other threecombinations. Additionally (data not shown) amongvoles withoutB.microti, the prevalence ofBartonella spp.was higher when H. lavieri was also absent (29.0% vs.11.1%, respectively). In contrast among voles withB. microti the prevalence of Bartonella spp. was higherwhen H. lavieri was present (100% vs. 17.8%). Theremaining interactions incorporating at least two speciesare weaker and we have not attempted to interpret thesefurther.
Interactions between species basedon quantitative data
Interactions between species should be reflected inquantitative associations in hosts carrying both species.
Fig. 3 Prevalence of A Hepatozoon lavieri, B Trypanosoma sp. andC Bartonella spp. across the 4 years of the study and by host age(Bartonella spp. only). A, minimum sufficient model included ayear·infection interaction (v 2=9.73, df =3, P= 0.021) andseason·age·infection interaction (v 2=11.7, df =4, P= 0.02, datanot shown but see text) and the goodness-of-fit of the model gavev2=51.7 (df =114, P= 1.0). B Minimum sufficient model includeda year·infection interaction (v 2=9.5, df =3, P= 0.022) andseason·age·infection interaction (v 2=9.5, df =4, P= 0.05, datanot shown but see text) and the goodness-of-fit of the model gavev2=69.75 (df =114, P= 0.9996). C Minimum sufficient modelincluded a year·age·infection interaction (v 2=15.5, df =6,P= 0.017) and season·infection interaction (v 2=13.06, df =2,P= 0.002, data not shown but see text) and the goodness-of-fit ofthe model gave v2=83.5 ( df =106, P= 0.95)
275

We first carried out a multiple correlation analysis onabundance data of four of the species in the study usingdata only from animals that carried both species of eachpair (Table 6; excluding infection with H. lavieri becauseonly seven animals carried this species and voles withboth B. microti and Trypanosoma sp. because only threeanimals carried this particular combination). Because ofthe possible risk of type I errors, we implemented theDunn-Sidak correction and accordingly this allowedacceptance of just one of the five possible associations assignificant, i.e. that between Haemobartonella sp. andBartonella spp. (Fig. 8). Interestingly only one otherassociation approached significance.
Some of these relationships could have arisen as aconsequence of differences in parasite burdens attribut-able to year, season, host age and sex effects. To control
for possible bias arising out of the factors known toaffect abundance of parasites (various combinations ofintrinsic and extrinsic factors), we next carried out amultiple correlation analysis on the residuals of eachspecies, following minimum sufficient ANOVAs as de-scribed in the preceding section. Two associations hadhigh correlation coefficients, but because of the Dunn-Sidak correction, we could not accept these as significant(Table 6, Fig. 8B).
In a further approach we carried out a principalcomponents analysis (PCA) on the standardized resid-uals from each of the five ANOVAs. This gave
Fig. 4A–D Prevalence of Babesia microti and Haemobartonella sp.in relation to various combinations of extrinsic and intrinsicfactors. A Variation in prevalence of B. microti across seasons andyears of the study. The minimum sufficient model included ayear·season·infection interaction (v 2=16.9, df =6, P= 0.01).B Variation in prevalence of Haemobartonella sp. across seasonsand years of the study. The minimum sufficient model included ayear·season·infection interaction (v 2=51.32, df =6, P<0.0001).C Variation in the prevalence of B. microti by host sex and acrossthe seasons. The minimum sufficient model included a sea-son·sex·infection interaction (v 2=6.54, df =2, P= 0.038).Goodness-of-fit of the whole model gave v2=69.1 (df =108, P=0.9987). D Variation in the prevalence of Haemobartonella sp. byhost sex and across the seasons. The minimum sufficient modelincluded a season·sex·infection interaction (v 2=10.89, df =2,P= 0.004). Goodness-of-fit of the whole model gave v2=79.62(df =108, P= 0.982)
Table 4 Measures of aggregation for haemoparasites in Microtusarvalis. k Negative binomial exponent, I index of disper-sion=variance to mean ratio, D index of discrepancy (Poulin 1993)
Species k ±SEM I D
Haemobartonella sp. 1.78a ±0.360 2.383 0.577Bartonella spp. 0.189b ±0.028 8.084 0.865Babesia microti 0.029c ±0.005 50.145 0.970Trypanosoma sp. 0.170d ±0.071 1.592 0.931Hepatozoon lavieri 0.010e ND 45.475 0.987
aGoodness-of-fit to the negative binomial distribution v2=20.1,df=5, P =0.005bGoodness-of-fit to the negative binomial distribution v2=13.8,df=5, P <0.025cGoodness-of-fit to the negative binomial distribution v2=1.4,df=2, P =NSdGoodness-of-fit to the negative binomial distribution v2=0.1,df=2, P =NSeGoodness-of-fit to the negative binomial distribution test—calcu-lation not possible
276

approximately similar amounts of variation on each axis(PCA 1=24.7, PCA 2=21.0, PCA 3=19.4, PCA4=18.4%, PCA 5=16.5). Hence no further reductionof the data was possible.
Discussion
This study focused on the factors that regulate thestructure of component communities of haemoparasitesin the European common vole, Microtus arvalis. Build-ing on earlier, mainly descriptive studies from Centraland North-Eastern Europe (Sebek 1978; Karbowiak andSinski 1996a, 1996b), it follows our comprehensiveanalysis of haemoparasitic infections in bank vole(C. glareolus) populations living in the woodlandsadjoining our study sites in the Mazury Lake Districtregion of Poland (Bajer et al. 2001).
The haemoparasites of M. arvalis comprised fivespecies of which Haemobartonella sp. (more recently onthe basis of molecular evidence reclassified as a myco-plasma; Neimark et al. 2001, 2002) was clearly thedominant parasite because prevalence throughout theseasons and across all 4 years of the study washighest with this organism. Although infections withHaemobartonella sp. have been reported from C. glare-olus (Bajer et al. 2001), to our knowledge this parasitehas not been reported previously from Microtus spp.H. lavieri was the least abundant species with just 3.1%of sampled voles infected. Four of the species werecorded are known to infect Microtus spp. in otherregions of Europe (Krampitz 1964; Sebek et al. 1980;Walter and Liebisch 1980), although the dynamics ofinfections and their mutual interactions have not been
evaluated comprehensively (Healing 1981; Young 1970)especially in the context of quantifiable intrinsic andextrinsic factors likely to influence infection.
Across the 4 years of the study 76.9% of the voleswere infected with at least one of the five species thatconstituted the total species richness of the parasitecomponent community. No animals carried all fivespecies, but 11 voles carried a triple infection and threevoles had various combinations of four species. Overallmean species richness was 1.1, a figure similar to butlower than the 1.4 recorded for C. glareolus in theadjoining woodlands (Bajer et al. 2001). The speciesdensity distribution did not differ statistically from thatpredicted by a null model and therefore the frequency ofdetection of two, three and four species co-infectionswas expected given their respective prevalence rates, asrecorded by Bajer et al. (2001) for C. glareolus. Thus, atthis level of analysis, the data did not support the exis-tence of strong associations between species.
In all 4 years mean species richness increased fromspring to summer, and in 2 of the years increased furtherto peak in the autumn, reflecting exposure to newinfections during the summer period, and the onset ofinfections in young susceptible voles as they entered thepopulation following the start of breeding in March–April. Interestingly, in 1997 there was an unexpecteddrop of mean species richness in autumn but we couldnot relate this to any unusual climatic changes in thatyear such as the earlier onset of winter. Thus, althoughseasonal differences affected mean species richness, andthe precise contribution of the seasonal effect variedbetween years, overall mean species richness remainedrelatively stable across the 4 years of our study withannual mean values ranging from 1.0±0.08 (2000) to
Table 5 Minimum sufficient maximum likelihood statistical modelincorporating three quantified factors and all haemoparasitic spe-cies detected in the study. Each row represents a significant inter-
action that therefore forms part of the final model. HspHaemobartonella sp., Bd Bartonella spp., Bm Babesia microti, TspTrypanosoma sp., Hl Hepatozoon lavieri
Principal interactions in explaining variationin data
Parasites Test of individual effects
Extrinsic factors Intrinsic factors v 2 df Pd
Sexc Bm, Tsp, Bd 6.20 1 0.0128Yeara Tsp, Bd, Hsp 13.99 3 0.0029Year Sex Bm, Bl 11.87 3 0.0078
Bm, Hl, Bd 8.81 1 0.0030Ageb Tsp, Hsp 7.13 2 0.0282Age, sex Bd 6.95 2 0.0310
Year Hl, Hsp 11.50 3 0.0093Year Hl, Tsp 10.18 3 0.0171Year Bm, Hsp 23.04 3 <0.0001Year Age Hsp 24.44 6 0.0004Year Age Bd 20.84 6 0.0020
Age Hl 6.50 2 0.0388Goodness-of-fit of the minimum sufficient model specifiedby the interactions listed above
116.2 653 1.0e
aYear—four levels (1997, 1998, 1999, 2000)bAge—three levels (age cohorts 1, 2 and 3)cSex—two levels (male and female)dProbability that excluding the effect will make a significant change to the modeleProbability that the data does not differ significantly from the minimum sufficient model described by the interactions
277

1.4±0.01 (1998). However, this pattern was furtherconfounded by host age, independently of seasonalchanges, because in 2 of the years mean species richnessincreased with host age, and in the alternate 2 years itdeclined, contrastingwith our observations inC. glareolus
(Bajer et al. 2001) where intrinsic factors did not affectmean species richness and the only significant effectswere from season and between-year variation.
In contrast to variation in mean species richness,fluctuations in prevalence and abundance of individualspecies of parasites were considerably more marked.However, infections with Trypanosoma sp. showed theleast variation between years, although 1997 was a peakyear in both prevalence and abundance. The only try-panosome species recorded from common voles in thisregion of Europe is T. microti (Walter and Liebisch1980) and our specimens conformed to the morpholog-ical descriptions of this species, but recent molecularanalyses of trypanosome isolated from A. sylvaticus haveindicated that rodents may carry more than one speciesindistinguishable by conventional microscopy, and thathost-specificity is not as rigid in these host-parasitesystems as previously thought (Noyes et al. 2002).
Overall, prevalence of Trypanosoma sp. in our studywas 8.4% but rose to as high as 27.3% in some subsetsof voles (e.g. age class 2 in autumn). Prevalence rates ofthis order concur with those reported for M. agrestis inGermany and Norway (16.2%, Walter and Liebisch1980; 20.8%, Wiger 1979) and in the UK (20.4%, Young1970; 7–14%, Healing 1981) and further afield in Alaskain other Microtus spp. (Laakkonen et al. 2002). Bothprevalence and abundance of Trypanosoma sp. werehighly seasonal and host-age dependent. Across all4 years of the study no voles sampled in the springperiod carried infection but later infections increased inprevalence and abundance climbing to peak either in thesummer or autumn in older age classes (2 or 3). Theseobservations concur with earlier work on M. agrestis(Young 1970; Wiger 1979; Walter and Liebisch 1980)and with our earlier observations on bank voles, whereseasonal fluctuations were also strong, although a smallproportion of bank voles was already infected in thespring period in most years (Bajer et al. 2001, 2–12%).Rodent Trypanosoma spp. belong to the lewisi group oftrypanosomes and are known to be transmitted by fleas(Molyneux 1969), but theoretically transmission by ticksmay be possible also because live trypanosomes havebeen reported in Ixodes ricinus collected from forests inEurope (Aeschliemann et al. 1979; Karbowiak and Wita2000, Petko, pers. com.). Experimental infections withT. evotomys have shown that parasitaemia can last for3 weeks, with circulating trypomastigotes arising fromintracellular amastigotes in the spleen and lymphoidtissues (Molyneux 1969). Larval I. ricinus increase indensity on vegetation and commence host-finding andfeeding activities in late spring (beginning of June;Pawelczyk 2003), and this, together with an increase inflea activity in the warm months, may explain the sum-mer or autumnal peaks in Trypanosoma sp. infection inM. arvalis.
It is likely that as with other related trypanosomespecies, there is strong acquired immunity, once theprimary infection has been controlled (Albright andAlbright 1991), hence we expected to see this species
Fig. 5 Abundance of A Trypanosoma sp. in different seasons andage classes of voles, B B. microti across the 4 years of the study inthe three age classes andHaemobartonella sp. across 4 years and byseason. A Trypanosoma sp. Main effects of year= F3,315=3.38,0.025> P >0.01 (data not shown, but see text) and age (F2,314=3.07, 0.05> P>0.025), and the interaction between season and ageF4,294=2.45, 0.05> P >0.025. B Analysis of B. microti by four-way ANOVA revealed only a complicated picture with a significantfour-way interaction (F 3,271=3.0, 0.05> P >0.025), one signif-icant three-way interaction (year·season·sex F3,274=3.18, 0.025>P >0.01) and two significant main effects, those of year(F3,315=5.34, 0.005> P >0.001) and age (F 2,314=3.27, 0.05> P>0.025). C Haemobartonella, main effects of season F2,314=6.78(0.005> P >0.001) and year F3,315=9.68 (P <0.001) andinteraction between season and year F5,295=4.83 (P <0.001).GM Geometric mean, RBC red blood cells
278

mainly in young animals, as was found by Healing(1981). In the autumn period this indeed proved to bethe case, but in summer, when both prevalence andabundance were still quite low, infections were margin-ally higher among the oldest animals, perhaps suggestingthat at this stage older voles are more exposed toinfection (Young 1970) but manage to control para-sitaemia better than younger animals in due course. Incontrast to studies on M. agrestis (Walter and Liebisch1980; Young 1970), but consistent with our study onC. glareolus (Bajer et al. 2001), we did not find any sexbias in either prevalence or abundance of infection.
B. microti was the most prevalent protozoan amongthe haemoparasites recorded in M. arvalis. The preva-lence rate of 9% is much higher than recorded in otherstudies from Central/North-Eastern Europe (Mahnert1972; Sebek et al. 1977; Karbowiak et al. 2002) but lowercompared to studies in the UK, Austria and Germany(Young 1970; Sebek et al. 1980; Walter and Liebisch1980; Turner 1986; Turner and Cox 1985). B. microtiwas described for the first time by Franca (1912) inPortugal as Smithia microti from the vole Microtus in-certus (M. arvalis incertus) and voles from the genusMicrotus are still considered to be the main reservoir ofthis human-infectious pathogen worldwide (Watkinset al. 1991; Karbowiak et al. 1999, 2002). Although thereare many records of infections in humans in the USA(Grunwaldt 1977; Parry et al. 1977; Steketee et al. 1985)and also in Europe (Sebek et al. 1977; Krampitz et al.1986), thus far only one case of human babesiosis hasbeen reported in Poland (Humiczewska and Kuzna-Grygiel 1997).
Infections with B. microti were very variable andsubject to both extrinsic and intrinsic factors with noconsistent pattern over the 4 years of the study. Therewas considerable variation between years with preva-lence down to 2.3% in 2000, but as high as 21% in 1998,and this was also reflected in abundance. However thisbetween-year variation was complicated by seasonalchanges. Summer months constituted the only seasonwhen some infections were detected in all 4 years. By the
autumn infections were rare and only detected in 1998,and similarly in spring no infections were detected in2 years, but the highest prevalence on record (50%) wasduring spring in 1998. It may be relevant that in April of1998 the mean intensity of tick infestation in woodlandrodents, which constitute the main reservoir of tickslocally, was markedly higher than in other years of study(Sinski and Paweczyk 1999, Paweczyk 2003). Both thelarvae and nymphs of the tick I. ricinus are vectors forthis parasite (Walter and Liebisch 1980) and both feed-ing larvae and nymphs were found in greatest numberson M. arvalis during late spring and early summermonths in our study sites, so this is when normallytransmission would have been most intense (Pawelczyk2003). Similar seasonal trends were observed by Young(1970) and Walter and Liebisch (1980) in M. agrestis.Infections were most common in males in summer, butin female voles there was a curious bimodal distributionwith peaks in the spring and autumn. Although preva-lence did not vary significantly with age, abundance wasclearly highest among the oldest (age class 3) volesacross all 4 years of the study. This suggests that volesacquire infection with age or are more exposed toinfection with increasing age and indeed, higher tickinfestation rates were observed among heavier i.e. oldervoles (Pawelczyk 2003) in our study site. This concurswith Young (1970) and Healing (1981) working onM. agresitis, and Turner (1986) on C. glareolus andA. sylvaticus, all of whom found B. microti infections tobe more frequent among older hosts.
H. lavieri is a parasite for which only the sexualphases, the gametocytes, are quantifiable from bloodsmears, since the ex-erythrocytic stages reside in thelungs where they can last for several months (Krampitzand Haberkorn 1988). Hence the real prevalence wasprobably much higher than the 3.1% based on thepresence of gametocytes in peripheral blood and this waswell within the range of prevalence rates (0.2–17.4%)reported by others (Laakkonen et al. 2002; Healing1981; Young 1970, Krampitz 1964; Mahnert 1972). InC. glareolus sampled from the forest adjoining the
Fig. 6 Abundance of Bartonellaspp. in three age classes, and byseason and year of the study.Analysis by four-way ANOVArevealed only one significantthree-way interaction(year·season·age, F7,278=3.2,0.005> P >0.001) and three,two-way interactions (sex·age,F2,292=3.1, 0.05> P >0.025;year·age, F6,296=3.13, 0.005>P >0.001; year·season,F5,295=2.72, 0.025> P >0.01).For abbreviations, see Fig. 6
279
grassland meadows where M. arvalis were trapped, andduring the same years, prevalence of H. erhardovae was10 times higher (Bajer et al. 2001). Laakkonen et al.(2001) reported very similar results in their study fromnorthern Europe. As with Trypanosoma sp., infectionswith H. lavieri were rarest in the spring (only one youngvole infected) and more common in summer and au-tumn, and among the oldest age class. In some respectsthis pattern is similar to that reported by Young (1970)who found very marked seasonal patterns in M. agrestisin the UK characterised by a peak in prevalence in the
summer months (18%). The youngest voles in our studyshowed the highest prevalence (4.6%), although preva-lence was similar in age class 3 (3.8%), but infectionswere surprisingly absent from age class 2, a pattern thatcontrasts with that found by Young (1970) who reportedprevalence of Hepatozoon sp. as increasing sequentiallywith age of M. agrestis (0%, 5.6%, 10% and 20%,respectively for age classes 1, 2, 3 and 4). Healing (1981)found little variation between age classes in M. agrestisbut prevalence in his study was very low (1.2–1.4%). Wewere not able to sample rodents in the winter periodbecause of climatic restrictions, but nevertheless thethree seasons generated a complex picture in which thebetween-year effect was stronger than any underlyingseasonal effect as in our parallel study in C. glareolus(Bajer et al. 2001).
Bartonella spp. (previously known as Grahamellaspp., see Birtles et al. 1995) have in the past been des-ignated as separate species mainly by host of origin(Krampitz and Kleinschmidt 1960). However, this ap-proach was questioned early on (Hoyte 1954) and con-cern is supported by recent evidence, based on moleculartechniques, which demonstrated that M. agrestis canharbour up to three genotypes some of which are sharedwith other rodent hosts (Birtles et al. 1994). Althoughthe species affecting Microtus sp. has been referred to asB. doshiae in the past and more recently (Birtles et al.1995), with more than a single genotype now recognizedfrom M. agrestis, this may no longer be appropriatewithout molecular confirmation. Bartonella spp. usuallyshow a high prevalence in rodent populations and in ourstudy this was 28% which is towards the top end of therange reported in Microtus spp. by Laakkonen et al.(2002), Healing (1981), Young (1970), and that found byMahnert (1972) and Sebek et al. (1980) (0%, 15.4%,16.6%, 9–22% and 8–28%, respectively).
Bartonella spp. are transmitted by fleas (Krampitz1962) and some species, e.g. B. grahamii, are known tolast as long as 120 days in rodents (Tyzzer 1942). Speciesof Bartonella are also known to be infective to humans(Birtles et al. 1995, Anderson and Neuman 1997) al-though there is currently no evidence to indicate that thespecies harboured byM. arvalis fall into this category. Inour study the prevalence of Bartonella spp. varied sig-nificantly between seasons, rising from a low value inspring, as in the case of some of the preceding speciesdiscussed above, and peaking in summer and autumnmonths, a pattern similar to that seen by Young (1970)in M. agrestis and by Turner (1986) and Bajer et al.(2001) in C. glareolus, and most likely explained by theincrease in flea densities from winter to summer(Krampitz 1962).
There was no clear effect of age on either prevalenceor abundance of Bartonella spp. in this and our previousstudy on bank voles (Bajer et al. 2001), but age-relatedvariation in both parameters was dependent on year ofstudy and host sex. However, despite these interactions,generally the infections were more common andmore intense in the two youngest age classes (1 and 2)
Fig. 7A–C Associations between species based on prevalence.A Prevalence of Haemobartonella sp. among voles either infectedor not infected with B. microti by year of the study. B Prevalence ofHeamobartonella sp. in voles with either Bartonella spp. orTrypanosoma sp, both or none of these species, by year of study.C Prevalence of Hepatozoon lavieri in voles with and withoutB. microti and Bartonella spp.
280

compared with age class 3 suggesting that age-dependentimmunity may be a feature of this host-parasite rela-tionship. A similar age-dependent pattern was found byHealing (1981) but not by Young (1970).
It is not possible to reliably distinguish between someof the Anaplasmataceae and mycoplasma species onGiemsa-stained blood smears and this can only be donereliably by sequencing the 16rDNA genes (Neimarket al. 2001, 2002). Moreover, since infections due tomycoplasma species have not been found to date inMicrotus spp. we treated the organisms infecting ouranimals as Haemobartonella sp. However, we cannot betotally confident about this nor about the species in-volved. H. microti has been described from M. pennsyl-vaniucus in the USA (Tyzzer and Weinman 1939) andH. arvicolae from common vole ( M. arvalis), (Yakimoff1928 after Weinman 1944). The Anaplasmataceae aretransmitted by arthropod vectors, and likely candidatesin this region are fleas and lice (Weinman 1944; Gotheand Kreier 1977). If both arthropods are involved,inevitably cycles of transmission will be complex becauseof the different seasonal occurrence of these vectors. Asin our recent study of C. glareolus (prevalence=63%,Bajer et al. 2001), prevalence in M. arvalis was high(64%) and our data are the first to report such a highprevalence of Haemobartonella sp. in Microtus sp. inEurope. Young (1970) failed to detect this parasite in the210 field voles that he examined. The season of maxi-mum prevalence and abundance was not entirely pre-dictable, depending on the year of study, although it wasalways either the summer or the autumn. A priority forfuture work on this taxon of parasites, must be to cha-racterise the genotypes and their host specificities(Neimark et al. 2001, 2002).
With five species of parasites affecting the host pop-ulation, a large number of two-way, three-way and four-way associations between species were possible, but ourprevalence data revealed only eight sets of two- andthree-way associations between species, and these were
mostly dependent to some extent on one of the intrinsicand extrinsic factors in the model. There were no clearpatterns of co-occurrence or exclusion by any two spe-cies. In the significant interaction between Bartonellaspp. and B. microti the occurrence of co-infections de-pended on the year of study: in 1997 voles carryingB. microti were more likely to be infected with Bartonellaspp.; in 1998 there was no difference; in 1999 Bartonellaspp. were found only among voles without B. microti butprevalence of B. microti was low in that year; in 2000, as
Table 6 Analysis of quantitative associations between species. Each test was carried out on voles carrying both species in the pairspecified. rs Spearman’s correlation coefficient, NS not significant
Combination na Raw data Residualsb
rs Pc rs P
Babesia microti +Bartonella spp.6 0.426 NS 0.371 NS
B. microti+ Haemobartonella sp.21 0.444 0.047 0.455 0.042
Trypanosoma sp.+Bartonella spp.10 0.073 NS )0.402 NS
Trypanosoma sp.+Haemobartonella sp.20 0.357 NS 0.223 NS
Bartonella spp.+Haemobartonella sp.68 0.496 0.0001 0.265 0.030
aNumber of voles carrying both speciesbResiduals from minimum sufficient ANOVAs in generalized linear interactive modelling as explained in the textcProbability (two-tailed). Applying the Dunn-Sidak correction for multiple comparisons, we accept P=0.0102 as the cut-off for rejectingthe null hypothesis (Sokal and Rohlf 1981)
Fig. 8 Correlation between the abundance of Bartonella spp. andHaemobartonella sp. based on A raw data or B residuals ofminimum sufficient ANOVAs
281

in 1998, infection with B. microtimade little difference tothe prevalence of Bartonella spp. The second significantinstance of co-infection between parasites involved threespecies — Haemobartonella sp., Bartonella spp. andTrypanosoma sp. but was also dependent on year of thestudy. Generally, prevalence of Haemobartonella sp. washigh in Bartonella spp.-infected voles, and even higher ifthey were additionally infected with Trypanosoma sp.,although there were exceptions in 1997 and 1998. Theonly case of an interaction that was not context depen-dent was the three-way interaction between B. microti,H. lavieri and Bartonella spp., and in which voles withB. microti and Bartonella sp. were more likely to beinfected also with H. lavieri. This has some similarity tothe association between Bartonella spp. and B. microti inbank voles (Bajer et al. 2001). The only one case of aclearly positive quantitative interaction was observed inthe association of Bartonella spp. and Haemobartonellasp. but even this did not retain significance after con-trolling for the effects of extrinsic and intrinsic factors onthe abundance of each species and multiple compari-sons. Interestingly, this association was the only signif-icant quantitative association that we found in thecase of the haemoparasite component community inC. glareolus (Bajer et al. 2001) where significance wasretained after controlling for extrinsic and intrinsic fac-tors. Associations between Hepatozoon spp., Bartonellaspp. and Trypanosoma species have also been reportedpreviously (Healing 1981; Young 1970).
Finally, this study represents the first comprehensiveanalysis of the haemoparasitic component communitystructure of M. arvalis from North-Eastern Europe. Ourdata established that this component community, likethat of C. glareolus (Bajer et al. 2001) is highly dynamic,with marked variation between years and seasonsamong individual species of haemoparasites, but greaterconsistency with respect to overall mean species richness.The extrinsic factors (year and season), and their inter-action, were responsible for the greatest proportion ofthe variation in our data. Our analyses did not attributemarked roles to host intrinsic factors (sex and age) inshaping the structure of this component community andalthough host age influenced infections to varying de-grees, in no case was host age on its own a majordeterminant of variation in data. Rather, host intrinsicfactors contributed to the two- and three-way interac-tions that we detected. It is also interesting to note thatafter the failure and widespread abandonment of thecollective agricultural system in this part of Poland inthe early 1990s, natural succession on the fallow grass-lands on which our studies were conducted has led toincreasing colonisation by birch forming forests ofyoung trees, and the populations of common voles arerapidly losing their habitats (Rogozinska 1997). It willbe interesting to monitor the effect of these ecologicalchanges on the haemoparasites component communitybecause in the years ahead transmission potential islikely to decline as the habitat becomes increasinglyfragmented. The haemoparasite component communities
may therefore alter radically as M. arvalis sub-popula-tions become increasingly isolated.
Acknowledgements We are grateful to the British Council UK, tothe former State Committee for Scientific Research (KBN) Poland(KBN grants UM 855 and UM 930), and to the Ministry of Sci-entific Research and Information Technology (British-PolishYoung Scientist Programme, 2003) for financial support for thisstudy. We wish also to express our gratitude to Prof. Dr Hab.M. Kozakiewicz, Dr R. Halba and Mr. G. Gorecki for the use of,and hospitality at, the field station in Urwitalt.
References
Adamczewska-Andrzejewska KD (1973) The lens weight as indi-cator of age in the wild Microtus arvalis populations. Bull AcadPol Sci Cl 2 21:331–336
Aeschliemann A, Burgdorfer W, Matile H, Peter O, Wyler R (1979)Aspects nouveaux du role de vecteur joue par Ixodes ricinus L.en Suisse. Acta Trop 36:181–191
Albright JW, Albright JF (1991) Rodent trypanosomes: theirconflict with the immune system of the host. Parasitol Today7:137–140
Anderson BE, Neuman MA (1997) Bartonella spp. as emerginghuman pathogens. Clin Microbiol Rev 10:203–219
Bajer A (2002) Gryzonie roz_nych siedlisk jako zrodo zaraz_enCryptosporidium: biologiczna i molekularna charakterystyka i-zolatow. PhD thesis. Department of Parasitology, University ofWarszawa, Warszawa
Bajer A, Paweczyk A, Behnke JM. Gilbert FS, Sinski E (2001)Factors affecting the component community structure ofhaemoparasites in bank voles ( Clethrionomys glareolus) fromthe Mazury lake district region of Poland. Parasitology122:43–54
Bajer A, Bednarska M, Pawelczyk A, Behnke JM, Gilbert FS,Sinski E (2002) Prevalence and abundance of Cryptosporidiumparvum and Giardia spp. in wild rural rodents from the MazuryLake District region of Poland. Parasitology 125:21–34
Baker JR (1974) Protozoan parasites of the blood of British wildbirds and mammals. J Zool 172:169–190
Baker JR, Chitty D, Phipps E (1963) Blood parasites of wild voles,Microtus agrestis , in England. Parasitology 53:297–301
Balashov JS (1995) The interrelationship of Ixodid ticks ( Ixodidae)with the causative agents of transmissible vertebrate infections.Parazitologiia 29:337–352
Behnke JM, Lewis JW, Mohd Zain SN, Gilbert FS (1999) Hel-minth infections in Apodemus sylvaticus in southernEngland:interactive effects of host-age, sex and year on preva-lence and abundance of infections. J Helminthol 73:31–44
Birtles RJ, Harrison TG, Molyneux DH (1994) Grahamella in smallwoodland mammals in the U.K.:isolation, prevalence and hostspecificity. Ann Trop Med Parasitol 88:317–327
Birtles RJ, Harrison TG, Saunders NA, Molyneux DH (1995)Proposal to unify the genera Grahamella and Bartonella, withdescriptions of Bartonella talpae comb. nov., and three newspecies, Bartonella grahamii sp. nov., Bartonella taylorii sp.nov., and Bartonella doshiae sp. nov. Int J Syst Bacteriol45:1–8
Crawley MT (1993) GLIM for ecologists. Blackwell, OxfordDash KM, Hall E, Barger IA (1988) The role of arithmetic and
geometric mean worm egg counts in faecal egg count reductiontests and in monitoring strategic drenching programs in sheep.Aust Vet J 65:66–68
Elliott JM (1977) Some methods for the statistical analysis ofsamples of benthic invertebrates. Freshwater Biological Asso-ciation, Cumbria, UK
Franca C (1912) Sur la classification des piroplasmes et descriptionde deux formes de ces parasites. Arq Inst Bacteriol CamaraPestana Lisbon 3:11–18
282

Gothe R, Kreier JP (1977) Aegyptianella, Eperythrozoon andHaemobartonella. In: Kreier JP (ed) Parasitic protozoa, vol IV.Academic Press, New York, pp 251–294
Grunwaldt E (1977) Babesiosis on Shelter Island. NY State J Med8:1320–1321
Healing TD (1981) Infections with blood parasites in small Britishrodents Apodemus sylvaticus, Clethrionomys glareolus and Mi-crotus agrestis. Parasitology 83:179–189
Hoyte HMD (1954) Grahamella (Rickettsiales) in the commonshrew Sorex araneus. Parasitology 46:224–234
Humiczewska M, Kuzna-Grygiel W (1997) Przypadek impor-towanej ludzkiej babesiozy w Polsce. Wiad Parazytol 43:227–229
Janovy J Jr, Clopton RE, Clopton DA, Snyder SD, Eftin A, KrebsL (1995) Species density distributions as null models for eco-logically significant interactions of parasite species in anassemblage. Ecol Model 77:189–196
Karbowiak G, Sinski E (1996a) The finding of Babesia microti inbank vole Clethrionomys glareolus in the district of MazuryLakes (Poland). Acta Parasitol 41:50–51
Karbowiak G, Sinski E (1996b) Occurrence and morphologicalcharacteristics of a Trypanosma evotomys strain from NorthPoland. Acta Parasitol 41:105–107
Karbowiak G, Wita I (2000) Rola krwiopijnych stawonogow jakoprzenosicieli niepatogenicznych swidrowcow z rodzaju Try-panosoma, grupy Stercoraria, w Europie. In: Buczek A, BlaszakC (eds) Stawonogi pasozytnicze i alergogenne. KGM, Lublin,pp 151–169
Karbowiak G, Stanko M, Rychlik L, Nowakowski W, Siuda K(1999) The new data about zoonotic reservoir of Babesia microtiin small mammals in Poland. Acta Parasitol 44:142–144
Karbowiak G, Wita I, Czaplinska U (2002) Protozoan parasites inthe blood of the social vole (Microtus socialis) in Askania Novareserve, Ukraine. Proceedings of the 12th Conference of theUkraine Scientific Society for Parasitology (UNTP). UNTP,Kijev, p 131
Krampitz HE (1962) Weitere intersuchungen an Grahamella, Bru-mpt, 1911. Z Tropmed Parasitol 13:34–53
Krampitz HE (1964) Uber das Vorkommen und Verhalten vonHaemococcidien der Gattung Hepatozoon, Miller 1908 (Proto-zoa, Adeleida) in mittel- und sudeuropaischen Saugern. ActaTrop 21:114–154
Krampitz HE (1981) Development of Hepatozoon erhardovaeKrampitz, 1964 (Protozoa:Haemogregarinidae) in experimentalmammalian and arthropod hosts. II. Sexual development infleas and sporozoite indices in xenodiagnosis. J Trop Med Hyg75:155–157
Krampitz HE, Haberkorn A (1988) Experimental treatment ofHepatozoon infections with anticoccidial agent toltrazuril. J VetMed B 35:131–137
Krampitz HE, Kleinschmidt A (1960) Grahamella Brumpt 1911.Biologische und morphologische untersuchungen. Z Tropen-med Parasitol 11:336–352
Krampitz HE, Buschmann H, Munchhoff P (1986) Gibt es latenteBabesien-infektionen beim Menschen in Suddeutschland? MittOesterr Gese Tropenmed Parasitol 8:233–243
Laakkonen J, Sukura A, Oksanen A, Henttonen H, Soveri T (2001)Haemogregarines of the genus Hepatozoon (Apicomplexa:Adeleina) in rodents from northern Europe. Folia Parasitol(Prague) 48:263–267
Laakkonen J, Henttonen H, Hastriter MW, Niemimaa J, JarrellGH (2002) Hemoparasites and fleas of shrews and rodents fromAlaska. Acta Parasitol 47:254–257
Mahnert V (1972) Grahamella und Sporozoa als Blutparasitenalpiner Kleinsauger. Acta Trop 29:88–100
Margolis L, Esch GW, Holmes JC, Kuris AM, Schad GA (1982)The use of ecological terms in parasitology (report of an ad hoccommittee of The American Society of Parasitologists).J Parasitol 68:131–133
Molyneux DH (1969) The morphology and biology of Trypano-soma (Herpetosoma) evotomys of the bank-vole, Clethrionomysglareolus. Parasitology 59:843–857
Morris P (1972) A review of mammalian age determinationmethods. Mammal Rev 2:69–104
Neimark H, Johansson K-E, Rikihisa Y, Tully JG (2001) Pro-posal to transfer members of the genera Haemobartonella andEperythrozoon to the genus Mycoplasma with descriptions ofCandidatus Mycoplasma haemofelis, Candidatus Mycoplasmahaemomuris, Candidatus Mycoplasma haemosuis and Can-didatus Mycoplasma wenyonii. Int J Syst Evol Microbiol51:891–899
Neimark H, Barnaud A, Gounon,P, Michel JC, Contamin H(2002) The putative haemobartonella that influences Plasmo-dium falciparum parasitaemia in squirrel monkeys is a haemo-trophic mycoplasma. Microbes Infect 4:693–698
Noyes HA, Ambrose P, Barker F, Begon M, Bennet M, Bown KJ,Kemp SJ (2002) Host specificity of Trypanosoma ( Herpetoso-ma) species:evidence that bank voles ( Clethrionomys glareolus)carry only one T.( H.) evotomys 18S rRNA genotype but woodmice ( Apodemus sylvaticus) carry at least two polyphyleticparasites. Parasitology 124:185–190
Parry MF, Fox M, Burka SA, Richar WJ (1977) Babesia microtiinfection in man. J Am Med Assoc 238:1282–1283
Pawelczyk A (2003) Rola dziko zyjacych gryzoni w utrzymywaniuw przyrodzie zrodel infekcji Borrelia burgdorferi sensu lato.PhD thesis. Department of Parasitology, University of Warsz-awa, Warszawa
Paweczyk A, Sinski E (2000) Prevalence of IgG antibodies responseto Borrelia burgdorferi s.l. in populations of wild rodents fromMazury LakesDistrict, Poland. AnnAgric EnvironMed 7:79–83
Poulin R (1993) The disparity between observed and uniform dis-tributions: a new look at parasite aggregation. Int J Parasitol23:937–944
Rogozinska M (1997) Sukcesja w zgrupowaniu drobnych ssakowugorowanego pola uprawnego. Stan w 4 lata po rozpoczeciuugorowania. (Changes in the population structures of smallmammals on fallow fields, previously cultivated. Appraisal4 years after the cessation of cultivation.) MSc thesis. Depart-ment of Ecology, University of Warszawa, Warszawa
Sebek Z (1978) Blood parasites of small mammals in WesternHungary. Parasitol Hung 11:17–21
Sebek Z, Rosicky B, Sixl W (1977) The occurrence of babesiasisaffecting small terrestrial mammals and the importance of thiszoonosis in Europe. Folia Parasitol (Prague) 24:221–228
Sebek Z, Sixl W, Stunzner D, Valova M, Hubalek Z, Troger H(1980) Zur Kenntnis der Blutparasiten wildlebender Kleinsau-ger in der Steiermark und im Burgenland. Folia Parasitol(Prague) 27:295–301
Sinski E, Pawelczyk A (1999) Detection of reservoirs for Lymeborreliosis in the Mazury Lake district, Poland. ZentralblBakteriol 289:689–703
Sokal RR, Rohlf FJ (1981) Biometry, 2nd edn. Freeman, SanFrancisco, Calif.
Stanko M, Miklisova D (2002) Infestation trends of two rodentspecies (Rodentia, Muridae) on the East Slovakian Lowland.In:Buczek A, Baszak C (eds) Stawonogi w medycynie.Wydawnictwo Drukarnia LIBER, Lublin, pp 105–114
Steketee RW, Eckman MR, Burgess EC, Kuritsky JN, DickersonJ, Schell WD, Godsey MS, Davis JD (1985) Babesiosis inWisconsin:a new focus of disease transmission. J Am MedAssoc 253:2675–2678
Turner CMR (1986) Seasonal and age distributions of Babesia,Hepatozoon , Trypanosoma and Grahamella species in Clethr-ionomys glareolus and Apodemus sylvaticus populations. Para-sitology 93:279–289
Turner CMR, Cox FEG (1985) Interspecific interactions betweenblood parasites in a wild rodent community. Ann Trop MedParasitol 79:463–465
Tyzzer EE (1942) A comparative study of Grahamella, Haemo-bartonella and Eperythrozoa in small mammals. Proc Am PhilosSoc 85:359–398
Tyzzer EE, Weinman D (1939) Haemobartonella n.g. ( Bartonellaolim. pro parte). H. microti n. sp. of the field vole. Am J Hyg30:141–157
283

Walter G, Liebisch A (1980) Studies of the ecology of someblood Protozoa of mammals in north Germany. Acta Trop37:31–40
Watkins RA, Moshier SE, O’Dell WD, Pinter AJ (1991) Spleno-megaly and reticulocytosis caused by Babesia microti infectionsin natural populations of the montane vole, Microtus montanus.J Protozool 38:573–576
Wiger R (1979) Seasonal and annual variations in the prevalence ofblood parasites in cyclic species of small rodents in Norway
with special reference to Clethrionomys glareolus. Holarct Ecol2:169–175
Wilson K, Grenfell BT (1997) Generalized linear modelling forparasitologists. Parasitol Today 13:33–38
Weinman D (1944) Infectious anaemia due to Bartonella andrelated red cell parasites. Trans Am Philos Soc 33:243–350
Young A (1970) Studies on the blood parasites of small mammmalswith special reference to piroplasms. PhD thesis. University ofLondon, London
284