a one-way nested tsunami computation model for the penang...
TRANSCRIPT

A one-way nested tsunami computation model for the Penang Island
in Peninsular Malaysia
MD. FAZLUL KARIM, AHMAD IZANI M. ISMAIL, MOHAMMED ASHAQUE MEAH
School of Mathematical Sciences, Universiti Sains Malaysia, 11800 Penang, Malaysia
Abstract: A one-way nested tsunami computation model is developed and applied to compute the
response of the 2004 Indonesian tsunami along the coastal belts of Penang Island in Peninsular Malaysia.
In this study, a one-way nested finite difference scheme is used to solve the depth averaged shallow water
equations in Cartesian coordinates. A fine mesh numerical scheme (inner scheme) for the west coast of
Malaysia covering 5º10´-5º35´N and 100º-100º30´E has been nested into a coarse mesh scheme (outer
scheme) enclosing 2º-14ºN and 90º-100º30´E. The fine mesh scheme incorporates the Penang Island more
accurately as the grid size is considered small. In a one-way nested grid model, information (velocity
components and sea surface elevation) from the coarse mesh scheme could enter and affect the fine mesh
scheme through the interface between them in each time step of the solution process, while disturbances
from the fine mesh do not feed back to the coarse one. The outer scheme is thus running completely
independent in each time step of the solution process. A simulation experiment shows that the
performance of the inner scheme of the one-way nested model is superior in accuracy compared to that of
outer scheme. Different aspects of tsunami along the coastal belts of Penang Island have been computed
through outer and inner schemes and the results are found to be satisfactory.
Key words: Coupled tsunami model, Tsunami, Penang Island, Indonesian Tsunami 2004.
1. Introduction
Penang Island in the northern part of Peninsular
Malaysia is vulnerable to seismic sea waves, or
tsunamis, generated along the active subduction
zone of Sumatra and that was demonstrated on
26 December 2004. It was reported that 68
people died in Penang state of Malaysia (AFP,
2005), out of which 57 were from Penang Island
(Yasin, 2005) and the remaining were from the
mainland land of Penang. As the Indian Ocean
has several seismic sources, recurrence of
tsunamis on the scale of 2004 event can be
anticipated in future. So, it is essential that
tsunamis are studied in detail and prediction
models be developed to simulate different
aspects of tsunami along the coastal belts of
Penang Island.
Tsunami models have been developed by
various investigators after occurrence of 2004
Indonesian event. Kowalik et al. (2005)
developed a spherical polar shallow water
model, with a very fine mesh resolution, to
simulate the 2004 Indonesian tsunami
throughout the globe between 80oS and 69oN
latitudes. A nonlinear polar coordinate shallow
water model has been developed by Roy et al.
(2007) to compute tsunamis due to 2004
Indonesian event along North Sumatra and
Penang Island. Karim et al. (2006) developed a
linear Cartesian coordinate shallow water model
for tsunami computation along the west coast of
Thailand and Malaysia. Karim et al. (2007) also
investigated the effect of the different
orientations of the source of 2004 Indonesian
tsunami along the coastal belts of Penang Island.
Most of the past attempts to develop nesting
approaches (either one-way or two-way) have
been only for storm surge modelling. The most
notable contributions are Johns et al. (1985),
Roy et al. (1995), Jones and Davis (1998), Roy
and Kabir (2004). The grid nesting could be
implemented by one-way or two-way. In a one-
way nested grid model, information (velocity
components and sea surface elevation) from the
coarse mesh could enter and affect the fine mesh
through the interface between them, while
disturbances from the fine mesh do not feed
Proceedings of the 7th WSEAS International Conference on SYSTEM SCIENCE and SIMULATION in ENGINEERING (ICOSSSE '08)
ISSN: 1790-2769 47 ISBN: 978-960-474-027-7

back to the coarse one. Because it is simpler and
requires less computer time (Koch and
McQueen, 1987; Yu and Zhang, 2002), the one-
way approach is used in most nested ocean and
atmosphere models (e. g. Davis and Flather,
1987, Johns et al. 1985, Roy 1995, Monbaliu et
al. 2000). In a two-way nested-grid model,
however, not only does the coarse grid scheme
affect the fine scheme, but also the fine one
influences the coarse one. Koch and McQueen
(1987) remarked that the exchange of
information between the two meshes was more
realistic particularly when strong mesoscale
disturbances were generated within the fine
model.
The west coast of Peninsular Malaysia has high
bending, very irregular in shape and many off-
shore islands. Proper incorporation of coastline
and island boundaries in a numerical scheme is
essential for accurate estimation of water levels
due to tsunami. For that purpose a numerical
scheme consisting of very fine mesh is required
along the coastal belt, whereas this is
unnecessary away from the coast. Consideration
of very fine mesh over the whole analysis area
involves, unnecessarily, more memory and more
CPU time in the solution process and invites
problem of numerical instability. A nested grid
system is especially suitable for incorporation of
coastline and island boundaries which require a
fine resolution. A nested numerical scheme
(inner scheme with fine resolution) within the
parent model (outer scheme with coarse
resolution) can record fine orographical detail in
the regions of principal interest and this is
particularly important for Penang region.
The Malacca strait (Singapore to Penang) is a
shallow sea with an average depth of about 75 m
and a maximum depth of 200m. On the other
hand, the whole computational domain of the
present study (2º-14º N and 90º-100º30´E.)
includes eastern part of the Indian Ocean and the
depth varies from 5 m to 3000 m. Since the
wave celerity depends on ocean depth, and the
model domain covers both shallow water and
deep sea, large gradient of velocities are
expected near shallow regions. When large
gradient of a physical quantity within a confined
area is expected, the nested grid system is a
possible method to enhance the numerical
accuracy with the least grid numbers.
In this study, in the light of bathymetry and the
curvilinear nature of Penang Island, a one-way
nested numerical scheme is used to compute the
response of 2004 Indonesian tsunami along the
coastal belts of Penang Island.
2. Numerical Model
2.1. Depth averaged shallow water equations
In Cartesian coordinates, the following
governing equations, including the depth-
averaged continuity equation and momentum
equations are used in the present model. The
depth-averaged shallow water equations are
! ! 0)()( "#$
$##
$
$#
$
$vh
yuh
xt%%
%
(1)
(
xFu u uu v f v g
t x y x )h
%
& %
$ $ $ $# # ' " ' '
$ $ $ $ #
(2)
(
yFv v vu v f u g
t x y y
%
& %
$ $ $ $# # # " ' '
)h$ $ $ $ #
(3)
where % is the sea surface elevation above the
undisturbed sea level; h the depth of undisturbed
water; u, v the x- and y- components of the
depth-mean current; f the Coriolis parameter;
Fx , Fy the components of bottom friction; g the
gravity acceleration; Cf the friction coefficient;
& the water density.
The parameterization of the bottom stress is
done by the depth averaged velocity
components:
( ) ( )1/ 2 1/ 2
2 2 2 2and x f y fF C u u v F C v u v& &" # " # (4)
The origin of the system of coordinates is
located on the undisturbed sea surface.
2.2. Boundary Conditions of parent (outer)
model
Other than the west coast of Peninsular
Malaysia, the boundaries are considered as
Proceedings of the 7th WSEAS International Conference on SYSTEM SCIENCE and SIMULATION in ENGINEERING (ICOSSSE '08)
ISSN: 1790-2769 48 ISBN: 978-960-474-027-7
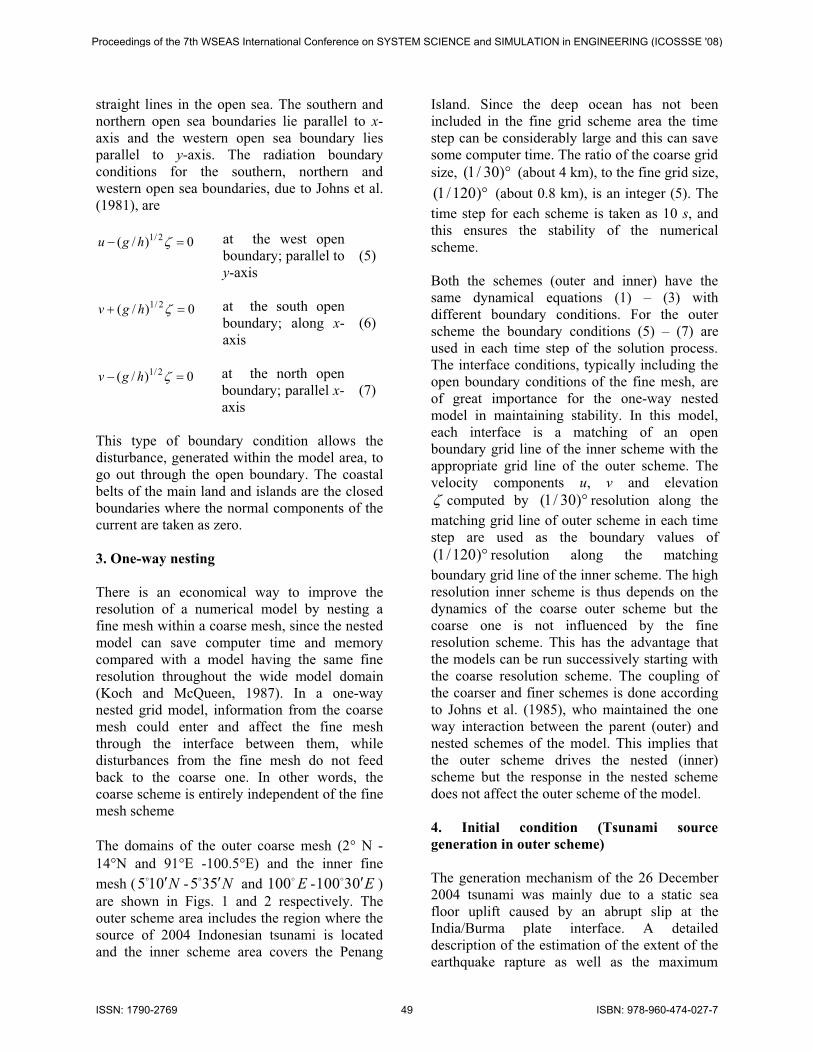
straight lines in the open sea. The southern and
northern open sea boundaries lie parallel to x-
axis and the western open sea boundary lies
parallel to y-axis. The radiation boundary
conditions for the southern, northern and
western open sea boundaries, due to Johns et al.
(1981), are
0)/( 2/1 "' %hgu at the west open
boundary; parallel to
y-axis
(5)
0)/( 2/1 "# %hgv at the south open
boundary; along x-
axis
(6)
0)/( 2/1 "' %hgv at the north open
boundary; parallel x-
axis
(7)
This type of boundary condition allows the
disturbance, generated within the model area, to
go out through the open boundary. The coastal
belts of the main land and islands are the closed
boundaries where the normal components of the
current are taken as zero.
3. One-way nesting
There is an economical way to improve the
resolution of a numerical model by nesting a
fine mesh within a coarse mesh, since the nested
model can save computer time and memory
compared with a model having the same fine
resolution throughout the wide model domain
(Koch and McQueen, 1987). In a one-way
nested grid model, information from the coarse
mesh could enter and affect the fine mesh
through the interface between them, while
disturbances from the fine mesh do not feed
back to the coarse one. In other words, the
coarse scheme is entirely independent of the fine
mesh scheme
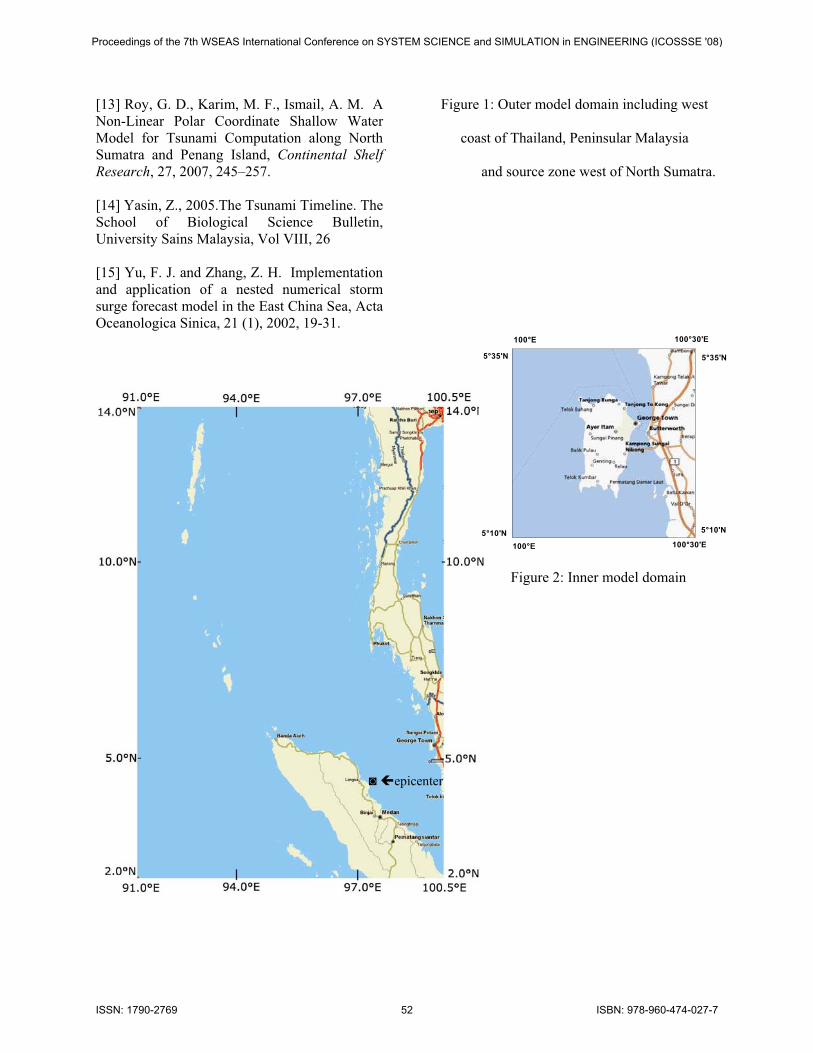
The domains of the outer coarse mesh (2* N -
14*N and 91*E -100.5*E) and the inner fine
mesh ( - and 1005 10 N+ 5 35 N+ E -100 30 E+
)
are shown in Figs. 1 and 2 respectively. The
outer scheme area includes the region where the
source of 2004 Indonesian tsunami is located
and the inner scheme area covers the Penang
Island. Since the deep ocean has not been
included in the fine grid scheme area the time
step can be considerably large and this can save
some computer time. The ratio of the coarse grid
size, (about 4 km), to the fine grid size,
(about 0.8 km), is an integer (5). The
time step for each scheme is taken as 10 s, and
this ensures the stability of the numerical
scheme.
*)30/1(
*)120/1(
Both the schemes (outer and inner) have the
same dynamical equations (1) – (3) with
different boundary conditions. For the outer
scheme the boundary conditions (5) – (7) are
used in each time step of the solution process.
The interface conditions, typically including the
open boundary conditions of the fine mesh, are
of great importance for the one-way nested
model in maintaining stability. In this model,
each interface is a matching of an open
boundary grid line of the inner scheme with the
appropriate grid line of the outer scheme. The
velocity components u, v and elevation
% computed by resolution along the
matching grid line of outer scheme in each time
step are used as the boundary values of
resolution along the matching
boundary grid line of the inner scheme. The high
resolution inner scheme is thus depends on the
dynamics of the coarse outer scheme but the
coarse one is not influenced by the fine
resolution scheme. This has the advantage that
the models can be run successively starting with
the coarse resolution scheme. The coupling of
the coarser and finer schemes is done according
to Johns et al. (1985), who maintained the one
way interaction between the parent (outer) and
nested schemes of the model. This implies that
the outer scheme drives the nested (inner)
scheme but the response in the nested scheme
does not affect the outer scheme of the model.
*)30/1(
*)120/1(
4. Initial condition (Tsunami source
generation in outer scheme)
The generation mechanism of the 26 December
2004 tsunami was mainly due to a static sea
floor uplift caused by an abrupt slip at the
India/Burma plate interface. A detailed
description of the estimation of the extent of the
earthquake rapture as well as the maximum
Proceedings of the 7th WSEAS International Conference on SYSTEM SCIENCE and SIMULATION in ENGINEERING (ICOSSSE '08)
ISSN: 1790-2769 49 ISBN: 978-960-474-027-7

uplift and subsidence of the seabed is given in
Kowalik et al. (2005) and this estimation is
based on Okada (1985). From the deformation
contour, it is seen that the estimated source zone
is between 92* E to 97*E and 3*N to 10*N,
elongated along the fault which is aligned from
south-east to north-west, with a maximum uplift
of 507 cm at the west and maximum subsidence
of 474 cm at the east (Fig. 4 of Kowalik et al.
(2005). The uplift to subsidence is
approximately from west to east. Following
Kowalik et al. (2005), the disturbance in the
form of rise and fall of sea surface is assigned as
the initial condition in the outer model with a
maximum rise of 5 m to maximum fall of 4.75
m. In all other regions the initial sea surface
elevations are taken as zero. The initial x and y
components of velocity are also taken as zero
throughout the model area.
5. Results and Discussion
5.1 Results obtained from Outer Scheme
The governing equations (1)-(3) along with the
boundary conditions (5)-(7) are solved by using
a finite difference scheme. Wave propagation of
the source is computed and water levels along
the coastal belts of Penang Island are estimated.
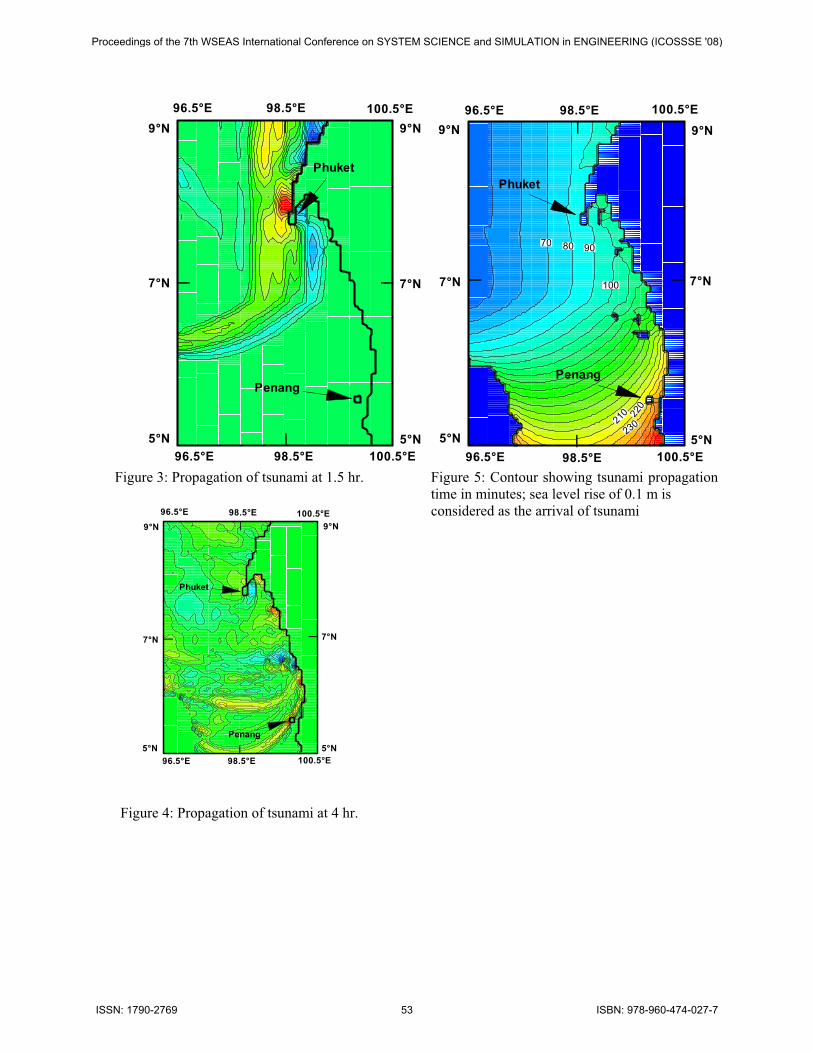
5.1.1 Propagation of Tsunami towards Penang
Island
Results from the numerical simulation of
propagation of tsunami towards the west coast of
Peninsular Malaysia are shown in Figs. 3 and 4
in the form of contour of sea surface elevation.
The disturbance pattern of the sea surface is
presented at two different instants of time. At
1.5 hr after the generation of the initial tsunami
wave at the source, the sea surface disturbance is
found to be proceeding towards Penang island in
Peninsular Malaysia after flooding the Phuket
region (Fig. 3) and finally at 4 hr the tsunami
surge is hitting the north and west coasts of
Penang Island (Fig. 4).
5.1.2 Arrival Time of Tsunami
The arrival time plays an important role in
prediction and early warning systems of
tsunami. In Fig 5, the tsunami arrival time is
shown in the form of contour plot in minutes;
time of +0.1 m sea level rise at each grid point is
considered as the arrival tsunami at that point. It
is seen that after initiating the source, the
disturbance propagates gradually towards the
Coast of Phuket Island in Southern Thailand.
Then, the disturbance continues propagating
towards Penang Island and reaches the north-
west coast at approximately 220 minutes. The
propagation slows down at Malacca Straits
because of very shallow water along this strait
and this is consistent with the fact that a long
wave speed reduces in shallow water. Computed
result shows earlier arrival of tsunami than that
of observation available in USGS website. Past
studies (Roy et al. 2007, Karim et al. 2007
without nesting) also show the similar results on
arrival time.
5.2 Results obtained from Inner Nested
Scheme
5.2.1 Computed Time Series of Water Levels
along the Penang Island
The computed water levels at two locations of
the coastal belt of Penang Island are stored at an
interval of 30 seconds. Figure 6 shows the time
series of water levels at Batu Ferringhi (north-
west coast) and at Pasir Panjang (south coast) of
Penang Island. At Batu Ferringhi, the maximum
elevation is approximately 3.4 m (Fig. 6a). The
water level shows oscillatory behavior and the
oscillation continues for several hours.
At Pasir Panjang, the result shows the same
pattern as that of Batu Ferringhi but with
different maximum elevation of 2.2 m (Fig. 6b).
Thus the computed results show that the north-
west Coast of Penang Island is vulnerable for
stronger tsunami hazard.
5.2.2 Estimation of arrival Time of Tsunami
The numerical simulation of the travel time of
tsunami at every grid point, as the time of
attaining +0.1 m sea level rise, is presented in
Fig. 7 in the form of time contours. It is seen that
the arrival time of tsunami surge along north
coast is between 230 and 240 min and the same
along the south coast is between 250 and 260
min. The USGS website
Proceedings of the 7th WSEAS International Conference on SYSTEM SCIENCE and SIMULATION in ENGINEERING (ICOSSSE '08)
ISSN: 1790-2769 50 ISBN: 978-960-474-027-7
[(http://staff.aist.go.jp/kenji.satake/Sumatra-
E.html) (Tsunami travel time in hours for the
entire Indian Ocean)] confirms the fact that the
arrival time of tsunami at Penang is between 4 hr
and 4 hr 30 min. Hence the computed travel
times are in good agreement with those of USGS
observations.
6. Conclusions
In this study a one-way nested coupled tsunami
computation model is developed and applied to
compute the 2004 Indonesian tsunami along the
coastal belts of Penang Island. In the one-way
nested technique, it has been possible for more
reasonable values for the open boundaries of the
inner scheme to be supplied from the coarse
mesh scheme. It is observed that there is a slight
improvement in agreement with observed data
using the one-way nesting technique than that of
previous studies without nesting.
Acknowledgements
This research is supported by the research grant
by the Government of Malaysia and the authors
acknowledge the support.
References
[1] AFP, (2005), Death toll in Asian Tsunami
Disaster
http://story.news.yahoo.com/news?tmpl=story2
&u=/afp/20050305/wl_asia_afp/asiaquaketoll
[2] Davies, A. M., Flather, R. A. Application of
numerical models of the North West European
continental shelf and the North Sea to the
computation of the Storm Surges of November
to December 1973, Deutsche Hydrographische
Zeitschrift Erganzungsheft Reihe A, 14, 1987,
72pp.
[3] Johns, B., Rao, A. D., Dube, S. K., Sinha, P.
C. Numerical modelling of tide-surge interaction
in the Bay of Bengal, Phil. Trans. Roy. Soc.
London A 313, 1985, 507 – 535.
[4] Jones, J. E., Davis, A. M. Storm Surge
computations for the Irish Sea using a three
dimensional numerical model including wave-
current interaction, Continental Shelf Research,
18, 1998, 201-251.
[5] Karim, M. F., Roy, G. D., Ismail, A. I. M.,
Meah, M. A. 2006: A linear Cartesian
coordinate shallow water model for tsunami
computation along the west coast of Thailand
and Malaysia. Int. J. of Ecology & Development
4(S06): 1 - 14.
[6] Karim, M. F., Roy, G. D., Ismail, A. I. M.
An Investigation on the Effect of Different
Orientation of a Tsunami Source along the
Coastal Belt of Penang Island: A Case Study of
the Indonesian Tsunami 2004, Far East J. of
Ocean Research, 1 (1), 2007, 33-47.
[7] Kowalik, Z., Knight, W., Whitmore, P. M.
Numerical Modeling of the Global Tsunami:
Indonesian Tsunami of 26 December 2004. Sc.
Tsunami Hazards. 23(1), 2005, 40 – 56.
[8] Koch, S. E., McQueen, J. T. A survey of
nested grid techniques and their potential for use
within the MASS weather prediction model,
NASA Technical Memorandum 87808, National
Aeronautics and Space Administration, USA,
1987.
[9] Monbaliu, J., Padilla-Hernandez, R.,
Hargreaves, J. C., Carretero, A. H. C., Luo, W.,
Sclavo, M., Gunther, H. The spectral wave
model, WAM, adapted for applications with
high spatial resolution, Coastal Engineering, 41,
2000, 41 – 62.
[10] Okada, Y. Surface Deformation due to
Shear and Tensile Faults in a Half Space, Bull,
Seism. Soc. Am., 75, 1985, 1135 – 1154.
[11] Roy, G.D. Estimation of expected maximum
possible water level along the Meghna estuary
using a tide and surge interaction model,
Environment International, 21(5), 1995, 671-
677.
[12] Roy, G.D. , Kabir, A. B. M. H. Use of a
nested numerical scheme in a shallow water
model for the coast of Bangladesh, BRAC
University Journal, Bangladesh, 1 (1), 2004, 79-
92.
Proceedings of the 7th WSEAS International Conference on SYSTEM SCIENCE and SIMULATION in ENGINEERING (ICOSSSE '08)
ISSN: 1790-2769 51 ISBN: 978-960-474-027-7
[13] Roy, G. D., Karim, M. F., Ismail, A. M. A
Non-Linear Polar Coordinate Shallow Water
Model for Tsunami Computation along North
Sumatra and Penang Island, Continental Shelf
Research, 27, 2007, 245–257.
[14] Yasin, Z., 2005.The Tsunami Timeline. The
School of Biological Science Bulletin,
University Sains Malaysia, Vol VIII, 26
[15] Yu, F. J. and Zhang, Z. H. Implementation
and application of a nested numerical storm
surge forecast model in the East China Sea, Acta
Oceanologica Sinica, 21 (1), 2002, 19-31.
Figure 1: Outer model domain including west
coast of Thailand, Peninsular Malaysia
and source zone west of North Sumatra.
100°E 100°30'E
100°E 100°30'E
5°10'N5°10'N
5°35'N5°35'N
Figure 2: Inner model domain
epicenter
Proceedings of the 7th WSEAS International Conference on SYSTEM SCIENCE and SIMULATION in ENGINEERING (ICOSSSE '08)
ISSN: 1790-2769 52 ISBN: 978-960-474-027-7
Penang
Phuket
|
|
||
96.5°E
96.5°E
98.5°E
98.5°E
100.5°E
100.5°E
5°N5°N
7°N7°N
9°N9°N
Figure 3: Propagation of tsunami at 1.5 hr.
Phuket
Penang
96.5°E
96.5°E 98.5°E
98.5°E 100.5°E
100.5°E
5°N5°N
7°N7°N
9°N 9°N|
|
| |
Figure 4: Propagation of tsunami at 4 hr.
908070
220
210
230
100
|
|
| |
96.5°E 98.5°E 100.5°E
9°N
7°N
5°N
98.5°E 100.5°E96.5°E
5°N
7°N
9°N
Phuket
Penang
Figure 5: Contour showing tsunami propagation
time in minutes; sea level rise of 0.1 m is
considered as the arrival of tsunami
Proceedings of the 7th WSEAS International Conference on SYSTEM SCIENCE and SIMULATION in ENGINEERING (ICOSSSE '08)
ISSN: 1790-2769 53 ISBN: 978-960-474-027-7

0 2 4 6 8(a) time in hr
-4
-3
-2
-1
0
1
2
3
4
elev
atio
nin
m
0 2 4 6 8(b) time in hr
-4
-3
-2
-1
0
1
2
3
4
elev
atio
nin
m
Figure 6: Time series of computed elevation at
two coastal locations of Penang Island
(a) Batu Ferringhi (North-west) (b)
South Penang
260
250
240
230
225
220
210
200
190
180
170
160
150
140
130
120
|
|
| |
100°E 100°15'E 100°30'E
5°10'N
5°22'N
5°35'N5°35'N
5°22'N
5°10'N
100°E 100°15'E 100°30'E
Penang Island
Figure 7: Contour of times, in minutes, of
attaining maximum water levels around the
Penang Island associated with the Indonesian
tsunami 2004
Proceedings of the 7th WSEAS International Conference on SYSTEM SCIENCE and SIMULATION in ENGINEERING (ICOSSSE '08)
ISSN: 1790-2769 54 ISBN: 978-960-474-027-7