a on key indicators on land and livestock holding west
TRANSCRIPT
REPORT
NSS(January,
Sample
Socio Bureau
Department
Government Bengal West of Implementation
Programme and Statistics of Statistics and Economics Applied of
Office Survey Economic
A
ONKEY INDICATORS ON LAND AND
LIVESTOCK HOLDING WEST BENGAL, 2013
70th Round 2013
-December,2013)
StateResults Based on
A REPORT
ON
KEY INDICATORS ON LAND HOLDING AND LIVESTOCK
WEST BENGAL, 2013
State Sample Results Based on
NSS 70TH Round
(January, 2013-December, 2013)
Socio Economic Survey Office
Bureau of Applied Economics and Statistics Department
of Statistics and Programme Implementation
Government of West Bengal
Highlights :
At State level, a total of 2583 households were surveyed in visit-1 and 2578 of them could besurveyed in visit-2.
Average area owned per household in West Bengal is 0.243 hectare, while that of India is 0.592hectare
For ‘Medium’ land holdings, the estimated average area owned per household is the highest at9.879 hectares, which is concentrated in the hands of only .054 per cent of the total households;while 88.68 percent households belonged to ‘Marginal’ land holding class and estimatedaverage area of land owned per marginal household was 0.951 hectares of land.
There existed 104 lakh operational holdings in the State, covering a total area of 36.80 lakh hectares ofland.
The estimated area and number of plots are highest for the category of owned and possessedland, while estimated number of plots is least for leased out category in West Bengal.
At the State level, 94 per cent area of land was under not flooded category during Jul'12 - Dec'12and 98 per cent during Jan'13 - Jun'13.
The land use pattern shows that the highest percentage of area is used for crop production onland other than jhum land, with 94 per cent area in Jul’12 - Dec’12 and 70 per cent area in Jan’13 -Jun’13; and nil for crop production on jhum land and only 1 per cent for crop production andfarming of animal/ fishery during both the periods in West Bengal.
The highest percentage of area is used for cereals in both the periods Jul’12 - Dec'12 (85 percent) and Jan'13 - Jun'13 (54 per cent) in West Bengal.
With regard to land used for various types of animal farming, the highest percentagedistribution of area of land was used for fishery in both Jul'12 - Dec'12 (50 per cent) and Jan'13 -Jun'13 (49 per cent); while the lowest was recorded for piggery in West Bengal.
Considering the percentage distribution of irrigated land area according to the differentsources of irrigation, the maximum area was irrigated using ground water (tube well, well, etc) :61 per cent during Jul'12 - Dec'12 and 72 per cent during Jan'13 -Jun'13 in West Bengal.
The households with operational holdings small and semi- medium have higher number ofsheep and goat compared to the households with smaller operational holdings (e.g., landless,marginal) in West Bengal, while the situation is slightly reverse in case of ownership of poultry.
CONTENTS
Page No.
Chapter I
Introduction
1 - 2
Chapter II Main Features of the Survey
3 - 4
Chapter III Key Results of the Survey
5 - 13
Chapter IV
Comparison Between State and Central
Sample
Annexure A Detail Tables
A 1 - A 115
Annexure B Concepts and Definitions
B 1 – B 2
Annexure C
Note on Sample Design and Estimation
Procedure
C 1 – C 7
Annexure D
Facsimile of Schedule 18.1_visit 1
D 1 – D 8
Facsimile of Schedule 18.1_visit 2
D 9 – D 15
14 - 17

I Chapter
INTRODUCTION
1
Chapter I
Introduction
1.1 Background
1.1.1 The first survey on land holdings was taken up by the NSS in its 8th round (July 1954 April1955) as part of the World Agricultural Census initiated by the Food & Agricultural Organisation(FAO) of the United Nations. In this survey, information on agricultural holdings was collectedprimarily to meet the requirements of the FAO. Information was also collected on householdownership holdings for providing the policy framers with the much-needed data for formulatingland reforms policy for the country.
1.1.2 A similar survey was conducted again in the 16th round (July 1960 - August 1961) and 17thround (September 1961 - July 1962) of the NSS as a part of the World Agricultural CensusProgramme of 1960. Since then, NSSO has been regularly conducting land holding surveys everyten years or so. The next survey on land holding of NSSO was conducted in 26th round (July 1971- June 1972), simultaneously with a survey on Debt and Investment at the instance of the ReserveBank of India. Thereafter, surveys on land and livestock holdings were conducted in 37th round(January - December 1982), 48th round (January - December 1992) and 59th round (January -December 2003).
1.1.3 After a gap of ten years, the 7th survey on Land and Livestock holdings was conducted as apart of NSS 70th round, during January - December 2013. The information of the round wascollected in two visits from the same set of sample households. The first visit was made duringJanuary - July 2013 and the second, during August - December 2013. West Bengal took part in eachof the surveys right from the 70s regularly on matching sample basis with NSS.
1.2 Objectives of the NSS surveys of Land and Livestock Holdings
1.2.1 Agriculture plays a great role in West Bengal economy and data on land holdings andLivestock provide basic quantitative information on the agrarian structure of the State and are ofparamount importance for planning and formulation of land policy.
1.2.2 Accordingly, the core objectives of the Land and Livestock Holdings Survey are to obtain reliableestimates of key characteristics of land and livestock holdings across regions and land holdingclasses. The 70th round NSS survey on Land and Livestock Holdings, attempted to collect detailedinformation on various aspects of ownership and operational holdings in rural areas of thecountry. Particulars of land owned, its size & composition, tenurial form, use of land, irrigationfacilities, and types and terms of lease, etc. were collected for the study of the land holdings. Theinventory of the livestock owned by the household on the date of survey was also collected. Usingthis information, different indicators of ownership holding, operational holding, pattern in landuse, detailed types of crop production/animal farming activities of the households, seasonalvariation in household operational holding, ownership of livestock, poultry, duckery, etc., havebeen generated for the rural areas of the country.
1.2.3 These statistical indicators are required for planning, policy formulation and decision makingat various levels within the government and outside. The results of the survey are also likely to be

2
of use to other departments like Department of Agriculture, Department of Animal Husbandryetc., apart from private data users, researchers and policy makers.
1.3 Reports of the 70th Round Survey on Land and Livestock Holdings
1.3.1 The results of this 70th round NSS survey are released in reports based on a comprehensive tabulationof the subject parameters and indicators in various cross-classifications generated from the state sample data.
1.4 Contents of this document
1.4.1 This document is presented in three chapters and four appendices. Following the present chapter (i.e.Chapter One): Introduction, Chapter Two gives the main features of the survey. A brief summary of the keyresults of the survey on Land and Livestock Holdings is presented in Chapter Three. Chapter Four willpresent a comparative picture of State and Central sample results. Appendix A gives the detailed State-leveltables on the key indicators. Notes on concepts and definitions used in this survey have been presented inAppendix B. This is followed by the details of the sample design and estimation procedure adopted in thesurvey in Appendix C. A facsimile of the schedules of enquiry – Schedule 18.1: Land and LivestockHoldings (Visit-1 and Visit-2) can be seen in Appendix D.
Chapter
II
MAIN FEATURES OF THE SURVEY
3
Chapter II
Main Features of the Survey
2.1 Schedules of enquiry
2.1.1 The period of survey was of one year duration starting on 1st January 2013 and ending on31st December 2013. Each sample First Stage Unit(FSU) was visited twice during this round;period of the first visit was January – July 2013 i.e. of 7 months’ duration and that of the secondvisit was August – December 2013 i.e. of 5 months’ duration. Separate schedules were designedfor visit-1 and visit-2, having more or less a common structure, avoiding repeated collection of afew items of information which are not likely to change. In visit-1, information pertaining to theperiod July - December 2012 was collected, whereas reference period for the information collectedin visit-2 was January - June 2013.
2.1.2 Information on livestock, poultry, duckery, etc., owned by the household as on the date ofsurvey was collected only once during visit-1. However, in visit-2, some general information of thehousehold operational holdings for the whole agricultural year was additionally collected for thehouseholds who made agricultural use of at least one plot in both the reference periods.
2.2 Scope and coverage
2.2.1 Geographical coverage: The survey covered the rural area of the whole of the State of WestBengal.
2.2.2 Population coverage: The following rules were adhered to:1. Floating population, i.e., persons without any normal residence, was excluded. But personsresiding in open space, roadside shelter, under a bridge, etc., more or less regularly in the sameplace were covered.2. Foreign nationals were excluded, as well as their domestic servants, if by definition the latterbelonged to the foreign national's household.3. Persons residing in barracks of military and paramilitary forces (like police, BSF etc.) were keptoutside the survey coverage. However, the civilian population residing in their neighbourhood,including the family quarters of service personnel, was covered.4. Orphanages, rescue homes, ashrams and vagrant houses were outside the survey coverage.However, the persons staying in old age homes, the students staying in ashram/hostels and theresidential staff (other than monks/nuns) of these ashrams were covered. Although orphansliving in orphanages were excluded, the persons looking after them and staying there werecovered. Convicted prisoners undergoing sentence were outside the coverage of the survey.
2.2.3 Sample size
2.2.3.1 First stage Units: A total of 323 villages were surveyed as First stage Units (FSUs) in NSS70th round for the State sample at State level. It may be mentioned that three sample villages werecounted as zero case sample unit, as all the three villages were found to be non-traceble. Theresults presented in this document are based on State sample alone. Number of villages surveyedin State sample are given in Statement 2.1.

4
2.2.3.2 Second Stage Units: Since, this schedule was canvassed in the rural areas only, the firststage units (FSU) were the census villages, and the Second Stage Units (SSU) were the households.For the purpose of selection in case of Sch.18.1, all households in a sample village were classifiedinto four Second Stage Strata (SSS) based on area of land possessed viz. less than 0.005 hectare-1,equal to or more than 0.005 hectare but less than 1.000 hectare -2, equal to or more than 1.000 hectare butless than 2.000 hectares -3, equal to or more than 2.000 hectares -4. Thereafter, 8 households weresurveyed from each sample village, taking 2 household from each SSS.
2.2.3.3 Each of the sample households were visited once in visit-1 and in visit-2. However, a fewhouseholds of visit-1 became ‘casualty’ while surveying in visit-2. At State level, a total of 2583households were surveyed in visit-1 and 2578 of them could be surveyed in visit-2.
Statement 2.1a: Number of villages and households surveyed for West BengalVisit 1
State
Numberof
villagessurveyed
Number of householdsEstimated (00) Surveyed
ST SC OBC Others All (inl.n.r.) ST SC OBC Others
All (inl.no
response)(1) (2) (3) (4) (5) (6) (7) (8) (9) (10) (11) (12)
WestBengal 323 8942 45467 14244 71983 140636 271 798 267 1247 2583
Statement 2.1b: Number of villages and households surveyed for West BengalVisit 2
State
Numberof
villagessurveyed
Number of householdsEstimated (00) Surveyed
ST SC OBC Others All (inl.n.r.) ST SC OBC Others
All (inl.no
response)(1) (2) (3) (4) (5) (6) (7) (8) (9) (10) (11) (12)
WestBengal 323 8942 45484 14244 71966 140636 271 797 267 1243 2578
Chapter
III

5
Chapter III
Key Results of the Survey
3.0 Introduction
3.0.1 The Key Indicator document presents estimates of some key characteristics of the survey onLand and Livestock Holdings such as ownership holdings, operational holdings, kind of possessionof land holdings, type of crop production and animal farming, irrigation used, area affected byflood, land-use pattern, cultivation pattern, livestock and poultry bird holdings in the State, and soon.
3.0.2 In this document, the survey results are given for the ‘whole agricultural year’ i.e. July - June2013 (referred to as 2012-13), and also for the two fixed periods, July - Dec 2012 (covered in visit 1)and January - June 2013 (covered in visit 2) wherever applicable. Most of the results shown in thesummary tables of this chapter are given as estimates of areas and numbers, and percentages, atState level.
3.1 Household Ownership of land
3.1.1 Land, with permanent heritable possession, with or without right to transfer the title, wasconsidered as owned land. The land held in owner-like possession under a long-term lease orassignment (e.g. village land possessed by a tribal household as per traditional tribal rights orcommunity land customarily operated by a tenant for a long period) was also treated as landowned. A household ownership holding includes all plots (or parts of plot) of land owned by anymember of the household, whether the land is cultivatable or not. Thus a household ownershipholding may include, besides cultivatable land, areas under forest, barren and uncultivable land,cultivatable waste land, land put to non- agricultural uses (viz. house sites, roads etc.), landgrowing miscellaneous tree crops, etc. Statement 3.1 shows that average area owned perhousehold in West Bengal is 0.243 hectare, while that of India is 0.592 hectare.
Statement 3.1: Estimated area owned & possessed and average area owned per household inWest Bengal during 2012-13
State Estimated areaowned &possessed (000ha)
Average area owned per household
Home stead landper hh (0.00 ha)
Land owned,excluding
homestead land perhh (0.00 ha)
Owned per hh(0.00 ha)
West Bengal 3299 0.024 0.219 0.243
3.2 Distribution of Ownership Holdings:
3.2.1 The size classes of the detailed classification may be merged to form 6 broad size classes orcategories for analysis as shown below:
6
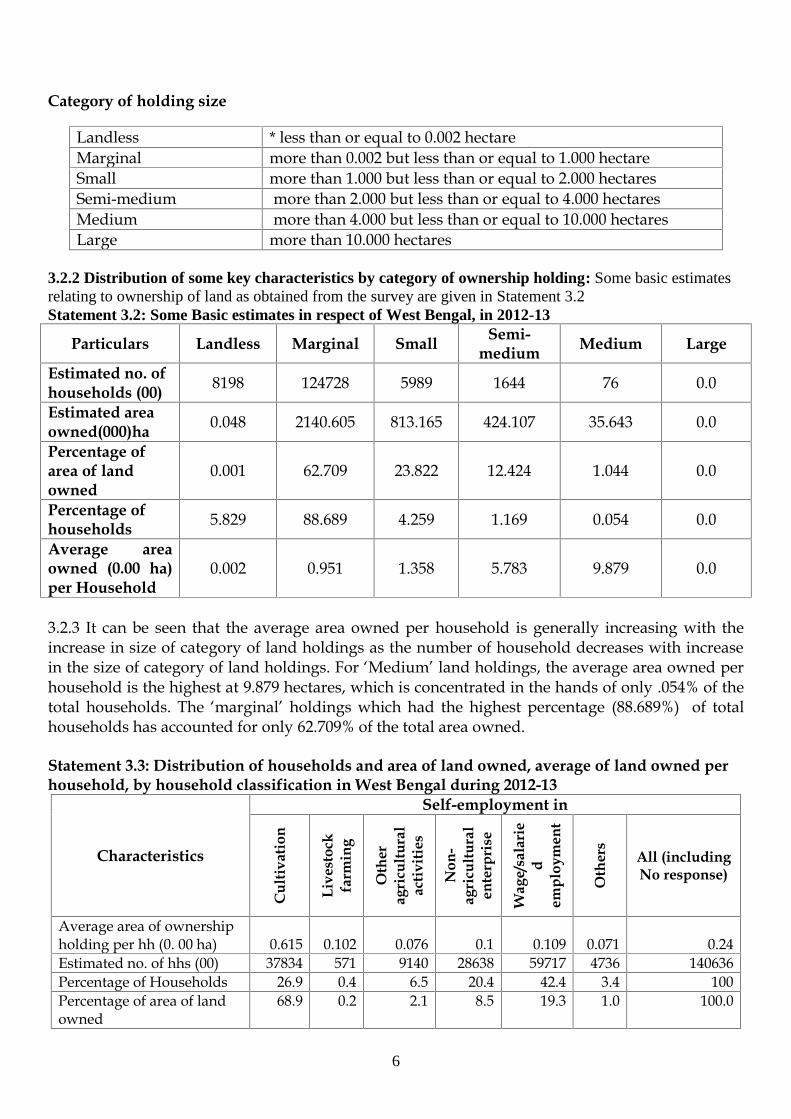
Category of holding size
Landless * less than or equal to 0.002 hectareMarginal more than 0.002 but less than or equal to 1.000 hectareSmall more than 1.000 but less than or equal to 2.000 hectaresSemi-medium more than 2.000 but less than or equal to 4.000 hectaresMedium more than 4.000 but less than or equal to 10.000 hectaresLarge more than 10.000 hectares
3.2.2 Distribution of some key characteristics by category of ownership holding: Some basic estimatesrelating to ownership of land as obtained from the survey are given in Statement 3.2Statement 3.2: Some Basic estimates in respect of West Bengal, in 2012-13
Particulars Landless Marginal Small Semi-medium Medium Large
Estimated no. ofhouseholds (00) 8198 124728 5989 1644 76 0.0
Estimated areaowned(000)ha 0.048 2140.605 813.165 424.107 35.643 0.0
Percentage ofarea of landowned
0.001 62.709 23.822 12.424 1.044 0.0
Percentage ofhouseholds 5.829 88.689 4.259 1.169 0.054 0.0
Average areaowned (0.00 ha)per Household
0.002 0.951 1.358 5.783 9.879 0.0
3.2.3 It can be seen that the average area owned per household is generally increasing with theincrease in size of category of land holdings as the number of household decreases with increasein the size of category of land holdings. For ‘Medium’ land holdings, the average area owned perhousehold is the highest at 9.879 hectares, which is concentrated in the hands of only .054% of thetotal households. The ‘marginal’ holdings which had the highest percentage (88.689%) of totalhouseholds has accounted for only 62.709% of the total area owned.
Statement 3.3: Distribution of households and area of land owned, average of land owned perhousehold, by household classification in West Bengal during 2012-13
Characteristics
Self-employment in
Cul
tivat
ion
Live
stoc
kfa
rmin
g
Oth
erag
ricu
ltura
lac
tiviti
es
Non
-ag
ricu
ltura
len
terp
rise
Wag
e/sa
lari
ed
empl
oym
ent
Oth
ers
All (includingNo response)
Average area of ownershipholding per hh (0. 00 ha) 0.615 0.102 0.076 0.1 0.109 0.071 0.24Estimated no. of hhs (00) 37834 571 9140 28638 59717 4736 140636Percentage of Households 26.9 0.4 6.5 20.4 42.4 3.4 100Percentage of area of landowned
68.9 0.2 2.1 8.5 19.3 1.0 100.0

7
3.2.4 Among all the ownership holdings, the households with self-employed in cultivation as themajor source of income, owned the highest percentage of land, whereas the lowest percent of landwas owned by the households with self-employed in livestock farming as the major source of income.
3.3. Household Operational Holding
3.3.1 In 70th Round of NSS Survey, household operational holding is defined as land that was usedwholly or partly for agricultural production and was operated (directed/managed) by onehousehold member alone or with assistance of others, without regard to title, size or location.More on definition of household operational holding is given in Appendix B. As distinct from ahousehold ownership holding, which was restricted to the area of land owned by a household,operational holding encompasses all land - owned, leased in or otherwise possessed, i.e. land underphysical possession of the household with the condition that some agricultural activity was carried outon any part of the land under its possession during the reference period. The major findings of theenquiry on operational holdings are summarized in the ensuing paragraphs. In 2012-13 (70thround) ‘area operated’ includes the area of the plots which were used for agricultural activities,i.e., only crop production on jhum land, only crop production on land other than jhum land, only farming ofanimal/fishery, both crop production and farming of animal /fishery, and other agricultural uses. This maybe kept in mind while interpreting the information outlined below.
3.3.2 Statement 3.4 gives the estimates of the Household Operational Holdings, area and plotsoperated in the ‘whole agricultural year’.
Statement 3.4: Estimated Household Operational Holdings, total area under householdoperational holdings, plots operated in the whole agricultural year, 2012-13 in West Bengal
Particulars NumberEstimated number of plots(00) 414336Estimated area (ha) 3680733Estimated number of household operational holding (00) 104145
There were 104 lakh operational holdings in the State, covering a total area of 36.80 lakh hectares of land.
3.4 Kind of possession of land
3.4.1 All the plots of the households fall into any one of the four different kinds of possession,which were either owned and possessed or leased in or otherwise possessed or leased out during themajor part of the reference period. Statement 3.5 gives the area and number of plots distributedaccording to the four kinds of possession corresponding to ‘visit1’ for Jul'12 - Dec'12 and ‘visit2’for Jan'13 - Jun'13. The estimated area and number of plots are highest for the owned and possessedland and the least for otherwise possessed land during Jul'12 - Dec'12 and Jan’13 - Jun’13, at the Stateleve

8
Statement 3.5 : Estimated Number of Plots and Area by kind of possession in West Bengalduring 2012-13
Particulars Owned andpossessed
Leasedin
Otherwisepossessed
Leasedout
All(including
no response)Visit 1Estimated numberof plots(00) 375565 18348 6227 3097 400140
Estimated Area(ha) 3245985 258182 14682 64316 3518849Visit 2Estimated numberof plots(00) 370252 19549 7149 4896 396951
Estimated Area(ha) 3218897 288278 15215 95100 3522390
3.4.2 Statement 3.6 gives the estimated area and number of plots possessed by locationcorresponding to ‘visit1’ for Jul'12 - Dec'12 and ‘visit2’ for Jan'13 - Jun'13. The estimated area andnumber of plots are highest for the owned and possessed land, but area is least for otherwise possessedland category. While estimated number of plots is least for leased out category during both visit I(Jul'12 - Dec'12) and visit 2 (Jan’13 - Jun’13), at the State level.
Statement 3.6 : Estimated Number of Plots and Area of land possessed by location of landpossessed
Particulars Within villageOutside
village butwithin district
Outside district butwithin state
All (includingno response)
Visit 1Estimated numberof plots(00) 376099 24033 8 400140
Estimated Area(ha) 3115519 402726 605 3518849Visit 2
Estimated numberof plots(00) 371771 23134 8 396951
Estimated Area(ha) 3109290 402339 605 3522390Agricultural
YearEstimated numberof plots(00) 382765 23605 8 408525
Estimated Area(ha) 3172379 406370 605 3590460
3.4.3 It is seen that around 94% plots covering around 88% of total estimated area is locatedwithin the village in the agricultural year 2012-13, while the rest is located outside the villagebut within the district. A very negligible percentage (0.002%) of plots is located outside thedistrict but within the State.
9
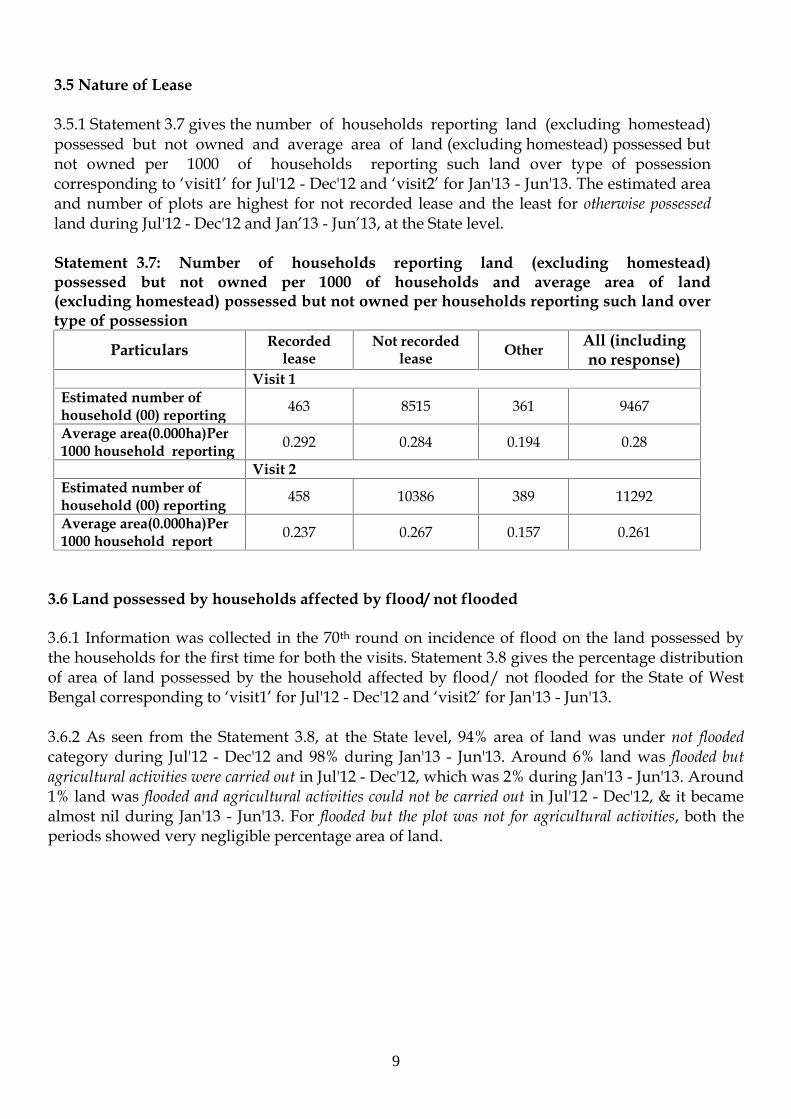
3.5 Nature of Lease
3.5.1 Statement 3.7 gives the number of households reporting land (excluding homestead)possessed but not owned and average area of land (excluding homestead) possessed butnot owned per 1000 of households reporting such land over type of possessioncorresponding to ‘visit1’ for Jul'12 - Dec'12 and ‘visit2’ for Jan'13 - Jun'13. The estimated areaand number of plots are highest for not recorded lease and the least for otherwise possessedland during Jul'12 - Dec'12 and Jan’13 - Jun’13, at the State level.
Statement 3.7: Number of households reporting land (excluding homestead)possessed but not owned per 1000 of households and average area of land(excluding homestead) possessed but not owned per households reporting such land overtype of possession
Particulars Recordedlease
Not recordedlease Other All (including
no response)Visit 1
Estimated number ofhousehold (00) reporting 463 8515 361 9467
Average area(0.000ha)Per1000 household reporting 0.292 0.284 0.194 0.28
Visit 2Estimated number ofhousehold (00) reporting 458 10386 389 11292
Average area(0.000ha)Per1000 household report 0.237 0.267 0.157 0.261
3.6 Land possessed by households affected by flood/ not flooded
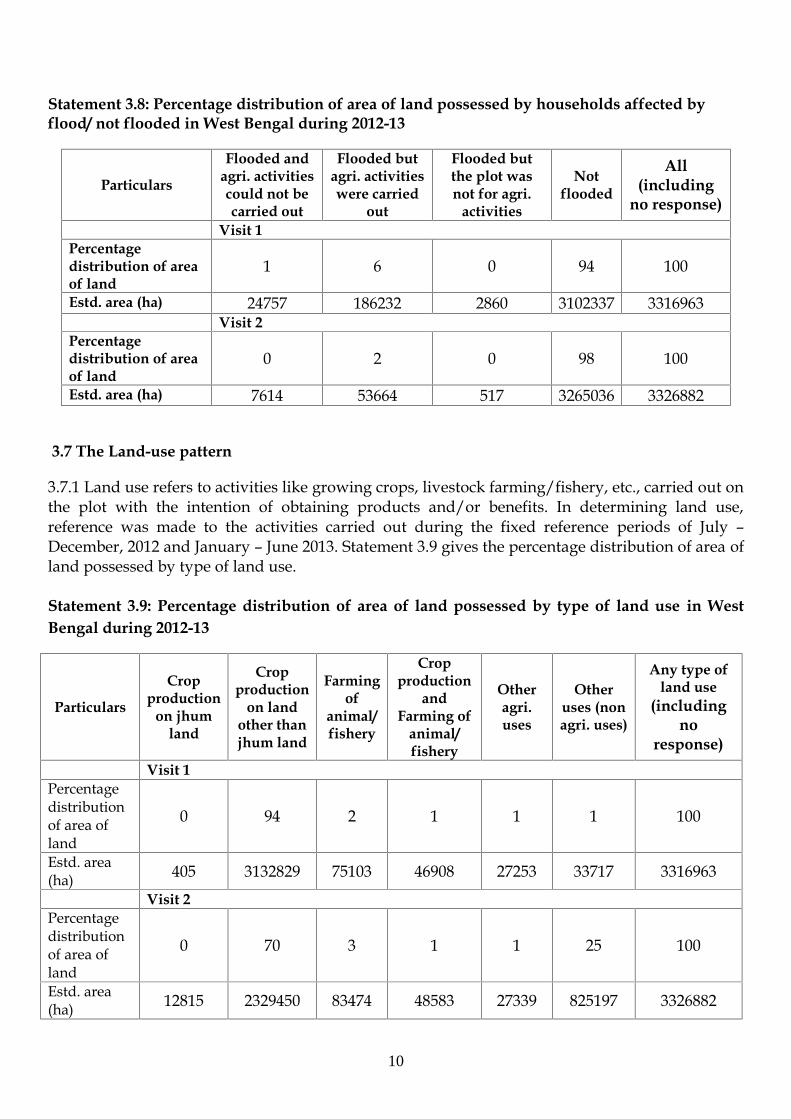
3.6.1 Information was collected in the 70th round on incidence of flood on the land possessed bythe households for the first time for both the visits. Statement 3.8 gives the percentage distributionof area of land possessed by the household affected by flood/ not flooded for the State of WestBengal corresponding to ‘visit1’ for Jul'12 - Dec'12 and ‘visit2’ for Jan'13 - Jun'13.
3.6.2 As seen from the Statement 3.8, at the State level, 94% area of land was under not floodedcategory during Jul'12 - Dec'12 and 98% during Jan'13 - Jun'13. Around 6% land was flooded butagricultural activities were carried out in Jul'12 - Dec'12, which was 2% during Jan'13 - Jun'13. Around1% land was flooded and agricultural activities could not be carried out in Jul'12 - Dec'12, & it becamealmost nil during Jan'13 - Jun'13. For flooded but the plot was not for agricultural activities, both theperiods showed very negligible percentage area of land.
10
Statement 3.8: Percentage distribution of area of land possessed by households affected byflood/ not flooded in West Bengal during 2012-13
Particulars
Flooded andagri. activitiescould not becarried out
Flooded butagri. activitieswere carried
out
Flooded butthe plot wasnot for agri.
activities
Notflooded
All(including
no response)Visit 1
Percentagedistribution of areaof land
1 6 0 94 100
Estd. area (ha) 24757 186232 2860 3102337 3316963Visit 2
Percentagedistribution of areaof land
0 2 0 98 100
Estd. area (ha) 7614 53664 517 3265036 3326882
3.7 The Land-use pattern
3.7.1 Land use refers to activities like growing crops, livestock farming/fishery, etc., carried out onthe plot with the intention of obtaining products and/or benefits. In determining land use,reference was made to the activities carried out during the fixed reference periods of July –December, 2012 and January – June 2013. Statement 3.9 gives the percentage distribution of area ofland possessed by type of land use.
Statement 3.9: Percentage distribution of area of land possessed by type of land use in WestBengal during 2012-13
Particulars
Cropproduction
on jhumland
Cropproduction
on landother thanjhum land
Farmingof
animal/fishery
Cropproduction
andFarming of
animal/fishery
Otheragri.uses
Otheruses (nonagri. uses)
Any type ofland use
(includingno
response)Visit 1
Percentagedistributionof area ofland
0 94 2 1 1 1 100
Estd. area(ha) 405 3132829 75103 46908 27253 33717 3316963
Visit 2Percentagedistributionof area ofland
0 70 3 1 1 25 100
Estd. area(ha) 12815 2329450 83474 48583 27339 825197 3326882

11
3.7.2 The land use pattern shows that the highest percentage of area is used for crop production onland other than jhum land, with 94% area in Jul’12 - Dec’12 and 70% area in Jan’13 - Jun’13; and nilfor crop production on jhum land and only 1% for crop production and farming of animal/ fishery in boththe periods.
3.8. Type of Crop production/livestock farming
3.8.1 For the plots where land use involved activities of crop production and/or farming ofanimal/fishery, information on type of crop production/livestock farming was collected. Theplots with land-use as other agricultural uses and other uses(non-agricultural uses), are not consideredhere.
Statement 3.10: Percentage distribution of area of land by type of crop production andlivestock farming, 2012-13
Particulars
cere
als
puls
es
oils
eeds
vege
tabl
es
fodd
er
othe
r cro
p
orch
ards
plan
tatio
n
dair
y
poul
try/
duck
ery
pigg
ery
fish
ery
farm
ing
ofot
her a
nim
als
All
(incl
. nr)
estd
. are
a(h
a)us
ed fo
rcr
oppr
od./
lives
tock
farm
ing
( ha)
Visit1Percentagedistributionof area ofland
85 1 1 3 0 5 1 0 1 0 0 1 1 100 3255244
Visit 2Percentagedistributionof area ofland
54 2 14 20 1 3 1 1 1 0 0 2 1 100 2474323
3.8.2 The above statement shows that the highest percentage of area is used for cereals in both theperiods Jul’12 - Dec'12 (85%) and Jan'13 - Jun'13 (54%). The percentage area on ‘livestock farming’is obtained by aggregating the percentage area on dairy, poultry/ duckery, piggery, fishery andfarming of other animals.
3.9. Land used for various types of animal farming
3.9.1: Distribution of area of land used for different types of animal farming: Statement 3.11 onthe percentage distribution of type of crop production/livestock farming shows that a very smallpercentage of land was used for animal farming in each of the periods. It may be interesting tostudy the percentage distribution of land used separately for dairy, poultry/ duckery, piggery, fisheryand farming of other animals. Statement 3.11 gives the State level percentage distribution of area ofland used for different types of animal farming for the period Jul'12 - Dec'12 and Jan'13 - Jun'13.The estimates for livestock/poultry have been provided as on 15th April 2013, i.e. the mid-point ofvisit 1 (1st Jan - 31st July 2013).

12
Statement 3.11 : Percentage distribution of area of land used for different type of animalFarming in West Bengal during 2012-13
Particulars Dairy Poultry/duckery Piggery Fishery
Farmingof otheranimals
All Estd. area used forcrop prod./ livestock
farming ( ha)
Visit1Percentagedistribution ofarea of land
25 3 0 50 21 100 94127
Visit 2Percentagedistribution ofarea of land
32 2 0 49 16 100 99802
3.9.2 The highest percentage distribution of area of land was used for fishery in both Jul'12 - Dec'12(50%) and Jan'13 - Jun'13 (49%); while the lowest was recorded for piggery: almost nil in both theperiods (in Jul'12-Dec'12 and in Jan'13 - Jun'13).
3.9.3 Area used for all farming of animals: Statement 3.12 gives the percentage and estimatedarea used for all types of farming of animals for the periods Jul'12 - Dec'12 and Jan'13 - Jun'13.
Statement 3.12: Percentage and estimated area of land used for all types of farming ofAnimals in West Bengal during 2012-13
Particulars
Estd. areaused forfarming ofanimals (ha)
Total estd.area (ha)
% of areaoperatedfor farmingof animals
Estd. no. ofhh opr.holdingsreportingfarming ofanimals(00)
Estd. no. ofhhs opr.holding(00)
Percentageof landoperationalholdingreportingfarming ofanimal
Visit 1 94127 3282498 3 76001 100695 75
Visit 2 99802 2501662 4 69919 100962 693.9.4 The percentage of area used for all types of farming of animals was 3% in Jul'12 - Dec'12 and4 % during Jan'13 - Jun'13. Also, 75% of household operational holdings reported farming ofanimals in Jul’12 - Dec’12, and 69% reported in Jan'13 - Jun'13.
3.10 Irrigation used for crop production
3.10.1 Irrigation refers to purposefully providing land with water, other than rain, for improvingcrop production. Uncontrolled land flooding by overflowing of rivers or streams is not consideredirrigation. However, when rainwater or uncontrolled overflow from rivers and streams iscollected and later used on the land for crop production, it is considered irrigated. A plot will beconsidered as irrigated if the major part of the plot is irrigated. If a plot is irrigated, thecorresponding source of irrigation was recorded.
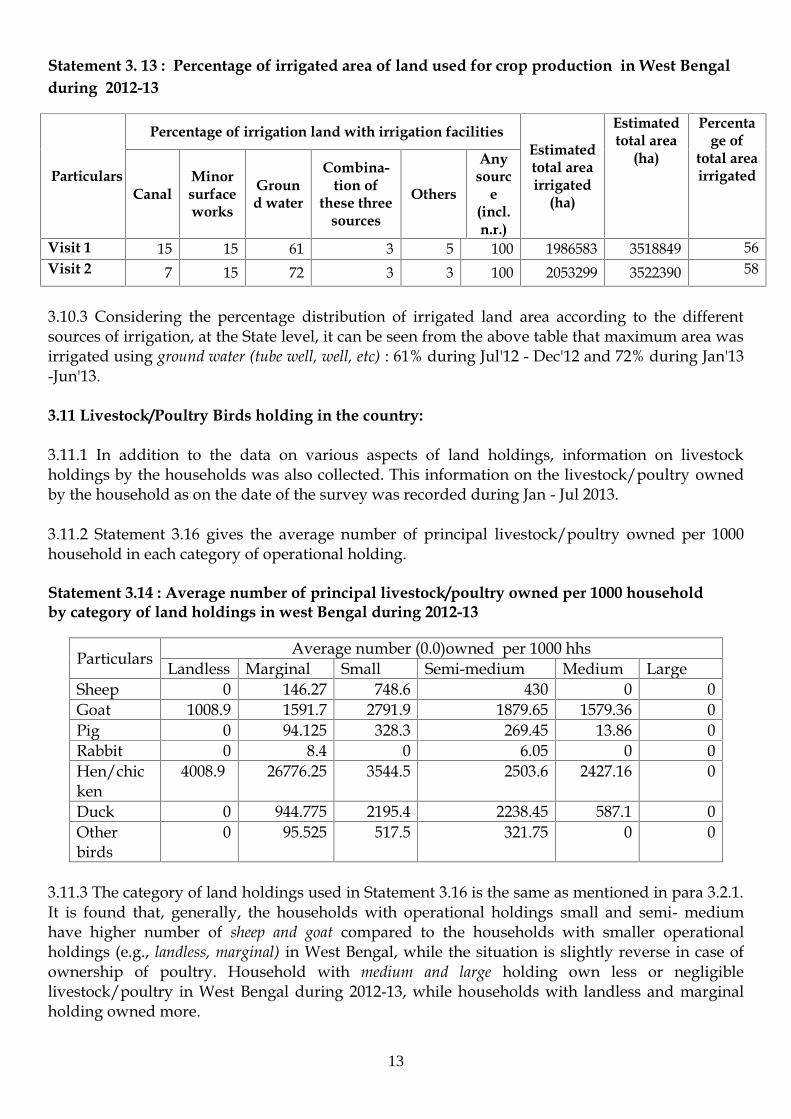
3.10.2 Statement 3.13 gives the distribution of land area irrigated, according to the differentsources of irrigation, for West Bengal.
13
Statement 3. 13 : Percentage of irrigated area of land used for crop production in West Bengalduring 2012-13
Particulars
Percentage of irrigation land with irrigation facilitiesEstimatedtotal areairrigated
(ha)
Estimatedtotal area
(ha)
Percentage of
total areairrigated
CanalMinorsurfaceworks
Ground water
Combina-tion of
these threesources
Others
Anysourc
e(incl.n.r.)
Visit 1 15 15 61 3 5 100 1986583 3518849 56Visit 2 7 15 72 3 3 100 2053299 3522390 58
3.10.3 Considering the percentage distribution of irrigated land area according to the differentsources of irrigation, at the State level, it can be seen from the above table that maximum area wasirrigated using ground water (tube well, well, etc) : 61% during Jul'12 - Dec'12 and 72% during Jan'13-Jun'13.
3.11 Livestock/Poultry Birds holding in the country:
3.11.1 In addition to the data on various aspects of land holdings, information on livestockholdings by the households was also collected. This information on the livestock/poultry ownedby the household as on the date of the survey was recorded during Jan - Jul 2013.
3.11.2 Statement 3.16 gives the average number of principal livestock/poultry owned per 1000household in each category of operational holding.
Statement 3.14 : Average number of principal livestock/poultry owned per 1000 householdby category of land holdings in west Bengal during 2012-13
Particulars Average number (0.0)owned per 1000 hhsLandless Marginal Small Semi-medium Medium Large
Sheep 0 146.27 748.6 430 0 0Goat 1008.9 1591.7 2791.9 1879.65 1579.36 0Pig 0 94.125 328.3 269.45 13.86 0Rabbit 0 8.4 0 6.05 0 0Hen/chicken
4008.9 26776.25 3544.5 2503.6 2427.16 0
Duck 0 944.775 2195.4 2238.45 587.1 0Otherbirds
0 95.525 517.5 321.75 0 0
3.11.3 The category of land holdings used in Statement 3.16 is the same as mentioned in para 3.2.1.It is found that, generally, the households with operational holdings small and semi- mediumhave higher number of sheep and goat compared to the households with smaller operationalholdings (e.g., landless, marginal) in West Bengal, while the situation is slightly reverse in case ofownership of poultry. Household with medium and large holding own less or negligiblelivestock/poultry in West Bengal during 2012-13, while households with landless and marginalholding owned more.
Chapter
IV
COMPARISON BETWEEN STATE AND CENTRAL SAMPLE
14
Chapter IV
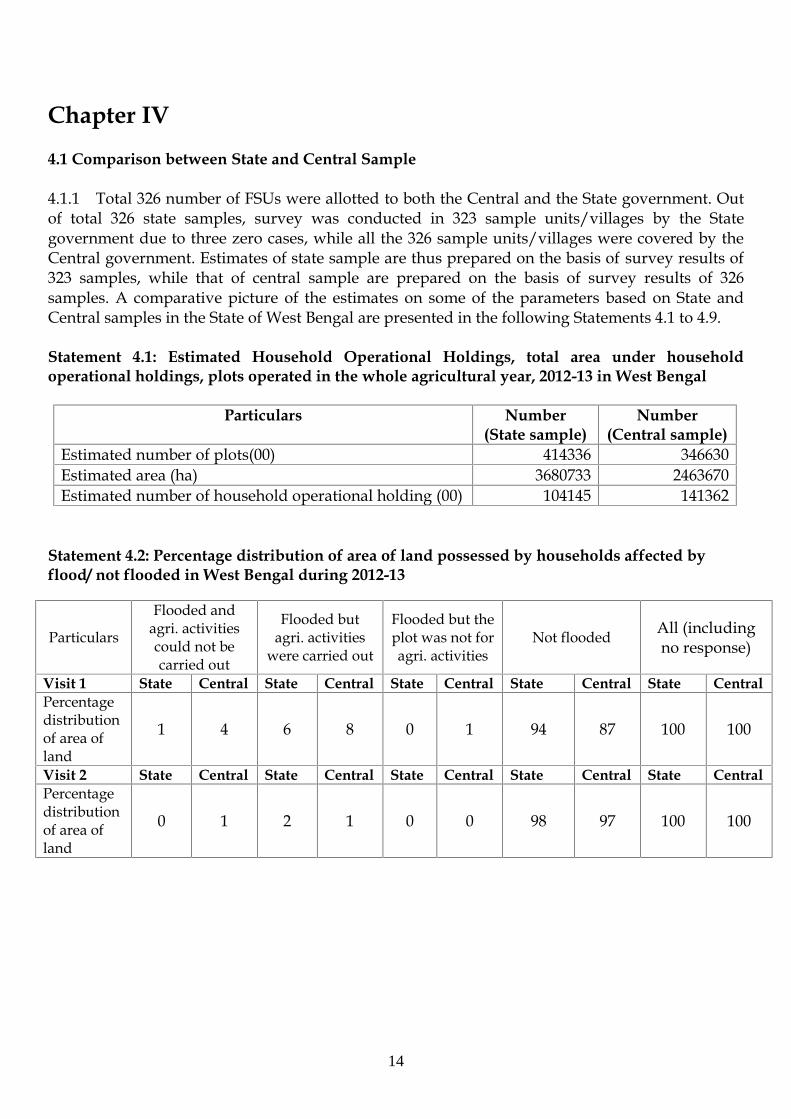
4.1 Comparison between State and Central Sample
4.1.1 Total 326 number of FSUs were allotted to both the Central and the State government. Outof total 326 state samples, survey was conducted in 323 sample units/villages by the Stategovernment due to three zero cases, while all the 326 sample units/villages were covered by theCentral government. Estimates of state sample are thus prepared on the basis of survey results of323 samples, while that of central sample are prepared on the basis of survey results of 326samples. A comparative picture of the estimates on some of the parameters based on State andCentral samples in the State of West Bengal are presented in the following Statements 4.1 to 4.9.
Statement 4.1: Estimated Household Operational Holdings, total area under householdoperational holdings, plots operated in the whole agricultural year, 2012-13 in West Bengal
Particulars Number(State sample)
Number(Central sample)
Estimated number of plots(00) 414336 346630Estimated area (ha) 3680733 2463670Estimated number of household operational holding (00) 104145 141362
Statement 4.2: Percentage distribution of area of land possessed by households affected byflood/ not flooded in West Bengal during 2012-13
Particulars
Flooded andagri. activitiescould not becarried out
Flooded butagri. activities
were carried out
Flooded but theplot was not foragri. activities
Not flooded All (includingno response)
Visit 1 State Central State Central State Central State Central State CentralPercentagedistributionof area ofland
1 4 6 8 0 1 94 87 100 100
Visit 2 State Central State Central State Central State Central State CentralPercentagedistributionof area ofland
0 1 2 1 0 0 98 97 100 100

15
Statement 4.3: Percentage distribution of area of land possessed by type of land use in WestBengal during 2012-13
Percentagedistribution
of area ofland
Cropproduction on jhum
land
Cropproduction
on landother thanjhum land
Farmingof
animal/fishery
Cropproduction and
Farming ofanimal/ fishery
Otheragri.uses
Otheruses(nonagri.uses)
Any type ofland use
(includingno response)
Visit 1StateSample 0 94 2 1 1 1 100CentralSample 0 86 3 5 3 4 100
Visit 2StateSample 0 70 3 1 1 25 100CentralSample 0 74 3 3 4 15 100
Statement 4.4: Percentage distribution of area of land by type of crop production andlivestock farming, 2012-13
Percentagedistribution
of area ofland ce
real
s
puls
es
oils
eeds
vege
tabl
es
fodd
er
othe
r cro
p
orch
ards
plan
tatio
n
dair
y
poul
try/
duck
ery
pigg
ery
fish
ery
farm
ing
ofot
her a
nim
als
All
(incl
. nr)
estd
. are
aus
ed fo
r cro
ppr
od./
lives
tock
farm
ing
( ha)
Visit1StateSample 85 1 1 3 0 5 1 0 1 0 0 1 1 100 3255244CentralSample 81 3 1 7 0 3 1 0 2 0 0 2 0 100 2304151
Visit2StateSample 54 2 14 20 1 3 1 1 1 0 0 2 1 100 2474323CentralSample 57 2 10 20 0 3 1 1 2 0 0 3 0 100 1939671
Statement 4.5 : Percentage distribution of area of land used for different type of animalFarming in West Bengal during 2012-13
Percentagedistribution of area
of landDairy Poultry/
duckery Piggery FisheryFarmingof otheranimals
All Estd. area used forcrop prod./ livestock
farming ( ha)
Visit1State Sample 25 3 0 50 21 100 94127Central Sample 48 4 1 44 4 100 85810
Visit 2State Sample 32 2 0 49 16 100 99802Central Sample 44 6 1 47 2 100 108407

16
Statement 4.6: Percentage and estimated area of land used for all types of farming ofAnimals in West Bengal during 2012-13.
Estimated areaof land used foranimal farming
Estd. areaused forfarming ofanimals (ha)
Total estd.area (ha)
% of areaoperated forfarming ofanimals
Estd. no. of hh opr.holdings reportingfarming of animals(00)
Estd. no. ofhhs opr.holding (00)
Visit 1State Sample 94127 3282498 3 76001 100695Central Sample 85810 2368545 4 35196 86687
Visit 2State Sample 99802 2501662 4 69919 100962Central Sample 108407 2042826 15 39167 87767
Statement 4.7: Percentage of irrigated area of land used for crop production in West Bengalduring 2012-13
Particulars
Percentage of irrigation land with irrigation facilities
Estimatedtotal areairrigated
Estimatedtotal area
(ha)
CanalMinorsurfaceworks
Groundwater
Combination ofthesethree
sources
Others
Anysource(incl.n.r.)
Visit 1State Sample 15 15 61 3 5 100 1986583 3518849CentralSample
19 11 63 6 2 100 1406215 2642678
Visit 2
State Sample 7 15 72 3 3 100 2053299 3522390CentralSample 18 11 52 8 1 100 1544203 2581767
Statement 4.8: Average number of principal poultry owned per 1000 household in West Bengalduring 2012-13
ParticularsAverage number (0.0) of poultry owned per 1000 households
Sheep Goat Pig Rabbit Hen/cock/chicken Duck Other
birdsStateSample 178 1514 109.7 4.3 4973.4 721.7 121.1CentralSample
48.1 598 21.5 0 1355.6 209.1 48.7
17
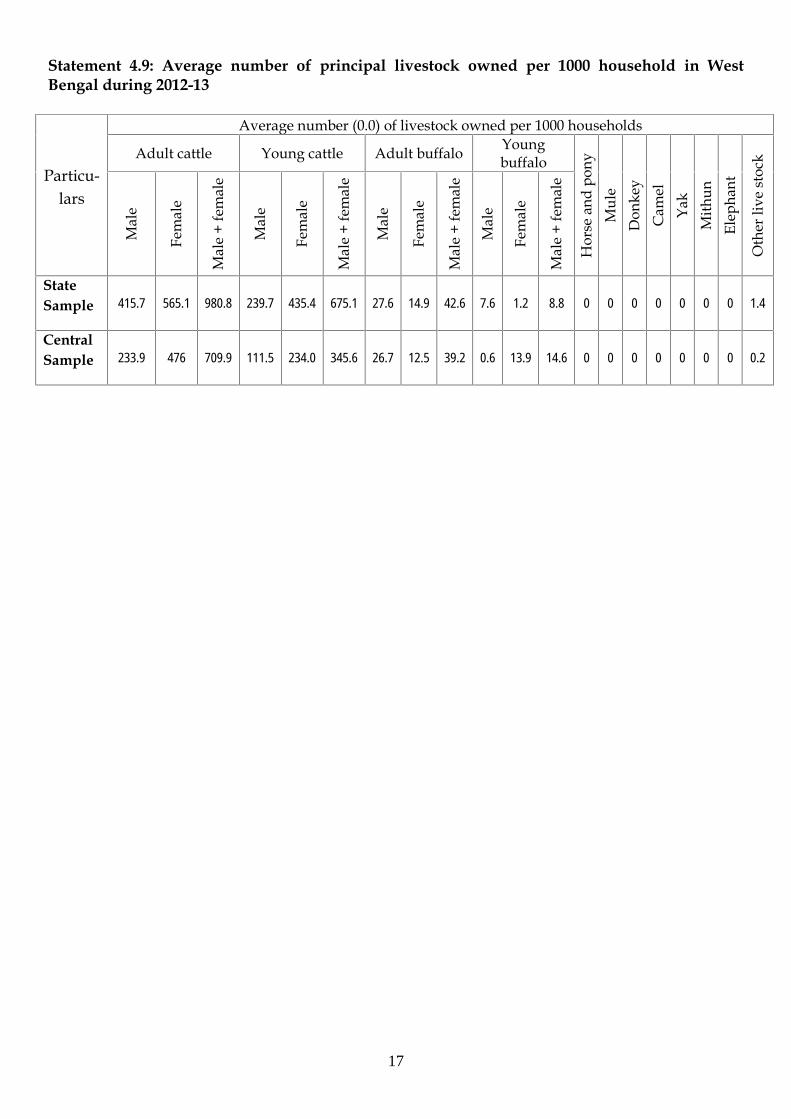
Statement 4.9: Average number of principal livestock owned per 1000 household in WestBengal during 2012-13
Particu-lars
Average number (0.0) of livestock owned per 1000 households
Adult cattle Young cattle Adult buffalo Youngbuffalo
Hor
se a
nd p
ony
Mul
eD
onke
yC
amel
Yak
Mith
unEl
epha
nt
Oth
er li
ve st
ock
Mal
e
Fem
ale
Mal
e +
fem
ale
Mal
e
Fem
ale
Mal
e +
fem
ale
Mal
e
Fem
ale
Mal
e +
fem
ale
Mal
e
Fem
ale
Mal
e +
fem
ale
StateSample 415.7 565.1 980.8 239.7 435.4 675.1 27.6 14.9 42.6 7.6 1.2 8.8 0 0 0 0 0 0 0 1.4
CentralSample 233.9 476 709.9 111.5 234.0 345.6 26.7 12.5 39.2 0.6 13.9 14.6 0 0 0 0 0 0 0 0.2

APPENDIX A
DETAIL TABLES

(1) (2) (3) (4) (5) (6) (7) (8) (9) (10)
Self emp. in cultivation 274 1000 2 2449 6 2449 111 1 111
Self emp. in livestock farming 0 1000 0 2 0 2 1 0 1
Self emp. in other agr. activities 124 346 0 384 0 1110 16 0 26
Self emp. in non-agr. enterprise 57 579 0 295 0 509 5 0 7
Wage/ salaried emp. 485 738 0 3203 0 4340 80 0 112
Others 59 231 0 123 0 531 8 0 14
All class 1000 722 1 6456 6 8942 221 1 271
Estd. no of hhs (00) 8942 6456 6 XXX XXX XXX XXX XXX XXX
Sample no. of hhs 271 221 1 XXX XXX XXX XXX XXX XXX
Table 1a: Per 1000 distribution of households by household classification, proportion of households operated land for agricultural activities and proportion of
households operated land for Jhum cultivation during last 365 days for each type of household classification
Jhum
cultivation
during last 365
days
WEST BENGAL SOCIAL GROUP : SCHEDULED TRIBE VISIT 1
Household classification
Per 1000
distribution
of hhs
Estd. no.
of hhs (00)
Sample no.
of hhs
Proportion (per 1000) of hhs operated
land for
Estd. no. of hhs (00) operated
land for
Sample no. of hhs operated
land
Agricultural
activities during
last 365 days
Jhum cultivation
during last 365
days
Agricultural
activities
during last 365
days
Jhum
cultivation
during last
365 days
Agricultural
activities
during last 365
days
A 1

(1) (2) (3) (4) (5) (6) (7) (8) (9) (10)
Self emp. in cultivation 268 998 0 12135 1 12163 325 1 327
Self emp. in livestock farming 2 830 0 81 0 97 2 0 3
Self emp. in other agr. activities 51 688 0 1601 0 2325 20 0 38
Self emp. in non-agr. enterprise 186 684 0 5785 0 8456 50 0 98
Wage/ salaried emp. 456 706 0 14654 0 20747 202 0 307
Others 37 680 0 1142 0 1679 7 0 25
All class 1000 779 0 35396 1 45467 606 1 798
Estd. no of hhs (00) 45467 35396 1 XXX XXX XXX XXX XXX XXX
Sample no. of hhs 798 606 1 XXX XXX XXX XXX XXX XXX
Table 1b: Per 1000 distribution of households by household classification, proportion of households operated land for agricultural activities and proportion of
households operated land for Jhum cultivation during last 365 days for each type of household classification
WEST BENGAL SOCIAL GROUP : SCHEDULED CASTE VISIT 1
Household classification
Per 1000
distribution
of hhs
Proportion (per 1000) of hhs operated
land for
Estd. no. of hhs (00) operated
land forEstd. no.
of hhs (00)
Sample no. of hhs operated
landSample no.
of hhsAgricultural
activities during
last 365 days
Jhum cultivation
during last 365
days
Agricultural
activities
during last 365
days
Jhum
cultivation
during last
365 days
Agricultural
activities
during last 365
days
Jhum
cultivation
during last 365
days
A 2
(1) (2) (3) (4) (5) (6) (7) (8) (9) (10)
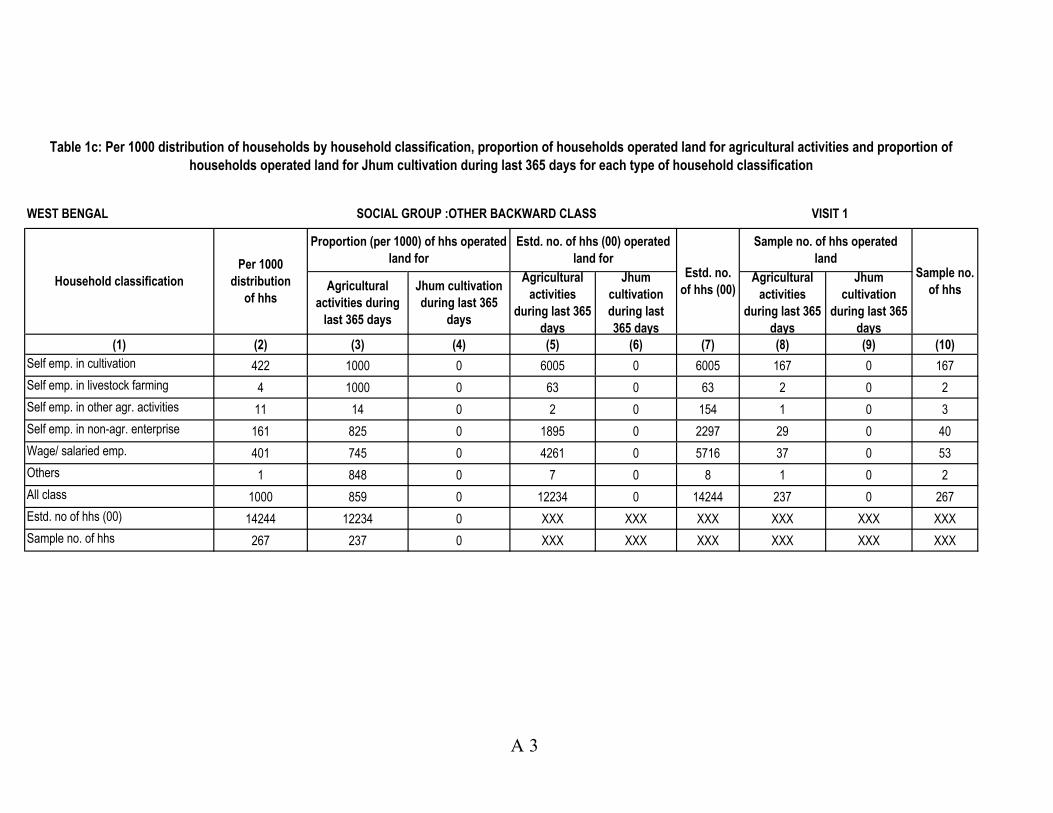
Self emp. in cultivation 422 1000 0 6005 0 6005 167 0 167
Self emp. in livestock farming 4 1000 0 63 0 63 2 0 2
Self emp. in other agr. activities 11 14 0 2 0 154 1 0 3
Self emp. in non-agr. enterprise 161 825 0 1895 0 2297 29 0 40
Wage/ salaried emp. 401 745 0 4261 0 5716 37 0 53
Others 1 848 0 7 0 8 1 0 2
All class 1000 859 0 12234 0 14244 237 0 267
Estd. no of hhs (00) 14244 12234 0 XXX XXX XXX XXX XXX XXX
Sample no. of hhs 267 237 0 XXX XXX XXX XXX XXX XXX
Table 1c: Per 1000 distribution of households by household classification, proportion of households operated land for agricultural activities and proportion of
households operated land for Jhum cultivation during last 365 days for each type of household classification
WEST BENGAL SOCIAL GROUP :OTHER BACKWARD CLASS VISIT 1
Household classification
Per 1000
distribution
of hhs
Proportion (per 1000) of hhs operated
land for
Estd. no. of hhs (00) operated
land forEstd. no.
of hhs (00)
Sample no. of hhs operated
landSample no.
of hhsAgricultural
activities during
last 365 days
Jhum cultivation
during last 365
days
Agricultural
activities
during last 365
days
Jhum
cultivation
during last
365 days
Agricultural
activities
during last 365
days
Jhum
cultivation
during last 365
days
A 3
(1) (2) (3) (4) (5) (6) (7) (8) (9) (10)
Self emp. in cultivation 239 996 1 17147 11 17216 604 2 608
Self emp. in livestock farming 6 930 0 380 0 409 7 0 8
Self emp. in other agr. activities 77 821 0 4558 0 5550 34 0 70
Self emp. in non-agr. enterprise 241 431 0 7496 0 17375 107 0 215
Wage/ salaried emp. 402 546 0 15782 0 28914 171 0 290
Others 35 495 0 1246 0 2519 22 0 56
All class 1000 648 0 46609 11 71983 945 2 1247
Estd. no of hhs (00) 71983 46609 11 XXX XXX XXX XXX XXX XXX
Sample no. of hhs 1247 945 2 XXX XXX XXX XXX XXX XXX
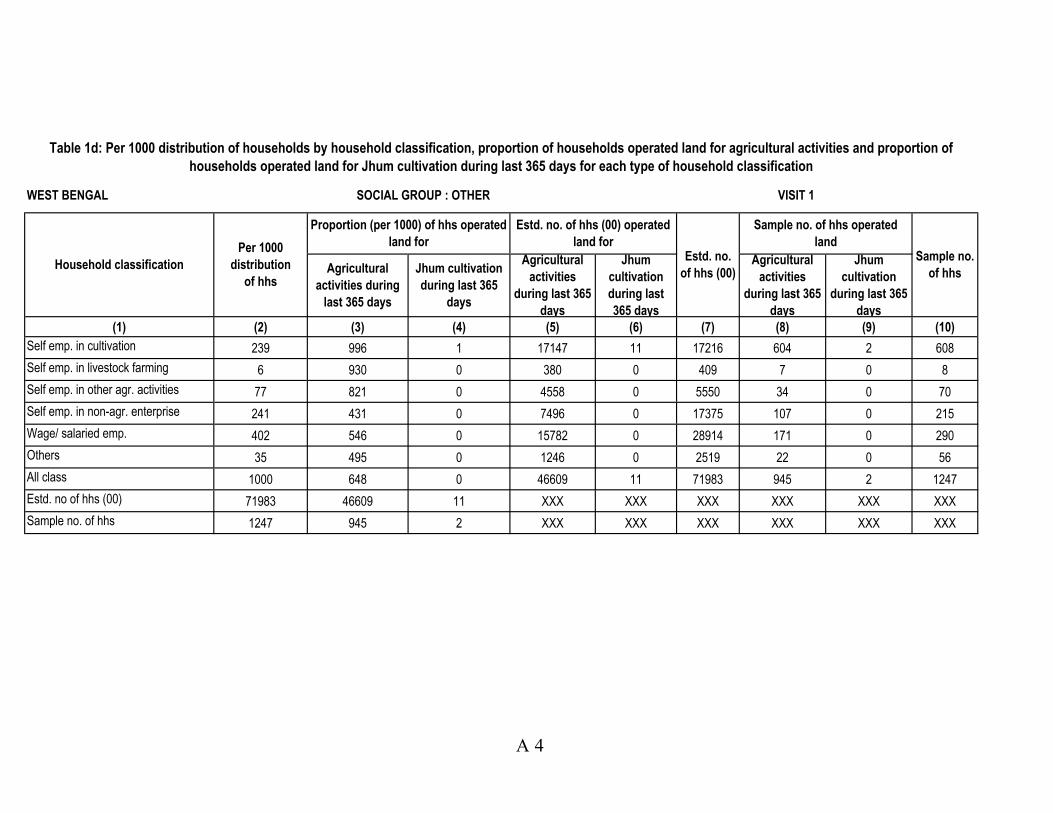
Table 1d: Per 1000 distribution of households by household classification, proportion of households operated land for agricultural activities and proportion of
households operated land for Jhum cultivation during last 365 days for each type of household classification
WEST BENGAL SOCIAL GROUP : OTHER VISIT 1
Household classification
Per 1000
distribution
of hhs
Proportion (per 1000) of hhs operated
land for
Estd. no. of hhs (00) operated
land forEstd. no.
of hhs (00)
Sample no. of hhs operated
landSample no.
of hhsAgricultural
activities during
last 365 days
Jhum cultivation
during last 365
days
Agricultural
activities
during last 365
days
Jhum
cultivation
during last
365 days
Agricultural
activities
during last 365
days
Jhum
cultivation
during last 365
days
A 4

(1) (2) (3) (4) (5) (6) (7) (8) (9) (10)
Self emp. in cultivation 269 997 0 37737 18 37834 1207 4 1213
Self emp. in livestock farming 4 921 0 526 0 571 12 0 14
Self emp. in other agr. activities 65 716 0 6545 0 9140 71 0 137
Self emp. in non-agr. enterprise 204 540 0 15471 0 28638 191 0 360
Wage/ salaried emp. 635 0 37900 0 59717 490 0 762
Others 34 531 0 2517 0 4736 38 0 97
All class 1000 716 0 100695 18 140636 2009 4 2583
Estd. no of hhs (00) 140636 100695 18 XXX XXX XXX XXX XXX XXX
Sample no. of hhs 2583 2009 4 XXX XXX XXX XXX XXX XXX
Table 1d: Per 1000 distribution of households by household classification, proportion of households operated land for agricultural activities and proportion of
households operated land for Jhum cultivation during last 365 days for each type of household classification
WEST BENGAL SOCIAL GROUP :ALL VISIT 1
Household classification
Per 1000
distribution
of hhs
Proportion (per 1000) of hhs operated
land for
Estd. no. of hhs (00) operated
land forEstd. no.
of hhs (00)
Sample no. of hhs operated
landSample no.
of hhsAgricultural
activities during
last 365 days
Jhum cultivation
during last 365
days
Agricultural
activities
during last 365
days
Jhum
cultivation
during last
365 days
Agricultural
activities
during last 365
days
Jhum
cultivation
during last 365
days
A 5

Owned and
possessedLeased in
Otherwise
possessedLeased out
Any kind of
possession (incl. n.r.)Estimated (00) Sample
(1) (2) (3) (4) (5) (6) (7) (8)
ST 196389 55300 7137 89 258826 258826 8942 271
SC 1013023 109684 2144 38190 1124851 1124851 45467 798
OBC 636017 10052 2421 13462 648490 648490 14244 267
Others 1453791 83922 6121 24206 1543834 1543834 71983 1247
All 3299220 258959 17823 75946 3576001 3576001 140636 2583
Estd. area (ha) 3299220 258959 17823 75946 3576001 XXX XXX XXX
Estd. no of hhs (00) 134133 10107 5891 1872 140636 XXX XXX XXX
Sample no. of hhs 2466 210 122 69 2583 XXX XXX XXX
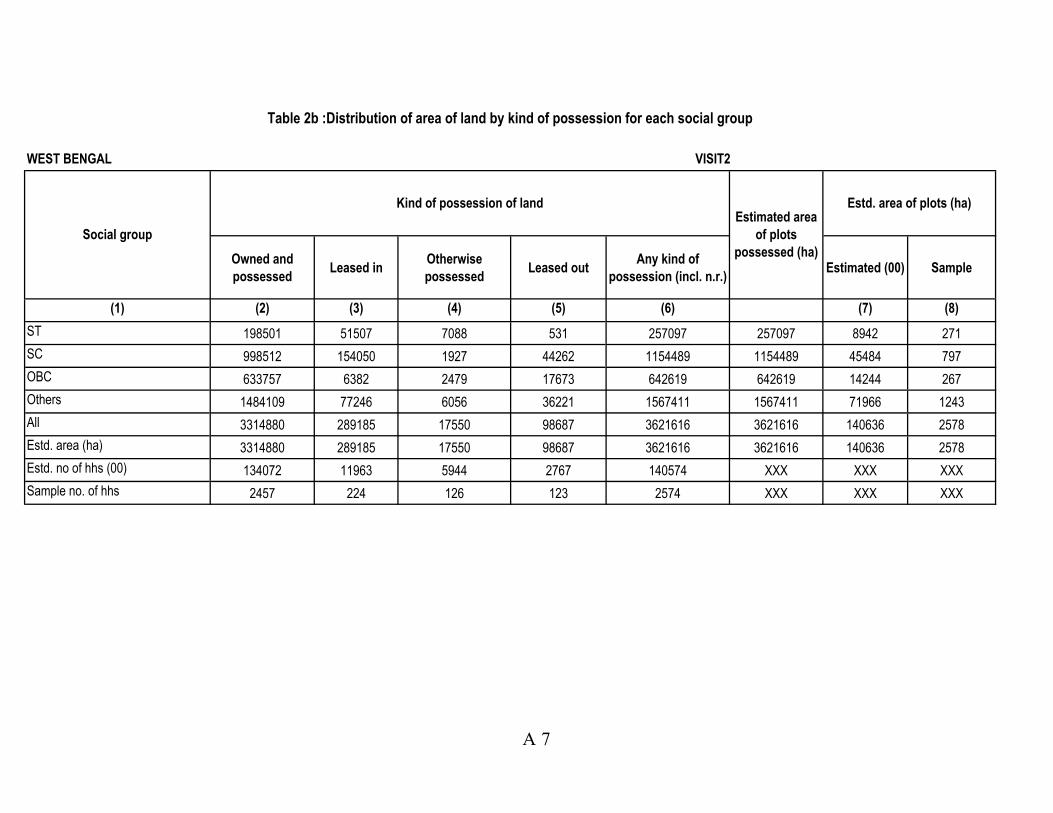
Table 2a :Distribution of area of land by kind of possession for each social group
WEST BENGAL VISIT 1
Social group
Estimated area
of plots
possessed (ha)
Kind of possession of land Estd. area of plots (ha)
A 6
Owned and
possessedLeased in
Otherwise
possessedLeased out
Any kind of
possession (incl. n.r.)Estimated (00) Sample
(1) (2) (3) (4) (5) (6) (7) (8)
ST 198501 51507 7088 531 257097 257097 8942 271
SC 998512 154050 1927 44262 1154489 1154489 45484 797
OBC 633757 6382 2479 17673 642619 642619 14244 267
Others 1484109 77246 6056 36221 1567411 1567411 71966 1243
All 3314880 289185 17550 98687 3621616 3621616 140636 2578
Estd. area (ha) 3314880 289185 17550 98687 3621616 3621616 140636 2578
Estd. no of hhs (00) 134072 11963 5944 2767 140574 XXX XXX XXX
Sample no. of hhs 2457 224 126 123 2574 XXX XXX XXX
Table 2b :Distribution of area of land by kind of possession for each social group
WEST BENGAL VISIT2
Social group
Kind of possession of landEstimated area
of plots
possessed (ha)
Estd. area of plots (ha)
A 7
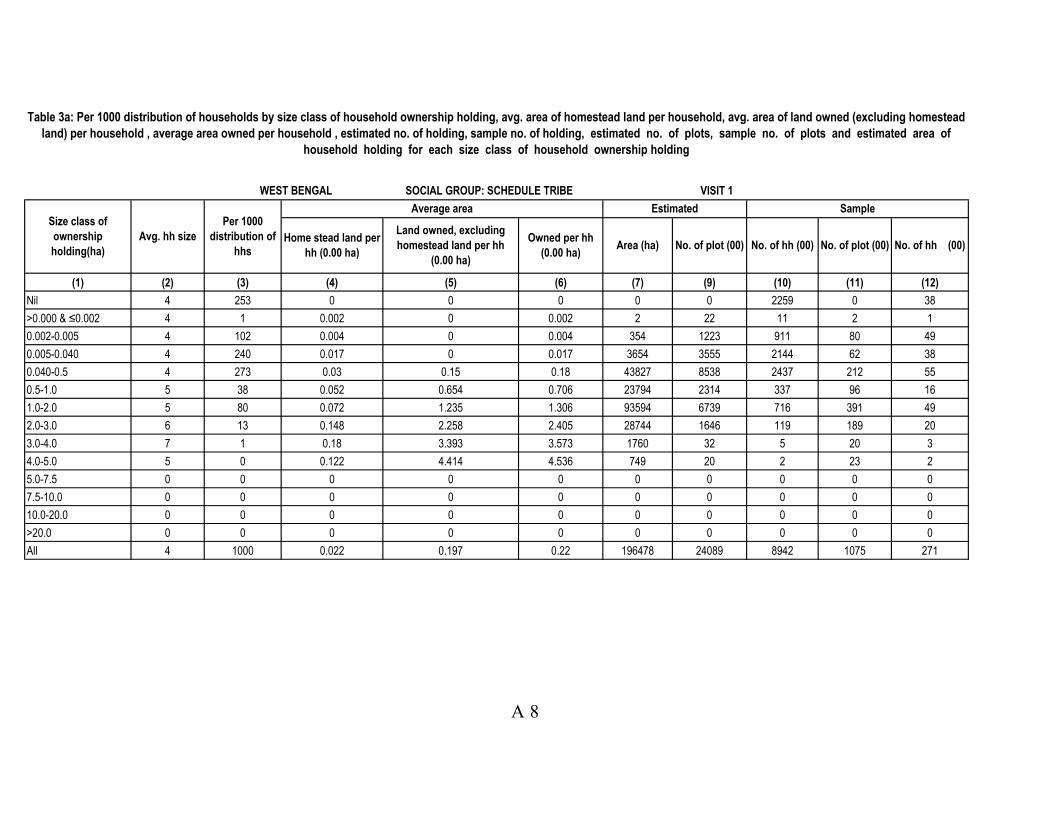
(1) (2) (3) (4) (5) (6) (7) (9) (10) (11) (12)
Nil 4 253 0 0 0 0 0 2259 0 38
>0.000 & ≤0.002 4 1 0.002 0 0.002 2 22 11 2 1
0.002-0.005 4 102 0.004 0 0.004 354 1223 911 80 49
0.005-0.040 4 240 0.017 0 0.017 3654 3555 2144 62 38
0.040-0.5 4 273 0.03 0.15 0.18 43827 8538 2437 212 55
0.5-1.0 5 38 0.052 0.654 0.706 23794 2314 337 96 16
1.0-2.0 5 80 0.072 1.235 1.306 93594 6739 716 391 49
2.0-3.0 6 13 0.148 2.258 2.405 28744 1646 119 189 20
3.0-4.0 7 1 0.18 3.393 3.573 1760 32 5 20 3
4.0-5.0 5 0 0.122 4.414 4.536 749 20 2 23 2
5.0-7.5 0 0 0 0 0 0 0 0 0 0
7.5-10.0 0 0 0 0 0 0 0 0 0 0
10.0-20.0 0 0 0 0 0 0 0 0 0 0
>20.0 0 0 0 0 0 0 0 0 0 0
All 4 1000 0.022 0.197 0.22 196478 24089 8942 1075 271
Table 3a: Per 1000 distribution of households by size class of household ownership holding, avg. area of homestead land per household, avg. area of land owned (excluding homestead
land) per household , average area owned per household , estimated no. of holding, sample no. of holding, estimated no. of plots, sample no. of plots and estimated area of
household holding for each size class of household ownership holding
Home stead land per
hh (0.00 ha)
Land owned, excluding
homestead land per hh
(0.00 ha)
Owned per hh
(0.00 ha)Area (ha) No. of plot (00) No. of hh (00) No. of plot (00)
WEST BENGAL SOCIAL GROUP: SCHEDULE TRIBE VISIT 1
Size class of
ownership
holding(ha)
Avg. hh size
Per 1000
distribution of
hhs
Average area SampleEstimated
No. of hh (00)
A 8

(1) (2) (3) (4) (5) (6) (7) (9) (10) (11) (12)
Nil 4 19 0 0 0 0 0 851 0 25
>0.000 & ≤0.002 3 2 0.002 0 0.002 18 122 91 11 9
0.002-0.005 4 103 0.004 0 0.004 1749 6250 4662 231 163
0.005-0.040 4 306 0.019 0 0.019 26056 22606 13926 234 147
0.040-0.5 4 441 0.028 0.172 0.199 400231 65675 20069 584 168
0.5-1.0 5 80 0.05 0.622 0.672 244901 19380 3643 270 48
1.0-2.0 6 35 0.072 1.256 1.328 212956 11290 1604 1153 175
2.0-3.0 7 12 0.061 2.513 2.574 140681 5917 547 418 52
3.0-4.0 6 2 0.156 3.106 3.261 23797 756 73 83 10
4.0-5.0 4 0 0.47 3.87 4.34 825 8 2 4 1
5.0-7.5 0 0 0 0 0 0 0 0 0 0
7.5-10.0 0 0 0 0 0 0 0 0 0 0
10.0-20.0 0 0 0 0 0 0 0 0 0 0
>20.0 0 0 0 0 0 0 0 0 0 0
All 4 1000 0.026 0.205 0.231 1051213 132005 45467 2988 798
Table 3b: Per 1000 distribution of households by size class of household ownership holding, avg. area of homestead land per household, avg. area of land owned (excluding homestead
land) per household , average area owned per household , estimated no. of holding, sample no. of holding, estimated no. of plots, sample no. of plots and estimated area of
household holding for each size class of household ownership holding
Avg. hh size
Size class of
ownership
holding(ha)
WEST BENGAL SOCIAL GROUP: SCHEDULE CASTE VISIT 1
Area (ha)Owned per hh
(0.00 ha)
Land owned, excluding
homestead land per hh
(0.00 ha)
Home stead land per
hh (0.00 ha)
SampleEstimatedAverage area
No. of hh (00)No. of plot (00)No. of hh (00)No. of plot (00)
Per 1000
distribution of
hhs
A 9
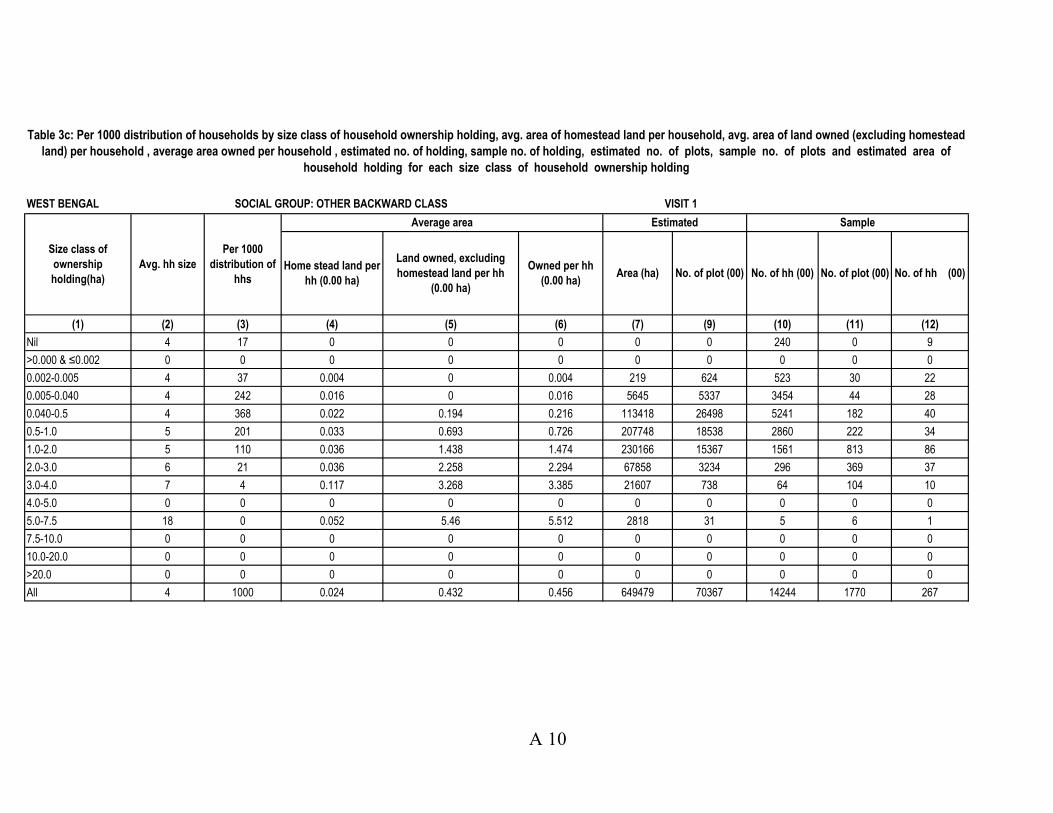
(1) (2) (3) (4) (5) (6) (7) (9) (10) (11) (12)
Nil 4 17 0 0 0 0 0 240 0 9
>0.000 & ≤0.002 0 0 0 0 0 0 0 0 0 0
0.002-0.005 4 37 0.004 0 0.004 219 624 523 30 22
0.005-0.040 4 242 0.016 0 0.016 5645 5337 3454 44 28
0.040-0.5 4 368 0.022 0.194 0.216 113418 26498 5241 182 40
0.5-1.0 5 201 0.033 0.693 0.726 207748 18538 2860 222 34
1.0-2.0 5 110 0.036 1.438 1.474 230166 15367 1561 813 86
2.0-3.0 6 21 0.036 2.258 2.294 67858 3234 296 369 37
3.0-4.0 7 4 0.117 3.268 3.385 21607 738 64 104 10
4.0-5.0 0 0 0 0 0 0 0 0 0 0
5.0-7.5 18 0 0.052 5.46 5.512 2818 31 5 6 1
7.5-10.0 0 0 0 0 0 0 0 0 0 0
10.0-20.0 0 0 0 0 0 0 0 0 0 0
>20.0 0 0 0 0 0 0 0 0 0 0
All 4 1000 0.024 0.432 0.456 649479 70367 14244 1770 267
Table 3c: Per 1000 distribution of households by size class of household ownership holding, avg. area of homestead land per household, avg. area of land owned (excluding homestead
land) per household , average area owned per household , estimated no. of holding, sample no. of holding, estimated no. of plots, sample no. of plots and estimated area of
household holding for each size class of household ownership holding
WEST BENGAL SOCIAL GROUP: OTHER BACKWARD CLASS VISIT 1
Size class of
ownership
holding(ha)
Avg. hh size
Per 1000
distribution of
hhs
Average area Estimated Sample
Home stead land per
hh (0.00 ha)
Land owned, excluding
homestead land per hh
(0.00 ha)
Owned per hh
(0.00 ha)Area (ha) No. of plot (00) No. of hh (00) No. of plot (00) No. of hh (00)
A 10

(1) (2) (3) (4) (5) (6) (7) (9) (10) (11) (12)
Nil 4 44 0 0 0 0 0 3153 0 45
>0.000 & ≤0.002 6 4 0.002 0 0.002 57 286 286 8 8
0.002-0.005 4 89 0.004 0 0.004 2491 7857 6373 201 163
0.005-0.040 4 429 0.016 0 0.016 50920 44656 30862 349 234
0.040-0.5 4 305 0.032 0.194 0.226 496194 77853 21963 903 251
0.5-1.0 5 91 0.031 0.687 0.718 468207 36861 6518 504 83
1.0-2.0 5 31 0.053 1.248 1.302 292080 16007 2244 2749 338
2.0-3.0 6 6 0.067 2.441 2.507 105466 4895 421 994 90
3.0-4.0 7 2 0.081 3.277 3.358 38651 1244 115 256 25
4.0-5.0 11 0 0.069 4.106 4.175 12199 350 29 82 6
5.0-7.5 10 0 0.056 5.62 5.677 11731 290 21 52 4
7.5-10.0 0 0 0 0 0 0 0 0 0 0
10.0-20.0 0 0 0 0 0 0 0 0 0 0
>20.0 0 0 0 0 0 0 0 0 0 0
All 4 1000 0.022 0.183 0.205 1477996 190298 71983 6098 1247
Table 3d: Per 1000 distribution of households by size class of household ownership holding, avg. area of homestead land per household, avg. area of land owned (excluding homestead
land) per household , average area owned per household , estimated no. of holding, sample no. of holding, estimated no. of plots, sample no. of plots and estimated area of
household holding for each size class of household ownership holding
WEST BENGAL SOCIAL GROUP:OTHERS VISIT 1
Size class of
ownership
holding(ha)
Avg. hh size
Per 1000
distribution of
hhs
Average area Estimated Sample
Home stead land per
hh (0.00 ha)
Land owned, excluding
homestead land per hh
(0.00 ha)
Owned per hh
(0.00 ha)Area (ha) No. of plot (00) No. of hh (00) No. of plot (00) No. of hh (00)
A 11
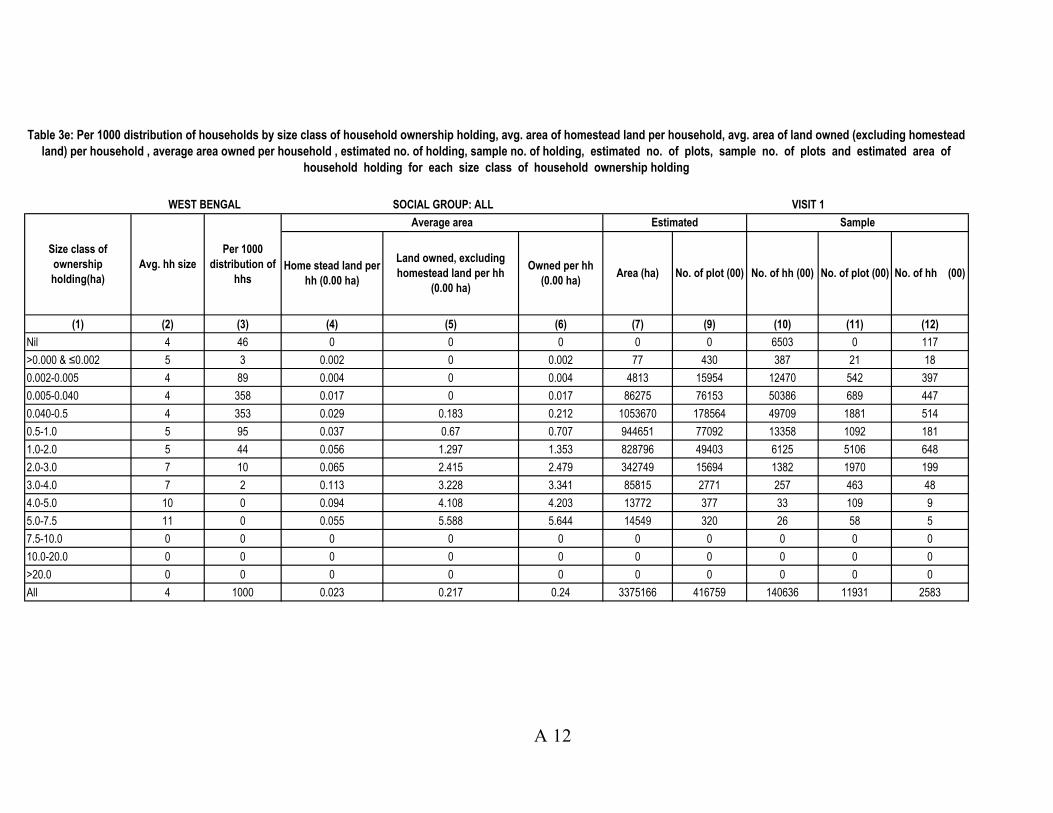
(1) (2) (3) (4) (5) (6) (7) (9) (10) (11) (12)
Nil 4 46 0 0 0 0 0 6503 0 117
>0.000 & ≤0.002 5 3 0.002 0 0.002 77 430 387 21 18
0.002-0.005 4 89 0.004 0 0.004 4813 15954 12470 542 397
0.005-0.040 4 358 0.017 0 0.017 86275 76153 50386 689 447
0.040-0.5 4 353 0.029 0.183 0.212 1053670 178564 49709 1881 514
0.5-1.0 5 95 0.037 0.67 0.707 944651 77092 13358 1092 181
1.0-2.0 5 44 0.056 1.297 1.353 828796 49403 6125 5106 648
2.0-3.0 7 10 0.065 2.415 2.479 342749 15694 1382 1970 199
3.0-4.0 7 2 0.113 3.228 3.341 85815 2771 257 463 48
4.0-5.0 10 0 0.094 4.108 4.203 13772 377 33 109 9
5.0-7.5 11 0 0.055 5.588 5.644 14549 320 26 58 5
7.5-10.0 0 0 0 0 0 0 0 0 0 0
10.0-20.0 0 0 0 0 0 0 0 0 0 0
>20.0 0 0 0 0 0 0 0 0 0 0
All 4 1000 0.023 0.217 0.24 3375166 416759 140636 11931 2583
Table 3e: Per 1000 distribution of households by size class of household ownership holding, avg. area of homestead land per household, avg. area of land owned (excluding homestead
land) per household , average area owned per household , estimated no. of holding, sample no. of holding, estimated no. of plots, sample no. of plots and estimated area of
household holding for each size class of household ownership holding
WEST BENGAL SOCIAL GROUP: ALL VISIT 1
Size class of
ownership
holding(ha)
Avg. hh size
Per 1000
distribution of
hhs
Average area Estimated Sample
Home stead land per
hh (0.00 ha)
Land owned, excluding
homestead land per hh
(0.00 ha)
Owned per hh
(0.00 ha)Area (ha) No. of plot (00) No. of hh (00) No. of plot (00) No. of hh (00)
A 12

(1) (2) (3) (4) (5) (6) (7) (9) (10) (11) (12)
Nil 4 253 0 0 0 0 0 2259 0 38
>0.000 & ≤0.002 4 1 0.002 0 0.002 2 22 11 2 1
0.002-0.005 4 88 0.004 0 0.004 307 1101 791 75 48
0.005-0.040 4 253 0.018 0 0.018 4073 3908 2259 64 38
0.040-0.5 4 273 0.03 0.158 0.188 45864 8610 2442 215 56
0.5-1.0 5 38 0.049 0.655 0.704 23718 2352 337 97 16
1.0-2.0 5 80 0.065 1.245 1.31 93816 6762 716 396 49
2.0-3.0 6 13 0.121 2.285 2.405 28744 1662 119 198 20
3.0-4.0 7 1 0.18 3.393 3.573 1760 37 5 23 3
4.0-5.0 5 0 0.122 4.414 4.536 749 20 2 23 2
5.0-7.5 0 0 0 0 0 0 0 0 0 0
7.5-10.0 0 0 0 0 0 0 0 0 0 0
10.0-20.0 0 0 0 0 0 0 0 0 0 0
>20.0 0 0 0 0 0 0 0 0 0 0
All 4 1000 0.022 0.201 0.223 199033 24474 8942 1093 271
Table 3.1a: Per 1000 distribution of households by size class of household ownership holding, avg. area of homestead land per household, avg. area of land owned (excluding
homestead land) per household , average area owned per household , estimated no. of holding, sample no. of holding, estimated no. of plots, sample no. of plots and
estimated area of household holding for each size class of household ownership holding
No. of hh
(00)
WEST BENGAL SOCIAL GROUP: SCHEDULE TRIBE VISIT 2
Size class of
ownership
holding(ha)
Avg. hh size
Per 1000
distribution of
hhs
Average area Estimated Sample
Home stead land
per hh (0.00 ha)
Land owned,
excluding
homestead land per
hh (0.00 ha)
Owned per hh
(0.00 ha)Area (ha)
No. of plot
(00)No. of hh (00)
No. of plot
(00)
A 13

(1) (2) (3) (4) (5) (6) (7) (9) (10) (11) (12)
Nil 3 21 0 0 0 0 110 936 4 29
>0.000 & ≤0.002 2 2 0.002 0 0.002 15 108 77 10 8
0.002-0.005 4 91 0.004 0 0.004 1542 5554 4151 218 154
0.005-0.040 4 309 0.018 0 0.019 26054 23223 14076 235 145
0.040-0.5 4 451 0.028 0.171 0.199 409022 66656 20530 677 190
0.5-1.0 5 80 0.051 0.621 0.671 243592 19072 3629 253 48
1.0-2.0 6 32 0.069 1.286 1.355 198284 10646 1464 1071 160
2.0-3.0 7 12 0.038 2.538 2.576 143673 6379 558 445 53
3.0-4.0 7 1 0.062 3.162 3.224 19805 677 61 75 9
4.0-5.0 4 0 0.47 3.67 4.14 787 8 2 4 1
5.0-7.5 0 0 0 0 0 0 0 0 0 0
7.5-10.0 0 0 0 0 0 0 0 0 0 0
10.0-20.0 0 0 0 0 0 0 0 0 0 0
>20.0 0 0 0 0 0 0 0 0 0 0
All 4 1000 0.025 0.204 0.229 1042774 132434 45484 2992 797
Table 3.1b: Per 1000 distribution of households by size class of household ownership holding, avg. area of homestead land per household, avg. area of land owned (excluding
homestead land) per household , average area owned per household , estimated no. of holding, sample no. of holding, estimated no. of plots, sample no. of plots and
estimated area of household holding for each size class of household ownership holding
No. of hh
(00)
WEST BENGAL SOCIAL GROUP: SCHEDULE CASTE VISIT 2
Size class of
ownership
holding(ha)
Avg. hh size
Per 1000
distribution of
hhs
Average area Estimated Sample
Home stead land
per hh (0.00 ha)
Land owned,
excluding
homestead land per
hh (0.00 ha)
Owned per hh
(0.00 ha)Area (ha)
No. of plot
(00)No. of hh (00)
No. of plot
(00)
A 14
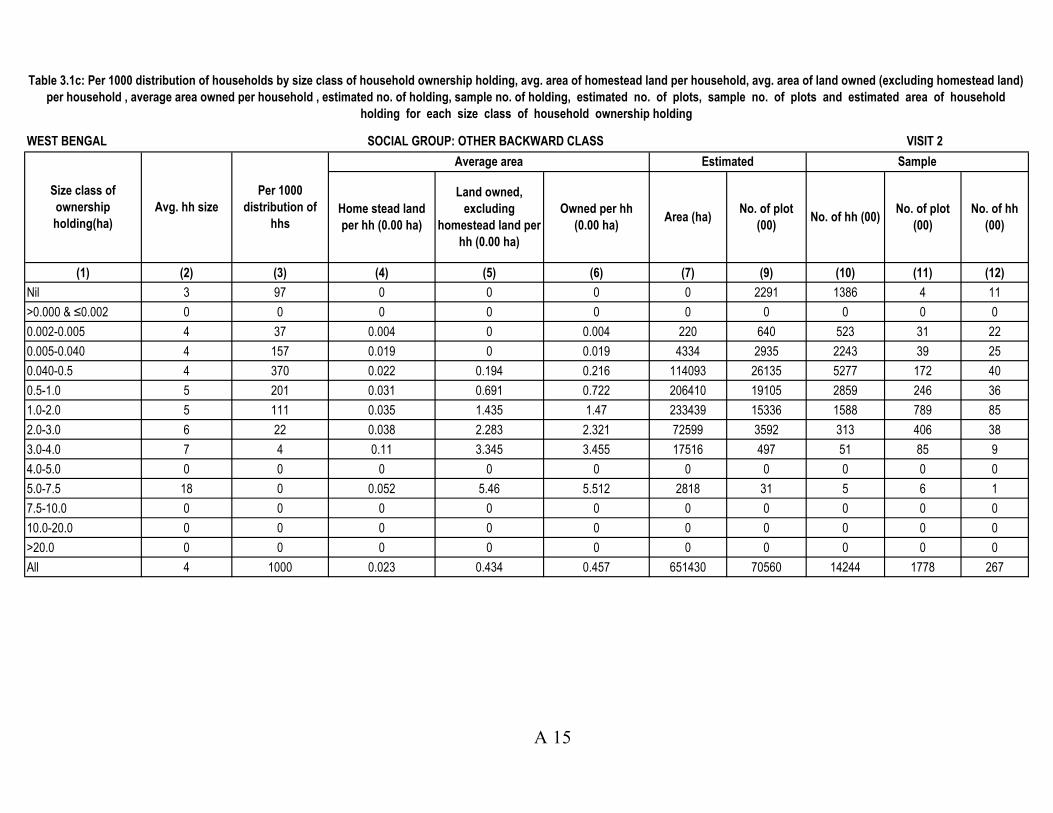
(1) (2) (3) (4) (5) (6) (7) (9) (10) (11) (12)
Nil 3 97 0 0 0 0 2291 1386 4 11
>0.000 & ≤0.002 0 0 0 0 0 0 0 0 0 0
0.002-0.005 4 37 0.004 0 0.004 220 640 523 31 22
0.005-0.040 4 157 0.019 0 0.019 4334 2935 2243 39 25
0.040-0.5 4 370 0.022 0.194 0.216 114093 26135 5277 172 40
0.5-1.0 5 201 0.031 0.691 0.722 206410 19105 2859 246 36
1.0-2.0 5 111 0.035 1.435 1.47 233439 15336 1588 789 85
2.0-3.0 6 22 0.038 2.283 2.321 72599 3592 313 406 38
3.0-4.0 7 4 0.11 3.345 3.455 17516 497 51 85 9
4.0-5.0 0 0 0 0 0 0 0 0 0 0
5.0-7.5 18 0 0.052 5.46 5.512 2818 31 5 6 1
7.5-10.0 0 0 0 0 0 0 0 0 0 0
10.0-20.0 0 0 0 0 0 0 0 0 0 0
>20.0 0 0 0 0 0 0 0 0 0 0
All 4 1000 0.023 0.434 0.457 651430 70560 14244 1778 267
No. of hh
(00)
Table 3.1c: Per 1000 distribution of households by size class of household ownership holding, avg. area of homestead land per household, avg. area of land owned (excluding homestead land)
per household , average area owned per household , estimated no. of holding, sample no. of holding, estimated no. of plots, sample no. of plots and estimated area of household
holding for each size class of household ownership holding
WEST BENGAL SOCIAL GROUP: OTHER BACKWARD CLASS VISIT 2
Size class of
ownership
holding(ha)
Avg. hh size
Per 1000
distribution of
hhs
Average area Estimated Sample
Home stead land
per hh (0.00 ha)
Land owned,
excluding
homestead land per
hh (0.00 ha)
Owned per hh
(0.00 ha)Area (ha)
No. of plot
(00)No. of hh (00)
No. of plot
(00)
A 15

(1) (2) (3) (4) (5) (6) (7) (9) (10) (11) (12)
Nil 4 47 0 0 0 0 528 3377 12 49
>0.000 & ≤0.002 3 2 0.002 0 0.002 30 152 152 7 7
0.002-0.005 4 84 0.004 0 0.004 2380 7598 6075 189 154
0.005-0.040 4 404 0.017 0 0.017 49851 41633 29059 337 224
0.040-0.5 4 341 0.033 0.201 0.234 573691 83961 24547 946 267
0.5-1.0 5 82 0.027 0.708 0.734 435453 32892 5930 523 88
1.0-2.0 5 31 0.064 1.231 1.295 287626 15690 2222 2687 330
2.0-3.0 6 6 0.072 2.4 2.473 110089 5403 445 1033 91
3.0-4.0 6 1 0.059 3.211 3.271 29921 803 91 204 22
4.0-5.0 10 1 0.08 4.149 4.229 19559 734 46 117 7
5.0-7.5 10 0 0.056 5.62 5.677 11731 290 21 52 4
7.5-10.0 0 0 0 0 0 0 0 0 0 0
10.0-20.0 0 0 0 0 0 0 0 0 0 0
>20.0 0 0 0 0 0 0 0 0 0 0
All 4 1000 0.023 0.188 0.211 1520330 189683 71966 6107 1243
Table 3.1d: Per 1000 distribution of households by size class of household ownership holding, avg. area of homestead land per household, avg. area of land owned (excluding
homestead land) per household , average area owned per household , estimated no. of holding, sample no. of holding, estimated no. of plots, sample no. of plots and
estimated area of household holding for each size class of household ownership holding
No. of hh
(00)
WEST BENGAL SOCIAL GROUP: OTHERS VISIT 2
Size class of
ownership
holding(ha)
Avg. hh size
Per 1000
distribution of
hhs
Average area Estimated Sample
Home stead land
per hh (0.00 ha)
Land owned,
excluding
homestead land per
hh (0.00 ha)
Owned per hh
(0.00 ha)Area (ha)
No. of plot
(00)No. of hh (00)
No. of plot
(00)
A 16

(1) (2) (3) (4) (5) (6) (7) (9) (10) (11) (12)
Nil 4 57 0 0 0 0 2929 7958 20 127
>0.000 & ≤0.002 3 2 0.002 0 0.002 48 283 240 19 16
0.002-0.005 4 82 0.004 0 0.004 4449 14892 11541 513 378
0.005-0.040 4 339 0.017 0 0.018 84311 71699 47637 675 432
0.040-0.5 4 375 0.03 0.186 0.216 1142672 185362 52796 2010 553
0.5-1.0 5 91 0.035 0.678 0.713 909173 73420 12754 1119 188
1.0-2.0 5 43 0.057 1.3 1.358 813165 48435 5989 4943 624
2.0-3.0 7 10 0.056 2.418 2.474 355105 17035 1435 2082 202
3.0-4.0 6 1 0.075 3.233 3.309 69002 2014 209 387 43
4.0-5.0 10 0 0.096 4.139 4.235 21094 761 50 144 10
5.0-7.5 11 0 0.055 5.588 5.644 14549 320 26 58 5
7.5-10.0 0 0 0 0 0 0 0 0 0 0
10.0-20.0 0 0 0 0 0 0 0 0 0 0
>20.0 0 0 0 0 0 0 0 0 0 0
All 4 1000 0.024 0.219 0.243 3413567 417151 140636 11970 2578
Table 3.1e: Per 1000 distribution of households by size class of household ownership holding, avg. area of homestead land per household, avg. area of land owned (excluding
homestead land) per household , average area owned per household , estimated no. of holding, sample no. of holding, estimated no. of plots, sample no. of plots and
estimated area of household holding for each size class of household ownership holding
No. of plot
(00)
No. of hh
(00)
WEST BENGAL SOCIAL GROUP: ALL VISIT 2
Size class of
ownership
holding(ha)
Avg. hh size
Per 1000
distribution of
hhs
Average area Estimated Sample
Home stead land
per hh (0.00 ha)
Land owned,
excluding
homestead land per
hh (0.00 ha)
Owned per hh
(0.00 ha)Area (ha)
No. of plot
(00)No. of hh (00)
A 17

(1) (2) (3) (4) (5) (6) (7) (9) (10) (11) (12)
Nil 4 253 0 0 0 0 0 2259 0 38
>0.000 & ≤0.002 4 1 0.002 0 0.002 2 22 11 2 1
0.002-0.005 4 89 0.004 0 0.004 328 1111 797 77 49
0.005-0.040 4 253 0.018 0 0.018 4170 3908 2259 64 38
0.040-0.5 4 273 0.034 0.15 0.184 44945 8461 2437 211 55
0.5-1.0 5 38 0.058 0.669 0.727 24498 2353 337 98 16
1.0-2.0 5 80 0.072 1.277 1.349 96636 6762 716 396 49
2.0-3.0 6 13 0.149 2.33 2.479 29622 1662 119 198 20
3.0-4.0 7 1 0.18 4.1 4.28 2108 37 5 23 3
4.0-5.0 5 0 0.122 4.414 4.536 749 20 2 23 2
5.0-7.5 0 0 0 0 0 0 0 0 0 0
7.5-10.0 0 0 0 0 0 0 0 0 0 0
10.0-20.0 0 0 0 0 0 0 0 0 0 0
>20.0 0 0 0 0 0 0 0 0 0 0
All 4 1000 0.024 0.203 0.227 203058 24337 8942 1092 271
No. of hh
(00)
Table 3.2a: Per 1000 distribution of households by size class of household ownership holding, avg. area of homestead land per household, avg.
area of land owned (excluding homestead land) per household , average area owned per household , estimated no. of holding, sample no. of holding, estimated no. of plots, sample no.
of plots and estimated area of household holding for each size class of household ownership holding
WEST BENGAL Social Group: SCHEDULE TRIBE Visit: Whole Agricultural Year
Size class of ownership
holding (ha)Avg. hh size
Per 1000
distribution of hhs
Average area Estimated Sample
Home stead land
per hh (0.00 ha)
Land owned, excluding
homestead land per hh
(0.00 ha)
Owned per hh
(0.00 ha)Area (ha)
No. of plot
(00)
No. of hh
(00)
No. of plot
(00)
A 18
(1) (2) (3) (4) (5) (6) (7) (9) (10) (11) (12)
Nil 3 97 0.008 0 0.008 1145 2291 1386 4 11
>0.000 & ≤0.002 4 1 0.004 0 0.004 4 11 11 1 1
0.002-0.005 4 36 0.004 0 0.004 219 618 513 29 21
0.005-0.040 4 162 0.02 0 0.02 4508 3065 2308 41 26
0.040-0.5 4 368 0.024 0.194 0.218 114082 26256 5241 180 40
0.5-1.0 5 199 0.033 0.697 0.73 206595 18759 2830 234 35
1.0-2.0 5 111 0.036 1.444 1.48 234955 15324 1588 787 85
2.0-3.0 6 22 0.043 2.301 2.343 73288 3592 313 406 38
3.0-4.0 7 4 0.118 3.345 3.463 17553 497 51 85 9
4.0-5.0 0 0 0 0 0 0 0 0 0 0
5.0-7.5 18 0 0.052 5.46 5.512 2818 31 5 6 1
7.5-10.0 0 0 0 0 0 0 0 0 0 0
10.0-20.0 0 0 0 0 0 0 0 0 0 0
>20.0 0 0 0 0 0 0 0 0 0 0
All 4 1000 0.025 0.435 0.46 655167 70443 14244 1773 267
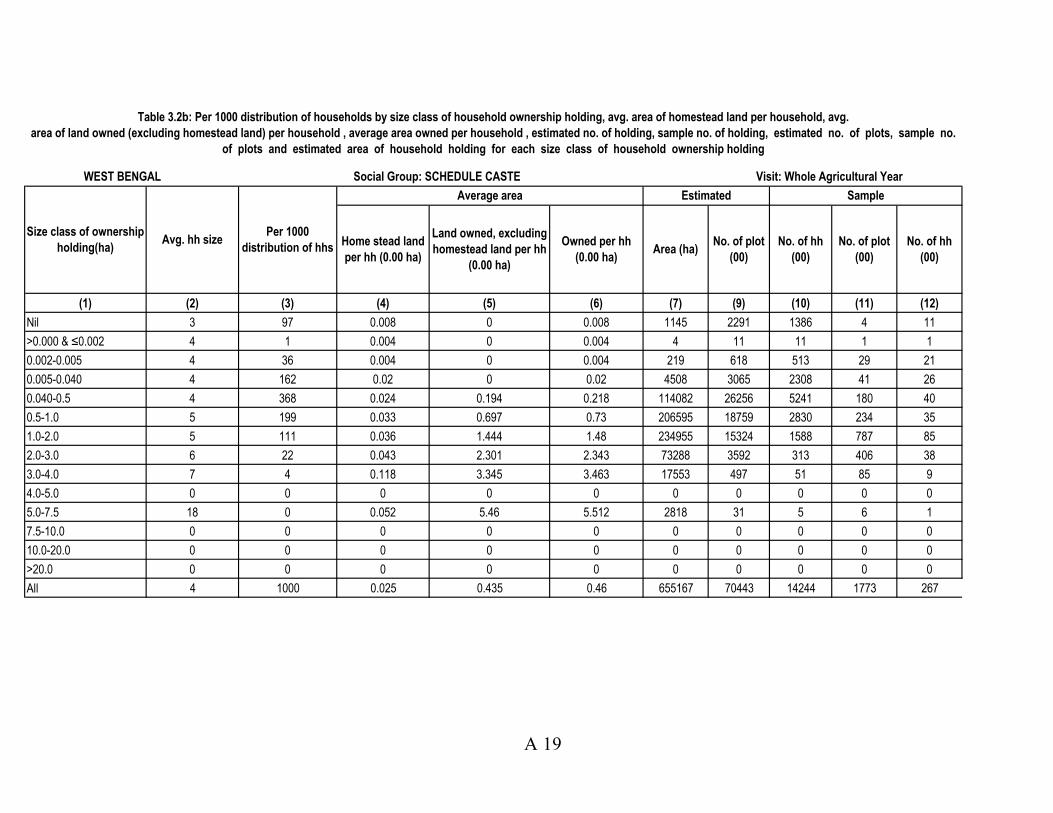
Table 3.2b: Per 1000 distribution of households by size class of household ownership holding, avg. area of homestead land per household, avg.
area of land owned (excluding homestead land) per household , average area owned per household , estimated no. of holding, sample no. of holding, estimated no. of plots, sample no.
of plots and estimated area of household holding for each size class of household ownership holding
No. of hh
(00)
WEST BENGAL Social Group: SCHEDULE CASTE Visit: Whole Agricultural Year
Size class of ownership
holding(ha)Avg. hh size
Per 1000
distribution of hhs
Average area Estimated Sample
Home stead land
per hh (0.00 ha)
Land owned, excluding
homestead land per hh
(0.00 ha)
Owned per hh
(0.00 ha)Area (ha)
No. of plot
(00)
No. of hh
(00)
No. of plot
(00)
A 19
(1) (2) (3) (4) (5) (6) (7) (9) (10) (11) (12)
Nil 4 47 0.001 0.009 0.01 3288 528 3377 12 49
>0.000 & ≤0.002 3 2 0.002 0 0.002 30 152 152 7 7
0.002-0.005 4 85 0.004 0 0.004 2491 7747 6150 193 156
0.005-0.040 4 403 0.017 0 0.017 50747 41680 29027 344 227
0.040-0.5 4 340 0.035 0.207 0.241 591513 84257 24499 928 260
0.5-1.0 5 83 0.031 0.716 0.747 443850 32963 5941 550 92
1.0-2.0 5 31 0.067 1.253 1.32 292553 15614 2217 2674 328
2.0-3.0 6 6 0.081 2.471 2.552 113628 5403 445 1033 91
3.0-4.0 6 1 0.062 3.239 3.301 30201 803 91 204 22
4.0-5.0 10 1 0.08 4.157 4.237 19596 734 46 117 7
5.0-7.5 10 0 0.056 5.62 5.677 11731 290 21 52 4
7.5-10.0 0 0 0 0 0 0 0 0 0 0
10.0-20.0 0 0 0 0 0 0 0 0 0 0
>20.0 0 0 0 0 0 0 0 0 0 0
All 4 1000 0.024 0.192 0.217 1559628 190172 71966 6114 1243
No. of hh
(00)
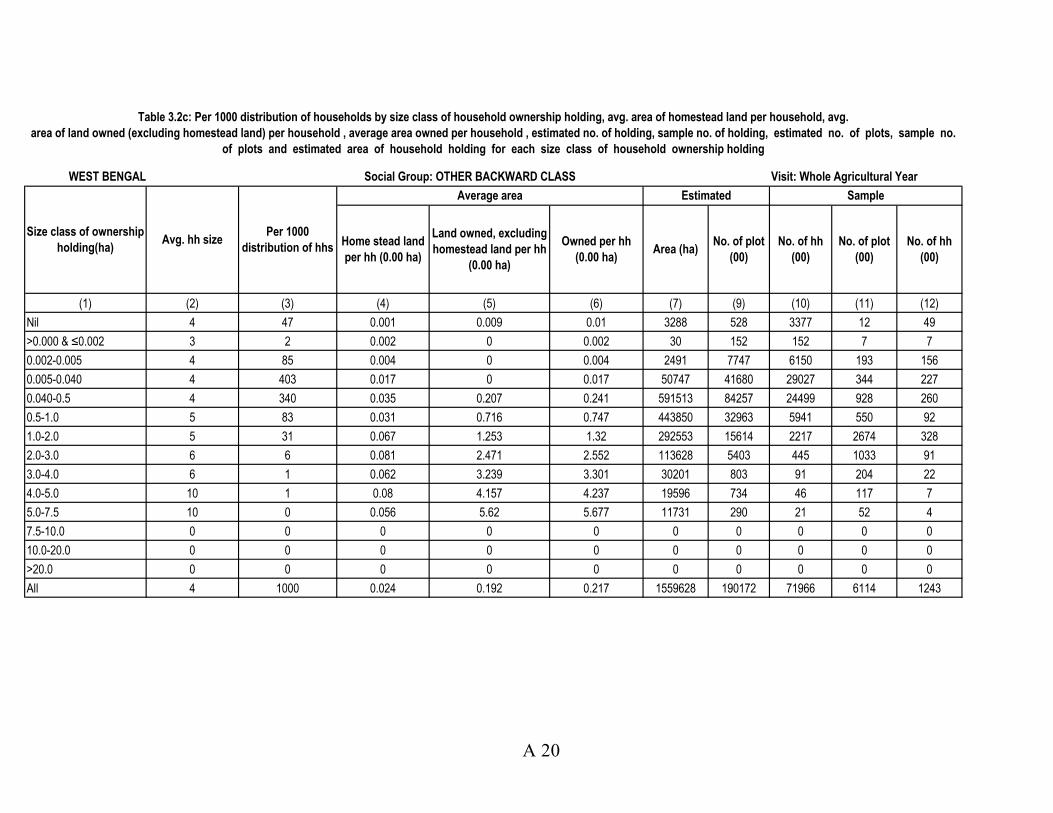
Table 3.2c: Per 1000 distribution of households by size class of household ownership holding, avg. area of homestead land per household, avg.
area of land owned (excluding homestead land) per household , average area owned per household , estimated no. of holding, sample no. of holding, estimated no. of plots, sample no.
of plots and estimated area of household holding for each size class of household ownership holding
WEST BENGAL Social Group: OTHER BACKWARD CLASS Visit: Whole Agricultural Year
Size class of ownership
holding(ha)Avg. hh size
Per 1000
distribution of hhs
Average area Estimated Sample
Home stead land
per hh (0.00 ha)
Land owned, excluding
homestead land per hh
(0.00 ha)
Owned per hh
(0.00 ha)Area (ha)
No. of plot
(00)
No. of hh
(00)
No. of plot
(00)
A 20
(1) (2) (3) (4) (5) (6) (7) (9) (10) (11) (12)
Nil 4 57 0.002 0.004 0.006 4485 2929 7958 20 127
>0.000 & ≤0.002 3 2 0.002 0 0.002 52 293 251 20 17
0.002-0.005 4 83 0.004 0 0.004 4602 15074 11637 522 383
0.005-0.040 4 339 0.018 0 0.018 86686 71979 47743 682 436
0.040-0.5 4 374 0.031 0.19 0.222 1165849 185078 52586 1969 535
0.5-1.0 5 91 0.038 0.686 0.724 922622 73262 12751 1167 195
1.0-2.0 5 43 0.062 1.322 1.384 829184 48251 5990 4957 625
2.0-3.0 7 10 0.07 2.455 2.525 362375 17037 1435 2084 202
3.0-4.0 6 1 0.084 3.268 3.352 69900 2014 209 387 43
4.0-5.0 10 0 0.096 4.154 4.251 21169 761 50 144 10
5.0-7.5 11 0 0.055 5.588 5.644 14549 320 26 58 5
7.5-10.0 0 0 0 0 0 0 0 0 0 0
10.0-20.0 0 0 0 0 0 0 0 0 0 0
>20.0 0 0 0 0 0 0 0 0 0 0
All 4 1000 0.025 0.222 0.248 3481473 416998 140636 12010 2578
No. of hh
(00)
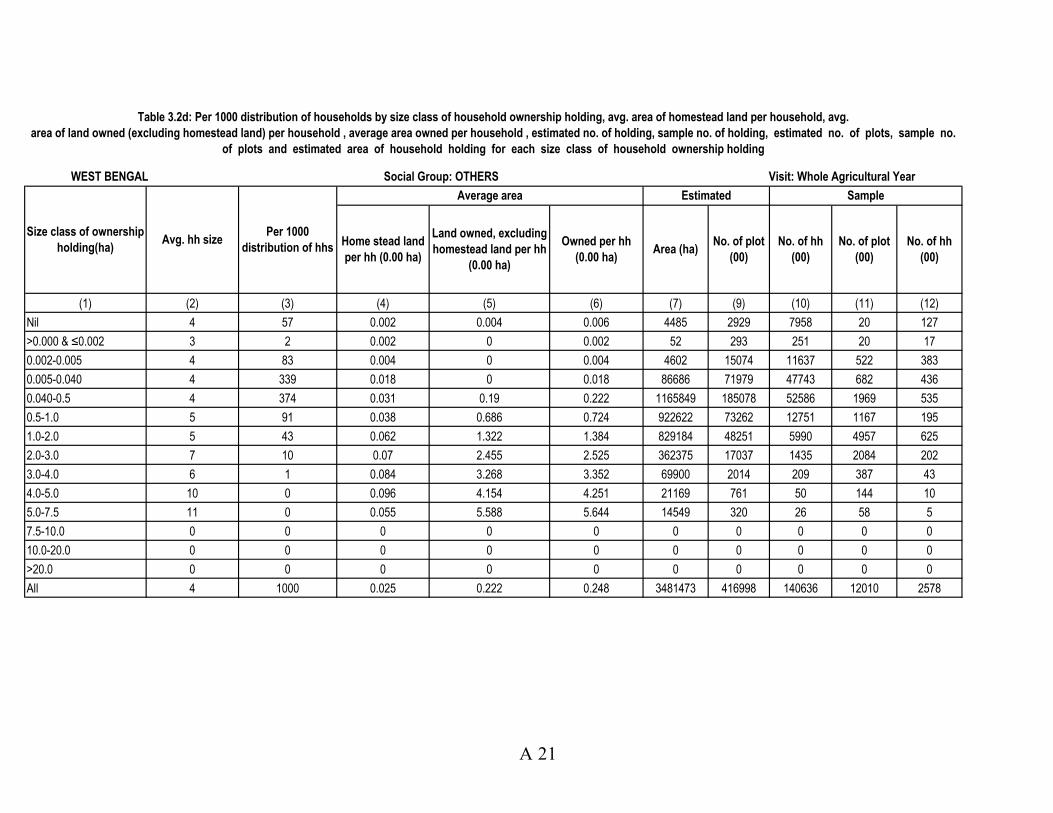
Table 3.2d: Per 1000 distribution of households by size class of household ownership holding, avg. area of homestead land per household, avg.
area of land owned (excluding homestead land) per household , average area owned per household , estimated no. of holding, sample no. of holding, estimated no. of plots, sample no.
of plots and estimated area of household holding for each size class of household ownership holding
WEST BENGAL Social Group: OTHERS Visit: Whole Agricultural Year
Size class of ownership
holding(ha)Avg. hh size
Per 1000
distribution of hhs
Average area Estimated Sample
Home stead land
per hh (0.00 ha)
Land owned, excluding
homestead land per hh
(0.00 ha)
Owned per hh
(0.00 ha)Area (ha)
No. of plot
(00)
No. of hh
(00)
No. of plot
(00)
A 21
(1) (2) (3) (4) (5) (6) (7) (9) (10) (11) (12)
Nil 4 57 0 0 0 0 2929 7958 20 127
>0.000 & ≤0.002 3 2 0.002 0 0.002 48 283 240 19 16
0.002-0.005 4 82 0.004 0 0.004 4449 14892 11541 513 378
0.005-0.040 4 339 0.017 0 0.018 84311 71699 47637 675 432
0.040-0.5 4 375 0.03 0.186 0.216 1142672 185362 52796 2010 553
0.5-1.0 5 91 0.035 0.678 0.713 909173 73420 12754 1119 188
1.0-2.0 5 43 0.057 1.3 1.358 813165 48435 5989 4943 624
2.0-3.0 7 10 0.056 2.418 2.474 355105 17035 1435 2082 202
3.0-4.0 6 1 0.075 3.233 3.309 69002 2014 209 387 43
4.0-5.0 10 0 0.096 4.139 4.235 21094 761 50 144 10
5.0-7.5 11 0 0.055 5.588 5.644 14549 320 26 58 5
7.5-10.0 0 0 0 0 0 0 0 0 0 0
10.0-20.0 0 0 0 0 0 0 0 0 0 0
>20.0 0 0 0 0 0 0 0 0 0 0
All 4 1000 0.024 0.219 0.243 3413567 417151 140636 11970 2578
No. of hh
(00)
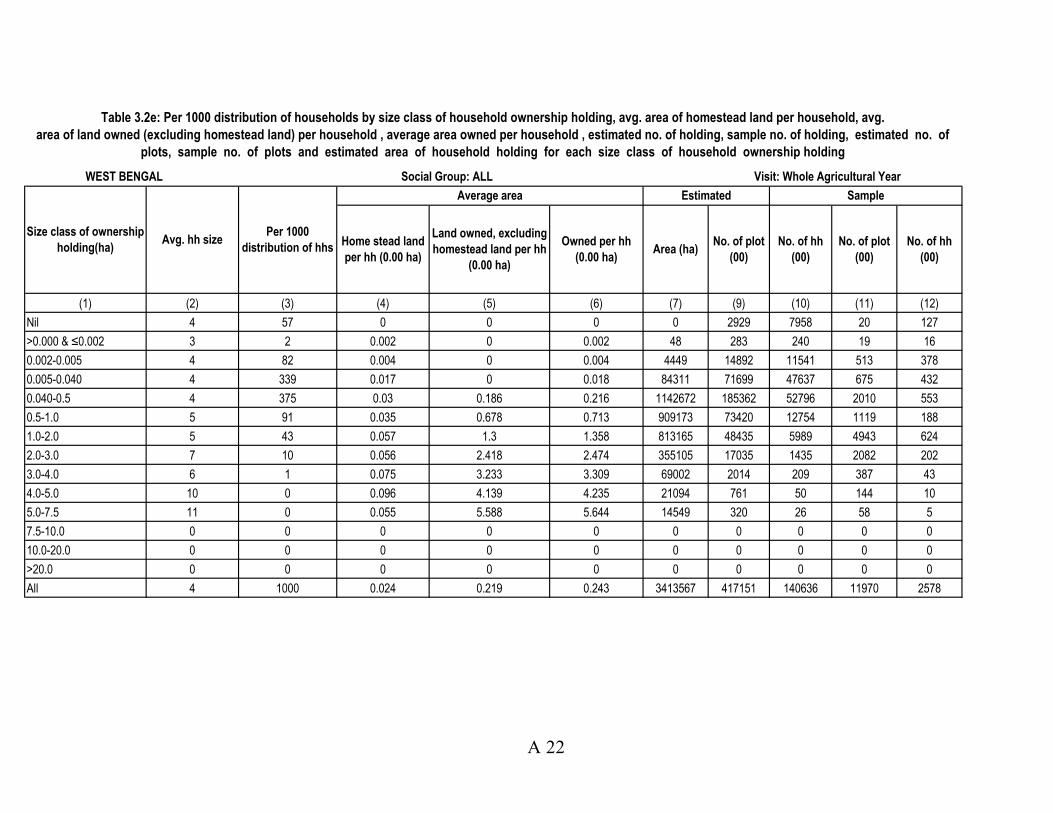
Table 3.2e: Per 1000 distribution of households by size class of household ownership holding, avg. area of homestead land per household, avg.
area of land owned (excluding homestead land) per household , average area owned per household , estimated no. of holding, sample no. of holding, estimated no. of
plots, sample no. of plots and estimated area of household holding for each size class of household ownership holding
WEST BENGAL Social Group: ALL Visit: Whole Agricultural Year
Size class of ownership
holding(ha)Avg. hh size
Per 1000
distribution of hhs
Average area Estimated Sample
Home stead land
per hh (0.00 ha)
Land owned, excluding
homestead land per hh
(0.00 ha)
Owned per hh
(0.00 ha)Area (ha)
No. of plot
(00)
No. of hh
(00)
No. of plot
(00)
A 22
Cultivation Livestock farming
Other
agricultural
activities
Non- agricultural
enterpriseEstd. Sample
(1) (2) (3) (4) (5) (6) (7) (8) est (10)
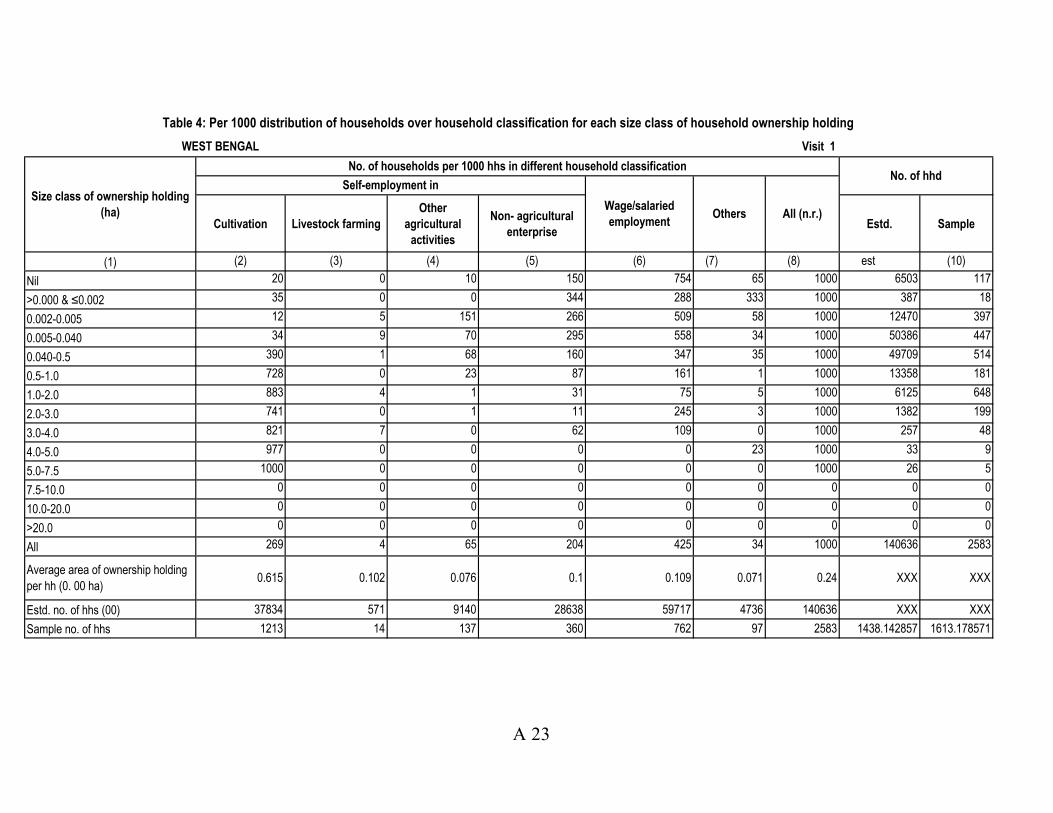
Nil 20 0 10 150 754 65 1000 6503 117
>0.000 & ≤0.002 35 0 0 344 288 333 1000 387 18
0.002-0.005 12 5 151 266 509 58 1000 12470 397
0.005-0.040 34 9 70 295 558 34 1000 50386 447
0.040-0.5 390 1 68 160 347 35 1000 49709 514
0.5-1.0 728 0 23 87 161 1 1000 13358 181
1.0-2.0 883 4 1 31 75 5 1000 6125 648
2.0-3.0 741 0 1 11 245 3 1000 1382 199
3.0-4.0 821 7 0 62 109 0 1000 257 48
4.0-5.0 977 0 0 0 0 23 1000 33 9
5.0-7.5 1000 0 0 0 0 0 1000 26 5
7.5-10.0 0 0 0 0 0 0 0 0 0
10.0-20.0 0 0 0 0 0 0 0 0 0
>20.0 0 0 0 0 0 0 0 0 0
All 269 4 65 204 425 34 1000 140636 2583
Estd. no. of hhs (00) 37834 571 9140 28638 59717 4736 140636 XXX XXX
Sample no. of hhs 1213 14 137 360 762 97 2583 1438.142857 1613.178571
Average area of ownership holding
per hh (0. 00 ha)0.615 0.102 0.076 0.1 0.109 0.071 0.24 XXX XXX
Table 4: Per 1000 distribution of households over household classification for each size class of household ownership holding
WEST BENGAL Visit 1
Size class of ownership holding
(ha)
No. of households per 1000 hhs in different household classification
Self-employment in
Wage/salaried
employmentOthers All (n.r.)
No. of hhd
A 23

Owned and
possessedLeased in
Other wise
possessedLeased out
All (incl.
n.r.)
Owned and
possessedLeased in
Other wise
possessed
Leased
out
All (incl.
n.r.)
No. of
plots (00)
Area of
plots (ha)
No. of
hhs (00)Plots hhs
(1) (2) (3) (4) (5) (6) (7) (8) (9) (10) (11) (12) (13) (14) (15) (16) (17)
Nil 0 1397 8565 0 9962 0 5015 14150 0 19165 411 9962 19165 6503 190 117
>0.000 & ≤0.002 430 4 0 0 434 77 1 0 0 78 109 434 78 387 22 18
0.002-0.005 15954 620 0 0 16574 4813 6645 0 0 11458 278 16574 11458 12470 550 397
0.005-0.040 76112 4478 78 41 80668 86134 64681 1738 141 152552 493 80668 152552 50386 808 447
0.040-0.5 177715 10958 423 849 189096 1047786 144874 1821 5884 1194481 778 189096 1194481 49709 2060 514
0.5-1.0 75589 1265 0 1503 76855 928418 23188 0 16233 951606 914 76855 951606 13358 1136 181
1.0-2.0 48930 340 5 474 49274 816977 10184 114 11819 827275 927 49274 827275 6125 5103 648
2.0-3.0 14495 35 0 1198 14530 308038 991 0 34711 309029 931 14530 309029 1382 1943 199
3.0-4.0 2602 197 0 169 2799 79095 3380 0 6720 82475 915 2799 82475 257 462 48
4.0-5.0 362 0 0 16 362 13333 0 0 439 13333 950 362 13333 33 104 9
5.0-7.5 320 0 0 0 320 14549 0 0 0 14549 1000 320 14549 26 58 5
7.5-10.0 0 0 0 0 0 0 0 0 0 0 0 0 0 0 0 0
10.0-20.0 0 0 0 0 0 0 0 0 0 0 0 0 0 0 0 0
>20.0 0 0 0 0 0 0 0 0 0 0 0 0 0 0 0 0
All 412509 19293 9071 4250 440874 3299220 258959 17823 75946 3576001 634 440874 3576001 140636 12436 2583
Estd. no of plots (00) /area
(ha) 412509 19293 9071 4250 440874 3299220 258959 17823 75946 3576001 XXX XXX XXX XXX XXX XXX
Sample no. of plots 11765 483 188 166 12436 XXX XXX XXX XXX XXX XXX XXX XXX XXX XXX XXX
Number of Plots (00) with Kind of Possession as Area of Plots with Kind of Possession as
Table 5.1: Number of plots and corresponding area of the households belonging to different size class of household ownership holding by kind of possession
WEST BENGAL Visit 1
Size class of ownership
holding (ha)
Prop. of hhs
reporting only
home stead land
per 1000 hhs
Estd. Sample no. of
A 42
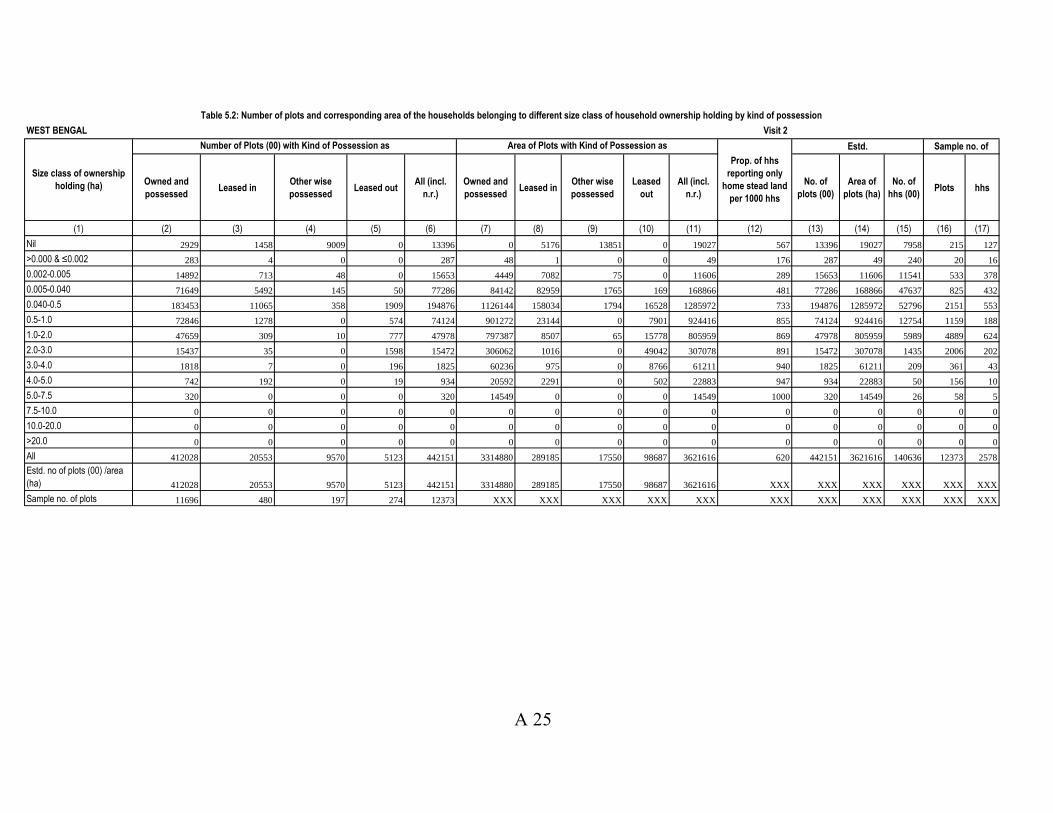
Owned and
possessedLeased in
Other wise
possessedLeased out
All (incl.
n.r.)
Owned and
possessedLeased in
Other wise
possessed
Leased
out
All (incl.
n.r.)
No. of
plots (00)
Area of
plots (ha)
No. of
hhs (00)Plots hhs
(1) (2) (3) (4) (5) (6) (7) (8) (9) (10) (11) (12) (13) (14) (15) (16) (17)
Nil 2929 1458 9009 0 13396 0 5176 13851 0 19027 567 13396 19027 7958 215 127
>0.000 & ≤0.002 283 4 0 0 287 48 1 0 0 49 176 287 49 240 20 16
0.002-0.005 14892 713 48 0 15653 4449 7082 75 0 11606 289 15653 11606 11541 533 378
0.005-0.040 71649 5492 145 50 77286 84142 82959 1765 169 168866 481 77286 168866 47637 825 432
0.040-0.5 183453 11065 358 1909 194876 1126144 158034 1794 16528 1285972 733 194876 1285972 52796 2151 553
0.5-1.0 72846 1278 0 574 74124 901272 23144 0 7901 924416 855 74124 924416 12754 1159 188
1.0-2.0 47659 309 10 777 47978 797387 8507 65 15778 805959 869 47978 805959 5989 4889 624
2.0-3.0 15437 35 0 1598 15472 306062 1016 0 49042 307078 891 15472 307078 1435 2006 202
3.0-4.0 1818 7 0 196 1825 60236 975 0 8766 61211 940 1825 61211 209 361 43
4.0-5.0 742 192 0 19 934 20592 2291 0 502 22883 947 934 22883 50 156 10
5.0-7.5 320 0 0 0 320 14549 0 0 0 14549 1000 320 14549 26 58 5
7.5-10.0 0 0 0 0 0 0 0 0 0 0 0 0 0 0 0 0
10.0-20.0 0 0 0 0 0 0 0 0 0 0 0 0 0 0 0 0
>20.0 0 0 0 0 0 0 0 0 0 0 0 0 0 0 0 0
All 412028 20553 9570 5123 442151 3314880 289185 17550 98687 3621616 620 442151 3621616 140636 12373 2578
Sample no. of plots 11696 480 197 274 12373 XXX XXX XXX XXX XXX XXX XXX XXX XXX XXX XXX
XXX XXX
Number of Plots (00) with Kind of Possession as Area of Plots with Kind of Possession as
3621616 XXX XXX XXX XXX442151 3314880 289185 17550 98687
Estd. no of plots (00) /area
(ha) 412028 20553 9570 5123
Table 5.2: Number of plots and corresponding area of the households belonging to different size class of household ownership holding by kind of possession
WEST BENGAL Visit 2
Size class of ownership
holding (ha)
Prop. of hhs
reporting only
home stead land
per 1000 hhs
Estd. Sample no. of
A 25
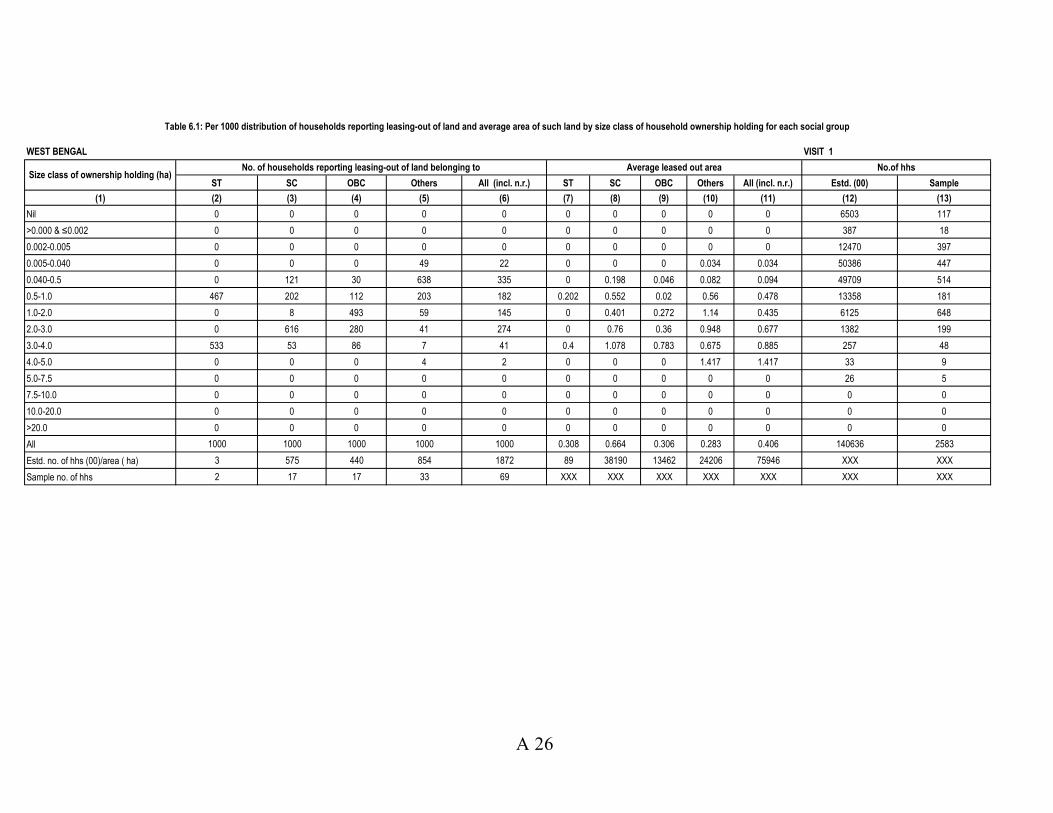
WEST BENGAL VISIT 1
ST SC OBC Others All (incl. n.r.) ST SC OBC Others All (incl. n.r.) Estd. (00) Sample
(1) (2) (3) (4) (5) (6) (7) (8) (9) (10) (11) (12) (13)
Nil 0 0 0 0 0 0 0 0 0 0 6503 117
>0.000 & ≤0.002 0 0 0 0 0 0 0 0 0 0 387 18
0.002-0.005 0 0 0 0 0 0 0 0 0 0 12470 397
0.005-0.040 0 0 0 49 22 0 0 0 0.034 0.034 50386 447
0.040-0.5 0 121 30 638 335 0 0.198 0.046 0.082 0.094 49709 514
0.5-1.0 467 202 112 203 182 0.202 0.552 0.02 0.56 0.478 13358 181
1.0-2.0 0 8 493 59 145 0 0.401 0.272 1.14 0.435 6125 648
2.0-3.0 0 616 280 41 274 0 0.76 0.36 0.948 0.677 1382 199
3.0-4.0 533 53 86 7 41 0.4 1.078 0.783 0.675 0.885 257 48
4.0-5.0 0 0 0 4 2 0 0 0 1.417 1.417 33 9
5.0-7.5 0 0 0 0 0 0 0 0 0 0 26 5
7.5-10.0 0 0 0 0 0 0 0 0 0 0 0 0
10.0-20.0 0 0 0 0 0 0 0 0 0 0 0 0
>20.0 0 0 0 0 0 0 0 0 0 0 0 0
All 1000 1000 1000 1000 1000 0.308 0.664 0.306 0.283 0.406 140636 2583
Estd. no. of hhs (00)/area ( ha) 3 575 440 854 1872 89 38190 13462 24206 75946 XXX XXX
Sample no. of hhs 2 17 17 33 69 XXX XXX XXX XXX XXX XXX XXX
Size class of ownership holding (ha)No. of households reporting leasing-out of land belonging to No.of hhsAverage leased out area
Table 6.1: Per 1000 distribution of households reporting leasing-out of land and average area of such land by size class of household ownership holding for each social group
A 26
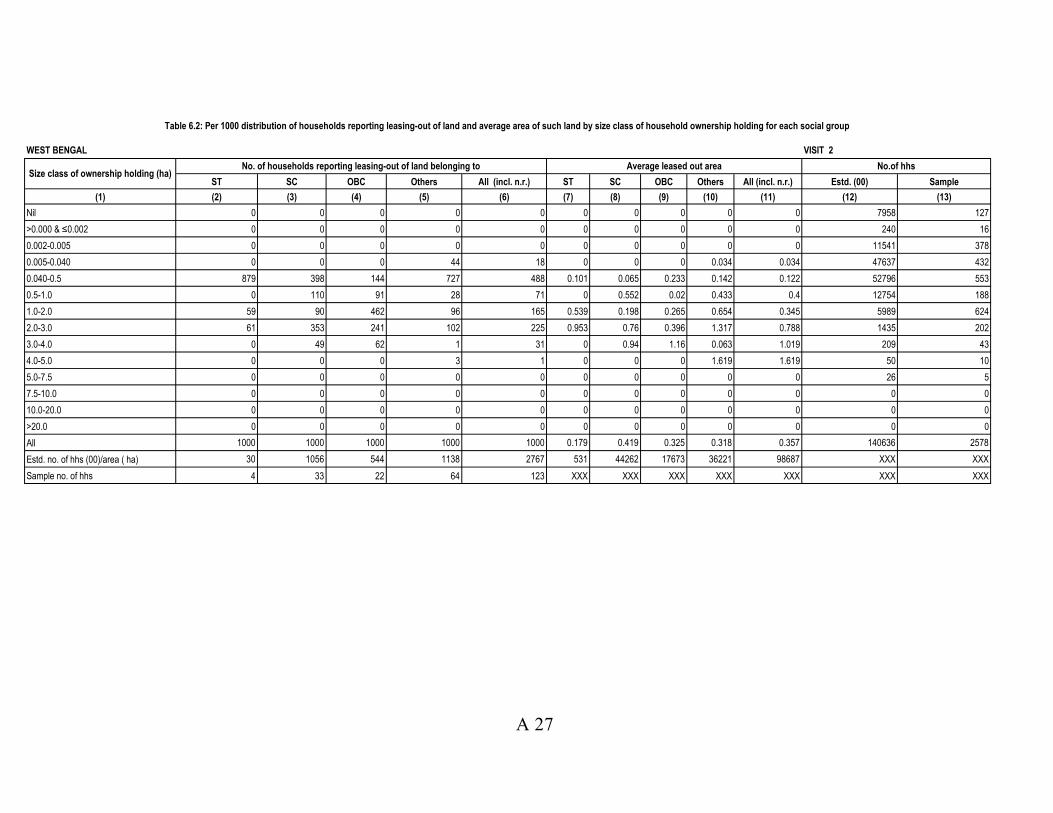
WEST BENGAL VISIT 2
ST SC OBC Others All (incl. n.r.) ST SC OBC Others All (incl. n.r.) Estd. (00) Sample
(1) (2) (3) (4) (5) (6) (7) (8) (9) (10) (11) (12) (13)
Nil 0 0 0 0 0 0 0 0 0 0 7958 127
>0.000 & ≤0.002 0 0 0 0 0 0 0 0 0 0 240 16
0.002-0.005 0 0 0 0 0 0 0 0 0 0 11541 378
0.005-0.040 0 0 0 44 18 0 0 0 0.034 0.034 47637 432
0.040-0.5 879 398 144 727 488 0.101 0.065 0.233 0.142 0.122 52796 553
0.5-1.0 0 110 91 28 71 0 0.552 0.02 0.433 0.4 12754 188
1.0-2.0 59 90 462 96 165 0.539 0.198 0.265 0.654 0.345 5989 624
2.0-3.0 61 353 241 102 225 0.953 0.76 0.396 1.317 0.788 1435 202
3.0-4.0 0 49 62 1 31 0 0.94 1.16 0.063 1.019 209 43
4.0-5.0 0 0 0 3 1 0 0 0 1.619 1.619 50 10
5.0-7.5 0 0 0 0 0 0 0 0 0 0 26 5
7.5-10.0 0 0 0 0 0 0 0 0 0 0 0 0
10.0-20.0 0 0 0 0 0 0 0 0 0 0 0 0
>20.0 0 0 0 0 0 0 0 0 0 0 0 0
All 1000 1000 1000 1000 1000 0.179 0.419 0.325 0.318 0.357 140636 2578
Estd. no. of hhs (00)/area ( ha) 30 1056 544 1138 2767 531 44262 17673 36221 98687 XXX XXX
Sample no. of hhs 4 33 22 64 123 XXX XXX XXX XXX XXX XXX XXX
Table 6.2: Per 1000 distribution of households reporting leasing-out of land and average area of such land by size class of household ownership holding for each social group
Size class of ownership holding (ha)No. of households reporting leasing-out of land belonging to Average leased out area No.of hhs
A 27

ST SC OBC Others All (incl n.r) ST SC OBC Others All (incl n.r) Estd. (00) Sample
(1) (2) (3) (4) (5) (6) (7) (7) (9) (10) (11) (12) (13)
Nil 21 90 0 184 125 0.322 0.029 0 0.037 0.04 6503 117
>0.000 & ≤0.002 0 0 0 1 0 0 0 0 0.002 0.002 387 18
0.002-0.005 0 26 0 8 14 0 0.605 0 0.198 0.485 12470 397
0.005-0.040 479 359 403 210 301 0.284 0.194 0.216 0.2 0.212 50386 447
0.040-0.5 494 422 425 521 478 0.739 0.383 0.171 0.167 0.3 49709 514
0.5-1.0 2 49 64 64 52 1.186 0.55 0.213 0.391 0.44 13358 181
1.0-2.0 3 51 92 6 26 0.386 0.377 0.504 0.28 0.386 6125 648
2.0-3.0 0 1 16 3 2 0 0.405 0.26 0.478 0.407 1382 199
3.0-4.0 0 1 0 2 2 0 1.62 0 2.385 2.135 257 48
4.0-5.0 0 0 0 0 0 0 0 0 0 0 33 9
5.0-7.5 0 0 0 0 0 0 0 0 0 0 26 5
7.5-10.0 0 0 0 0 0 0 0 0 0 0 0 0
10.0-20.0 0 0 0 0 0 0 0 0 0 0 0 0
>20.0 0 0 0 0 0 0 0 0 0 0 0 0
All 1000 1000 1000 1000 1000 1 0.299 0.224 0.171 0.256 140636 2583
Estd. no. of hhs (00)/ area (ha) 1081 3673 448 4905 10107 55300 109684 10052 83922 258959 XXX XXX
Sample no. of hhs 16 75 21 98 210 XXX XXX XXX XXX XXX XXX XXX
Table 7.1: Per 1000 distribution of households reporting leasing-in of land and average area of such land by size class of household ownership holding for each social group
WEST BENGAL VISIT 1
Size class of ownership holding (ha.) No. of households reporting leasing-in of land belonging to No. of hhdAverage leased in area per hhd
A 28

ST SC OBC Others All (incl n.r) ST SC OBC Others All (incl n.r) Estd. (00) Sample
(1) (2) (3) (4) (5) (6) (7) (7) (9) (10) (11) (12) (13)
Nil 21 90 0 184 125 0.322 0.029 0 0.037 0.04 6503 117
>0.000 & ≤0.002 0 0 0 1 0 0 0 0 0.002 0.002 387 18
0.002-0.005 0 26 0 8 14 0 0.605 0 0.198 0.485 12470 397
0.005-0.040 479 359 403 210 301 0.284 0.194 0.216 0.2 0.212 50386 447
0.040-0.5 494 422 425 521 478 0.739 0.383 0.171 0.167 0.3 49709 514
0.5-1.0 2 49 64 64 52 1.186 0.55 0.213 0.391 0.44 13358 181
1.0-2.0 3 51 92 6 26 0.386 0.377 0.504 0.28 0.386 6125 648
2.0-3.0 0 1 16 3 2 0 0.405 0.26 0.478 0.407 1382 199
3.0-4.0 0 1 0 2 2 0 1.62 0 2.385 2.135 257 48
4.0-5.0 0 0 0 0 0 0 0 0 0 0 33 9
5.0-7.5 0 0 0 0 0 0 0 0 0 0 26 5
7.5-10.0 0 0 0 0 0 0 0 0 0 0 0 0
10.0-20.0 0 0 0 0 0 0 0 0 0 0 0 0
>20.0 0 0 0 0 0 0 0 0 0 0 0 0
All 1000 1000 1000 1000 1000 1 0.299 0.224 0.171 0.256 140636 2583
Estd. no. of hhs (00)/ area (ha) 1081 3673 448 4905 10107 55300 109684 10052 83922 258959 XXX XXX
Sample no. of hhs 16 75 21 98 210 XXX XXX XXX XXX XXX XXX XXX
Table 7.2: Per 1000 distribution of households reporting leasing-in of land and average area of such land by size class of household ownership holding for each social group
WEST BENGAL VISIT 2
Size class of ownership holding (ha.) No. of households reporting leasing-in of land belonging to Average leased in area per hhd No. of hhd
A 29

Fixed money Fixed produce Share of produce Service contractShare of produce together
with other terms
Usufructuary
mortgage
From
relatives
Under other
termsAll (incl n.r) Estd. (00) Sample
(1) (2) (3) (4) (5) (6) (7) (8) (9) (10) (11) (12)
Nil 20 7 27 0 3 1 2 0 61 73012 1011
>0.000 & ≤0.002 0 0 0 0 0 0 0 0 0 23 4
0.002-0.005 0 0 0 0 0 0 0 0 0 164 2
0.005-0.040 0 8 42 0 0 0 0 0 50 4001 38
0.040-0.5 10 12 57 0 2 0 0 0 84 43769 451
0.5-1.0 4 9 30 0 0 0 1 0 44 12791 240
1.0-2.0 3 3 31 0 0 5 0 0 43 5253 594
2.0-3.0 7 1 9 0 0 0 1 0 18 1385 193
3.0-4.0 27 56 0 0 0 0 0 0 84 189 39
4.0-5.0 0 0 0 0 0 0 0 0 0 22 6
5.0-7.5 0 0 0 0 0 0 0 0 0 26 5
7.5-10.0 0 0 0 0 0 0 0 0 0 0 0
10.0-20.0 0 0 0 0 0 0 0 0 0 0 0
>20.0 0 0 0 0 0 0 0 0 0 0 0
All 14 9 37 0 2 0 1 0 65 140636 2583
Estd. no. of hhs (00) 2009 1218 5205 0 306 68 155 0 9108 XXX XXX
Sample no. of hhs 58 50 78 0 5 3 4 0 199 XXX XXX
Table 8.1: Number of households reporting leasing-in of land (excluding homestead) per 1000 households by terms of lease for each size class of household ownership holding
WEST BENGAL VISIT1
Size class of ownership
holding (ha)
Number per 1000 of households by terms of lease No. of hhs
A 30
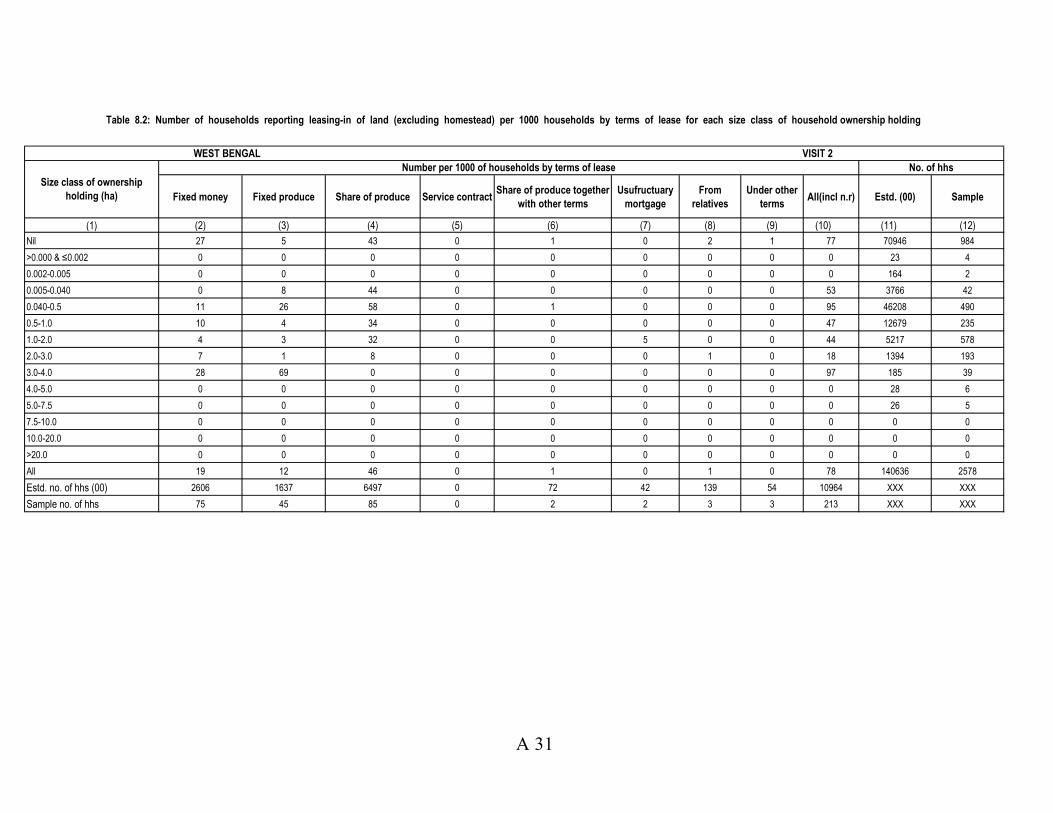
Fixed money Fixed produce Share of produce Service contractShare of produce together
with other terms
Usufructuary
mortgage
From
relatives
Under other
termsAll(incl n.r) Estd. (00) Sample
(1) (2) (3) (4) (5) (6) (7) (8) (9) (10) (11) (12)
Nil 27 5 43 0 1 0 2 1 77 70946 984
>0.000 & ≤0.002 0 0 0 0 0 0 0 0 0 23 4
0.002-0.005 0 0 0 0 0 0 0 0 0 164 2
0.005-0.040 0 8 44 0 0 0 0 0 53 3766 42
0.040-0.5 11 26 58 0 1 0 0 0 95 46208 490
0.5-1.0 10 4 34 0 0 0 0 0 47 12679 235
1.0-2.0 4 3 32 0 0 5 0 0 44 5217 578
2.0-3.0 7 1 8 0 0 0 1 0 18 1394 193
3.0-4.0 28 69 0 0 0 0 0 0 97 185 39
4.0-5.0 0 0 0 0 0 0 0 0 0 28 6
5.0-7.5 0 0 0 0 0 0 0 0 0 26 5
7.5-10.0 0 0 0 0 0 0 0 0 0 0 0
10.0-20.0 0 0 0 0 0 0 0 0 0 0 0
>20.0 0 0 0 0 0 0 0 0 0 0 0
All 19 12 46 0 1 0 1 0 78 140636 2578
Estd. no. of hhs (00) 2606 1637 6497 0 72 42 139 54 10964 XXX XXX
Sample no. of hhs 75 45 85 0 2 2 3 3 213 XXX XXX
Table 8.2: Number of households reporting leasing-in of land (excluding homestead) per 1000 households by terms of lease for each size class of household ownership holding
WEST BENGAL VISIT 2
Size class of ownership
holding (ha)
Number per 1000 of households by terms of lease No. of hhs
A 31

Fixed moneyFixed
produce
Share of
produce
Service
contract
Share of
produce
together with
other terms
Usu
fructuary
mortgage
Relatives
under no
specific
terms
Other terms
Any term of
lease (incl
n.r.)
Estd. (00) Sample Estd. (00) Sample
(1) (2) (3) (4) (5) (6) (7) (8) (9) (10) (11) (12) (13) (14) (15) (16)
nil 0 0 0 0 0 0 0 0 0 0 0 0 0 73012 1011
>0.000& ≤0.002 0 0 0 0 0 0 0 0 0 0 0 0 0 23 4
0.002-0.005 0 0 0 0 0 0 0 0 0 0 0 0 0 164 2
0.005-0.040 100 0 0 0 0 0 0 0 100 19 255 75 2 4001 38
0.040-0.5 43 51 6 0 0 0 0 0 100 14 5770 815 15 43769 451
0.5-1.0 21 52 26 0 0 0 0 0 100 27 16246 1504 31 12791 240
1.0-2.0 7 43 49 0 0 0 1 0 100 52 11962 478 54 5253 594
2.0-3.0 3 3 93 0 0 0 0 0 100 399 38832 1314 45 1385 193
3.0-4.0 95 3 3 0 0 0 0 0 100 166 2442 48 14 189 39
4.0-5.0 100 0 0 0 0 0 0 0 100 143 439 16 5 22 6
5.0-7.5 0 0 0 0 0 0 0 0 0 0 0 0 0 26 5
7.5-10.0 0 0 0 0 0 0 0 0 0 0 0 0 0 0 0
10.0-20.0 0 0 0 0 0 0 0 0 0 0 0 0 0 0 0
>20.0 0 0 0 0 0 0 0 0 0 0 0 0 0 0 0
All 15 24 61 0 0 0 0 0 100 13 75946 4250 166 140636 2583
Estd. no of plots (00) 827 1529 1881 0 0 4 5 3 4250 XXX XXX XXX XXX XXX XXX
Sample no. of plots 54 47 53 0 0 6 2 4 166 XXX XXX XXX XXX XXX XXX
Table 9.1 : Percentage distribution of leased out land (excluding homestead) by terms of lease for each size class of household ownership holding
WEST BENGAL VISIT 1
Size class of
ownership holding (ha)
Percentage distribution of leased out land with terms of leaseNo. of hhs
reporting
leased out
land per
1000 hhs.
Estd. area
leased out
(ha)
No. of plots leased out No of HHs
A 32

Fixed moneyFixed
produce
Share of
produce
Service
contract
Share of
produce
together with
other terms
Usu
fructuary
mortgage
Relatives
under no
specific
terms
Other terms
Any term of
lease (incl
n.r.)
Estd. (00) Sample Estd. (00) Sample
(1) (2) (3) (4) (5) (6) (7) (8) (9) (10) (11) (12) (13) (14) (15) (16)
nil 0 0 0 0 0 0 0 0 0 0 0 0 0 70946 984
>0.000& ≤0.002 0 0 0 0 0 0 0 0 0 0 0 0 0 23 4
0.002-0.005 0 0 0 0 0 0 0 0 0 0 0 0 0 164 2
0.005-0.040 100 0 0 0 0 0 0 0 100 22 283 83 2 3766 42
0.040-0.5 28 27 18 16 0 0 0 12 100 29 16414 1876 27 46208 490
0.5-1.0 38 2 59 0 0 0 0 1 100 19 9530 660 25 12679 235
1.0-2.0 12 24 61 0 0 0 1 2 100 84 14455 754 105 5217 578
2.0-3.0 5 4 67 0 0 0 0 24 100 450 51410 1611 84 1394 193
3.0-4.0 48 20 27 0 0 0 0 5 100 329 6093 120 25 185 39
4.0-5.0 88 0 12 0 0 0 0 0 100 110 502 19 6 28 6
5.0-7.5 0 0 0 0 0 0 0 0 0 0 0 0 0 26 5
7.5-10.0 0 0 0 0 0 0 0 0 0 0 0 0 0 0 0
10.0-20.0 0 0 0 0 0 0 0 0 0 0 0 0 0 0 0
>20.0 0 0 0 0 0 0 0 0 0 0 0 0 0 0 0
All 16 12 54 3 0 0 0 15 100 20 98687 5123 274 140636 2578
Estd. no of plots (00) 993 584 2411 387 0 4 5 738 5123 XXX XXX XXX XXX XXX XXX
Sample no. of plots 77 92 63 1 0 6 2 31 274 XXX XXX XXX XXX XXX XXX
Table 9.2 : Percentage distribution of leased out land (excluding homestead) by terms of lease for each size class of household ownership holding
WEST BENGAL VISIT 2
Size class of
ownership holding (ha)
Percentage distribution of leased out land with terms of leaseNo. of hhs
reporting
leased out
land per
1000 hhs.
Estd. area
leased out
(ha)
No. of plots leased out No of HHs
A 33
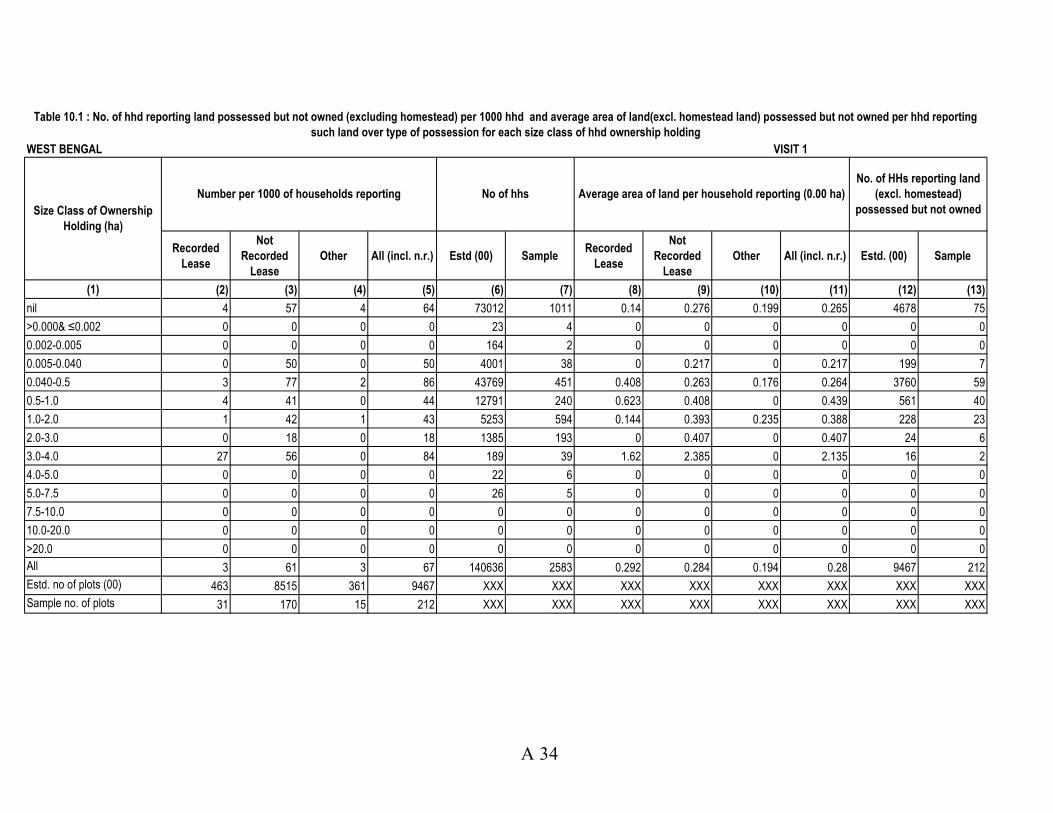
Recorded
Lease
Not
Recorded
Lease
Other All (incl. n.r.) Estd (00) SampleRecorded
Lease
Not
Recorded
Lease
Other All (incl. n.r.) Estd. (00) Sample
(1) (2) (3) (4) (5) (6) (7) (8) (9) (10) (11) (12) (13)
nil 4 57 4 64 73012 1011 0.14 0.276 0.199 0.265 4678 75
>0.000& ≤0.002 0 0 0 0 23 4 0 0 0 0 0 0
0.002-0.005 0 0 0 0 164 2 0 0 0 0 0 0
0.005-0.040 0 50 0 50 4001 38 0 0.217 0 0.217 199 7
0.040-0.5 3 77 2 86 43769 451 0.408 0.263 0.176 0.264 3760 59
0.5-1.0 4 41 0 44 12791 240 0.623 0.408 0 0.439 561 40
1.0-2.0 1 42 1 43 5253 594 0.144 0.393 0.235 0.388 228 23
2.0-3.0 0 18 0 18 1385 193 0 0.407 0 0.407 24 6
3.0-4.0 27 56 0 84 189 39 1.62 2.385 0 2.135 16 2
4.0-5.0 0 0 0 0 22 6 0 0 0 0 0 0
5.0-7.5 0 0 0 0 26 5 0 0 0 0 0 0
7.5-10.0 0 0 0 0 0 0 0 0 0 0 0 0
10.0-20.0 0 0 0 0 0 0 0 0 0 0 0 0
>20.0 0 0 0 0 0 0 0 0 0 0 0 0
All 3 61 3 67 140636 2583 0.292 0.284 0.194 0.28 9467 212
Estd. no of plots (00) 463 8515 361 9467 XXX XXX XXX XXX XXX XXX XXX XXX
Sample no. of plots 31 170 15 212 XXX XXX XXX XXX XXX XXX XXX XXX
Table 10.1 : No. of hhd reporting land possessed but not owned (excluding homestead) per 1000 hhd and average area of land(excl. homestead land) possessed but not owned per hhd reporting
such land over type of possession for each size class of hhd ownership holding
WEST BENGAL VISIT 1
Size Class of Ownership
Holding (ha)
Number per 1000 of households reporting Average area of land per household reporting (0.00 ha)No of hhs
No. of HHs reporting land
(excl. homestead)
possessed but not owned
A 34

Recorded
Lease
Not
Recorded
Lease
Other All (incl. n.r.) Estd (00) SampleRecorded
Lease
Not
Recorded
Lease
Other All (incl. n.r.) Estd. (00) Sample
(1) (2) (3) (4) (5) (6) (7) (8) (9) (10) (11) (12) (13)
nil 3 74 4 82 70946 984 0.119 0.253 0.163 0.241 5793 94
>0.000& ≤0.002 0 0 0 0 23 4 0 0 0 0 0 0
0.002-0.005 0 0 0 0 164 2 0 0 0 0 0 0
0.005-0.040 0 53 0 53 3766 42 0 0.215 0 0.215 199 7
0.040-0.5 4 90 2 97 46208 490 0.319 0.258 0.176 0.256 4503 60
0.5-1.0 2 45 0 47 12679 235 0.455 0.396 0 0.398 595 34
1.0-2.0 0 44 2 46 5217 578 0.068 0.345 0.066 0.331 241 26
2.0-3.0 0 16 0 18 1394 193 0 0.398 0 0.399 25 6
3.0-4.0 28 69 0 97 185 39 1.62 1.91 0 1.826 18 3
4.0-5.0 0 0 0 0 28 6 0 0 0 0 0 0
5.0-7.5 0 0 0 0 26 5 0 0 0 0 0 0
7.5-10.0 0 0 0 0 0 0 0 0 0 0 0 0
10.0-20.0 0 0 0 0 0 0 0 0 0 0 0 0
>20.0 0 0 0 0 0 0 0 0 0 0 0 0
All 3 74 3 81 140636 2578 0.237 0.267 0.164 0.259 11375 230
Estd. no of plots (00) 458 10395 414 11375 XXX XXX XXX XXX XXX XXX XXX XXX
Sample no. of plots 22 190 19 230 XXX XXX XXX XXX XXX XXX XXX XXX
Table 10.2 : No. of hhd reporting land possessed but not owned (excluding homestead) per 1000 hhd and average area of land(excl. homestead land) possessed but not owned per hhd reporting
such land over type of possession for each size class of hhd ownership holding
WEST BENGAL VISIT 2
Size Class of Ownership
Holding (ha)
Number per 1000 of households reporting No of hhs Average area of land per household reporting (0.00 ha)
No. of HHs reporting land
(excl. homestead)
possessed but not owned
A 35

For
cultivationOther uses Not known All (incl n.r.) Estd (00) Sample Estd(00) Sample
(1) (2) (3) (4) (5) (6) (7) (8) (9) (10) (11)
nil 0 0 0 0 0 0 0 0 0 0
>0.000& ≤0.002 0 0 0 0 0 0 0 0 0 0
0.002-0.005 0 0 0 0 0 0 0 0 0 0
0.005-0.040 55 45 0 100 255 1 75 2 75 2
0.040-0.5 100 0 0 100 5770 1.4 815 15 594 11
0.5-1.0 100 0 0 100 16246 4.8 1504 31 341 10
1.0-2.0 98 2 0 100 11962 2.2 478 54 276 21
2.0-3.0 100 0 0 100 38832 2.4 1314 45 553 19
3.0-4.0 20 80 0 100 2442 1.5 48 14 31 5
4.0-5.0 19 81 0 100 439 10 16 5 3 1
5.0-7.5 0 0 0 0 0 0 0 0 0 0
7.5-10.0 0 0 0 0 0 0 0 0 0 0
10.0-20.0 0 0 0 0 0 0 0 0 0 0
>20.0 0 0 0 0 0 0 0 0 0 0
All 96 3 0 100 75946 2.4 4250 166 1872 69
Estd. no of plots (00) 4066 183 1 4250 XXX XXX XXX XXX XXX XXX
Sample no. of plots 151 14 1 166 XXX XXX XXX XXX XXX XXX
Table 11.1: Percentage distribution of area of land leased out by use of lessee household for each size class of household ownership holding
WEST BENGAL VISIT 1
Size class of ownership
holding (ha)
Percentage distribution of area of land used by lessee
householdEstd. area of
leased out
land (ha)
Average no.
of lessee hh
(0.0)
No. of hhs reporting
leasing out of landNo. of plots leased out
A 36

For
cultivationOther uses Not known All (incl n.r.) Estd (00) Sample Estd(00) Sample
(1) (2) (3) (4) (5) (6) (7) (8) (9) (10) (11)
nil 0 0 0 0 0 0 0 0 0 0
>0.000& ≤0.002 0 0 0 0 0 0 0 0 0 0
0.002-0.005 0 0 0 0 0 0 0 0 0 0
0.005-0.040 60 40 0 100 283 1 83 2 83 2
0.040-0.5 98 2 0 100 16414 1.4 1876 27 1317 19
0.5-1.0 98 1 1 100 9530 3.3 660 25 235 12
1.0-2.0 99 1 0 100 14455 2.2 754 105 440 46
2.0-3.0 96 0 4 100 51410 2.7 1611 84 628 33
3.0-4.0 63 37 0 100 6093 2.2 120 25 61 10
4.0-5.0 29 71 0 100 502 10 19 6 3 1
5.0-7.5 0 0 0 0 0 0 0 0 0 0
7.5-10.0 0 0 0 0 0 0 0 0 0 0
10.0-20.0 0 0 0 0 0 0 0 0 0 0
>20.0 0 0 0 0 0 0 0 0 0 0
All 94 3 2 100 98687 2 5123 274 123
Estd. no of plots (00) 4718 272 132 5123 XXX XXX XXX XXX XXX XXX
Sample no. of plots 244 18 10 274 XXX XXX XXX XXX XXX XXX
Table 11.2: Percentage distribution of area of land leased out by use of lessee household for each size class of household ownership holding
WEST BENGAL VISIT 2
Size class of ownership
holding (ha)
Percentage distribution of area of land used by lessee
householdEstd. area of
leased out
land (ha)
Average no.
of lessee hh
(0.0)
No. of plots leased outNo. of hhs reporting
leasing out of land
A 37

No. per
1000
of
holdings
Percentage of total
area of the opr.
holdings of the hhs
who operated jointly
to total area of opr.
holdings
Avg.no. of
permanent
attached
frame
worker per
hh opr
Area
operated
(ha)
Area of hh
opr. holding
(ha)
No. of
plots (00)
No. of hh
opr.
holding
(00)
No. of
plots
No. of hh
opr.
holdings
(1) (2) (3) (4) (5) (6) (7) (8) (9) (10) (11) (12) (13) (14) (15)
nil 0 0 0 0 0 0 0 0 0 0 0 0 0 0
>0.000& ≤0.002 2 0.002 0.002 0.001 1 0 0 0 1 2 22 11 2 1
0.002-0.005 56 0.004 0.003 0.001 1 0 0 0 23 144 725 360 67 33
0.005-0.040 256 0.024 0.01 0.009 1 0 0 0 1410 4029 3308 1654 56 28
0.040-0.5 433 0.186 0.146 0.168 3 0 0 0 47000 51992 10100 2798 232 60
0.5-1.0 56 0.697 0.658 0.678 6 0 0 0 24463 25131 2463 361 106 17
1.0-2.0 177 1.251 0.852 1.212 6 48 6 0 138686 143145 9236 1144 440 56
2.0-3.0 19 2.406 2.388 2.325 11 0 0 0 28069 29043 1654 121 195 21
3.0-4.0 1 3.448 3.448 2.946 5 0 0 0 1451 1698 32 5 20 3
4.0-5.0 0 4.536 4.536 4.487 11 0 0 0 740 749 20 2 23 2
5.0-7.5 0 0 0 0 0 0 0 0 0 0 0 0 0 0
7.5-10.0 0 0 0 0 0 0 0 0 0 0 0 0 0 0
10.0-20.0 0 0 0 0 0 0 0 0 0 0 0 0 0 0
>20.0 0 0 0 0 0 0 0 0 0 0 0 0 0 0
All 1000 0.396 0.302 0.375 3 8 3 0 241843 255933 27561 6456 1141 221
WEST BENGAL SOCIAL GROUP: SCHEDULE TRIBE VISIT 1
Table 12.1: Number per 1000 of opr. holdings, avg. area per opr. holding , avg. area owned and possessed per opr. holding, avg. area operated per holding, no. of parcels per holding, joint holdings
per 1000 of holdings, percentage of total area of hh opr. holdings of those hhs who operated jointly, to total area of opr. holdings, avg. no. of permanent attached farm workers per household opr.
holding by size class of household operational holding
Avg. area
owned and
possessed
per opr.
holding
(0.00 ha)
Avg. area
operated
(used for agri.
activities) per
holding (0.00
ha)
No. of
parcels per
holding
Estimated
Avg. area
per opr.
holding
(0.00 ha)
SampleJoint Holdings
Size Class of
Operational
Holding (ha)
No. per
1000 of
opr.
holdings
A 38
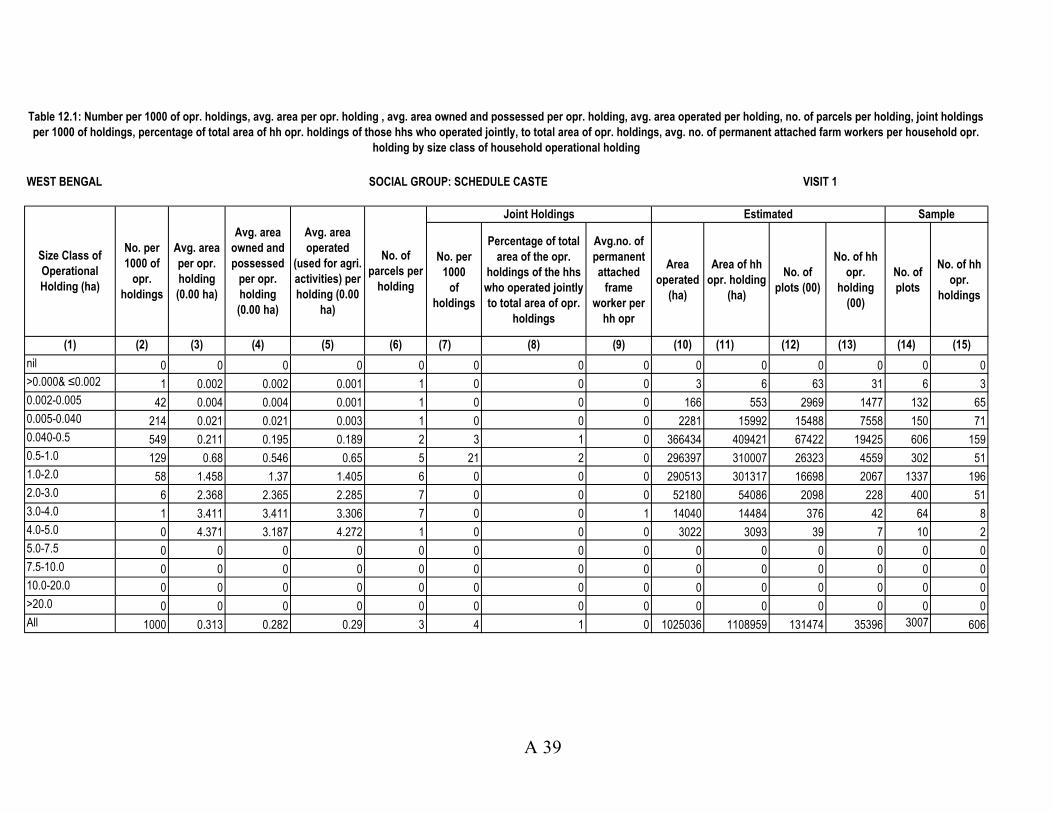
No. per
1000
of
holdings
Percentage of total
area of the opr.
holdings of the hhs
who operated jointly
to total area of opr.
holdings
Avg.no. of
permanent
attached
frame
worker per
hh opr
Area
operated
(ha)
Area of hh
opr. holding
(ha)
No. of
plots (00)
No. of hh
opr.
holding
(00)
No. of
plots
No. of hh
opr.
holdings
(1) (2) (3) (4) (5) (6) (7) (8) (9) (10) (11) (12) (13) (14) (15)
nil 0 0 0 0 0 0 0 0 0 0 0 0 0 0
>0.000& ≤0.002 1 0.002 0.002 0.001 1 0 0 0 3 6 63 31 6 3
0.002-0.005 42 0.004 0.004 0.001 1 0 0 0 166 553 2969 1477 132 65
0.005-0.040 214 0.021 0.021 0.003 1 0 0 0 2281 15992 15488 7558 150 71
0.040-0.5 549 0.211 0.195 0.189 2 3 1 0 366434 409421 67422 19425 606 159
0.5-1.0 129 0.68 0.546 0.65 5 21 2 0 296397 310007 26323 4559 302 51
1.0-2.0 58 1.458 1.37 1.405 6 0 0 0 290513 301317 16698 2067 1337 196
2.0-3.0 6 2.368 2.365 2.285 7 0 0 0 52180 54086 2098 228 400 51
3.0-4.0 1 3.411 3.411 3.306 7 0 0 1 14040 14484 376 42 64 8
4.0-5.0 0 4.371 3.187 4.272 1 0 0 0 3022 3093 39 7 10 2
5.0-7.5 0 0 0 0 0 0 0 0 0 0 0 0 0 0
7.5-10.0 0 0 0 0 0 0 0 0 0 0 0 0 0 0
10.0-20.0 0 0 0 0 0 0 0 0 0 0 0 0 0 0
>20.0 0 0 0 0 0 0 0 0 0 0 0 0 0 0
All 1000 0.313 0.282 0.29 3 4 1 0 1025036 1108959 131474 35396 3007 606
No. of
parcels per
holding
Estimated
WEST BENGAL SOCIAL GROUP: SCHEDULE CASTE VISIT 1
Size Class of
Operational
Holding (ha)
No. per
1000 of
opr.
holdings
Avg. area
per opr.
holding
(0.00 ha)
Avg. area
owned and
possessed
per opr.
holding
(0.00 ha)
Avg. area
operated
(used for agri.
activities) per
holding (0.00
ha)
Table 12.1: Number per 1000 of opr. holdings, avg. area per opr. holding , avg. area owned and possessed per opr. holding, avg. area operated per holding, no. of parcels per holding, joint holdings
per 1000 of holdings, percentage of total area of hh opr. holdings of those hhs who operated jointly, to total area of opr. holdings, avg. no. of permanent attached farm workers per household opr.
holding by size class of household operational holding
Joint Holdings Sample
A 39

No. per
1000
of
holdings
Percentage of total
area of the opr.
holdings of the hhs
who operated jointly
to total area of opr.
holdings
Avg.no. of
permanent
attached
frame
worker per
hh opr
Area
operated
(ha)
Area of hh
opr. holding
(ha)
No. of
plots (00)
No. of hh
opr.
holding
(00)
No. of
plots
No. of hh
opr.
holdings
(1) (2) (3) (4) (5) (6) (7) (8) (9) (10) (11) (12) (13) (14) (15)
nil 0 0 0 0 0 0 0 0 0 0 0 0 0 0
>0.000& ≤0.002 0 0 0 0 0 0 0 0 0 0 0 0 0 0
0.002-0.005 9 0.004 0.004 0.001 1 0 0 0 11 43 216 108 20 10
0.005-0.040 155 0.013 0.012 0.002 1 0 0 0 327 2558 3797 1898 28 14
0.040-0.5 439 0.221 0.208 0.203 4 0 0 0 109089 118853 27011 5376 190 42
0.5-1.0 239 0.725 0.716 0.695 5 46 6 0 203093 211977 19135 2923 239 33
1.0-2.0 132 1.45 1.448 1.431 8 3 0 0 230716 233624 16061 1612 844 91
2.0-3.0 23 2.315 2.241 2.277 9 0 0 0 65061 66138 3093 286 413 40
3.0-4.0 2 3.54 3.54 3.464 8 0 0 0 9049 9248 238 26 50 6
4.0-5.0 0 0 0 0 0 0 0 0 0 0 0 0 0 0
5.0-7.5 0 5.512 5.512 3.94 5 0 0 0 2014 2818 31 5 6 1
7.5-10.0 0 0 0 0 0 0 0 0 0 0 0 0 0 0
10.0-20.0 0 0 0 0 0 0 0 0 0 0 0 0 0 0
>20.0 0 0 0 0 0 0 0 0 0 0 0 0 0 0
All 1000 0.527 0.517 0.506 4 11 2 0 619359 645259 69581 12234 1790 237
Table 12.1: Number per 1000 of opr. holdings, avg. area per opr. holding , avg. area owned and possessed per opr. holding, avg. area operated per holding, no. of parcels per holding, joint holdings
per 1000 of holdings, percentage of total area of hh opr. holdings of those hhs who operated jointly, to total area of opr. holdings, avg. no. of permanent attached farm workers per household opr.
holding by size class of household operational holding
WEST BENGAL SOCIAL GROUP: OTHER BACKWARD CLASS VISIT 1
Size Class of
Operational
Holding (ha)
No. per
1000 of
opr.
holdings
Avg. area
per opr.
holding
(0.00 ha)
Avg. area
owned and
possessed
per opr.
holding
(0.00 ha)
Avg. area
operated
(used for agri.
activities) per
holding (0.00
ha)
No. of
parcels per
holding
EstimatedJoint Holdings Sample
A 40

No. per
1000
of
holdings
Percentage of total
area of the opr.
holdings of the hhs
who operated jointly
to total area of opr.
holdings
Avg.no. of
permanent
attached
frame
worker per
hh opr
Area
operated
(ha)
Area of hh
opr. holding
(ha)
No. of
plots (00)
No. of hh
opr.
holding
(00)
No. of
plots
No. of hh
opr.
holdings
(1) (2) (3) (4) (5) (6) (7) (8) (9) (10) (11) (12) (13) (14) (15)
nil 0 0 0 0 0 0 0 0 0 0 0 0 0 0
>0.000& ≤0.002 0 0 0 0 0 0 0 0 0 0 0 0 0 0
0.002-0.005 34 0.004 0.004 0 1 0 0 0 66 671 3282 1606 92 44
0.005-0.040 288 0.02 0.019 0.003 1 0 0 0 3676 26948 27765 13428 223 104
0.040-0.5 472 0.239 0.214 0.214 3 6 0 0 469590 525230 81758 21986 918 243
0.5-1.0 140 0.715 0.693 0.688 4 0 0 0 449217 467171 36383 6530 438 73
1.0-2.0 54 1.296 1.24 1.247 6 0 0 0 311638 323915 19232 2498 2969 355
2.0-3.0 8 2.503 2.499 2.451 9 0 0 1 95172 97216 3880 388 928 88
3.0-4.0 2 3.307 3.224 3.271 10 0 0 0 36865 37272 1230 113 306 27
4.0-5.0 1 4.187 3.849 4.138 10 0 0 0 11697 11837 321 28 74 6
5.0-7.5 1 5.886 5.075 5.855 10 0 0 1 18339 18437 769 31 97 5
7.5-10.0 0 0 0 0 0 0 0 0 0 0 0 0 0 0
10.0-20.0 0 0 0 0 0 0 0 0 0 0 0 0 0 0
>20.0 0 0 0 0 0 0 0 0 0 0 0 0 0 0
All 1000 0.324 0.305 0.3 3 3 0 0 1396260 1508698 174621 46609 6045 945
Table 12.1: Number per 1000 of opr. holdings, avg. area per opr. holding , avg. area owned and possessed per opr. holding, avg. area operated per holding, no. of parcels per holding, joint holdings
per 1000 of holdings, percentage of total area of hh opr. holdings of those hhs who operated jointly, to total area of opr. holdings, avg. no. of permanent attached farm workers per household opr.
holding by size class of household operational holding
Avg. area
operated
(used for agri.
activities) per
holding (0.00
ha)
No. of
parcels per
holding
EstimatedJoint Holdings Sample
WEST BENGAL SOCIAL GROUP: OTHERS VISIT 1
Size Class of
Operational
Holding (ha)
No. per
1000 of
opr.
holdings
Avg. area
per opr.
holding
(0.00 ha)
Avg. area
owned and
possessed
per opr.
holding
(0.00 ha)
A 41

No. per
1000
of
holdings
Percentage of total
area of the opr.
holdings of the hhs
who operated jointly
to total area of opr.
holdings
Avg.no. of
permanent
attached
frame
worker per
hh opr
Area
operated
(ha)
Area of hh
opr. holding
(ha)
No. of
plots (00)
No. of hh
opr.
holding
(00)
No. of
plots
No. of hh
opr.
holdings
(1) (2) (3) (4) (5) (6) (7) (8) (9) (10) (11) (12) (13) (14) (15)
nil 0 0 0 0 0 0 0 0 0 0 0 0 0 0
>0.000& ≤0.002 0 0.002 0.002 0.001 1 0 0 0 4 9 85 43 8 4
0.002-0.005 35 0.004 0.004 0.001 1 0 0 0 266 1411 7192 3552 311 152
0.005-0.040 244 0.02 0.018 0.003 1 0 0 0 7694 49528 50357 24538 457 217
0.040-0.5 492 0.223 0.202 0.2 3 4 0 0 992112 1105497 186291 49585 1946 504
0.5-1.0 143 0.706 0.651 0.677 5 16 2 0 973170 1014286 84304 14373 1085 174
1.0-2.0 73 1.369 1.262 1.327 7 8 1 0 971553 1002001 61228 7321 5590 698
2.0-3.0 10 2.409 2.384 2.35 9 0 0 0 240482 246482 10725 1023 1936 200
3.0-4.0 2 3.367 3.317 3.297 9 0 0 0 61404 62703 1876 186 440 44
4.0-5.0 0 4.238 3.753 4.179 9 0 0 0 15459 15678 379 37 107 10
5.0-7.5 0 5.834 5.136 5.586 9 0 0 1 20353 21255 800 36 103 6
7.5-10.0 0 0 0 0 0 0 0 0 0 0 0 0 0 0
10.0-20.0 0 0 0 0 0 0 0 0 0 0 0 0 0 0
>20.0 0 0 0 0 0 0 0 0 0 0 0 0 0 0
All 1000 0.349 0.322 0.326 3 5 1 0 3282498 3518849 403237 100695 11983 2009
WEST BENGAL SOCIAL GROUP: ALL VISIT 1
Size Class of
Operational
Holding (ha)
No. per
1000 of
opr.
holdings
Avg. area
per opr.
holding
(0.00 ha)
Avg. area
owned and
possessed
per opr.
holding
(0.00 ha)
Avg. area
operated
(used for agri.
activities) per
holding (0.00
ha)
No. of
parcels per
holding
EstimatedJoint Holdings Sample
Table 12.1: Number per 1000 of opr. holdings, avg. area per opr. holding , avg. area owned and possessed per opr. holding, avg. area operated per holding, no. of parcels per holding, joint holdings
per 1000 of holdings, percentage of total area of hh opr. holdings of those hhs who operated jointly, to total area of opr. holdings, avg. no. of permanent attached farm workers per household opr.
holding by size class of household operational holding
A 42

No. per
1000
of
holdings
Percentage of total
area of the opr.
holdings of the hhs
who operated jointly
to total area of opr.
holdings
Avg.no. of
permanent
attached
frame
worker per
hh opr
Area
operated
(ha)
Area of hh
opr. holding
(ha)
No. of
plots (00)
No. of hh
opr.
holding
(00)
No. of
plots
No. of hh
opr.
holdings
(1) (2) (3) (4) (5) (6) (7) (8) (9) (10) (11) (12) (13) (14) (15)
nil 0 0 0 0 0 0 0 0 0 0 0 0 0 0
>0.000& ≤0.002 2 0.002 0.002 0.001 1 0 0 0 1 2 22 11 2 1
0.002-0.005 50 0.004 0.003 0.001 1 0 0 0 32 143 714 355 57 28
0.005-0.040 332 0.025 0.01 0.012 1 0 0 0 2765 5828 4739 2343 68 33
0.040-0.5 390 0.197 0.157 0.117 2 0 0 0 32248 54276 10161 2758 233 59
0.5-1.0 51 0.696 0.658 0.307 4 0 0 0 11133 25240 2518 362 126 19
1.0-2.0 157 1.247 0.869 0.729 5 0 0 0 81165 138824 9103 1113 436 55
2.0-3.0 17 2.403 2.403 1.053 10 0 0 0 12394 28278 1647 118 190 19
3.0-4.0 1 3.573 3.573 1 3 0 0 0 492 1760 37 5 23 3
4.0-5.0 0 4.536 4.536 2.412 8 0 0 0 398 749 20 2 23 2
5.0-7.5 0 0 0 0 0 0 0 0 0 0 0 0 0 0
7.5-10.0 0 0 0 0 0 0 0 0 0 0 0 0 0 0
10.0-20.0 0 0 0 0 0 0 0 0 0 0 0 0 0 0
>20.0 0 0 0 0 0 0 0 0 0 0 0 0 0 0
All 1000 0.361 0.279 0.199 2 0 0 0 140628 255100 28960 7067 1158 219
Table 12.2: Number per 1000 of opr. holdings, avg. area per opr. holding , avg. area owned and possessed per opr. holding, avg. area operated per holding, no. of parcels per holding, joint holdings
per 1000 of holdings, percentage of total area of hh opr. holdings of those hhs who operated jointly, to total area of opr. holdings, avg. no. of permanent attached farm workers per household opr.
holding by size class of household operational holding
WEST BENGAL SOCIAL GROUP: SCHEDULE TRIBE VISIT 2
Size Class of
Operational
Holding (ha)
No. per
1000 of
opr.
holdings
Avg. area
per opr.
holding
(0.00 ha)
Avg. area
owned and
possessed
per opr.
holding
(0.00 ha)
Avg. area
operated
(used for agri.
activities) per
holding (0.00
ha)
No. of
parcels per
holding
Joint Holdings Estimated Sample
A 43

No. per
1000
of
holdings
Percentage of total
area of the opr.
holdings of the hhs
who operated jointly
to total area of opr.
holdings
Avg.no. of
permanent
attached
frame
worker per
hh opr
Area
operated
(ha)
Area of hh
opr. holding
(ha)
No. of
plots (00)
No. of hh
opr.
holding
(00)
No. of
plots
No. of hh
opr.
holdings
(1) (2) (3) (4) (5) (6) (7) (8) (9) (10) (11) (12) (13) (14) (15)
nil 0 0 0 0 0 0 0 0 0 0 0 0 0 0
>0.000& ≤0.002 1 0.002 0.002 0.001 1 0 0 0 3 7 71 36 6 3
0.002-0.005 35 0.004 0.004 0.001 1 0 0 0 151 465 2533 1262 115 57
0.005-0.040 219 0.021 0.02 0.004 1 0 0 0 3212 16411 16316 7898 175 75
0.040-0.5 531 0.204 0.179 0.165 2 0 0 0 315008 390898 66479 19119 752 191
0.5-1.0 154 0.672 0.509 0.508 4 17 2 0 281639 372570 30523 5545 319 56
1.0-2.0 53 1.49 1.407 0.849 7 0 0 0 160778 282216 16305 1894 1285 180
2.0-3.0 7 2.379 2.379 1.62 7 0 0 0 38624 56738 2254 238 397 48
3.0-4.0 0 3.379 3.379 2.553 6 0 0 1 3181 4211 107 12 37 5
4.0-5.0 0 4.318 3.133 3.232 2 0 0 0 2287 3055 39 7 10 2
5.0-7.5 0 0 0 0 0 0 0 0 0 0 0 0 0 0
7.5-10.0 0 0 0 0 0 0 0 0 0 0 0 0 0 0
10.0-20.0 0 0 0 0 0 0 0 0 0 0 0 0 0 0
>20.0 0 0 0 0 0 0 0 0 0 0 0 0 0 0
All 1000 0.313 0.27 0.224 2 3 1 0 804884 1126570 134626 36011 3096 617
Table 12.2: Number per 1000 of opr. holdings, avg. area per opr. holding , avg. area owned and possessed per opr. holding, avg. area operated per holding, no. of parcels per holding, joint holdings
per 1000 of holdings, percentage of total area of hh opr. holdings of those hhs who operated jointly, to total area of opr. holdings, avg. no. of permanent attached farm workers per household opr.
holding by size class of household operational holding
WEST BENGAL SOCIAL GROUP: SCHEDULE CASTE VISIT 2
Size Class of
Operational
Holding (ha)
No. per
1000 of
opr.
holdings
Avg. area
per opr.
holding
(0.00 ha)
Avg. area
owned and
possessed
per opr.
holding
(0.00 ha)
Avg. area
operated
(used for agri.
activities) per
holding (0.00
ha)
No. of
parcels per
holding
Joint Holdings Estimated Sample
A 44

No. per
1000
of
holdings
Percentage of total
area of the opr.
holdings of the hhs
who operated jointly
to total area of opr.
holdings
Avg.no. of
permanent
attached
frame
worker per
hh opr
Area
operated
(ha)
Area of hh
opr. holding
(ha)
No. of
plots (00)
No. of hh
opr.
holding
(00)
No. of
plots
No. of hh
opr.
holdings
(1) (2) (3) (4) (5) (6) (7) (8) (9) (10) (11) (12) (13) (14) (15)
nil 0 0 0 0 0 0 0 0 0 0 0 0 0 0
>0.000& ≤0.002 0 0 0 0 0 0 0 0 0 0 0 0 0 0
0.002-0.005 10 0.004 0.004 0.001 1 0 0 0 13 42 207 104 18 9
0.005-0.040 75 0.018 0.014 0.005 1 0 0 0 404 1449 1661 811 35 16
0.040-0.5 469 0.225 0.215 0.119 3 0 0 0 60239 114092 26082 5073 175 38
0.5-1.0 266 0.722 0.719 0.47 5 46 6 0 135491 208274 19385 2883 279 38
1.0-2.0 156 1.455 1.45 0.769 6 3 0 0 129454 245038 16418 1684 801 87
2.0-3.0 22 2.377 2.349 1.083 7 0 0 0 26237 57583 2853 242 438 40
3.0-4.0 2 3.655 3.655 2.453 8 0 0 0 4190 6242 183 17 38 4
4.0-5.0 0 0 0 0 0 0 0 0 0 0 0 0 0 0
5.0-7.5 0 5.512 5.512 2.64 3 0 0 0 1350 2818 31 5 6 1
7.5-10.0 0 0 0 0 0 0 0 0 0 0 0 0 0 0
10.0-20.0 0 0 0 0 0 0 0 0 0 0 0 0 0 0
>20.0 0 0 0 0 0 0 0 0 0 0 0 0 0 0
All 1000 0.587 0.58 0.33 4 13 2 0 357378 635537 66819 10819 1790 233
Table 12.2: Number per 1000 of opr. holdings, avg. area per opr. holding , avg. area owned and possessed per opr. holding, avg. area operated per holding, no. of parcels per holding, joint holdings
per 1000 of holdings, percentage of total area of hh opr. holdings of those hhs who operated jointly, to total area of opr. holdings, avg. no. of permanent attached farm workers per household opr.
holding by size class of household operational holding
WEST BENGAL SOCIAL GROUP: OTHER BACKWARD CLASS VISIT 2
Size Class of
Operational
Holding (ha)
No. per
1000 of
opr.
holdings
Avg. area
per opr.
holding
(0.00 ha)
Avg. area
owned and
possessed
per opr.
holding
(0.00 ha)
Avg. area
operated
(used for agri.
activities) per
holding (0.00
ha)
No. of
parcels per
holding
Joint Holdings Estimated Sample
A 45
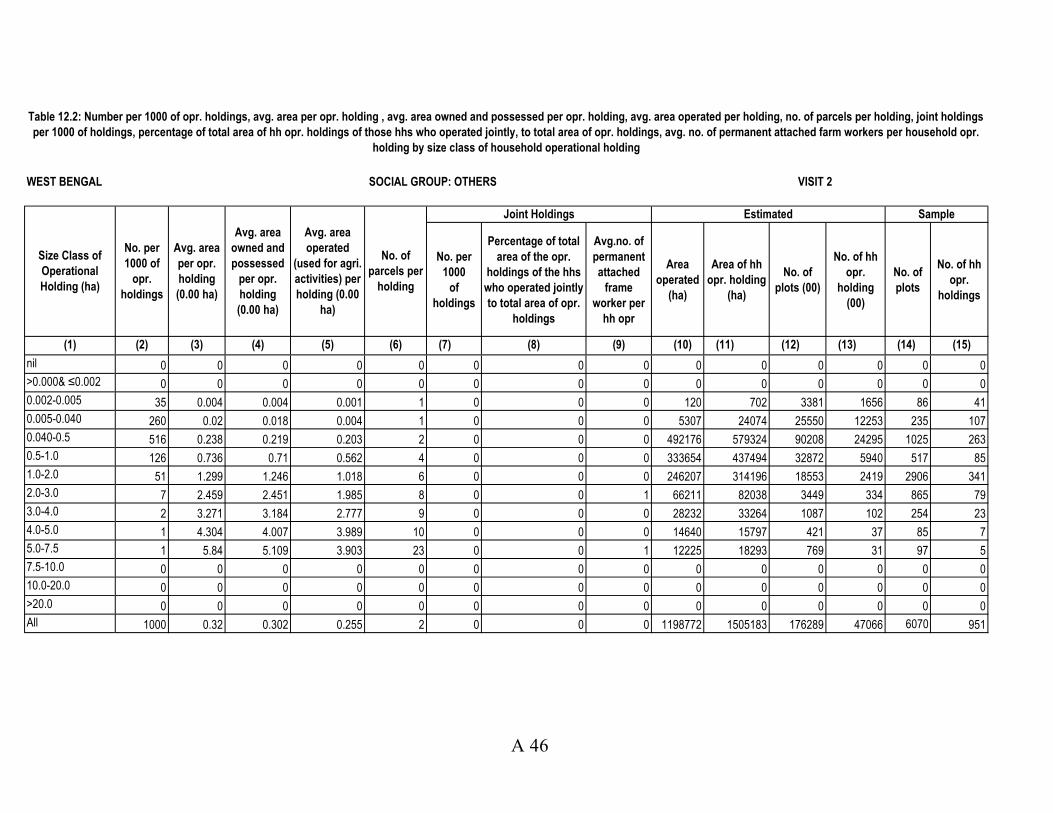
No. per
1000
of
holdings
Percentage of total
area of the opr.
holdings of the hhs
who operated jointly
to total area of opr.
holdings
Avg.no. of
permanent
attached
frame
worker per
hh opr
Area
operated
(ha)
Area of hh
opr. holding
(ha)
No. of
plots (00)
No. of hh
opr.
holding
(00)
No. of
plots
No. of hh
opr.
holdings
(1) (2) (3) (4) (5) (6) (7) (8) (9) (10) (11) (12) (13) (14) (15)
nil 0 0 0 0 0 0 0 0 0 0 0 0 0 0
>0.000& ≤0.002 0 0 0 0 0 0 0 0 0 0 0 0 0 0
0.002-0.005 35 0.004 0.004 0.001 1 0 0 0 120 702 3381 1656 86 41
0.005-0.040 260 0.02 0.018 0.004 1 0 0 0 5307 24074 25550 12253 235 107
0.040-0.5 516 0.238 0.219 0.203 2 0 0 0 492176 579324 90208 24295 1025 263
0.5-1.0 126 0.736 0.71 0.562 4 0 0 0 333654 437494 32872 5940 517 85
1.0-2.0 51 1.299 1.246 1.018 6 0 0 0 246207 314196 18553 2419 2906 341
2.0-3.0 7 2.459 2.451 1.985 8 0 0 1 66211 82038 3449 334 865 79
3.0-4.0 2 3.271 3.184 2.777 9 0 0 0 28232 33264 1087 102 254 23
4.0-5.0 1 4.304 4.007 3.989 10 0 0 0 14640 15797 421 37 85 7
5.0-7.5 1 5.84 5.109 3.903 23 0 0 1 12225 18293 769 31 97 5
7.5-10.0 0 0 0 0 0 0 0 0 0 0 0 0 0 0
10.0-20.0 0 0 0 0 0 0 0 0 0 0 0 0 0 0
>20.0 0 0 0 0 0 0 0 0 0 0 0 0 0 0
All 1000 0.32 0.302 0.255 2 0 0 0 1198772 1505183 176289 47066 6070 951
Table 12.2: Number per 1000 of opr. holdings, avg. area per opr. holding , avg. area owned and possessed per opr. holding, avg. area operated per holding, no. of parcels per holding, joint holdings
per 1000 of holdings, percentage of total area of hh opr. holdings of those hhs who operated jointly, to total area of opr. holdings, avg. no. of permanent attached farm workers per household opr.
holding by size class of household operational holding
WEST BENGAL SOCIAL GROUP: OTHERS VISIT 2
Size Class of
Operational
Holding (ha)
No. per
1000 of
opr.
holdings
Avg. area
per opr.
holding
(0.00 ha)
Avg. area
owned and
possessed
per opr.
holding
(0.00 ha)
Avg. area
operated
(used for agri.
activities) per
holding (0.00
ha)
No. of
parcels per
holding
Joint Holdings Estimated Sample
A 46

No. per
1000
of
holdings
Percentage of total
area of the opr.
holdings of the hhs
who operated jointly
to total area of opr.
holdings
Avg.no. of
permanent
attached
frame
worker per
hh opr
Area
operated
(ha)
Area of hh
opr. holding
(ha)
No. of
plots (00)
No. of hh
opr.
holding
(00)
No. of
plots
No. of hh
opr.
holdings
(1) (2) (3) (4) (5) (6) (7) (8) (9) (10) (11) (12) (13) (14) (15)
nil 0 0 0 0 0 0 0 0 0 0 0 0 0 0
>0.000& ≤0.002 0 0.002 0.002 0.001 1 0 0 0 4 9 94 47 8 4
0.002-0.005 33 0.004 0.004 0.001 1 0 0 0 316 1352 6834 3376 276 135
0.005-0.040 231 0.02 0.018 0.005 1 0 0 0 11688 47763 48267 23306 513 231
0.040-0.5 508 0.222 0.2 0.176 2 0 0 0 899672 1138590 192929 51244 2185 551
0.5-1.0 146 0.708 0.635 0.517 4 16 2 0 761917 1043577 85297 14730 1241 198
1.0-2.0 70 1.379 1.278 0.869 6 1 0 0 617603 980273 60378 7110 5428 663
2.0-3.0 9 2.41 2.4 1.539 8 0 0 0 143466 224638 10203 932 1890 186
3.0-4.0 1 3.34 3.275 2.651 8 0 0 0 36096 45477 1414 136 352 35
4.0-5.0 0 4.315 3.89 3.814 8 0 0 0 17325 19600 479 45 118 11
5.0-7.5 0 5.794 5.165 3.726 20 0 0 1 13575 21112 800 36 103 6
7.5-10.0 0 0 0 0 0 0 0 0 0 0 0 0 0 0
10.0-20.0 0 0 0 0 0 0 0 0 0 0 0 0 0 0
>20.0 0 0 0 0 0 0 0 0 0 0 0 0 0 0
All 1000 0.349 0.319 0.248 3 2 1 0 2501662 3522390 406694 100962 12114 2020
WEST BENGAL SOCIAL GROUP: ALL VISIT 2
Table 12.2: Number per 1000 of opr. holdings, avg. area per opr. holding , avg. area owned and possessed per opr. holding, avg. area operated per holding, no. of parcels per holding, joint holdings
per 1000 of holdings, percentage of total area of hh opr. holdings of those hhs who operated jointly, to total area of opr. holdings, avg. no. of permanent attached farm workers per household opr.
holding by size class of household operational holding
Joint Holdings Estimated Sample
Size Class of
Operational
Holding (ha)
No. per
1000 of
opr.
holdings
Avg. area
per opr.
holding
(0.00 ha)
Avg. area
owned and
possessed
per opr.
holding
(0.00 ha)
Avg. area
operated
(used for agri.
activities) per
holding (0.00
ha)
No. of
parcels per
holding
A 47

No. per
1000
of
holdings
Percentage of total
area of the opr.
holdings of the hhs
who operated jointly
to total area of opr.
holdings
Avg.no. of
permanent
attached
frame
worker per
hh opr
Area
operated
(ha)
Area of hh
opr. holding
(ha)
No. of
plots (00)
No. of hh
opr.
holding
(00)
No. of
plots
No. of hh
opr.
holdings
(1) (2) (3) (4) (5) (6) (7) (8) (9) (10) (11) (12) (13) (14) (15)
nil 0 0 0 0 0 0 0 0 0 0 0 0 0 0
>0.000& ≤0.002 2 0.002 0.002 0.001 1 0 0 0 1 2 22 11 2 1
0.002-0.005 42 0.004 0.004 0.001 1 0 0 0 23 120 607 299 54 26
0.005-0.040 259 0.024 0.013 0.011 1 0 0 0 1943 4492 3737 1842 66 32
0.040-0.5 468 0.167 0.124 0.148 2 0 0 0 49306 55736 11212 3335 237 63
0.5-1.0 46 0.687 0.644 0.672 6 0 0 0 21982 22446 2333 327 103 16
1.0-2.0 163 1.253 0.86 1.214 6 47 6 1 140939 145464 9294 1161 442 56
2.0-3.0 18 2.395 2.379 2.266 11 0 0 0 29546 31233 1749 130 181 18
3.0-4.0 1 3.191 3.191 2.845 5 0 0 0 2097 2352 51 7 28 4
4.0-5.0 1 4.317 4.317 3.261 8 0 0 0 1605 2125 47 5 40 4
5.0-7.5 0 5.41 5.41 3.21 6 0 0 0 491 828 14 2 9 1
7.5-10.0 0 0 0 0 0 0 0 0 0 0 0 0 0 0
10.0-20.0 0 0 0 0 0 0 0 0 0 0 0 0 0 0
>20.0 0 0 0 0 0 0 0 0 0 0 0 0 0 0
All 1000 0.372 0.282 0.348 3 8 3 0 247933 264799 29065 7120 1162 221
Table 12.W: Number per 1000 of opr. holdings, avg. area per opr. holding , avg. area owned and possessed per opr. holding, avg. area operated per holding, no. of parcels per holding, joint
holdings per 1000 of holdings, percentage of total area of hh opr. holdings of those hhs who operated jointly, to total area of opr. holdings, avg. no. of permanent attached farm workers per
household opr. holding by size class of household operational holding
WEST BENGAL SOCIAL GROUP: SCHEDULE TRIBE WHOLE AGRICULTURAL YEAR
Size Class of
Operational
Holding (ha)
No. per
1000 of
opr.
holdings
Avg. area
per opr.
holding
(0.00 ha)
Avg. area
owned and
possessed
per opr.
holding
(0.00 ha)
Avg. area
operated
(used for agri.
activities) per
holding (0.00
ha)
No. of
parcels per
holding
Joint Holdings Estimated Sample
A 48

No. per
1000
of
holdings
Percentage of total
area of the opr.
holdings of the hhs
who operated jointly
to total area of opr.
holdings
Avg.no. of
permanent
attached
frame
worker per
hh opr
Area
operated
(ha)
Area of hh
opr. holding
(ha)
No. of
plots (00)
No. of hh
opr.
holding
(00)
No. of
plots
No. of hh
opr.
holdings
(1) (2) (3) (4) (5) (6) (7) (8) (9) (10) (11) (12) (13) (14) (15)
nil 0 0 0 0 0 0 0 0 0 0 0 0 0 0
>0.000& ≤0.002 1 0.002 0.002 0.001 1 0 0 0 3 6 62 31 4 2
0.002-0.005 34 0.004 0.004 0.001 1 0 0 0 150 476 2611 1281 120 58
0.005-0.040 207 0.021 0.021 0.003 1 0 0 0 2637 16028 15811 7691 165 76
0.040-0.5 546 0.197 0.175 0.174 2 0 0 0 353708 400124 68182 20302 658 178
0.5-1.0 149 0.674 0.509 0.651 4 17 2 0 360205 373151 30641 5537 330 56
1.0-2.0 55 1.47 1.384 1.428 7 0 0 0 289868 298315 17074 2029 1322 188
2.0-3.0 7 2.377 2.375 2.274 7 0 0 0 59735 62450 2385 263 419 52
3.0-4.0 1 3.394 3.394 3.277 7 0 0 1 17217 17830 450 53 92 12
4.0-5.0 0 4.371 3.187 4.272 2 0 0 0 3022 3093 39 7 10 2
5.0-7.5 0 5.53 5.53 5.4 4 0 0 0 381 390 4 1 5 1
7.5-10.0 0 0 0 0 0 0 0 0 0 0 0 0 0 0
10.0-20.0 0 0 0 0 0 0 0 0 0 0 0 0 0 0
>20.0 0 0 0 0 0 0 0 0 0 0 0 0 0 0
All 1000 0.315 0.273 0.292 3 3 1 0 1086927 1171862 137258 37194 3125 625
Table 12.W: Number per 1000 of opr. holdings, avg. area per opr. holding , avg. area owned and possessed per opr. holding, avg. area operated per holding, no. of parcels per holding, joint
holdings per 1000 of holdings, percentage of total area of hh opr. holdings of those hhs who operated jointly, to total area of opr. holdings, avg. no. of permanent attached farm workers per
household opr. holding by size class of household operational holding
WEST BENGAL SOCIAL GROUP: SCHEDULE CASTE WHOLE AGRICULTURAL YEAR
Size Class of
Operational
Holding (ha)
No. per
1000 of
opr.
holdings
Avg. area
per opr.
holding
(0.00 ha)
Avg. area
owned and
possessed
per opr.
holding
(0.00 ha)
Avg. area
operated
(used for agri.
activities) per
holding (0.00
ha)
No. of
parcels per
holding
Joint Holdings Estimated Sample
A 49

No. per
1000
of
holdings
Percentage of total
area of the opr.
holdings of the hhs
who operated jointly
to total area of opr.
holdings
Avg.no. of
permanent
attached
frame
worker per
hh opr
Area
operated
(ha)
Area of hh
opr. holding
(ha)
No. of
plots (00)
No. of hh
opr.
holding
(00)
No. of
plots
No. of hh
opr.
holdings
(1) (2) (3) (4) (5) (6) (7) (8) (9) (10) (11) (12) (13) (14) (15)
nil 0 0 0 0 0 0 0 0 0 0 0 0 0 0
>0.000& ≤0.002 0 0 0 0 0 0 0 0 0 0 0 0 0 0
0.002-0.005 9 0.004 0.004 0.001 1 0 0 0 15 48 237 110 19 9
0.005-0.040 161 0.014 0.012 0.002 1 0 0 0 384 2651 3922 1950 38 18
0.040-0.5 429 0.228 0.215 0.21 4 0 0 0 109181 118149 26474 5187 181 40
0.5-1.0 237 0.723 0.716 0.695 5 46 6 0 199609 207678 19369 2871 248 33
1.0-2.0 137 1.446 1.443 1.427 7 3 0 0 236945 240127 16225 1660 803 88
2.0-3.0 25 2.377 2.299 2.336 8 0 0 0 70673 71908 3334 303 478 45
3.0-4.0 1 3.655 3.655 3.606 9 0 0 1 6160 6242 183 17 38 4
4.0-5.0 0 0 0 0 0 0 0 0 0 0 0 0 0 0
5.0-7.5 0 5.512 5.512 3.94 5 0 0 0 2014 2818 31 5 6 1
7.5-10.0 0 0 0 0 0 0 0 0 0 0 0 0 0 0
10.0-20.0 0 0 0 0 0 0 0 0 0 0 0 0 0 0
>20.0 0 0 0 0 0 0 0 0 0 0 0 0 0 0
All 1000 0.537 0.527 0.516 4 11 2 0 624981 649621 69774 12103 1811 238
Table 12.W: Number per 1000 of opr. holdings, avg. area per opr. holding , avg. area owned and possessed per opr. holding, avg. area operated per holding, no. of parcels per holding, joint
holdings per 1000 of holdings, percentage of total area of hh opr. holdings of those hhs who operated jointly, to total area of opr. holdings, avg. no. of permanent attached farm workers per
household opr. holding by size class of household operational holding
WEST BENGAL SOCIAL GROUP: OTHER BACKWARD CLASS WHOLE AGRICULTURAL YEAR
Size Class of
Operational
Holding (ha)
No. per
1000 of
opr.
holdings
Avg. area
per opr.
holding
(0.00 ha)
Avg. area
owned and
possessed
per opr.
holding
(0.00 ha)
Avg. area
operated
(used for agri.
activities) per
holding (0.00
ha)
No. of
parcels per
holding
Joint Holdings Estimated Sample
A 50
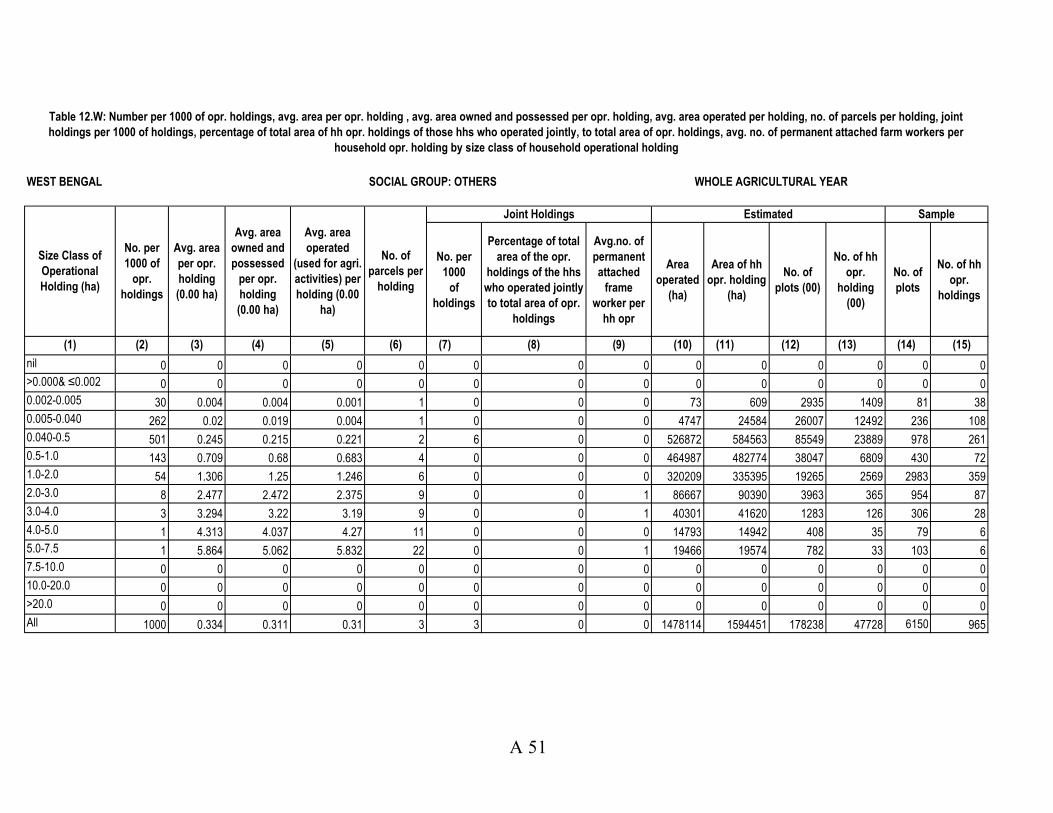
No. per
1000
of
holdings
Percentage of total
area of the opr.
holdings of the hhs
who operated jointly
to total area of opr.
holdings
Avg.no. of
permanent
attached
frame
worker per
hh opr
Area
operated
(ha)
Area of hh
opr. holding
(ha)
No. of
plots (00)
No. of hh
opr.
holding
(00)
No. of
plots
No. of hh
opr.
holdings
(1) (2) (3) (4) (5) (6) (7) (8) (9) (10) (11) (12) (13) (14) (15)
nil 0 0 0 0 0 0 0 0 0 0 0 0 0 0
>0.000& ≤0.002 0 0 0 0 0 0 0 0 0 0 0 0 0 0
0.002-0.005 30 0.004 0.004 0.001 1 0 0 0 73 609 2935 1409 81 38
0.005-0.040 262 0.02 0.019 0.004 1 0 0 0 4747 24584 26007 12492 236 108
0.040-0.5 501 0.245 0.215 0.221 2 6 0 0 526872 584563 85549 23889 978 261
0.5-1.0 143 0.709 0.68 0.683 4 0 0 0 464987 482774 38047 6809 430 72
1.0-2.0 54 1.306 1.25 1.246 6 0 0 0 320209 335395 19265 2569 2983 359
2.0-3.0 8 2.477 2.472 2.375 9 0 0 1 86667 90390 3963 365 954 87
3.0-4.0 3 3.294 3.22 3.19 9 0 0 1 40301 41620 1283 126 306 28
4.0-5.0 1 4.313 4.037 4.27 11 0 0 0 14793 14942 408 35 79 6
5.0-7.5 1 5.864 5.062 5.832 22 0 0 1 19466 19574 782 33 103 6
7.5-10.0 0 0 0 0 0 0 0 0 0 0 0 0 0 0
10.0-20.0 0 0 0 0 0 0 0 0 0 0 0 0 0 0
>20.0 0 0 0 0 0 0 0 0 0 0 0 0 0 0
All 1000 0.334 0.311 0.31 3 3 0 0 1478114 1594451 178238 47728 6150 965
Table 12.W: Number per 1000 of opr. holdings, avg. area per opr. holding , avg. area owned and possessed per opr. holding, avg. area operated per holding, no. of parcels per holding, joint
holdings per 1000 of holdings, percentage of total area of hh opr. holdings of those hhs who operated jointly, to total area of opr. holdings, avg. no. of permanent attached farm workers per
household opr. holding by size class of household operational holding
WEST BENGAL SOCIAL GROUP: OTHERS WHOLE AGRICULTURAL YEAR
Size Class of
Operational
Holding (ha)
No. per
1000 of
opr.
holdings
Avg. area
per opr.
holding
(0.00 ha)
Avg. area
owned and
possessed
per opr.
holding
(0.00 ha)
Avg. area
operated
(used for agri.
activities) per
holding (0.00
ha)
No. of
parcels per
holding
Joint Holdings Estimated Sample
A 51

No. per
1000
of
holdings
Percentage of total
area of the opr.
holdings of the hhs
who operated jointly
to total area of opr.
holdings
Avg.no. of
permanent
attached
frame
worker per
hh opr
Area
operated
(ha)
Area of hh
opr. holding
(ha)
No. of
plots (00)
No. of hh
opr.
holding
(00)
No. of
plots
No. of hh
opr.
holdings
(1) (2) (3) (4) (5) (6) (7) (8) (9) (10) (11) (12) (13) (14) (15)
nil 0 0 0 0 0 0 0 0 0 0 0 0 0 0
>0.000& ≤0.002 0 0.002 0.002 0.001 1 0 0 0 4 8 84 42 6 3
0.002-0.005 30 0.004 0.004 0.001 1 0 0 0 261 1254 6390 3100 274 131
0.005-0.040 230 0.02 0.018 0.004 1 0 0 0 9712 47756 49475 23975 505 234
0.040-0.5 506 0.22 0.194 0.197 2 3 0 0 1039067 1158572 191416 52713 2054 542
0.5-1.0 149 0.699 0.625 0.673 5 15 2 0 1046783 1086048 90389 15543 1111 177
1.0-2.0 71 1.374 1.269 1.331 6 8 1 0 987962 1019301 61857 7420 5550 691
2.0-3.0 10 2.414 2.387 2.325 9 0 0 0 246620 255980 11432 1061 2032 202
3.0-4.0 2 3.347 3.301 3.235 8 0 0 1 65775 68045 1967 203 464 48
4.0-5.0 0 4.322 3.938 4.164 9 0 0 0 19421 20160 494 47 129 12
5.0-7.5 0 5.797 5.139 5.488 19 0 0 1 22352 23609 830 41 123 9
7.5-10.0 0 0 0 0 0 0 0 0 0 0 0 0 0 0
10.0-20.0 0 0 0 0 0 0 0 0 0 0 0 0 0 0
>20.0 0 0 0 0 0 0 0 0 0 0 0 0 0 0
All 1000 0.353 0.321 0.33 3 4 1 0 3437956 3680733 414336 104145 12248 2049
WEST BENGAL SOCIAL GROUP: ALL WHOLE AGRICULTURAL YEAR
Table 12.W: Number per 1000 of opr. holdings, avg. area per opr. holding , avg. area owned and possessed per opr. holding, avg. area operated per holding, no. of parcels per holding, joint
holdings per 1000 of holdings, percentage of total area of hh opr. holdings of those hhs who operated jointly, to total area of opr. holdings, avg. no. of permanent attached farm workers per
household opr. holding by size class of household operational holding
Joint Holdings Estimated Sample
Size Class of
Operational
Holding (ha)
No. per
1000 of
opr.
holdings
Avg. area
per opr.
holding
(0.00 ha)
Avg. area
owned and
possessed
per opr.
holding
(0.00 ha)
Avg. area
operated
(used for agri.
activities) per
holding (0.00
ha)
No. of
parcels per
holding
A 52

ST SC OBC Others All (incl. n.r.) Estd (00) Sample
(1) (2) (3) (4) (5) (6) (7) (8)
nil 0 0 0 0 0 0 0
>0.000& ≤0.002 0 8 0 0 3 27 1
0.002-0.005 51 26 29 12 22 213 18
0.005-0.040 647 74 185 278 225 2220 28
0.040-0.5 106 724 390 428 504 4968 52
0.5-1.0 110 20 214 254 154 1521 21
1.0-2.0 76 148 145 15 81 800 59
2.0-3.0 7 0 32 13 10 96 13
3.0-4.0 2 1 4 0 1 11 4
4.0-5.0 0 0 0 0 0 0 0
5.0-7.5 0 0 0 1 0 4 1
7.5-10.0 0 0 0 0 0 0 0
10.0-20.0 0 0 0 0 0 0 0
>20.0 0 0 0 0 0 0 0
All 1000 1000 1000 1000 1000 9861 197
Estd. no of hh opr. holdings (00) 800 3525 1026 4509 9861 XXX XXX
Sample no. of hh opr. holdings 31 51 21 94 197 XXX XXX
WEST BENGAL VISIT 1
Size class of operational holding(ha)
Table 13: Per 1000 distribution of households with member(s) stayed away from the village for employment by size class of household operational holding
for each social group
No. of hhs with members stayed away for employment
No of hh opr. holdings with
member(s) stayed away from
village
A 53

0 1 2 3 >3 All (incl n.r) Estd (00) Sample
(1) (2) (3) (4) (5) (6) (7) (8) (9)
nil 0 0 0 0 0 0 0 0
>0.000& ≤0.002 1000 0 0 0 0 1000 43 4
0.002-0.005 507 424 28 42 0 1000 3552 152
0.005-0.040 348 445 133 65 8 1000 24538 217
0.040-0.5 295 399 192 93 20 1000 49585 504
0.5-1.0 173 424 192 58 154 1000 14373 174
1.0-2.0 137 372 320 110 61 1000 7321 698
2.0-3.0 166 282 252 170 131 1000 1023 200
3.0-4.0 158 118 241 323 160 1000 186 44
4.0-5.0 184 517 21 24 254 1000 37 10
5.0-7.5 0 572 0 140 287 1000 36 6
7.5-10.0 0 0 0 0 0 0 0 0
10.0-20.0 0 0 0 0 0 0 0 0
>20.0 0 0 0 0 0 0 0 0
All 285 411 182 82 40 1000 100695 2009
Estd. no of hh opr.
holdings (00) 28676 41402 18307 8249 4061 100695 XXX XXX
Sample no. of hh opr.
holdings 459 784 381 239 146 2009 XXX XXX
WEST BENGAL Visit 1
Size class of operational
holding (ha)
Table 14: Per 1000 distribution of households with no. of member(s) other than the main operator those are associated with the household operational
holding for each size class of household operational holding
Per 1000 distribution of hhs with no. of member(s) other than the main operator those are associated
with the hh opr. holdingNo of hh opr holding with
A 54

Owned and
possessedLeased in
Otherwise
possessed
Leased
out
All (incl.
n.r.)
Owned and
possessedLeased in
Otherwise
possessed
Leased
out
All (incl.
n.r.)
No of
plots
(00)
Area of
plots (ha)
No of
hhs
(00)
Plots HHs
(1) (2) (3) (4) (5) (6) (7) (8) (9) (10) (11) (12) (13) (14) (15) (16) (17)
nil 0 0 0 0 0 0 0 0 0 0 0 0 0 0 0 0
>0.000& ≤0.002 84 0 1 0 85 8 0 0 0 9 1000 85 9 43 8 4
0.002-0.005 6820 48 255 69 7122 1351 5 55 1354 1411 999 7122 1411 3552 307 152
0.005-0.040 46226 0 3444 687 49670 45317 0 4211 7646 49528 992 49670 49528 24538 443 217
0.040-0.5 173501 9922 2341 527 185764 1002151 95524 7821 6449 1105497 805 185764 1105497 49585 1932 504
0.5-1.0 79105 4993 134 72 84232 935061 78363 862 361 1014286 927 84232 1014286 14373 1066 174
1.0-2.0 56592 3100 52 1484 59744 923801 76466 1734 40799 1002001 930 59744 1002001 7321 5526 698
2.0-3.0 10429 55 0 240 10484 243928 2555 0 7367 246482 894 10484 246482 1023 1907 200
3.0-4.0 1848 27 0 2 1875 61769 934 0 62 62703 981 1875 62703 186 439 44
4.0-5.0 352 12 0 16 363 13885 1793 0 279 15678 816 363 15678 37 104 10
5.0-7.5 608 192 0 0 800 18714 2542 0 0 21255 1000 800 21255 36 103 6
7.5-10.0 0 0 0 0 0 0 0 0 0 0 0 0 0 0 0 0
10.0-20.0 0 0 0 0 0 0 0 0 0 0 0 0 0 0 0 0
>20.0 0 0 0 0 0 0 0 0 0 0 0 0 0 0 0 0
All 18348 18348 6227 3097 400140 3245985 258182 14682 64316 3518849 885 400140 3518849 100695 11385 2009
Estd. no of plots (00)/area (ha) 18348 18348 6227 3097 400140 3245985 258182 14682 64316 3518849 XXX XXX XXX XXX XXX XXX
Sample no. of plots 11230 475 130 148 11835 XXX XXX XXX XXX XXX XXX XXX XXX XXX XXX XXX
Table 15.1.m: Percentage distribution of plots and corresponding area for the households belonging to different size class of household operational holding by kind of possession
WEST BENGAL VISIT 1
Size class of operational
holding (ha)
Sample no. ofProp. of hhs
reporting only
home stead
land per 1000
hhs
Percentage distribution of plots with kind of
possession asArea with kind of possession as Estd.
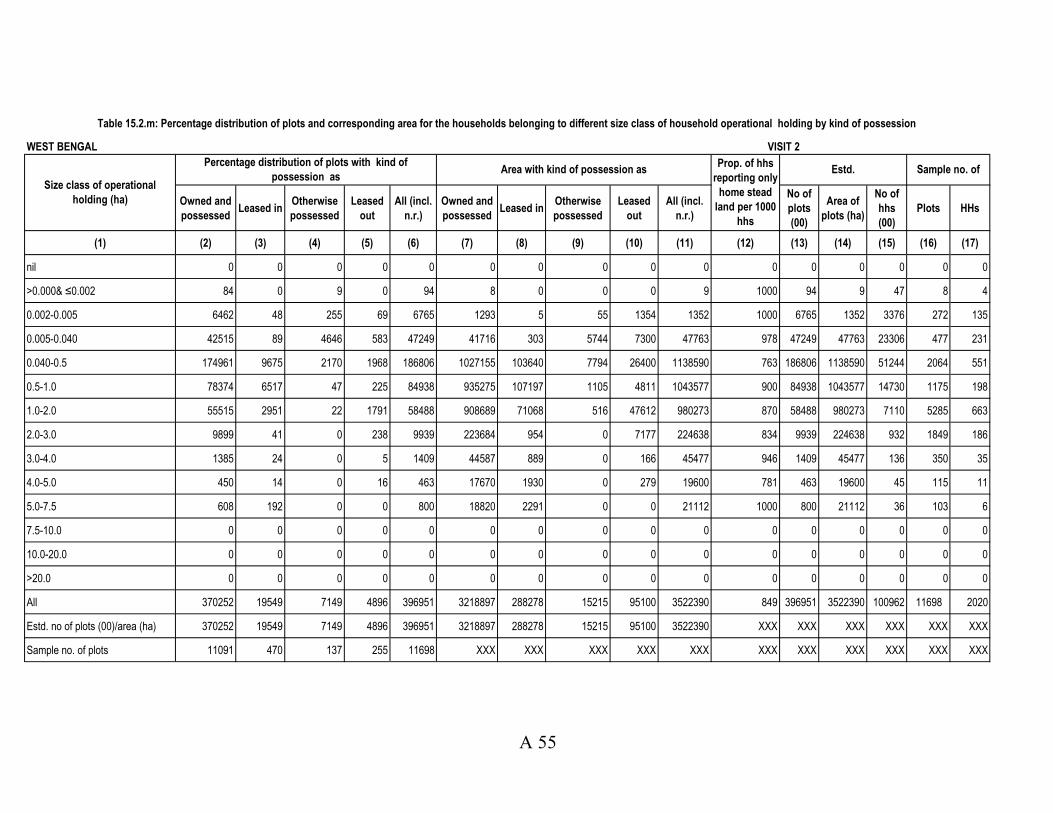
Owned and
possessedLeased in
Otherwise
possessed
Leased
out
All (incl.
n.r.)
Owned and
possessedLeased in
Otherwise
possessed
Leased
out
All (incl.
n.r.)
No of
plots
(00)
Area of
plots (ha)
No of
hhs
(00)
Plots HHs
(1) (2) (3) (4) (5) (6) (7) (8) (9) (10) (11) (12) (13) (14) (15) (16) (17)
nil 0 0 0 0 0 0 0 0 0 0 0 0 0 0 0 0
>0.000& ≤0.002 84 0 9 0 94 8 0 0 0 9 1000 94 9 47 8 4
0.002-0.005 6462 48 255 69 6765 1293 5 55 1354 1352 1000 6765 1352 3376 272 135
0.005-0.040 42515 89 4646 583 47249 41716 303 5744 7300 47763 978 47249 47763 23306 477 231
0.040-0.5 174961 9675 2170 1968 186806 1027155 103640 7794 26400 1138590 763 186806 1138590 51244 2064 551
0.5-1.0 78374 6517 47 225 84938 935275 107197 1105 4811 1043577 900 84938 1043577 14730 1175 198
1.0-2.0 55515 2951 22 1791 58488 908689 71068 516 47612 980273 870 58488 980273 7110 5285 663
2.0-3.0 9899 41 0 238 9939 223684 954 0 7177 224638 834 9939 224638 932 1849 186
3.0-4.0 1385 24 0 5 1409 44587 889 0 166 45477 946 1409 45477 136 350 35
4.0-5.0 450 14 0 16 463 17670 1930 0 279 19600 781 463 19600 45 115 11
5.0-7.5 608 192 0 0 800 18820 2291 0 0 21112 1000 800 21112 36 103 6
7.5-10.0 0 0 0 0 0 0 0 0 0 0 0 0 0 0 0 0
10.0-20.0 0 0 0 0 0 0 0 0 0 0 0 0 0 0 0 0
>20.0 0 0 0 0 0 0 0 0 0 0 0 0 0 0 0 0
All 370252 19549 7149 4896 396951 3218897 288278 15215 95100 3522390 849 396951 3522390 100962 11698 2020
Estd. no of plots (00)/area (ha) 370252 19549 7149 4896 396951 3218897 288278 15215 95100 3522390 XXX XXX XXX XXX XXX XXX
Sample no. of plots 11091 470 137 255 11698 XXX XXX XXX XXX XXX XXX XXX XXX XXX XXX XXX
Table 15.2.m: Percentage distribution of plots and corresponding area for the households belonging to different size class of household operational holding by kind of possession
WEST BENGAL VISIT 2
Size class of operational
holding (ha)
Percentage distribution of plots with kind of
possession asArea with kind of possession as
Prop. of hhs
reporting only
home stead
land per 1000
hhs
Estd. Sample no. of
A 55
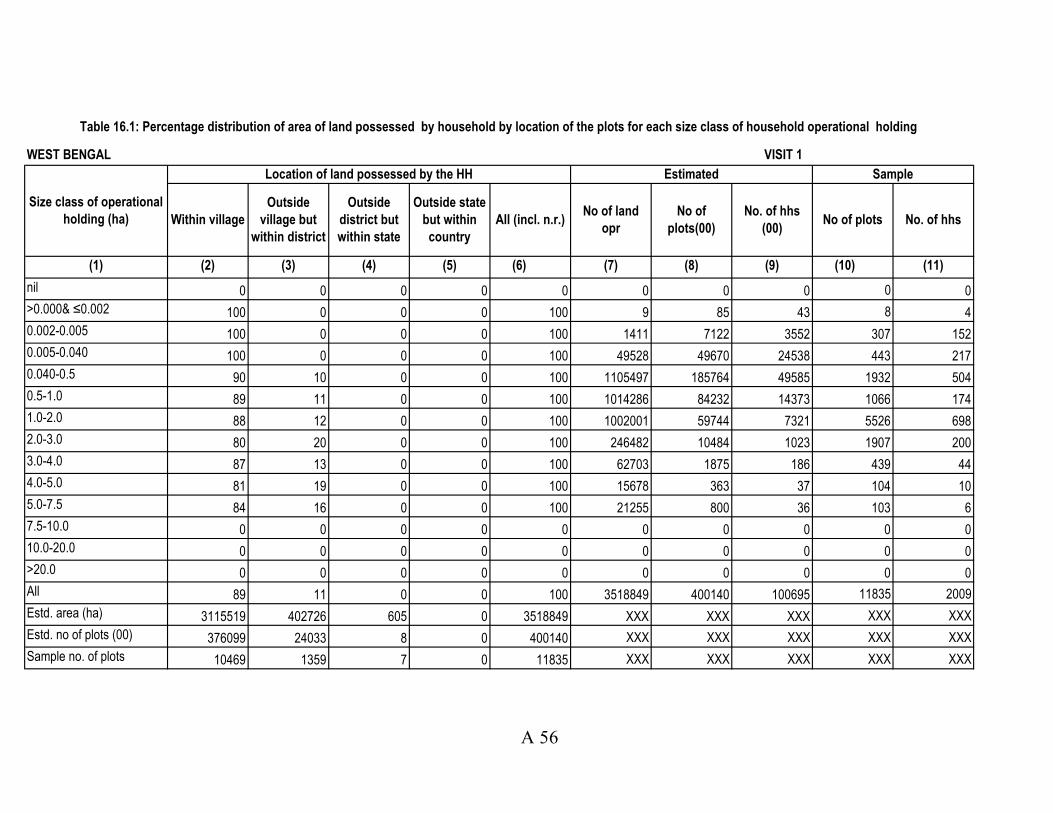
(1) (2) (3) (4) (5) (6) (7) (8) (9) (10) (11)
nil 0 0 0 0 0 0 0 0 0 0
>0.000& ≤0.002 100 0 0 0 100 9 85 43 8 4
0.002-0.005 100 0 0 0 100 1411 7122 3552 307 152
0.005-0.040 100 0 0 0 100 49528 49670 24538 443 217
0.040-0.5 90 10 0 0 100 1105497 185764 49585 1932 504
0.5-1.0 89 11 0 0 100 1014286 84232 14373 1066 174
1.0-2.0 88 12 0 0 100 1002001 59744 7321 5526 698
2.0-3.0 80 20 0 0 100 246482 10484 1023 1907 200
3.0-4.0 87 13 0 0 100 62703 1875 186 439 44
4.0-5.0 81 19 0 0 100 15678 363 37 104 10
5.0-7.5 84 16 0 0 100 21255 800 36 103 6
7.5-10.0 0 0 0 0 0 0 0 0 0 0
10.0-20.0 0 0 0 0 0 0 0 0 0 0
>20.0 0 0 0 0 0 0 0 0 0 0
All 89 11 0 0 100 3518849 400140 100695 11835 2009
Estd. area (ha) 3115519 402726 605 0 3518849 XXX XXX XXX XXX XXX
Estd. no of plots (00) 376099 24033 8 0 400140 XXX XXX XXX XXX XXX
Sample no. of plots 10469 1359 7 0 11835 XXX XXX XXX XXX XXX
Table 16.1: Percentage distribution of area of land possessed by household by location of the plots for each size class of household operational holding
WEST BENGAL VISIT 1
Size class of operational
holding (ha)
Location of land possessed by the HH SampleEstimated
Within village
Outside
village but
within district
Outside
district but
within state
Outside state
but within
country
All (incl. n.r.)No of land
opr
No of
plots(00)
No. of hhs
(00)No of plots No. of hhs
A 56
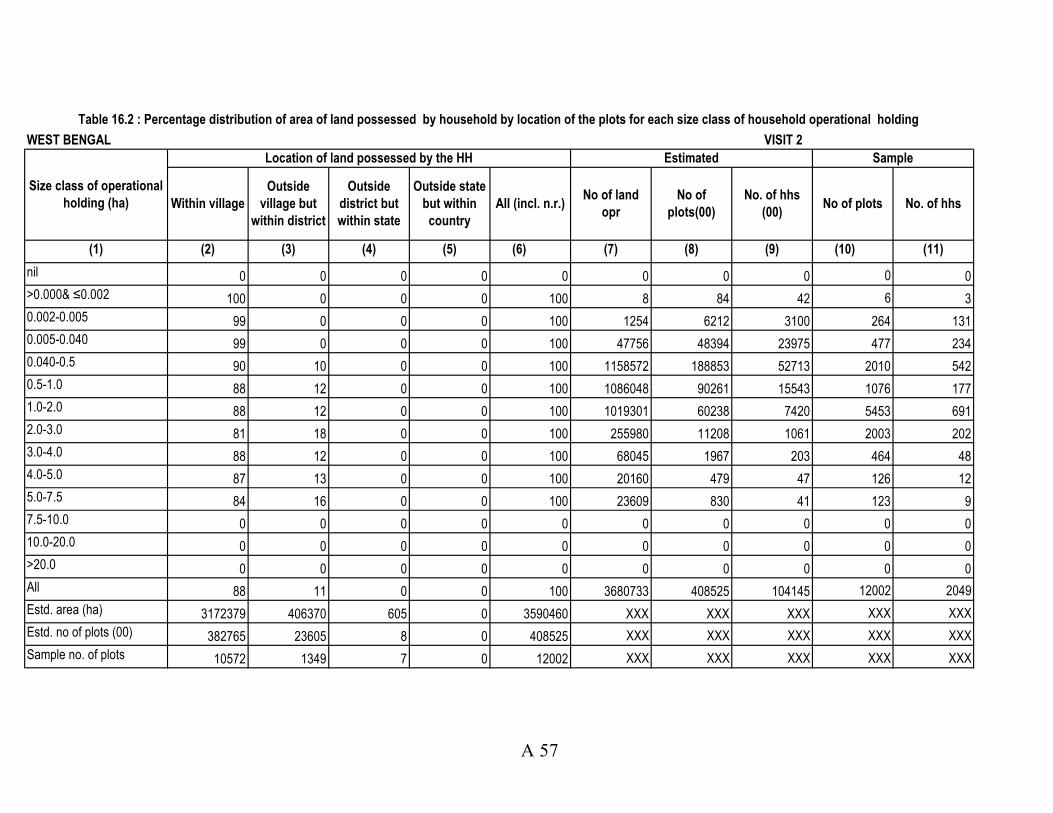
(1) (2) (3) (4) (5) (6) (7) (8) (9) (10) (11)
nil 0 0 0 0 0 0 0 0 0 0
>0.000& ≤0.002 100 0 0 0 100 8 84 42 6 3
0.002-0.005 99 0 0 0 100 1254 6212 3100 264 131
0.005-0.040 99 0 0 0 100 47756 48394 23975 477 234
0.040-0.5 90 10 0 0 100 1158572 188853 52713 2010 542
0.5-1.0 88 12 0 0 100 1086048 90261 15543 1076 177
1.0-2.0 88 12 0 0 100 1019301 60238 7420 5453 691
2.0-3.0 81 18 0 0 100 255980 11208 1061 2003 202
3.0-4.0 88 12 0 0 100 68045 1967 203 464 48
4.0-5.0 87 13 0 0 100 20160 479 47 126 12
5.0-7.5 84 16 0 0 100 23609 830 41 123 9
7.5-10.0 0 0 0 0 0 0 0 0 0 0
10.0-20.0 0 0 0 0 0 0 0 0 0 0
>20.0 0 0 0 0 0 0 0 0 0 0
All 88 11 0 0 100 3680733 408525 104145 12002 2049
Estd. area (ha) 3172379 406370 605 0 3590460 XXX XXX XXX XXX XXX
Estd. no of plots (00) 382765 23605 8 0 408525 XXX XXX XXX XXX XXX
Sample no. of plots 10572 1349 7 0 12002 XXX XXX XXX XXX XXX
Table 16.2 : Percentage distribution of area of land possessed by household by location of the plots for each size class of household operational holding
WEST BENGAL VISIT 2
Size class of operational
holding (ha)
Location of land possessed by the HH Estimated Sample
Within village
Outside
village but
within district
Outside
district but
within state
Outside state
but within
country
All (incl. n.r.)No of land
opr
No of
plots(00)
No. of hhs
(00)No of plots No. of hhs
A 57
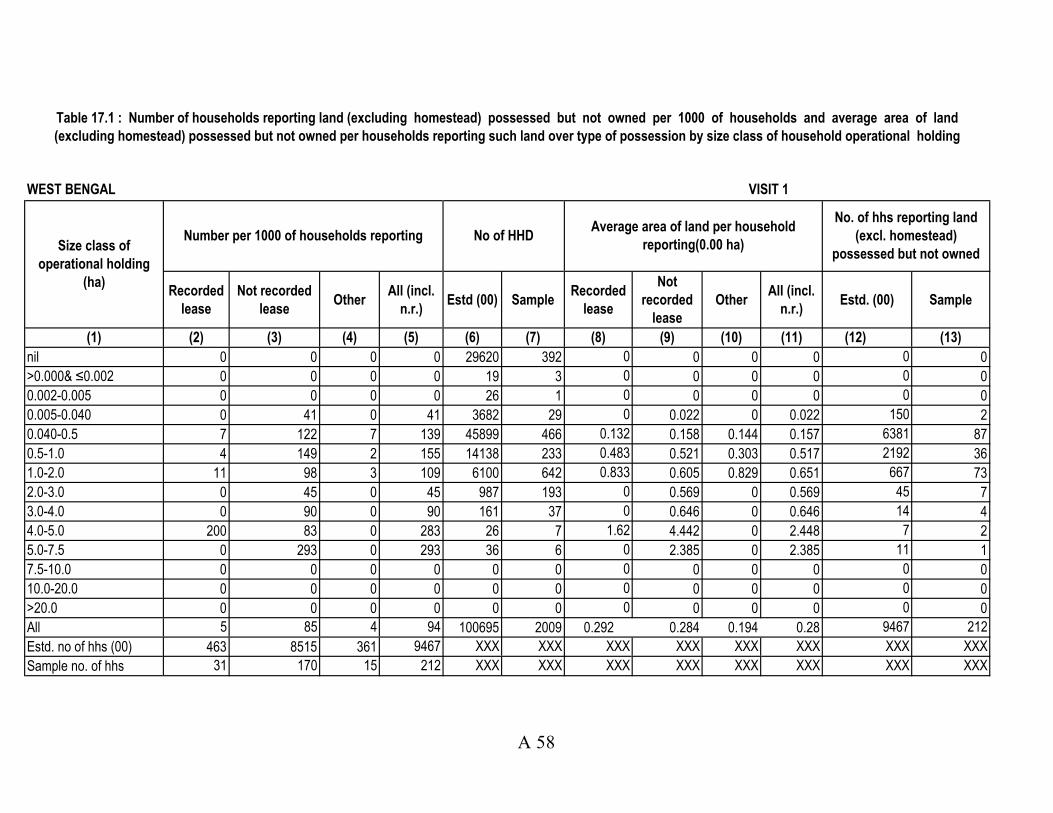
Recorded
lease
Not recorded
leaseOther
All (incl.
n.r.)Estd (00) Sample
Recorded
lease
Not
recorded
lease
OtherAll (incl.
n.r.)Estd. (00) Sample
(1) (2) (3) (4) (5) (6) (7) (8) (9) (10) (11) (12) (13)
nil 0 0 0 0 29620 392 0 0 0 0 0 0
>0.000& ≤0.002 0 0 0 0 19 3 0 0 0 0 0 0
0.002-0.005 0 0 0 0 26 1 0 0 0 0 0 0
0.005-0.040 0 41 0 41 3682 29 0 0.022 0 0.022 150 2
0.040-0.5 7 122 7 139 45899 466 0.132 0.158 0.144 0.157 6381 87
0.5-1.0 4 149 2 155 14138 233 0.483 0.521 0.303 0.517 2192 36
1.0-2.0 11 98 3 109 6100 642 0.833 0.605 0.829 0.651 667 73
2.0-3.0 0 45 0 45 987 193 0 0.569 0 0.569 45 7
3.0-4.0 0 90 0 90 161 37 0 0.646 0 0.646 14 4
4.0-5.0 200 83 0 283 26 7 1.62 4.442 0 2.448 7 2
5.0-7.5 0 293 0 293 36 6 0 2.385 0 2.385 11 1
7.5-10.0 0 0 0 0 0 0 0 0 0 0 0 0
10.0-20.0 0 0 0 0 0 0 0 0 0 0 0 0
>20.0 0 0 0 0 0 0 0 0 0 0 0 0
All 5 85 4 94 100695 2009 0.292 0.284 0.194 0.28 9467 212
Estd. no of hhs (00) 463 8515 361 9467 XXX XXX XXX XXX XXX XXX XXX XXX
Sample no. of hhs 31 170 15 212 XXX XXX XXX XXX XXX XXX XXX XXX
Table 17.1 : Number of households reporting land (excluding homestead) possessed but not owned per 1000 of households and average area of land
(excluding homestead) possessed but not owned per households reporting such land over type of possession by size class of household operational holding
WEST BENGAL VISIT 1
Size class of
operational holding
(ha)
Number per 1000 of households reportingAverage area of land per household
reporting(0.00 ha)
No. of hhs reporting land
(excl. homestead)
possessed but not owned
No of HHD
A 58
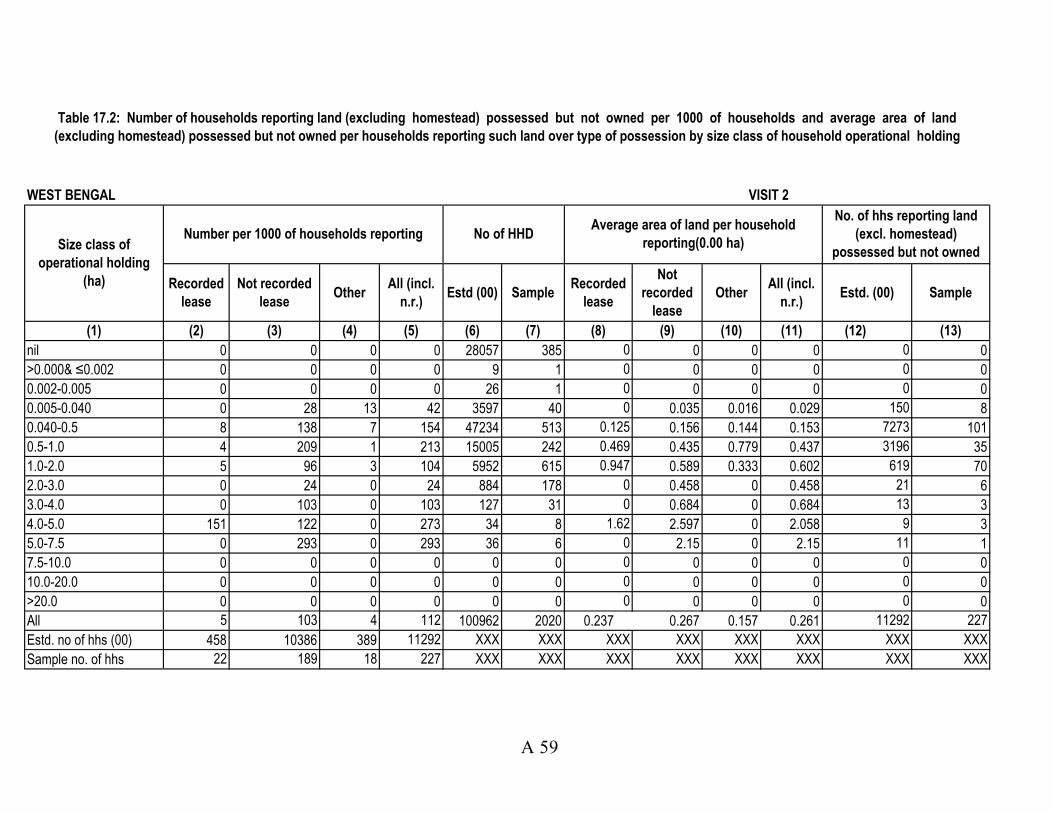
Recorded
lease
Not recorded
leaseOther
All (incl.
n.r.)Estd (00) Sample
Recorded
lease
Not
recorded
lease
OtherAll (incl.
n.r.)Estd. (00) Sample
(1) (2) (3) (4) (5) (6) (7) (8) (9) (10) (11) (12) (13)
nil 0 0 0 0 28057 385 0 0 0 0 0 0
>0.000& ≤0.002 0 0 0 0 9 1 0 0 0 0 0 0
0.002-0.005 0 0 0 0 26 1 0 0 0 0 0 0
0.005-0.040 0 28 13 42 3597 40 0 0.035 0.016 0.029 150 8
0.040-0.5 8 138 7 154 47234 513 0.125 0.156 0.144 0.153 7273 101
0.5-1.0 4 209 1 213 15005 242 0.469 0.435 0.779 0.437 3196 35
1.0-2.0 5 96 3 104 5952 615 0.947 0.589 0.333 0.602 619 70
2.0-3.0 0 24 0 24 884 178 0 0.458 0 0.458 21 6
3.0-4.0 0 103 0 103 127 31 0 0.684 0 0.684 13 3
4.0-5.0 151 122 0 273 34 8 1.62 2.597 0 2.058 9 3
5.0-7.5 0 293 0 293 36 6 0 2.15 0 2.15 11 1
7.5-10.0 0 0 0 0 0 0 0 0 0 0 0 0
10.0-20.0 0 0 0 0 0 0 0 0 0 0 0 0
>20.0 0 0 0 0 0 0 0 0 0 0 0 0
All 5 103 4 112 100962 2020 0.237 0.267 0.157 0.261 11292 227
Estd. no of hhs (00) 458 10386 389 11292 XXX XXX XXX XXX XXX XXX XXX XXX
Sample no. of hhs 22 189 18 227 XXX XXX XXX XXX XXX XXX XXX XXX
Table 17.2: Number of households reporting land (excluding homestead) possessed but not owned per 1000 of households and average area of land
(excluding homestead) possessed but not owned per households reporting such land over type of possession by size class of household operational holding
WEST BENGAL VISIT 2
Size class of
operational holding
(ha)
Number per 1000 of households reporting No of HHDAverage area of land per household
reporting(0.00 ha)
No. of hhs reporting land
(excl. homestead)
possessed but not owned
A 59
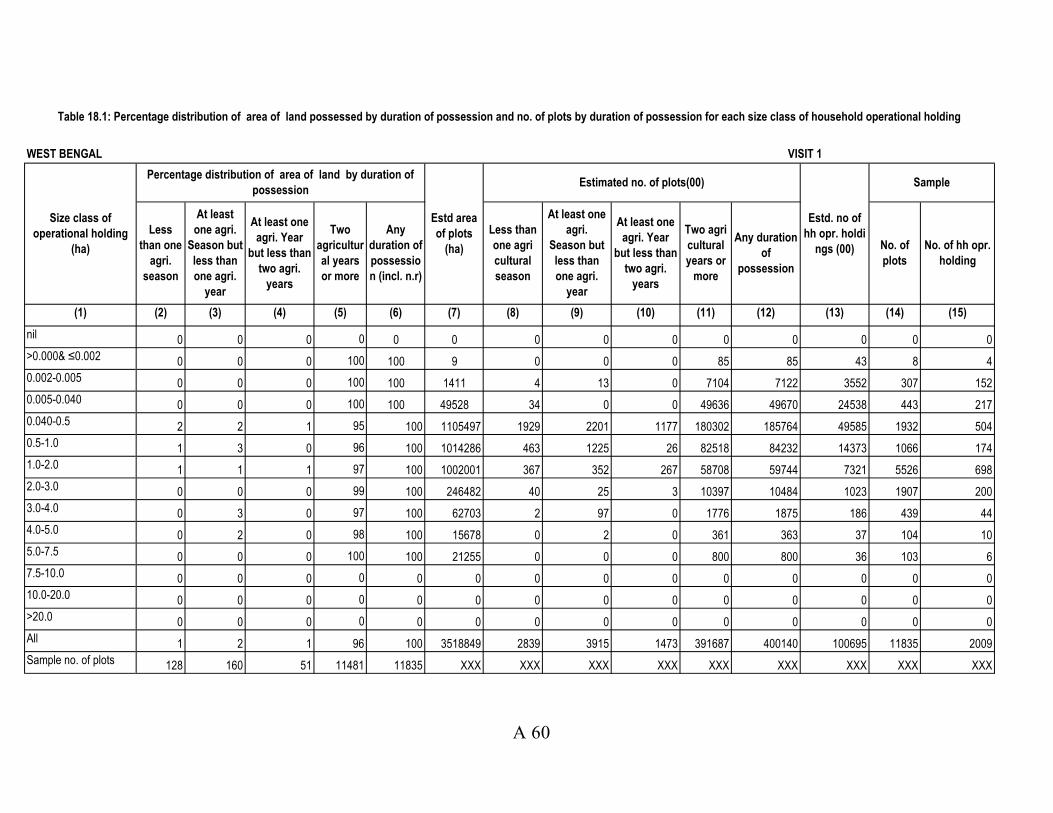
(1) (2) (3) (4) (5) (6) (7) (8) (9) (10) (11) (12) (13) (14) (15)
nil 0 0 0 0 0 0 0 0 0 0 0 0 0 0
>0.000& ≤0.002 0 0 0 100 100 9 0 0 0 85 85 43 8 4
0.002-0.005 0 0 0 100 100 1411 4 13 0 7104 7122 3552 307 152
0.005-0.040 0 0 0 100 100 49528 34 0 0 49636 49670 24538 443 217
0.040-0.5 2 2 1 95 100 1105497 1929 2201 1177 180302 185764 49585 1932 504
0.5-1.0 1 3 0 96 100 1014286 463 1225 26 82518 84232 14373 1066 174
1.0-2.0 1 1 1 97 100 1002001 367 352 267 58708 59744 7321 5526 698
2.0-3.0 0 0 0 99 100 246482 40 25 3 10397 10484 1023 1907 200
3.0-4.0 0 3 0 97 100 62703 2 97 0 1776 1875 186 439 44
4.0-5.0 0 2 0 98 100 15678 0 2 0 361 363 37 104 10
5.0-7.5 0 0 0 100 100 21255 0 0 0 800 800 36 103 6
7.5-10.0 0 0 0 0 0 0 0 0 0 0 0 0 0 0
10.0-20.0 0 0 0 0 0 0 0 0 0 0 0 0 0 0
>20.0 0 0 0 0 0 0 0 0 0 0 0 0 0 0
All 1 2 1 96 100 3518849 2839 3915 1473 391687 400140 100695 11835 2009
Sample no. of plots 128 160 51 11481 11835 XXX XXX XXX XXX XXX XXX XXX XXX XXX
Table 18.1: Percentage distribution of area of land possessed by duration of possession and no. of plots by duration of possession for each size class of household operational holding
WEST BENGAL VISIT 1
Size class of
operational holding
(ha)
Percentage distribution of area of land by duration of
possession
Estd. no of
hh opr. holdi
ngs (00)
Less
than one
agri.
season
At least
one agri.
Season but
less than
one agri.
year
At least one
agri. Year
but less than
two agri.
years
Two
agricultur
al years
or more
Any
duration of
possessio
n (incl. n.r)
Estimated no. of plots(00)
Less than
one agri
cultural
season
Two agri
cultural
years or
more
Any duration
of
possession
Sample
No. of
plots
No. of hh opr.
holding
At least one
agri.
Season but
less than
one agri.
year
At least one
agri. Year
but less than
two agri.
years
Estd area
of plots
(ha)
A 60
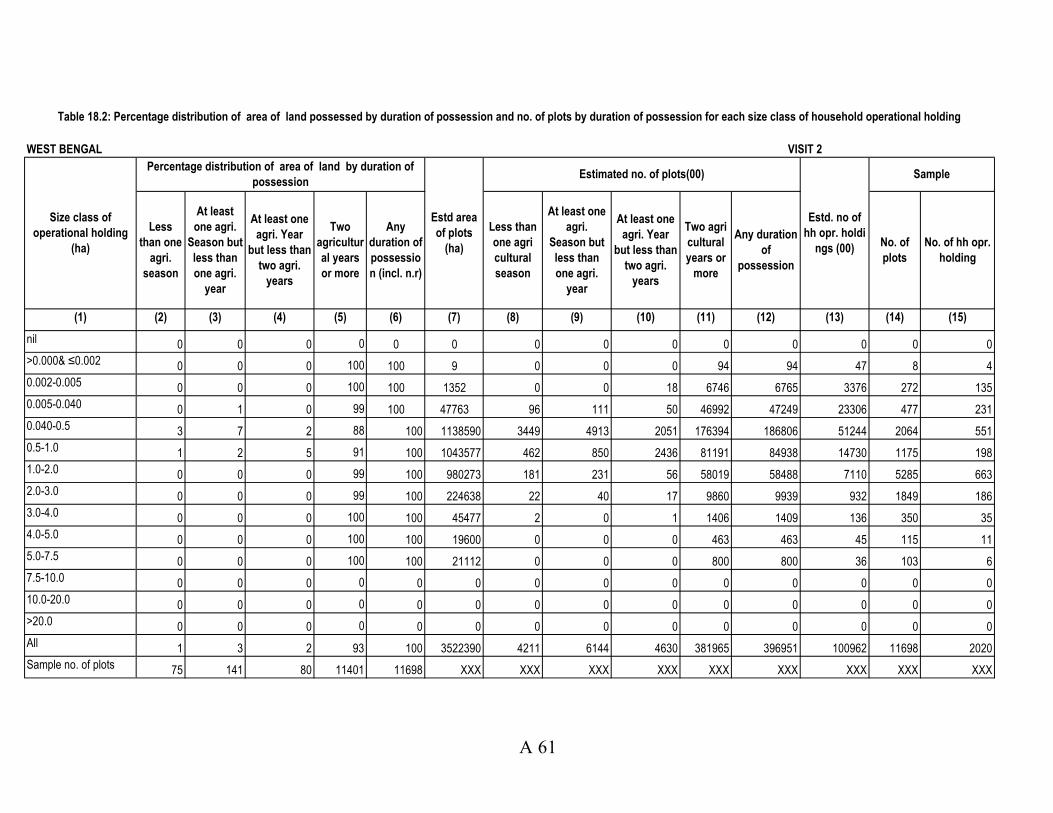
(1) (2) (3) (4) (5) (6) (7) (8) (9) (10) (11) (12) (13) (14) (15)
nil 0 0 0 0 0 0 0 0 0 0 0 0 0 0
>0.000& ≤0.002 0 0 0 100 100 9 0 0 0 94 94 47 8 4
0.002-0.005 0 0 0 100 100 1352 0 0 18 6746 6765 3376 272 135
0.005-0.040 0 1 0 99 100 47763 96 111 50 46992 47249 23306 477 231
0.040-0.5 3 7 2 88 100 1138590 3449 4913 2051 176394 186806 51244 2064 551
0.5-1.0 1 2 5 91 100 1043577 462 850 2436 81191 84938 14730 1175 198
1.0-2.0 0 0 0 99 100 980273 181 231 56 58019 58488 7110 5285 663
2.0-3.0 0 0 0 99 100 224638 22 40 17 9860 9939 932 1849 186
3.0-4.0 0 0 0 100 100 45477 2 0 1 1406 1409 136 350 35
4.0-5.0 0 0 0 100 100 19600 0 0 0 463 463 45 115 11
5.0-7.5 0 0 0 100 100 21112 0 0 0 800 800 36 103 6
7.5-10.0 0 0 0 0 0 0 0 0 0 0 0 0 0 0
10.0-20.0 0 0 0 0 0 0 0 0 0 0 0 0 0 0
>20.0 0 0 0 0 0 0 0 0 0 0 0 0 0 0
All 1 3 2 93 100 3522390 4211 6144 4630 381965 396951 100962 11698 2020
Sample no. of plots 75 141 80 11401 11698 XXX XXX XXX XXX XXX XXX XXX XXX XXX
At least one
agri. Year
but less than
two agri.
years
Two agri
cultural
years or
more
Any duration
of
possession
At least one
agri. Year
but less than
two agri.
years
Two
agricultur
al years
or more
Any
duration of
possessio
n (incl. n.r)
Less than
one agri
cultural
season
At least one
agri.
Season but
less than
one agri.
year
No. of
plots
No. of hh opr.
holding
Table 18.2: Percentage distribution of area of land possessed by duration of possession and no. of plots by duration of possession for each size class of household operational holding
WEST BENGAL VISIT 2
Percentage distribution of area of land by duration of
possessionEstimated no. of plots(00) Sample
Size class of
operational holding
(ha)
Estd area
of plots
(ha)
Estd. no of
hh opr. holdi
ngs (00)
Less
than one
agri.
season
At least
one agri.
Season but
less than
one agri.
year
A 61
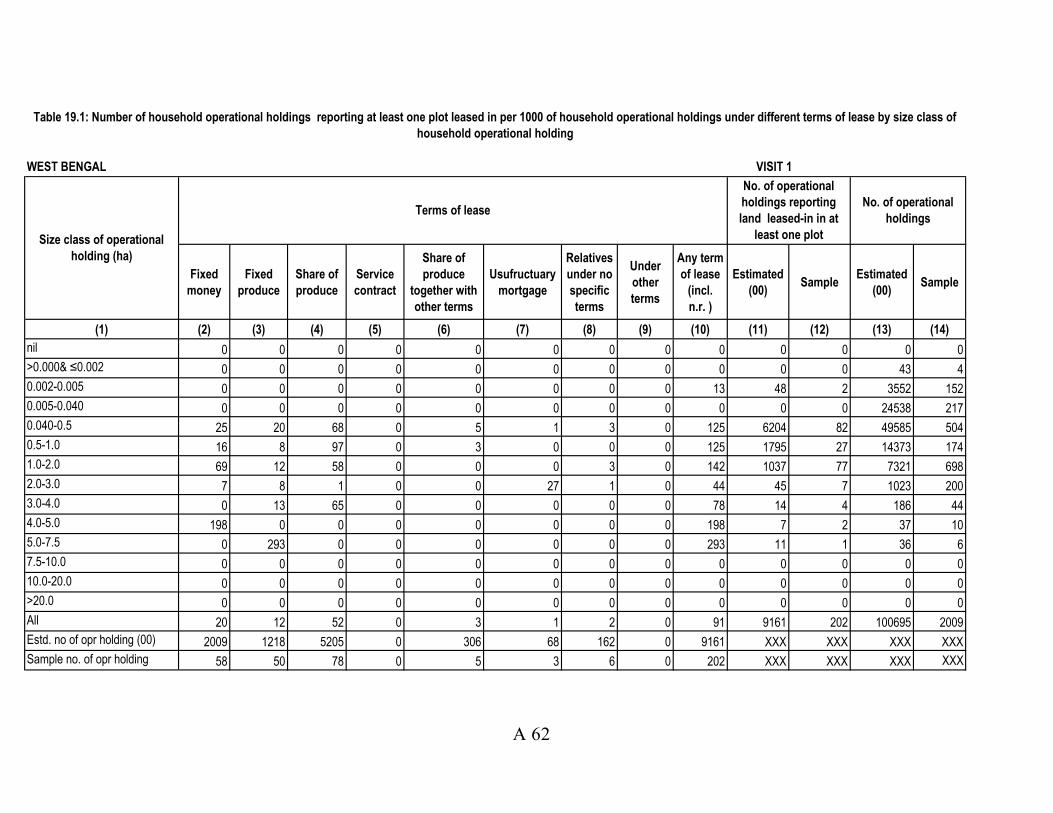
Fixed
money
Fixed
produce
Share of
produce
Service
contract
Share of
produce
together with
other terms
Usufructuary
mortgage
Relatives
under no
specific
terms
Under
other
terms
Any term
of lease
(incl.
n.r. )
Estimated
(00)Sample
Estimated
(00)Sample
(1) (2) (3) (4) (5) (6) (7) (8) (9) (10) (11) (12) (13) (14)
nil 0 0 0 0 0 0 0 0 0 0 0 0 0
>0.000& ≤0.002 0 0 0 0 0 0 0 0 0 0 0 43 4
0.002-0.005 0 0 0 0 0 0 0 0 13 48 2 3552 152
0.005-0.040 0 0 0 0 0 0 0 0 0 0 0 24538 217
0.040-0.5 25 20 68 0 5 1 3 0 125 6204 82 49585 504
0.5-1.0 16 8 97 0 3 0 0 0 125 1795 27 14373 174
1.0-2.0 69 12 58 0 0 0 3 0 142 1037 77 7321 698
2.0-3.0 7 8 1 0 0 27 1 0 44 45 7 1023 200
3.0-4.0 0 13 65 0 0 0 0 0 78 14 4 186 44
4.0-5.0 198 0 0 0 0 0 0 0 198 7 2 37 10
5.0-7.5 0 293 0 0 0 0 0 0 293 11 1 36 6
7.5-10.0 0 0 0 0 0 0 0 0 0 0 0 0 0
10.0-20.0 0 0 0 0 0 0 0 0 0 0 0 0 0
>20.0 0 0 0 0 0 0 0 0 0 0 0 0 0
All 20 12 52 0 3 1 2 0 91 9161 202 100695 2009
Estd. no of opr holding (00) 2009 1218 5205 0 306 68 162 0 9161 XXX XXX XXX XXX
Sample no. of opr holding 58 50 78 0 5 3 6 0 202 XXX XXX XXX XXX
Table 19.1: Number of household operational holdings reporting at least one plot leased in per 1000 of household operational holdings under different terms of lease by size class of
household operational holding
WEST BENGAL VISIT 1
Size class of operational
holding (ha)
Terms of leaseNo. of operational
holdings
No. of operational
holdings reporting
land leased-in in at
least one plot
A 62

Fixed
money
Fixed
produce
Share of
produce
Service
contract
Share of
produce
together with
other terms
Usufructuary
mortgage
Relatives
under no
specific
terms
Under
other
terms
Any term
of lease
(incl.
n.r. )
Estimated
(00)Sample
Estimated
(00)Sample
(1) (2) (3) (4) (5) (6) (7) (8) (9) (10) (11) (12) (13) (14)
nil 0 0 0 0 0 0 0 0 0 0 0 0 0
>0.000& ≤0.002 0 0 0 0 0 0 0 0 0 0 0 47 4
0.002-0.005 0 0 14 0 0 0 0 0 14 48 2 3376 135
0.005-0.040 2 0 2 0 0 0 0 0 4 89 2 23306 231
0.040-0.5 34 17 80 0 0 0 3 1 134 6875 93 51244 551
0.5-1.0 23 45 130 0 3 0 0 0 197 2907 30 14730 198
1.0-2.0 67 9 57 0 0 4 1 0 139 986 74 7110 663
2.0-3.0 16 0 6 0 0 0 1 0 22 21 6 932 186
3.0-4.0 0 17 78 0 0 0 0 0 95 13 3 136 35
4.0-5.0 161 45 0 0 0 0 0 0 206 9 3 45 11
5.0-7.5 0 293 0 0 0 0 0 0 293 11 1 36 6
7.5-10.0 0 0 0 0 0 0 0 0 0 0 0 0 0
10.0-20.0 0 0 0 0 0 0 0 0 0 0 0 0 0
>20.0 0 0 0 0 0 0 0 0 0 0 0 0 0
All 26 16 65 0 1 0 1 1 109 10959 214 100962 2020
Estd. no of opr holding (00) 2606 1627 6544 0 72 42 146 54 10959 XXX XXX XXX XXX
Sample no. of opr holding 75 44 86 0 2 2 5 3 214 XXX XXX XXX XXX
Table 19.1: Number of household operational holdings reporting at least one plot leased in per 1000 of household operational holdings under different terms of lease by size class of
household operational holding
WEST BENGAL VISIT 2
Size class of operational
holding (ha)
Terms of lease
No. of operational
holdings reporting
land leased-in in at
No. of operational
holdings
A 63
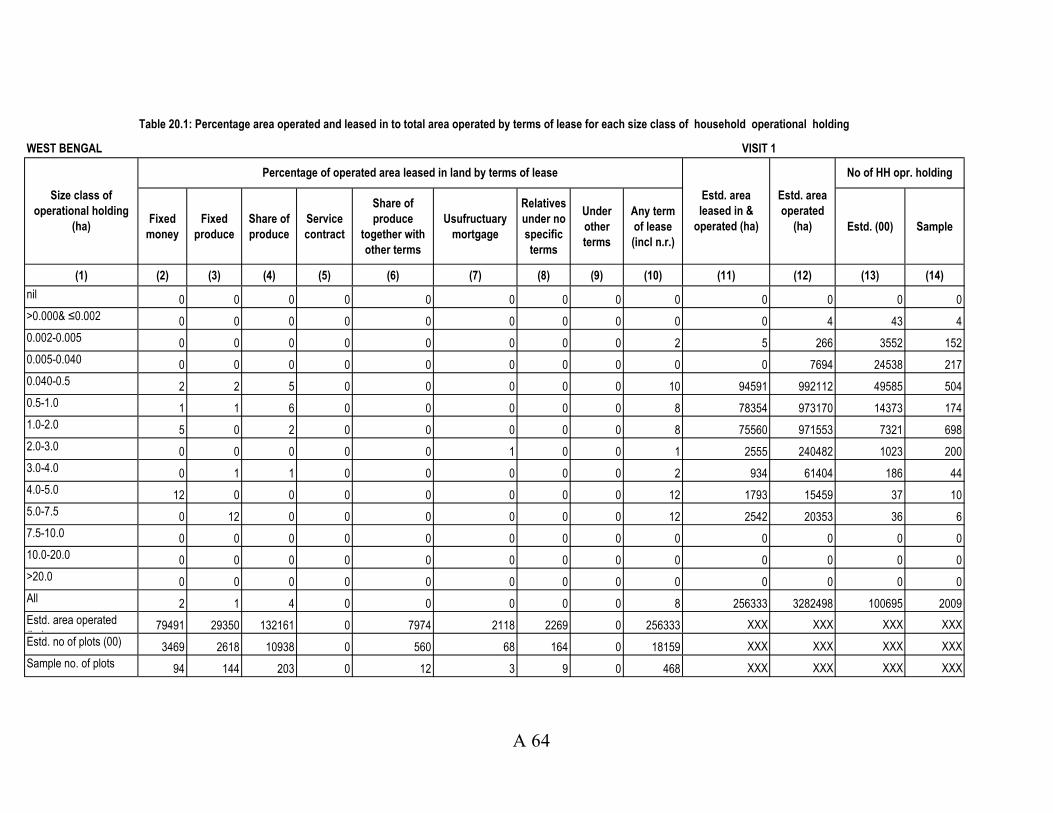
Fixed
money
Fixed
produce
Share of
produce
Service
contract
Share of
produce
together with
other terms
Usufructuary
mortgage
Relatives
under no
specific
terms
Under
other
terms
Any term
of lease
(incl n.r.)
Estd. (00) Sample
(1) (2) (3) (4) (5) (6) (7) (8) (9) (10) (11) (12) (13) (14)
nil 0 0 0 0 0 0 0 0 0 0 0 0 0
>0.000& ≤0.002 0 0 0 0 0 0 0 0 0 0 4 43 4
0.002-0.005 0 0 0 0 0 0 0 0 2 5 266 3552 152
0.005-0.040 0 0 0 0 0 0 0 0 0 0 7694 24538 217
0.040-0.5 2 2 5 0 0 0 0 0 10 94591 992112 49585 504
0.5-1.0 1 1 6 0 0 0 0 0 8 78354 973170 14373 174
1.0-2.0 5 0 2 0 0 0 0 0 8 75560 971553 7321 698
2.0-3.0 0 0 0 0 0 1 0 0 1 2555 240482 1023 200
3.0-4.0 0 1 1 0 0 0 0 0 2 934 61404 186 44
4.0-5.0 12 0 0 0 0 0 0 0 12 1793 15459 37 10
5.0-7.5 0 12 0 0 0 0 0 0 12 2542 20353 36 6
7.5-10.0 0 0 0 0 0 0 0 0 0 0 0 0 0
10.0-20.0 0 0 0 0 0 0 0 0 0 0 0 0 0
>20.0 0 0 0 0 0 0 0 0 0 0 0 0 0
All 2 1 4 0 0 0 0 0 8 256333 3282498 100695 2009
Estd. area operated
(ha)79491 29350 132161 0 7974 2118 2269 0 256333 XXX XXX XXX XXX
Estd. no of plots (00) 3469 2618 10938 0 560 68 164 0 18159 XXX XXX XXX XXX
Sample no. of plots 94 144 203 0 12 3 9 0 468 XXX XXX XXX XXX
Table 20.1: Percentage area operated and leased in to total area operated by terms of lease for each size class of household operational holding
WEST BENGAL VISIT 1
Size class of
operational holding
(ha)
Percentage of operated area leased in land by terms of lease
Estd. area
leased in &
operated (ha)
Estd. area
operated
(ha)
No of HH opr. holding
A 64

Fixed
money
Fixed
produce
Share of
produce
Service
contract
Share of
produce
together with
other terms
Usufructuary
mortgage
Relatives
under no
specific
terms
Under
other
terms
Any term
of lease
(incl n.r.)
Estd. (00) Sample
(1) (2) (3) (4) (5) (6) (7) (8) (9) (10) (11) (12) (13) (14)
nil 0 0 0 0 0 0 0 0 0 0 0 0 0
>0.000& ≤0.002 0 0 0 0 0 0 0 0 0 0 4 47 4
0.002-0.005 0 0 1 0 0 0 0 0 1 5 316 3376 135
0.005-0.040 1 0 1 0 0 0 0 0 3 303 11688 23306 231
0.040-0.5 3 1 6 0 0 0 0 0 10 89561 899672 51244 551
0.5-1.0 1 2 6 0 0 0 0 0 10 75401 761917 14730 198
1.0-2.0 7 1 2 0 0 0 0 0 10 62415 617603 7110 663
2.0-3.0 0 0 0 0 0 0 0 0 0 507 143466 932 186
3.0-4.0 0 1 0 0 0 0 0 0 1 458 36096 136 35
4.0-5.0 10 1 0 0 0 0 0 0 11 1930 17325 45 11
5.0-7.5 0 0 0 0 0 0 0 0 0 0 13575 36 6
7.5-10.0 0 0 0 0 0 0 0 0 0 0 0 0 0
10.0-20.0 0 0 0 0 0 0 0 0 0 0 0 0 0
>20.0 0 0 0 0 0 0 0 0 0 0 0 0 0
All 3 1 5 0 0 0 0 0 9 230579 2501662 100962 2020
Estd. area operated
(ha)79550 30126 114261 0 3456 630 1922 368 230579 XXX XXX XXX XXX
Estd. no of plots (00) 3776 1848 8539 0 141 42 147 27 14595 XXX XXX XXX XXX
Sample no. of plots 111 83 126 0 3 2 7 2 336 XXX XXX XXX XXX
Table 20.2: Percentage area operated and leased in to total area operated by terms of lease for each size class of household operational holding
WEST BENGAL VISIT 2
Size class of
operational holding
(ha)
Percentage of operated area leased in land by terms of lease
Estd. area
leased in &
operated (ha)
Estd. area
operated
(ha)
No of HH opr. holding
A 65

Flooded and
agri. activities
could not be
carried out
Flooded but
agri. activities
were carried
out
Flooded but
the plot was
not for agri.
activities
Not flooded All (incl. n.r.)Area of hh opr
hld (ha)
No of hh opr.
holdi ng (00)
No. of plots
(00)Plots
HH opr.
holding
(1) (2) (3) (4) (5) (6) (7) (8) (9) (10) (11)
nil 0 0 0 0 0 0 0 0 0 0
>0.000& ≤0.002 0 0 0 100 100 9 43 43 4 4
0.002-0.005 0 0 0 100 100 1411 3552 3571 155 152
0.005-0.040 2 0 0 98 100 49528 24538 25132 226 217
0.040-0.5 1 7 0 92 100 1105497 49585 136180 1428 504
0.5-1.0 1 5 0 94 100 1014286 14373 69875 893 174
1.0-2.0 0 4 0 95 100 1002001 7321 52422 4828 698
2.0-3.0 1 8 0 92 100 246482 1023 9461 1707 200
3.0-4.0 1 5 0 93 100 62703 186 1688 395 44
4.0-5.0 0 1 0 99 100 15678 37 326 94 10
5.0-7.5 0 0 0 100 100 21255 36 764 97 6
7.5-10.0 0 0 0 0 0 0 0 0 0 0
10.0-20.0 0 0 0 0 0 0 0 0 0 0
>20.0 0 0 0 0 0 0 0 0 0 0
All 1 6 0 94 100 3518849 100695 299462 9827 2009
Estd. area (ha) 24757 186232 2860 3102337 3316963 XXX XXX XXX XXX XXX
Estd. no of plots (00) 1979 12856 340 284163 299462 XXX XXX XXX XXX XXX
Sample no. of plots 131 498 34 9158 9827 XXX XXX XXX XXX XXX
Table 21.1: Percentage distribution of area of land possessed by households affected by flood / not flooded for each size class of
household operational holding
WEST BENGAL VISIT 1
Size class of
operational holding
(ha)
Percentage distribution of area of land Estdimated Sample
A 66

Flooded and
agri. activities
could not be
carried out
Flooded but
agri. activities
were carried
out
Flooded but
the plot was
not for agri.
activities
Not flooded All (incl. n.r.)Area of hh opr
hld (ha)
No of hh opr.
holdi ng (00)
No. of plots
(00)Plots
HH opr.
holding
(1) (2) (3) (4) (5) (6) (7) (8) (9) (10) (11)
nil 0 0 0 0 0 0 0 0 0 0
>0.000& ≤0.002 0 0 0 100 100 9 47 47 4 4
0.002-0.005 2 0 0 98 100 1352 3376 3389 137 135
0.005-0.040 0 0 0 100 100 47763 23306 23944 246 231
0.040-0.5 0 4 0 96 100 1138590 51244 135634 1514 551
0.5-1.0 0 0 0 100 100 1043577 14730 70208 977 198
1.0-2.0 0 1 0 99 100 980273 7110 51378 4622 663
2.0-3.0 0 2 0 98 100 224638 932 9007 1663 186
3.0-4.0 0 0 0 100 100 45477 136 1272 315 35
4.0-5.0 0 0 0 100 100 19600 45 418 104 11
5.0-7.5 0 0 0 100 100 21112 36 764 97 6
7.5-10.0 0 0 0 0 0 0 0 0 0 0
10.0-20.0 0 0 0 0 0 0 0 0 0 0
>20.0 0 0 0 0 0 0 0 0 0 0
All 0 2 0 98 100 3522390 100962 296060 9679 2020
Estd. area (ha) 7614 53664 517 3265036 3326882 XXX XXX XXX XXX XXX
Estd. no of plots (00) 787 3383 72 291745 296060 XXX XXX XXX XXX XXX
Sample no. of plots 25 146 5 9501 9679 XXX XXX XXX XXX XXX
Table 21.2: Percentage distribution of area of land possessed by households affected by flood / not flooded for each size class of
household operational holding
WEST BENGAL VISIT 2
Size class of
operational holding
(ha)
Percentage distribution of area of land Estdimated Sample
A 67
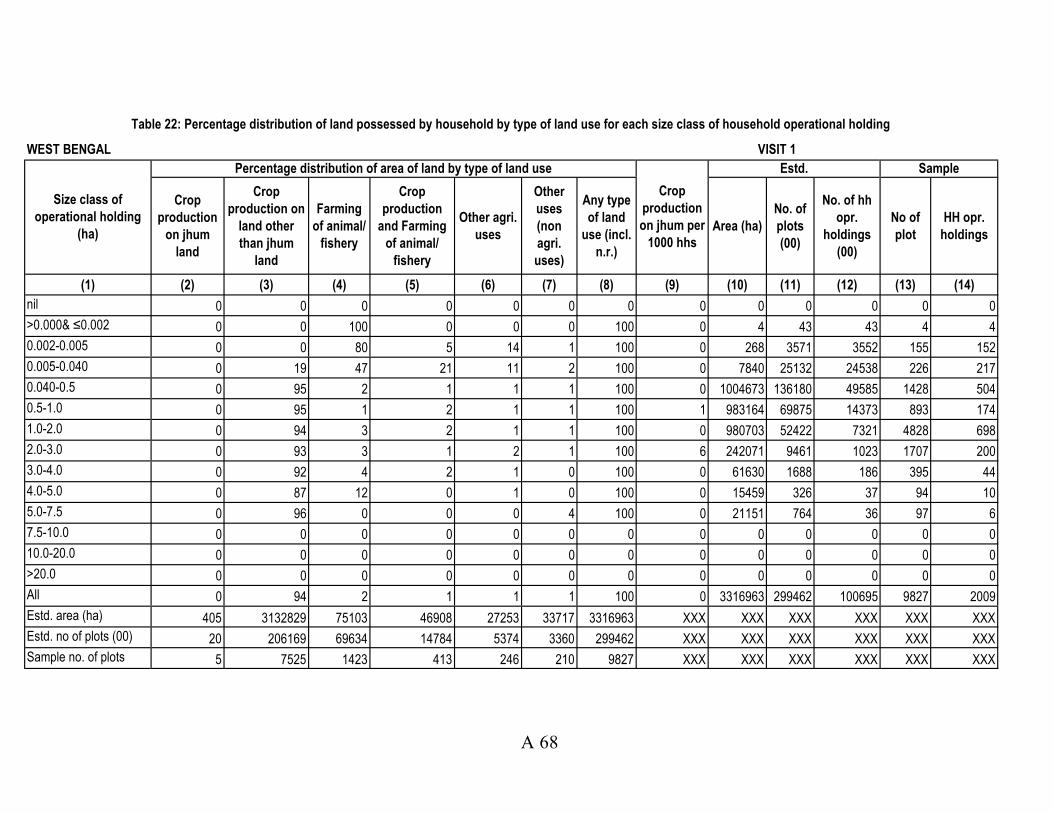
Crop
production
on jhum
land
Crop
production on
land other
than jhum
land
Farming
of animal/
fishery
Crop
production
and Farming
of animal/
fishery
Other agri.
uses
Other
uses
(non
agri.
uses)
Any type
of land
use (incl.
n.r.)
Area (ha)
No. of
plots
(00)
No. of hh
opr.
holdings
(00)
No of
plot
HH opr.
holdings
(1) (2) (3) (4) (5) (6) (7) (8) (9) (10) (11) (12) (13) (14)
nil 0 0 0 0 0 0 0 0 0 0 0 0 0
>0.000& ≤0.002 0 0 100 0 0 0 100 0 4 43 43 4 4
0.002-0.005 0 0 80 5 14 1 100 0 268 3571 3552 155 152
0.005-0.040 0 19 47 21 11 2 100 0 7840 25132 24538 226 217
0.040-0.5 0 95 2 1 1 1 100 0 1004673 136180 49585 1428 504
0.5-1.0 0 95 1 2 1 1 100 1 983164 69875 14373 893 174
1.0-2.0 0 94 3 2 1 1 100 0 980703 52422 7321 4828 698
2.0-3.0 0 93 3 1 2 1 100 6 242071 9461 1023 1707 200
3.0-4.0 0 92 4 2 1 0 100 0 61630 1688 186 395 44
4.0-5.0 0 87 12 0 1 0 100 0 15459 326 37 94 10
5.0-7.5 0 96 0 0 0 4 100 0 21151 764 36 97 6
7.5-10.0 0 0 0 0 0 0 0 0 0 0 0 0 0
10.0-20.0 0 0 0 0 0 0 0 0 0 0 0 0 0
>20.0 0 0 0 0 0 0 0 0 0 0 0 0 0
All 0 94 2 1 1 1 100 0 3316963 299462 100695 9827 2009
Estd. area (ha) 405 3132829 75103 46908 27253 33717 3316963 XXX XXX XXX XXX XXX XXX
Estd. no of plots (00) 20 206169 69634 14784 5374 3360 299462 XXX XXX XXX XXX XXX XXX
Sample no. of plots 5 7525 1423 413 246 210 9827 XXX XXX XXX XXX XXX XXX
Table 22: Percentage distribution of land possessed by household by type of land use for each size class of household operational holding
WEST BENGAL VISIT 1
Size class of
operational holding
(ha)
Percentage distribution of area of land by type of land use Estd. Sample
Crop
production
on jhum per
1000 hhs
A 68

Crop
production
on jhum
land
Crop
production on
land other
than jhum
land
Farming
of animal/
fishery
Crop
production
and Farming
of animal/
fishery
Other agri.
uses
Other
uses
(non
agri.
uses)
Any type
of land
use (incl.
n.r.)
Area (ha)
No. of
plots
(00)
No. of hh
opr.
holdings
(00)
No of
plot
HH opr.
holdings
(1) (2) (3) (4) (5) (6) (7) (8) (9) (10) (11) (12) (13) (14)
nil 0 0 0 0 0 0 0 0 0 0 0 0 0
>0.000& ≤0.002 0 0 100 0 0 0 100 0 4 47 47 4 4
0.002-0.005 0 1 86 6 6 0 100 0 317 3389 3376 137 135
0.005-0.040 0 25 34 37 4 0 100 0 11688 23944 23306 246 231
0.040-0.5 1 82 3 1 1 13 100 9 1033075 135634 51244 1514 551
0.5-1.0 0 72 1 1 0 25 100 8 1015120 70208 14730 977 198
1.0-2.0 0 59 3 1 1 36 100 12 959862 51378 7110 4622 663
2.0-3.0 0 57 3 1 3 35 100 1 221504 9007 932 1663 186
3.0-4.0 0 77 2 0 1 20 100 0 44943 1272 136 315 35
4.0-5.0 0 84 0 6 0 11 100 0 19364 418 45 104 11
5.0-7.5 0 64 0 0 0 35 100 0 21007 764 36 97 6
7.5-10.0 0 0 0 0 0 0 0 0 0 0 0 0 0
10.0-20.0 0 0 0 0 0 0 0 0 0 0 0 0 0
>20.0 0 0 0 0 0 0 0 0 0 0 0 0 0
All 0 70 3 1 1 25 100 7 3326882 296060 100962 9679 2020
Estd. area (ha) 12815 2329450 83474 48583 27339 825197 3326882 XXX XXX XXX XXX XXX XXX
Estd. no of plots (00) 1266 147597 64582 16563 4570 61481 296060 XXX XXX XXX XXX XXX XXX
Sample no. of plots 47 5335 1368 459 133 2336 9679 XXX XXX XXX XXX XXX XXX
Table 22: Percentage distribution of land possessed by household by type of land use for each size class of household operational holding
WEST BENGAL VISIT 2
Size class of
operational holding
(ha)
Percentage distribution of area of land by type of land use
Crop
production
on jhum per
1000 hhs
Estd. Sample
A 69
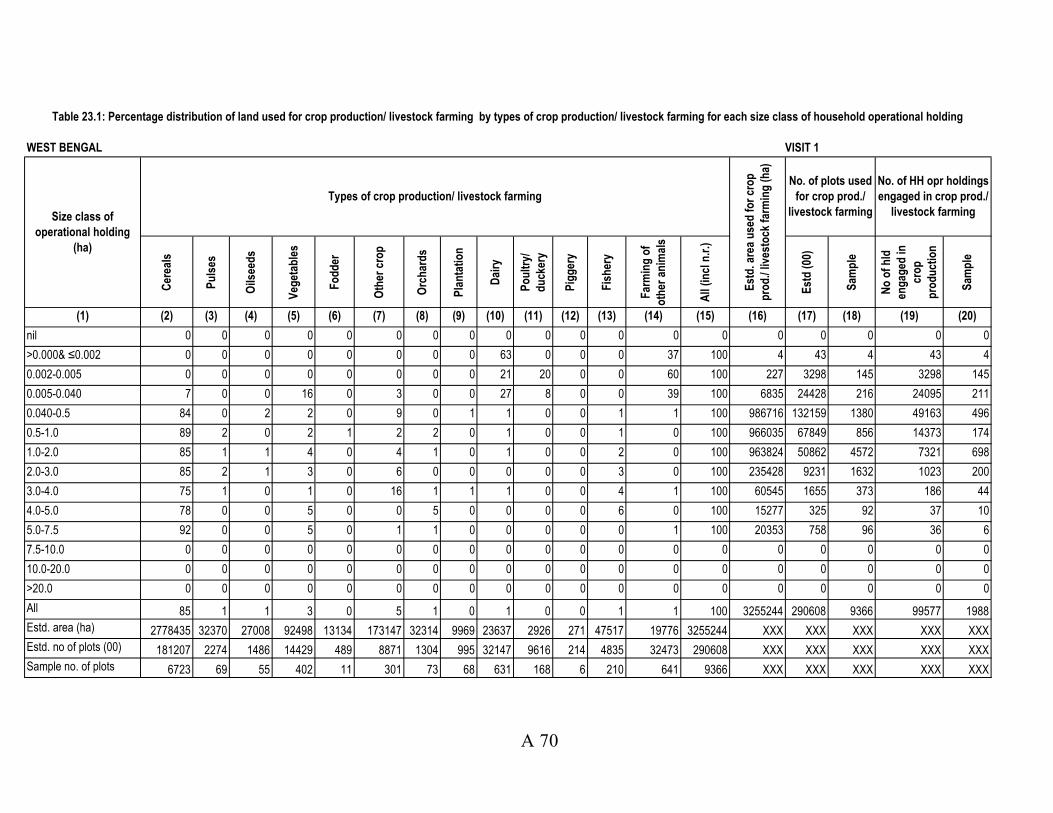
Cer
eals
Pu
lses
Oils
eed
s
Veg
etab
les
Fo
dd
er
Oth
er c
rop
Orc
har
ds
Pla
nta
tio
n
Dai
ry
Po
ult
ry/
du
cker
y
Pig
ger
y
Fis
her
y
Far
min
g o
f
oth
er a
nim
als
All
(in
cl n
.r.)
Est
d (
00)
Sam
ple
No
of
hld
eng
aged
in
cro
p
pro
du
ctio
n
Sam
ple
(1) (2) (3) (4) (5) (6) (7) (8) (9) (10) (11) (12) (13) (14) (15) (16) (17) (18) (19) (20)
nil 0 0 0 0 0 0 0 0 0 0 0 0 0 0 0 0 0 0 0
>0.000& ≤0.002 0 0 0 0 0 0 0 0 63 0 0 0 37 100 4 43 4 43 4
0.002-0.005 0 0 0 0 0 0 0 0 21 20 0 0 60 100 227 3298 145 3298 145
0.005-0.040 7 0 0 16 0 3 0 0 27 8 0 0 39 100 6835 24428 216 24095 211
0.040-0.5 84 0 2 2 0 9 0 1 1 0 0 1 1 100 986716 132159 1380 49163 496
0.5-1.0 89 2 0 2 1 2 2 0 1 0 0 1 0 100 966035 67849 856 14373 174
1.0-2.0 85 1 1 4 0 4 1 0 1 0 0 2 0 100 963824 50862 4572 7321 698
2.0-3.0 85 2 1 3 0 6 0 0 0 0 0 3 0 100 235428 9231 1632 1023 200
3.0-4.0 75 1 0 1 0 16 1 1 1 0 0 4 1 100 60545 1655 373 186 44
4.0-5.0 78 0 0 5 0 0 5 0 0 0 0 6 0 100 15277 325 92 37 10
5.0-7.5 92 0 0 5 0 1 1 0 0 0 0 0 1 100 20353 758 96 36 6
7.5-10.0 0 0 0 0 0 0 0 0 0 0 0 0 0 0 0 0 0 0 0
10.0-20.0 0 0 0 0 0 0 0 0 0 0 0 0 0 0 0 0 0 0 0
>20.0 0 0 0 0 0 0 0 0 0 0 0 0 0 0 0 0 0 0 0
All 85 1 1 3 0 5 1 0 1 0 0 1 1 100 3255244 290608 9366 99577 1988
Estd. area (ha) 2778435 32370 27008 92498 13134 173147 32314 9969 23637 2926 271 47517 19776 3255244 XXX XXX XXX XXX XXX
Estd. no of plots (00) 181207 2274 1486 14429 489 8871 1304 995 32147 9616 214 4835 32473 290608 XXX XXX XXX XXX XXX
Sample no. of plots 6723 69 55 402 11 301 73 68 631 168 6 210 641 9366 XXX XXX XXX XXX XXX
Table 23.1: Percentage distribution of land used for crop production/ livestock farming by types of crop production/ livestock farming for each size class of household operational holding
WEST BENGAL VISIT 1
Size class of
operational holding
(ha)
Types of crop production/ livestock farming
Est
d. a
rea
use
d f
or
cro
p
pro
d./
lives
tock
far
min
g (
ha)
No. of plots used
for crop prod./
livestock farming
No. of HH opr holdings
engaged in crop prod./
livestock farming
A 70
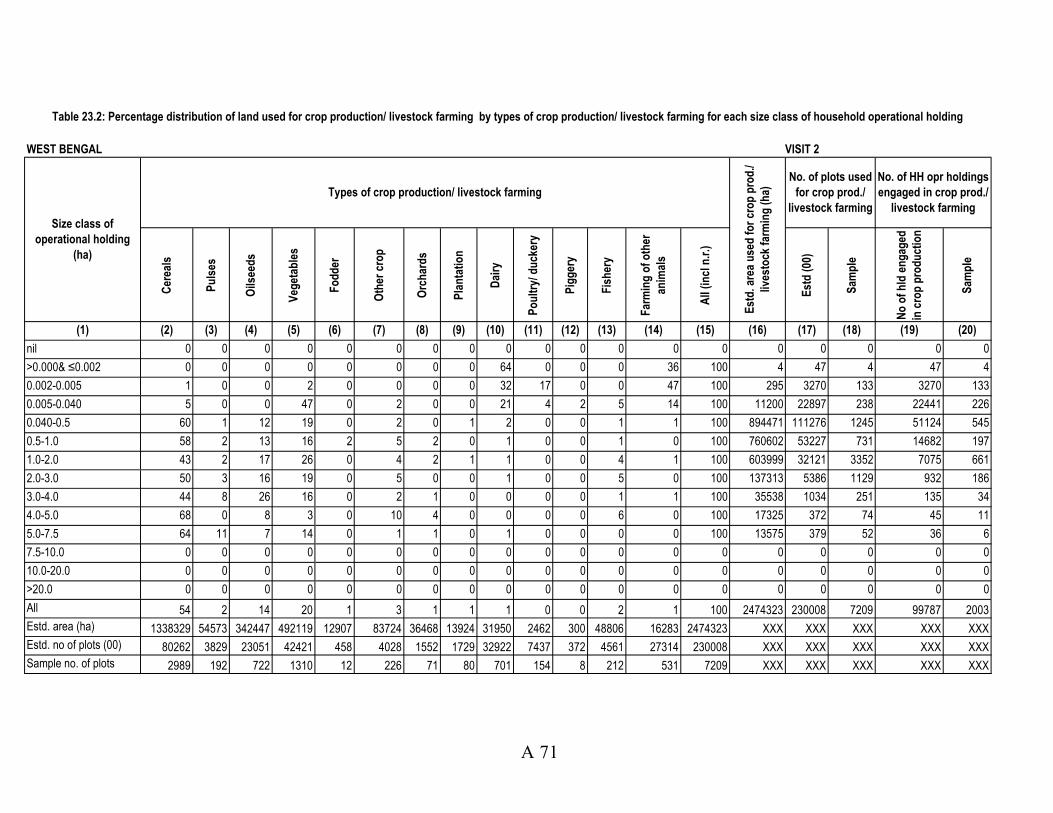
Cer
eals
Pu
lses
Oils
eed
s
Veg
etab
les
Fo
dd
er
Oth
er c
rop
Orc
har
ds
Pla
nta
tio
n
Dai
ry
Po
ult
ry/ d
uck
ery
Pig
ger
y
Fis
her
y
Far
min
g o
f o
ther
anim
als
All
(in
cl n
.r.)
Est
d (
00)
Sam
ple
No
of
hld
en
gag
ed
in c
rop
pro
du
ctio
n
Sam
ple
(1) (2) (3) (4) (5) (6) (7) (8) (9) (10) (11) (12) (13) (14) (15) (16) (17) (18) (19) (20)
nil 0 0 0 0 0 0 0 0 0 0 0 0 0 0 0 0 0 0 0
>0.000& ≤0.002 0 0 0 0 0 0 0 0 64 0 0 0 36 100 4 47 4 47 4
0.002-0.005 1 0 0 2 0 0 0 0 32 17 0 0 47 100 295 3270 133 3270 133
0.005-0.040 5 0 0 47 0 2 0 0 21 4 2 5 14 100 11200 22897 238 22441 226
0.040-0.5 60 1 12 19 0 2 0 1 2 0 0 1 1 100 894471 111276 1245 51124 545
0.5-1.0 58 2 13 16 2 5 2 0 1 0 0 1 0 100 760602 53227 731 14682 197
1.0-2.0 43 2 17 26 0 4 2 1 1 0 0 4 1 100 603999 32121 3352 7075 661
2.0-3.0 50 3 16 19 0 5 0 0 1 0 0 5 0 100 137313 5386 1129 932 186
3.0-4.0 44 8 26 16 0 2 1 0 0 0 0 1 1 100 35538 1034 251 135 34
4.0-5.0 68 0 8 3 0 10 4 0 0 0 0 6 0 100 17325 372 74 45 11
5.0-7.5 64 11 7 14 0 1 1 0 1 0 0 0 0 100 13575 379 52 36 6
7.5-10.0 0 0 0 0 0 0 0 0 0 0 0 0 0 0 0 0 0 0 0
10.0-20.0 0 0 0 0 0 0 0 0 0 0 0 0 0 0 0 0 0 0 0
>20.0 0 0 0 0 0 0 0 0 0 0 0 0 0 0 0 0 0 0 0
All 54 2 14 20 1 3 1 1 1 0 0 2 1 100 2474323 230008 7209 99787 2003
Estd. area (ha) 1338329 54573 342447 492119 12907 83724 36468 13924 31950 2462 300 48806 16283 2474323 XXX XXX XXX XXX XXX
Estd. no of plots (00) 80262 3829 23051 42421 458 4028 1552 1729 32922 7437 372 4561 27314 230008 XXX XXX XXX XXX XXX
Sample no. of plots 2989 192 722 1310 12 226 71 80 701 154 8 212 531 7209 XXX XXX XXX XXX XXX
Table 23.2: Percentage distribution of land used for crop production/ livestock farming by types of crop production/ livestock farming for each size class of household operational holding
WEST BENGAL VISIT 2
Size class of
operational holding
(ha)
Types of crop production/ livestock farming
Est
d. a
rea
use
d f
or
cro
p p
rod
./
lives
tock
far
min
g (
ha)
No. of plots used
for crop prod./
livestock farming
No. of HH opr holdings
engaged in crop prod./
livestock farming
A 71
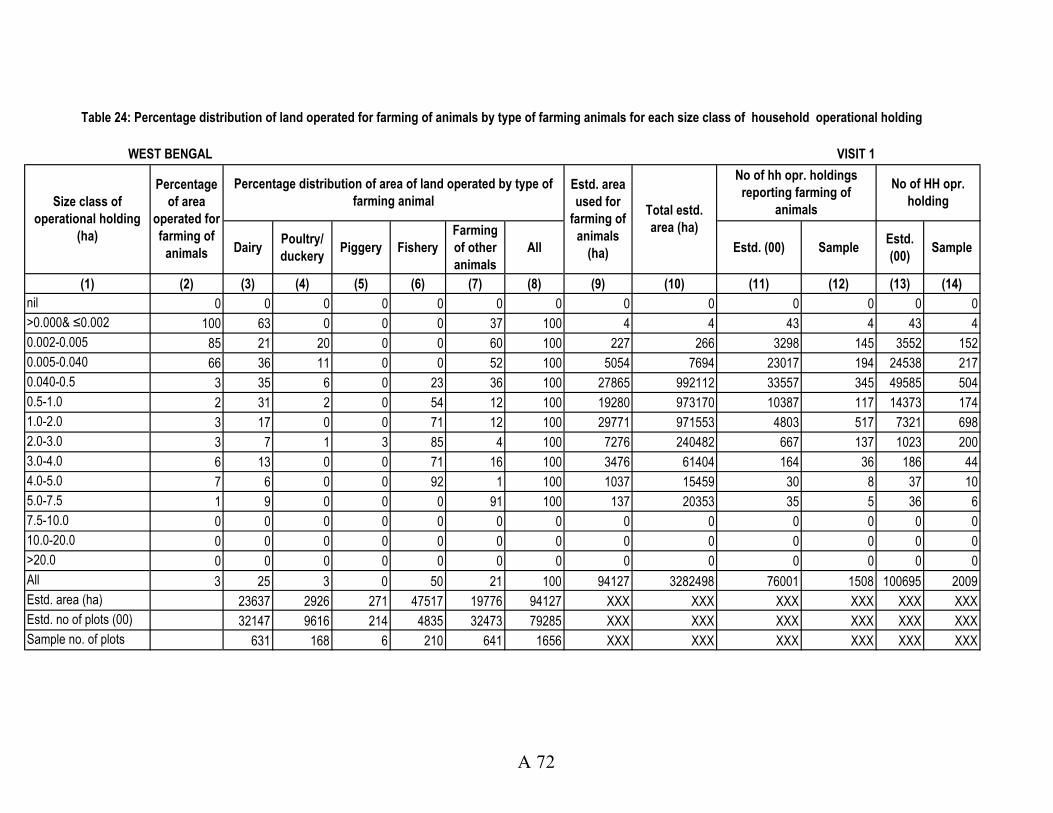
DairyPoultry/
duckeryPiggery Fishery
Farming
of other
animals
All Estd. (00) SampleEstd.
(00)Sample
(1) (2) (3) (4) (5) (6) (7) (8) (9) (10) (11) (12) (13) (14)
nil 0 0 0 0 0 0 0 0 0 0 0 0 0
>0.000& ≤0.002 100 63 0 0 0 37 100 4 4 43 4 43 4
0.002-0.005 85 21 20 0 0 60 100 227 266 3298 145 3552 152
0.005-0.040 66 36 11 0 0 52 100 5054 7694 23017 194 24538 217
0.040-0.5 3 35 6 0 23 36 100 27865 992112 33557 345 49585 504
0.5-1.0 2 31 2 0 54 12 100 19280 973170 10387 117 14373 174
1.0-2.0 3 17 0 0 71 12 100 29771 971553 4803 517 7321 698
2.0-3.0 3 7 1 3 85 4 100 7276 240482 667 137 1023 200
3.0-4.0 6 13 0 0 71 16 100 3476 61404 164 36 186 44
4.0-5.0 7 6 0 0 92 1 100 1037 15459 30 8 37 10
5.0-7.5 1 9 0 0 0 91 100 137 20353 35 5 36 6
7.5-10.0 0 0 0 0 0 0 0 0 0 0 0 0 0
10.0-20.0 0 0 0 0 0 0 0 0 0 0 0 0 0
>20.0 0 0 0 0 0 0 0 0 0 0 0 0 0
All 3 25 3 0 50 21 100 94127 3282498 76001 1508 100695 2009
Estd. area (ha) 23637 2926 271 47517 19776 94127 XXX XXX XXX XXX XXX XXX
Estd. no of plots (00) 32147 9616 214 4835 32473 79285 XXX XXX XXX XXX XXX XXX
Sample no. of plots 631 168 6 210 641 1656 XXX XXX XXX XXX XXX XXX
Table 24: Percentage distribution of land operated for farming of animals by type of farming animals for each size class of household operational holding
WEST BENGAL VISIT 1
Size class of
operational holding
(ha)
Percentage
of area
operated for
farming of
animals
Estd. area
used for
farming of
animals
(ha)
Total estd.
area (ha)
No of hh opr. holdings
reporting farming of
animals
No of HH opr.
holding
Percentage distribution of area of land operated by type of
farming animal
A 72

DairyPoultry/
duckeryPiggery Fishery
Farming
of other
animals
All Estd. (00) SampleEstd.
(00)Sample
(1) (2) (3) (4) (5) (6) (7) (8) (9) (10) (11) (12) (13) (14)
nil 0 0 0 0 0 0 0 0 0 0 0 0 0
>0.000& ≤0.002 100 64 0 0 0 36 100 4 4 47 4 47 4
0.002-0.005 90 34 17 0 0 49 100 285 316 3211 127 3376 135
0.005-0.040 43 46 9 5 10 30 100 5045 11688 18753 179 23306 231
0.040-0.5 4 48 5 0 26 21 100 35843 899672 32613 358 51244 551
0.5-1.0 2 39 1 0 44 16 100 16985 761917 10036 143 14730 198
1.0-2.0 5 15 0 0 74 11 100 31032 617603 4562 477 7110 663
2.0-3.0 6 11 0 0 85 4 100 8445 143466 505 121 932 186
3.0-4.0 3 15 1 0 53 31 100 986 36096 122 28 136 35
4.0-5.0 6 8 0 0 92 0 100 1039 17325 36 7 45 11
5.0-7.5 1 76 0 0 0 24 100 137 13575 35 5 36 6
7.5-10.0 0 0 0 0 0 0 0 0 0 0 0 0 0
10.0-20.0 0 0 0 0 0 0 0 0 0 0 0 0 0
>20.0 0 0 0 0 0 0 0 0 0 0 0 0 0
All 4 32 2 0 49 16 100 99802 2501662 69919 1449 100962 2020
Estd. area (ha) 31950 2462 300 48806 16283 99802 XXX XXX XXX XXX XXX XXX
Estd. no of plots (00) 32922 7437 372 4561 27314 72607 XXX XXX XXX XXX XXX XXX
Sample no. of plots 701 154 8 212 531 1606 XXX XXX XXX XXX XXX XXX
Table 24: Percentage distribution of land operated for farming of animals by type of farming animals for each size class of household operational holding
WEST BENGAL VISIT 2
Size class of
operational holding
(ha)
Percentage
of area
operated for
farming of
animals
Percentage distribution of area of land operated by type of
farming animalEstd. area
used for
farming of
animals
(ha)
Total estd.
area (ha)
No of hh opr. holdings
reporting farming of
animals
No of HH opr.
holding
A 73

Used for growing
more than one crop
(ha)
Used for
growing crop
(ha)
All (ha) Estd (00) Sample Estd (00) Sample Estd (00) Sample Estd (00) Sample Estd (00) Sample Estd (00) Sample
(1) (2) (3) (4) (5) (6) (7) (8) (9) (10) (11) (12) (13) (140 (15) (16)
nil 0 0 0 0 0 0 0 0 0 0 0 0 0 0 0
>0.000& ≤0.002 0 0 0 0 0 0 0 43 4 0 0 0 0 85 8
0.002-0.005 0 0 0 0 0 0 0 3552 152 0 0 0 0 7192 311
0.005-0.040 800 981 1781 459 7 1305 19 24538 217 547 9 1411 22 50357 457
0.040-0.5 320690 637960 958650 16191 160 46925 471 49585 504 28146 312 96880 1022 186291 1946
0.5-1.0 313190 633564 946755 8221 80 14298 171 14373 174 17772 183 56481 725 84304 1085
1.0-2.0 313928 618842 932980 4420 296 7262 692 7321 698 13972 878 45398 3978 61228 5590
2.0-3.0 88160 139862 228022 716 124 1021 198 1023 200 2691 448 8428 1457 10725 1936
3.0-4.0 27857 29212 57069 129 25 186 44 186 44 507 75 1448 327 1876 440
4.0-5.0 2098 9907 13402 17 3 35 9 37 10 47 7 283 80 379 107
5.0-7.5 761 19455 20216 6 2 36 6 36 6 7 3 723 91 800 103
7.5-10.0 0 0 0 0 0 0 0 0 0 0 0 0 0 0 0
10.0-20.0 0 0 0 0 0 0 0 0 0 0 0 0 0 0 0
>20.0 0 0 0 0 0 0 0 0 0 0 0 0 0 0 0
All 1067485 2089782 3158874 30158 697 71068 1610 100695 2009 63689 1915 211054 7702 403237 11983
Table 25.1: Estimated area of land, number of household operational holdings and no. of plots used for growing more than one crop by size class of household operational holdings
WEST BENGAL VISIT 1
Size class of
operational
holding (ha)
Estimated area of landNo of hh opr hld
growing > one crop
No of plots used for
growing>one crop
No of plots used for
growing cropsNo of plots
No of hh opr hld
growing cropsNo of hhd opr. Hld
A 74
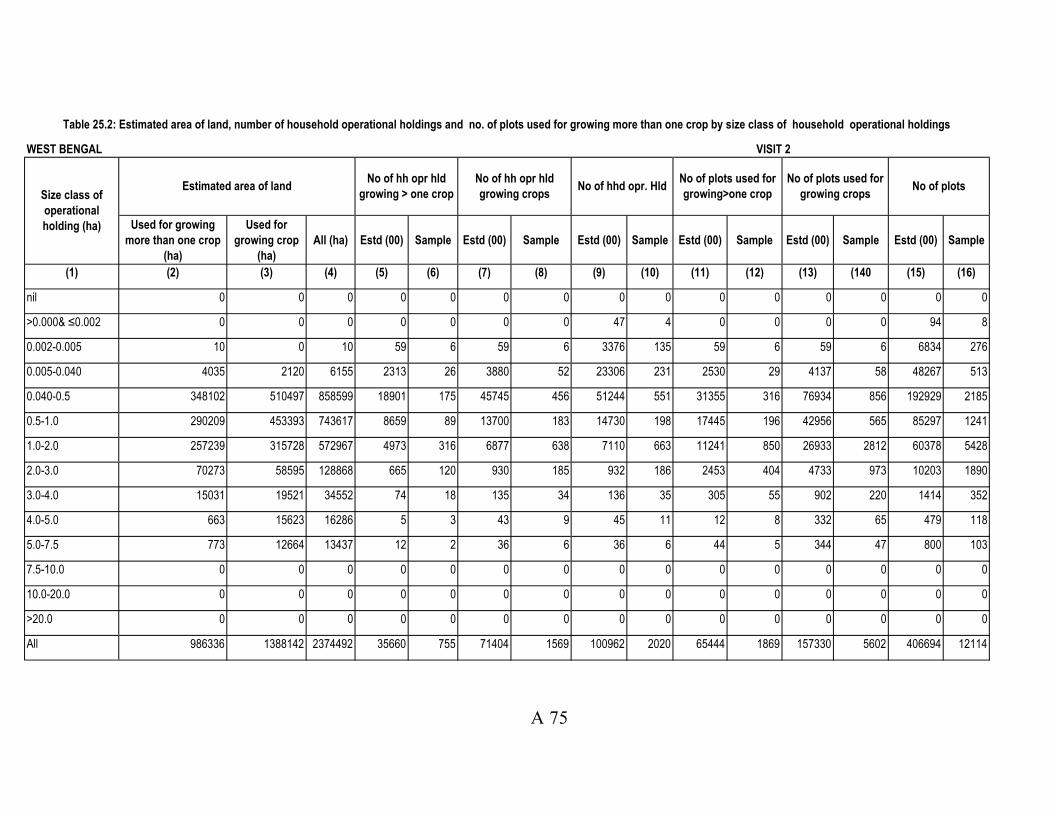
Used for growing
more than one crop
(ha)
Used for
growing crop
(ha)
All (ha) Estd (00) Sample Estd (00) Sample Estd (00) Sample Estd (00) Sample Estd (00) Sample Estd (00) Sample
(1) (2) (3) (4) (5) (6) (7) (8) (9) (10) (11) (12) (13) (140 (15) (16)
nil 0 0 0 0 0 0 0 0 0 0 0 0 0 0 0
>0.000& ≤0.002 0 0 0 0 0 0 0 47 4 0 0 0 0 94 8
0.002-0.005 10 0 10 59 6 59 6 3376 135 59 6 59 6 6834 276
0.005-0.040 4035 2120 6155 2313 26 3880 52 23306 231 2530 29 4137 58 48267 513
0.040-0.5 348102 510497 858599 18901 175 45745 456 51244 551 31355 316 76934 856 192929 2185
0.5-1.0 290209 453393 743617 8659 89 13700 183 14730 198 17445 196 42956 565 85297 1241
1.0-2.0 257239 315728 572967 4973 316 6877 638 7110 663 11241 850 26933 2812 60378 5428
2.0-3.0 70273 58595 128868 665 120 930 185 932 186 2453 404 4733 973 10203 1890
3.0-4.0 15031 19521 34552 74 18 135 34 136 35 305 55 902 220 1414 352
4.0-5.0 663 15623 16286 5 3 43 9 45 11 12 8 332 65 479 118
5.0-7.5 773 12664 13437 12 2 36 6 36 6 44 5 344 47 800 103
7.5-10.0 0 0 0 0 0 0 0 0 0 0 0 0 0 0 0
10.0-20.0 0 0 0 0 0 0 0 0 0 0 0 0 0 0 0
>20.0 0 0 0 0 0 0 0 0 0 0 0 0 0 0 0
All 986336 1388142 2374492 35660 755 71404 1569 100962 2020 65444 1869 157330 5602 406694 12114
Table 25.2: Estimated area of land, number of household operational holdings and no. of plots used for growing more than one crop by size class of household operational holdings
WEST BENGAL VISIT 2
Size class of
operational
holding (ha)
Estimated area of landNo of hh opr hld
growing > one crop
No of hh opr hld
growing cropsNo of hhd opr. Hld
No of plots used for
growing>one crop
No of plots used for
growing cropsNo of plots
A 75

Canal
Minor
surface
works
Ground
water
Combination
of these three
sources
Others
Any
source
(incl. n.r.)
Irrigated Unirrigated Estd.(00) Sample Estd.(00) Sample
(1) (2) (3) (4) (5) (6) (7) (8) 9) (10) (11) (12) (13) (14) (15)
nil 0 0 0 0 0 0 0 0 0 0 0 0 0 0
>0.000& ≤0.002 0 0 0 0 0 0 0 9 0 0 0 0 0 0
0.002-0.005 0 0 0 0 0 0 0 1411 0 0 0 0 0 0
0.005-0.040 23 22 15 40 0 100 929 49528 929 851 497 8 1305 19
0.040-0.5 13 6 73 6 2 100 599201 1105497 597648 350841 29782 278 46925 471
0.5-1.0 23 15 57 1 4 100 562064 1014286 548834 378001 11138 120 14298 171
1.0-2.0 11 24 54 3 8 100 598857 1002001 590550 330442 6060 516 7262 692
2.0-3.0 18 19 54 2 7 100 158943 246482 158289 68806 875 165 1021 198
3.0-4.0 2 6 83 9 0 100 47211 62703 46360 9476 181 39 186 44
4.0-5.0 23 0 76 1 0 100 6120 15678 6120 5115 25 5 35 9
5.0-7.5 8 5 87 0 0 100 13258 21255 13258 6792 31 5 36 6
7.5-10.0 0 0 0 0 0 0 0 0 0 0 0 0 0 0
10.0-20.0 0 0 0 0 0 0 0 0 0 0 0 0 0 0
>20.0 0 0 0 0 0 0 0 0 0 0 0 0 0 0
All 15 15 61 3 5 100 1986583 3518849 1961987 1150325 48589 1136 71068 1610
Estd. area (0.00 ha) 304610 295560 1220690 67864 97812 1986583 XXX XXX XXX XXX XXX XXX XXX XXX
Estd. no of hh opr.
holdings (00) 9133 8310 33757 2160 3887 48589 XXX XXX XXX XXX XXX XXX XXX XXX
Sample no. of hh opr.
holdings 205 230 789 61 98 1136 XXX XXX XXX XXX XXX XXX XXX XXX
Table 26.2: Percentage of irrigated area of land used for crop production by size class of household operational holding
Estd. cultivated area (ha)
No of hh opr. holdings
engaged in crop
production
WEST BENGAL VISIT 1
Size class of
operational holding
(ha)
Percentage of irrigation land with irrigation facilities
Estimated
total area
(ha)
No. of hh opr. holding
using irrigation
facilities
Estd. total
area (ha)
A 76
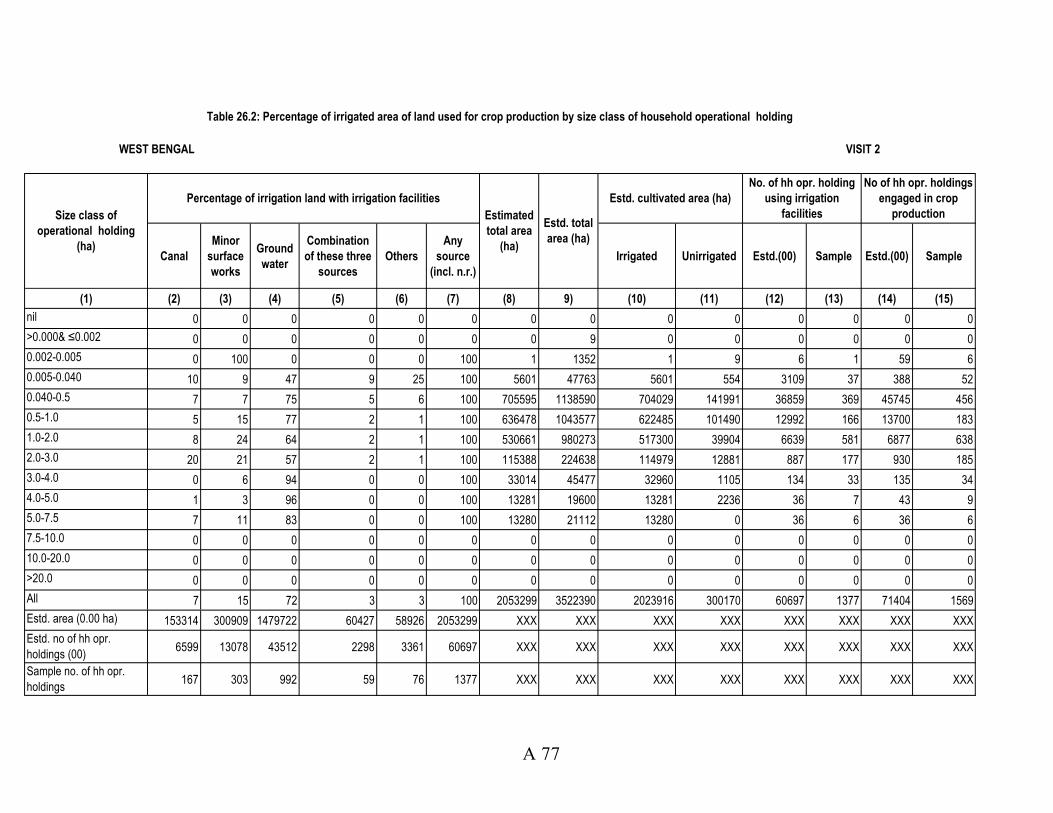
Canal
Minor
surface
works
Ground
water
Combination
of these three
sources
Others
Any
source
(incl. n.r.)
Irrigated Unirrigated Estd.(00) Sample Estd.(00) Sample
(1) (2) (3) (4) (5) (6) (7) (8) 9) (10) (11) (12) (13) (14) (15)
nil 0 0 0 0 0 0 0 0 0 0 0 0 0 0
>0.000& ≤0.002 0 0 0 0 0 0 0 9 0 0 0 0 0 0
0.002-0.005 0 100 0 0 0 100 1 1352 1 9 6 1 59 6
0.005-0.040 10 9 47 9 25 100 5601 47763 5601 554 3109 37 388 52
0.040-0.5 7 7 75 5 6 100 705595 1138590 704029 141991 36859 369 45745 456
0.5-1.0 5 15 77 2 1 100 636478 1043577 622485 101490 12992 166 13700 183
1.0-2.0 8 24 64 2 1 100 530661 980273 517300 39904 6639 581 6877 638
2.0-3.0 20 21 57 2 1 100 115388 224638 114979 12881 887 177 930 185
3.0-4.0 0 6 94 0 0 100 33014 45477 32960 1105 134 33 135 34
4.0-5.0 1 3 96 0 0 100 13281 19600 13281 2236 36 7 43 9
5.0-7.5 7 11 83 0 0 100 13280 21112 13280 0 36 6 36 6
7.5-10.0 0 0 0 0 0 0 0 0 0 0 0 0 0 0
10.0-20.0 0 0 0 0 0 0 0 0 0 0 0 0 0 0
>20.0 0 0 0 0 0 0 0 0 0 0 0 0 0 0
All 7 15 72 3 3 100 2053299 3522390 2023916 300170 60697 1377 71404 1569
Estd. area (0.00 ha) 153314 300909 1479722 60427 58926 2053299 XXX XXX XXX XXX XXX XXX XXX XXX
Estd. no of hh opr.
holdings (00)6599 13078 43512 2298 3361 60697 XXX XXX XXX XXX XXX XXX XXX XXX
Sample no. of hh opr.
holdings167 303 992 59 76 1377 XXX XXX XXX XXX XXX XXX XXX XXX
Table 26.2: Percentage of irrigated area of land used for crop production by size class of household operational holding
WEST BENGAL VISIT 2
Size class of
operational holding
(ha)
Percentage of irrigation land with irrigation facilities
Estimated
total area
(ha)
Estd. total
area (ha)
Estd. cultivated area (ha)
No. of hh opr. holding
using irrigation
facilities
No of hh opr. holdings
engaged in crop
production
A 77

2 3 4 >4 All (incl n.r) Estd (00) Sample Estd (00) Sample
(1) (2) (3) (4) (5) (6) (7) (8) (9) (10)
nil 0 0 0 0 0 0 0 0 0
>0.000& ≤0.002 0 0 0 0 0 0 0 43 4
0.002-0.005 0 0 0 0 0 0 0 3552 152
0.005-0.040 0 0 0 0 0 0 0 24538 217
0.040-0.5 793 207 0 0 1000 201 3 49585 504
0.5-1.0 1000 0 0 0 1000 230 2 14373 174
1.0-2.0 914 86 0 0 1000 60 3 7321 698
2.0-3.0 0 0 0 0 0 0 0 1023 200
3.0-4.0 0 0 0 0 0 0 0 186 44
4.0-5.0 0 0 0 0 0 0 0 37 10
5.0-7.5 0 0 0 0 0 0 0 36 6
7.5-10.0 0 0 0 0 0 0 0 0 0
10.0-20.0 0 0 0 0 0 0 0 0 0
>20.0 0 0 0 0 0 0 0 0 0
All 905 95 0 0 1000 491 8 100695 2009
Estd. no of hhs opr. holding (00) 444 47 0 0 491 XXX XXX XXX XXX
Sample no. of hhs opr. holding 6 2 0 0 8 XXX XXX XXX XXX
WEST BENGAL VISIT 1
Size class of operational holding
(ha)
No. of partner households No. of hh opr. holding
Table 27.1: Per 1000 distribution of jointly operated operational holdings by number of partner households for each size class of household operational holding
No. of joint opr. holding
A 78
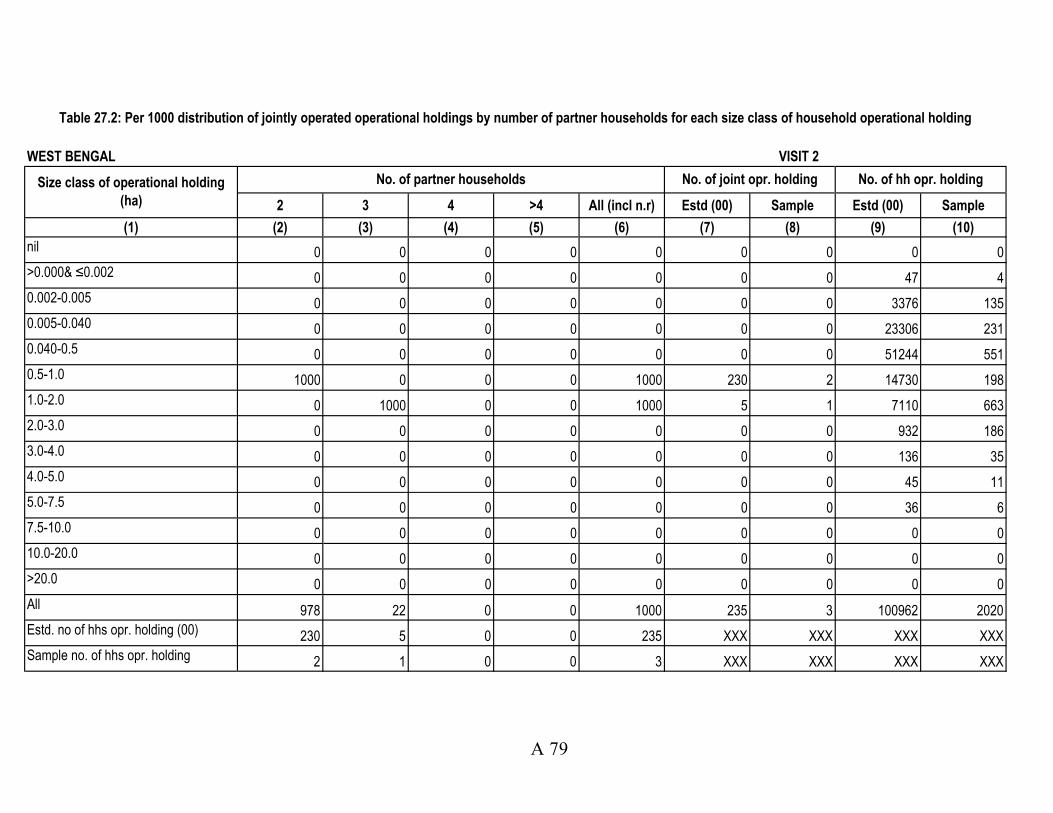
2 3 4 >4 All (incl n.r) Estd (00) Sample Estd (00) Sample
(1) (2) (3) (4) (5) (6) (7) (8) (9) (10)
nil 0 0 0 0 0 0 0 0 0
>0.000& ≤0.002 0 0 0 0 0 0 0 47 4
0.002-0.005 0 0 0 0 0 0 0 3376 135
0.005-0.040 0 0 0 0 0 0 0 23306 231
0.040-0.5 0 0 0 0 0 0 0 51244 551
0.5-1.0 1000 0 0 0 1000 230 2 14730 198
1.0-2.0 0 1000 0 0 1000 5 1 7110 663
2.0-3.0 0 0 0 0 0 0 0 932 186
3.0-4.0 0 0 0 0 0 0 0 136 35
4.0-5.0 0 0 0 0 0 0 0 45 11
5.0-7.5 0 0 0 0 0 0 0 36 6
7.5-10.0 0 0 0 0 0 0 0 0 0
10.0-20.0 0 0 0 0 0 0 0 0 0
>20.0 0 0 0 0 0 0 0 0 0
All 978 22 0 0 1000 235 3 100962 2020
Estd. no of hhs opr. holding (00) 230 5 0 0 235 XXX XXX XXX XXX
Sample no. of hhs opr. holding 2 1 0 0 3 XXX XXX XXX XXX
Table 27.2: Per 1000 distribution of jointly operated operational holdings by number of partner households for each size class of household operational holding
WEST BENGAL VISIT 2
Size class of operational holding
(ha)
No. of partner households No. of joint opr. holding No. of hh opr. holding
A 79

2 3 4 >4 All (incl n.r) Estd (00) Sample Estd (00) Sample
(1) (2) (3) (4) (5) (6) (7) (8) (9) (10)
nil 0 0 0 0 0 0 0 0 0
>0.000& ≤0.002 0 0 0 0 0 0 0 42 3
0.002-0.005 0 0 0 0 0 0 0 3100 131
0.005-0.040 0 0 0 0 0 0 0 23975 234
0.040-0.5 0 292 0 0 1000 143 2 52713 542
0.5-1.0 1000 0 0 0 1000 230 2 15543 177
1.0-2.0 873 86 0 0 1000 60 3 7420 691
2.0-3.0 0 0 0 0 0 0 0 1061 202
3.0-4.0 0 0 0 0 0 0 0 203 48
4.0-5.0 0 0 0 0 0 0 0 47 12
5.0-7.5 0 0 0 0 0 0 0 41 9
7.5-10.0 0 0 0 0 0 0 0 0 0
10.0-20.0 0 0 0 0 0 0 0 0 0
>20.0 0 0 0 0 0 0 0 0 0
All 653 108 0 0 1000 432 7 104145 2049
Estd. no of hhs opr. holding (00) 282 47 0 0 432 XXX XXX XXX XXX
Sample no. of hhs opr. holding 3 2 0 0 7 XXX XXX XXX XXX
Table 27.W: Per 1000 distribution of jointly operated operational holdings by number of partner households for each size class of household operational holding
WEST BENGAL VISIT WHOLE AGRICULTURAL YEAR
Size class of operational holding
(ha)
No. of partner households No. of joint opr. holding No. of hh opr. holding
A 80

1 2 3 4 5 6-10 11-15 16-20 21-25 >25All (incl
n.r.)
(1) (2) (3) (4) (5) (6) (7) (8) (9) (10) (11) (12) (13) (14)
nil 0 0 0 0 0 0 0 0 0 0 0 0 0
>0.000& ≤0.002 1000 0 0 0 0 0 0 0 0 0 1000 43 4
0.002-0.005 995 4 0 0 0 0 0 0 0 0 1000 3552 152
0.005-0.040 978 17 2 0 0 0 0 0 0 0 1000 24538 217
0.040-0.5 166 494 161 63 41 73 1 0 0 0 1000 49585 504
0.5-1.0 30 120 188 158 195 290 18 0 0 0 1000 14373 174
1.0-2.0 3 24 92 152 130 528 54 8 3 3 1000 7321 698
2.0-3.0 18 2 26 99 88 495 187 43 42 1 1000 1023 200
3.0-4.0 0 12 52 63 114 503 138 52 65 0 1000 186 44
4.0-5.0 0 44 51 114 21 0 579 24 0 27 1000 37 10
5.0-7.5 0 0 0 293 140 111 456 0 0 0 1000 36 6
7.5-10.0 0 0 0 0 0 0 0 0 0 0 0 0 0
10.0-20.0 0 0 0 0 0 0 0 0 0 0 0 0 0
>20.0 0 0 0 0 0 0 0 0 0 0 0 0 0
All 360 266 114 66 59 122 10 1 1 0 1000 100695 2009
Estd. no of hhs opr. holding (00) 36276 26819 11463 6651 5907 12264 964 110 79 24 100695 XXX XXX
Sample no. of hhs opr. holding 465 251 252 239 189 463 98 27 12 6 2009 XXX XXX
Table 28.1: Per 1000 distribution of operational holdings by number of parcel for each size class of household operational holding
WEST BENGAL VISIT 1
Size class of operational holding
(ha)
Per 1000 distribution of operational holdings with no. of parcel asNo of opr. holding
Estd (00) Sample
A 81
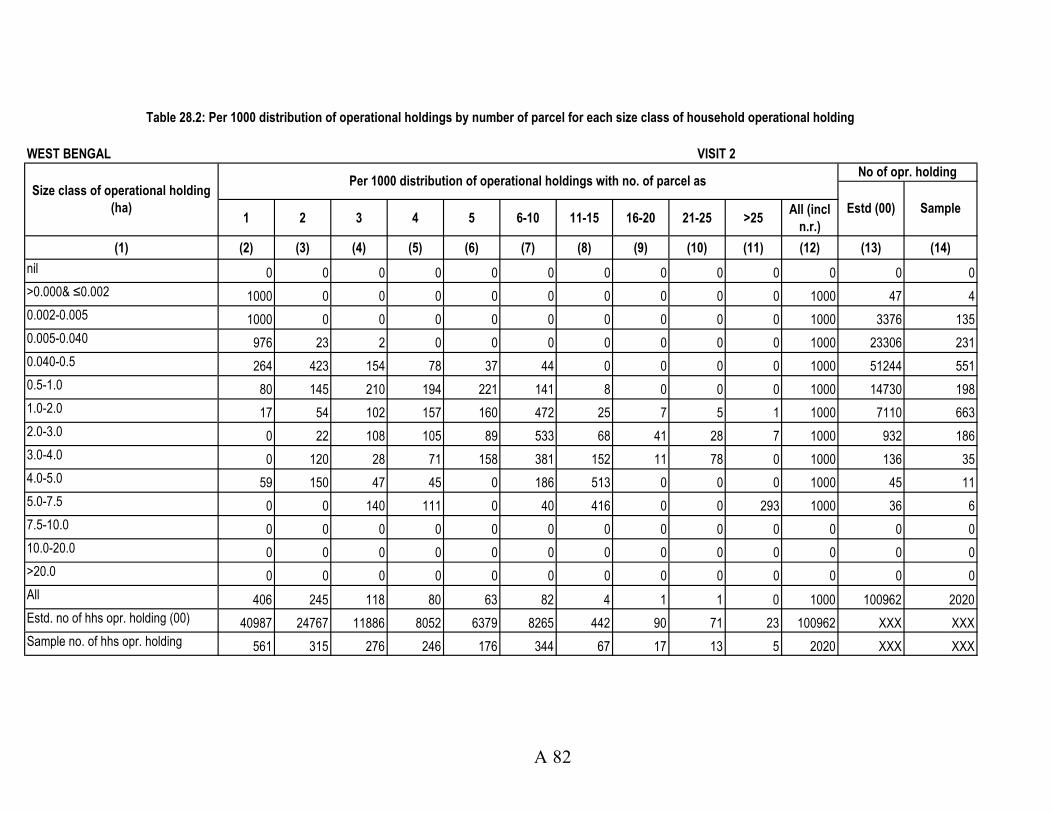
1 2 3 4 5 6-10 11-15 16-20 21-25 >25All (incl
n.r.)
(1) (2) (3) (4) (5) (6) (7) (8) (9) (10) (11) (12) (13) (14)
nil 0 0 0 0 0 0 0 0 0 0 0 0 0
>0.000& ≤0.002 1000 0 0 0 0 0 0 0 0 0 1000 47 4
0.002-0.005 1000 0 0 0 0 0 0 0 0 0 1000 3376 135
0.005-0.040 976 23 2 0 0 0 0 0 0 0 1000 23306 231
0.040-0.5 264 423 154 78 37 44 0 0 0 0 1000 51244 551
0.5-1.0 80 145 210 194 221 141 8 0 0 0 1000 14730 198
1.0-2.0 17 54 102 157 160 472 25 7 5 1 1000 7110 663
2.0-3.0 0 22 108 105 89 533 68 41 28 7 1000 932 186
3.0-4.0 0 120 28 71 158 381 152 11 78 0 1000 136 35
4.0-5.0 59 150 47 45 0 186 513 0 0 0 1000 45 11
5.0-7.5 0 0 140 111 0 40 416 0 0 293 1000 36 6
7.5-10.0 0 0 0 0 0 0 0 0 0 0 0 0 0
10.0-20.0 0 0 0 0 0 0 0 0 0 0 0 0 0
>20.0 0 0 0 0 0 0 0 0 0 0 0 0 0
All 406 245 118 80 63 82 4 1 1 0 1000 100962 2020
Estd. no of hhs opr. holding (00) 40987 24767 11886 8052 6379 8265 442 90 71 23 100962 XXX XXX
Sample no. of hhs opr. holding 561 315 276 246 176 344 67 17 13 5 2020 XXX XXX
Table 28.2: Per 1000 distribution of operational holdings by number of parcel for each size class of household operational holding
WEST BENGAL VISIT 2
Size class of operational holding
(ha)
Per 1000 distribution of operational holdings with no. of parcel asNo of opr. holding
Estd (00) Sample
A 82
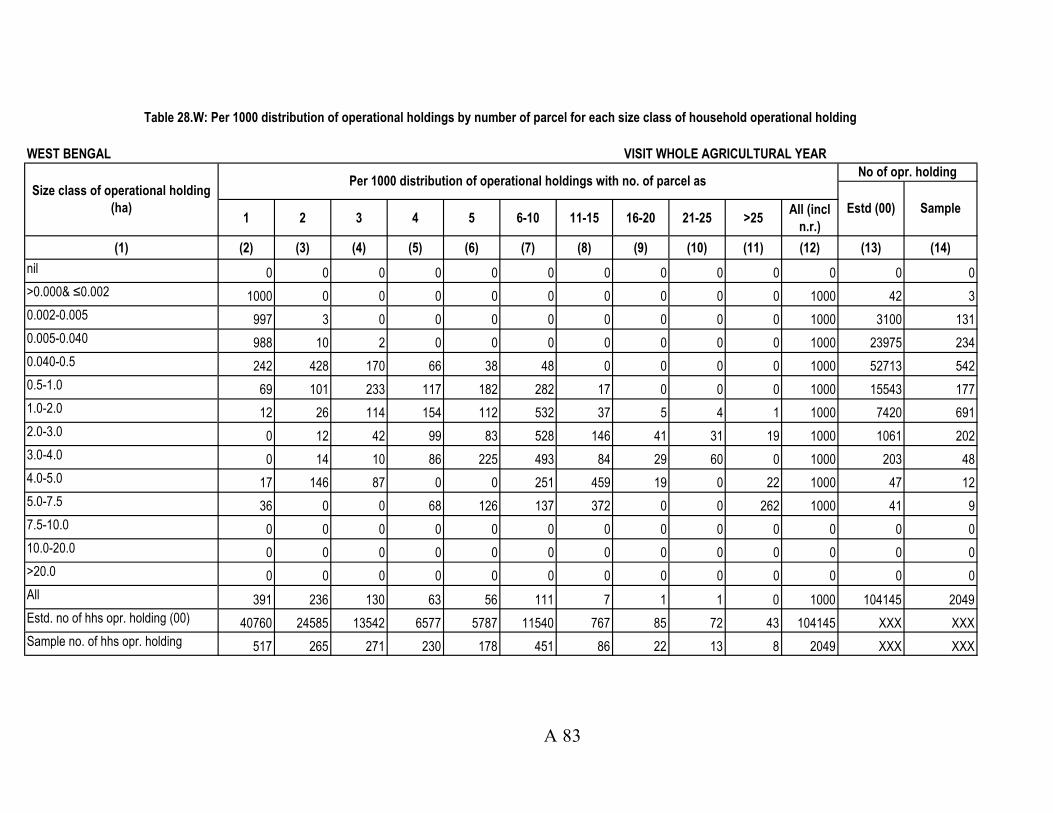
1 2 3 4 5 6-10 11-15 16-20 21-25 >25All (incl
n.r.)
(1) (2) (3) (4) (5) (6) (7) (8) (9) (10) (11) (12) (13) (14)
nil 0 0 0 0 0 0 0 0 0 0 0 0 0
>0.000& ≤0.002 1000 0 0 0 0 0 0 0 0 0 1000 42 3
0.002-0.005 997 3 0 0 0 0 0 0 0 0 1000 3100 131
0.005-0.040 988 10 2 0 0 0 0 0 0 0 1000 23975 234
0.040-0.5 242 428 170 66 38 48 0 0 0 0 1000 52713 542
0.5-1.0 69 101 233 117 182 282 17 0 0 0 1000 15543 177
1.0-2.0 12 26 114 154 112 532 37 5 4 1 1000 7420 691
2.0-3.0 0 12 42 99 83 528 146 41 31 19 1000 1061 202
3.0-4.0 0 14 10 86 225 493 84 29 60 0 1000 203 48
4.0-5.0 17 146 87 0 0 251 459 19 0 22 1000 47 12
5.0-7.5 36 0 0 68 126 137 372 0 0 262 1000 41 9
7.5-10.0 0 0 0 0 0 0 0 0 0 0 0 0 0
10.0-20.0 0 0 0 0 0 0 0 0 0 0 0 0 0
>20.0 0 0 0 0 0 0 0 0 0 0 0 0 0
All 391 236 130 63 56 111 7 1 1 0 1000 104145 2049
Estd. no of hhs opr. holding (00) 40760 24585 13542 6577 5787 11540 767 85 72 43 104145 XXX XXX
Sample no. of hhs opr. holding 517 265 271 230 178 451 86 22 13 8 2049 XXX XXX
Table 28.W: Per 1000 distribution of operational holdings by number of parcel for each size class of household operational holding
WEST BENGAL VISIT WHOLE AGRICULTURAL YEAR
Size class of operational holding
(ha)
Per 1000 distribution of operational holdings with no. of parcel asNo of opr. holding
Estd (00) Sample
A 83

ST SC OBC Others All (incl. n.r.) Estd. (00) Sample Estd (00) Sample
(1) (2) (3) (4) (5) (6) (7) (8) (9) (10)
nil 0 0 0 0 0 0 0 0 0
>0.000& ≤0.002 0 0 0 0 0 0 0 43 4
0.002-0.005 0 0 0 0 0 0 0 3552 152
0.005-0.040 0 0 0 0 0 0 0 24538 217
0.040-0.5 0 377 0 1000 410 201 3 49585 504
0.5-1.0 0 623 963 0 469 230 2 14373 174
1.0-2.0 1000 0 37 0 122 60 3 7321 698
2.0-3.0 0 0 0 0 0 0 0 1023 200
3.0-4.0 0 0 0 0 0 0 0 186 44
4.0-5.0 0 0 0 0 0 0 0 37 10
5.0-7.5 0 0 0 0 0 0 0 36 6
7.5-10.0 0 0 0 0 0 0 0 0 0
10.0-20.0 0 0 0 0 0 0 0 0 0
>20.0 0 0 0 0 0 0 0 0 0
All 1000 1000 1000 1000 1000 491 8 100695 2009
Estd. no of joint hh opr. holding (00) 55 155 139 143 491 XXX XXX XXX XXX
Sample no. of joint hh opr. holding 2 2 2 2 8 XXX XXX XXX XXX
Estd. no of hh opr. holding (00) 6456 35396 12234 46609 100695 XXX XXX XXX XXX
Sample no. of hh opr. holding 221 606 237 945 2009 XXX XXX XXX XXX
WEST BENGAL VISIT 1
Size class of operational holding (ha)Social group No. of hh opr. holding
Table 29.1: Per 1000 distribution of jointly operated operational holdings by size class of household operational
holdings for each social group
No of hh joint opr. holding
A 84

ST SC OBC Others All (incl. n.r.) Estd. (00) Sample Estd (00) Sample
(1) (2) (3) (4) (5) (6) (7) (8) (9) (10)
nil 0 0 0 0 0 0 0 0 0
>0.000& ≤0.002 0 0 0 0 0 0 0 47 4
0.002-0.005 0 0 0 0 0 0 0 3376 135
0.005-0.040 0 0 0 0 0 0 0 23306 231
0.040-0.5 0 0 0 0 0 0 0 51244 551
0.5-1.0 0 1000 963 0 978 230 2 14730 198
1.0-2.0 0 0 37 0 22 5 1 7110 663
2.0-3.0 0 0 0 0 0 0 0 932 186
3.0-4.0 0 0 0 0 0 0 0 136 35
4.0-5.0 0 0 0 0 0 0 0 45 11
5.0-7.5 0 0 0 0 0 0 0 36 6
7.5-10.0 0 0 0 0 0 0 0 0 0
10.0-20.0 0 0 0 0 0 0 0 0 0
>20.0 0 0 0 0 0 0 0 0 0
All 0 1000 1000 0 1000 235 3 100962 2020
Estd. no of joint hh opr. holding (00) 0 97 139 0 235 XXX XXX XXX XXX
Sample no. of joint hh opr. holding 0 1 2 0 3 XXX XXX XXX XXX
Estd. no of hh opr. holding (00) 7067 36011 10819 47066 100962 XXX XXX XXX XXX
Sample no. of hh opr. holding 219 617 233 951 2020 XXX XXX XXX XXX
Table 29.2: Per 1000 distribution of jointly operated operational holdings by size class of household operational
holdings for each social group
WEST BENGAL VISIT 2
Size class of operational holding (ha)
Social group No of hh joint opr. holding No. of hh opr. holding
A 85

Estd. (00) Sample
(1) (2) (3) (4) (5) (6) (7) (8)
nil 0 0 0 0 0 0 0
>0.000& ≤0.002 991 0 0 9 1000 43 4
0.002-0.005 957 13 0 29 1000 3552 152
0.005-0.040 930 0 0 70 1000 24538 217
0.040-0.5 864 18 107 11 1000 49585 504
0.5-1.0 875 4 121 0 1000 14373 174
1.0-2.0 857 7 134 1 1000 7321 698
2.0-3.0 956 0 44 0 1000 1023 200
3.0-4.0 922 0 78 0 1000 186 44
4.0-5.0 802 0 198 0 1000 37 10
5.0-7.5 707 0 293 0 1000 36 6
7.5-10.0 0 0 0 0 0 0 0
10.0-20.0 0 0 0 0 0 0 0
>20.0 0 0 0 0 0 0 0
all 885 10 81 24 1000 100695 2009
estd. no. of parcel(00) 246761 1946 34290 2628 285625 XXX XXX
estd. area (ha) 3080861 27727 399798 10464 3518849 XXX XXX
estd. no of hhs opr. holding (00) 89134 1032 8130 2400 100695 XXX XXX
sample no. of hhs opr. holding 1762 18 184 45 2009 XXX XXX
Table 30.1 :Per 1000 distribution of household operational holdings by type of holding for class of household operational holding
WEST BENGAL VISIT1
Size class of operational holding
(ha)
Per 1000 distribution of operational holdings with type of holding as
Entirely ownedEntirely leased-
in
Both owned and
leased- in
Entirely otherwise
possessedAll (incl. n.r.)
No of hh opr hld
A 86

Estd. (00) Sample
(1) (2) (3) (4) (5) (6) (7) (8)
nil 0 0 0 0 0 0 0
>0.000& ≤0.002 902 0 0 98 1000 47 4
0.002-0.005 955 14 0 31 1000 3376 135
0.005-0.040 899 4 0 97 1000 23306 231
0.040-0.5 855 31 103 11 1000 51244 551
0.5-1.0 802 4 194 1 1000 14730 198
1.0-2.0 861 7 131 0 1000 7110 663
2.0-3.0 978 0 22 0 1000 932 186
3.0-4.0 905 0 95 0 1000 136 35
4.0-5.0 794 47 159 0 1000 45 11
5.0-7.5 707 0 293 0 1000 36 6
7.5-10.0 0 0 0 0 0 0 0
10.0-20.0 0 0 0 0 0 0 0
>20.0 0 0 0 0 0 0 0
All 862 18 90 29 1000 100962 2020
Estd. no. of parcel(00) 222107 2717 32119 3006 259948 XXX XXX
Estd. area (ha) 3012833 41965 455948 11644 3522390 XXX XXX
Estd. no of hhs opr. holding (00) 87056 1851 9108 2947 100962 XXX XXX
Sample no. of hhs opr. holding 1758 31 183 48 2020 XXX XXX
Table 30.2 :Per 1000 distribution of household operational holdings by type of holding for class of household operational holding
WEST BENGAL VISIT 2
Size class of operational holding
(ha)
Per 1000 distribution of operational holdings with type of holding as
Entirely ownedEntirely leased-
in
Both owned and
leased- in
Entirely otherwise
possessedAll (incl. n.r.)
No of hh opr hld
A 87
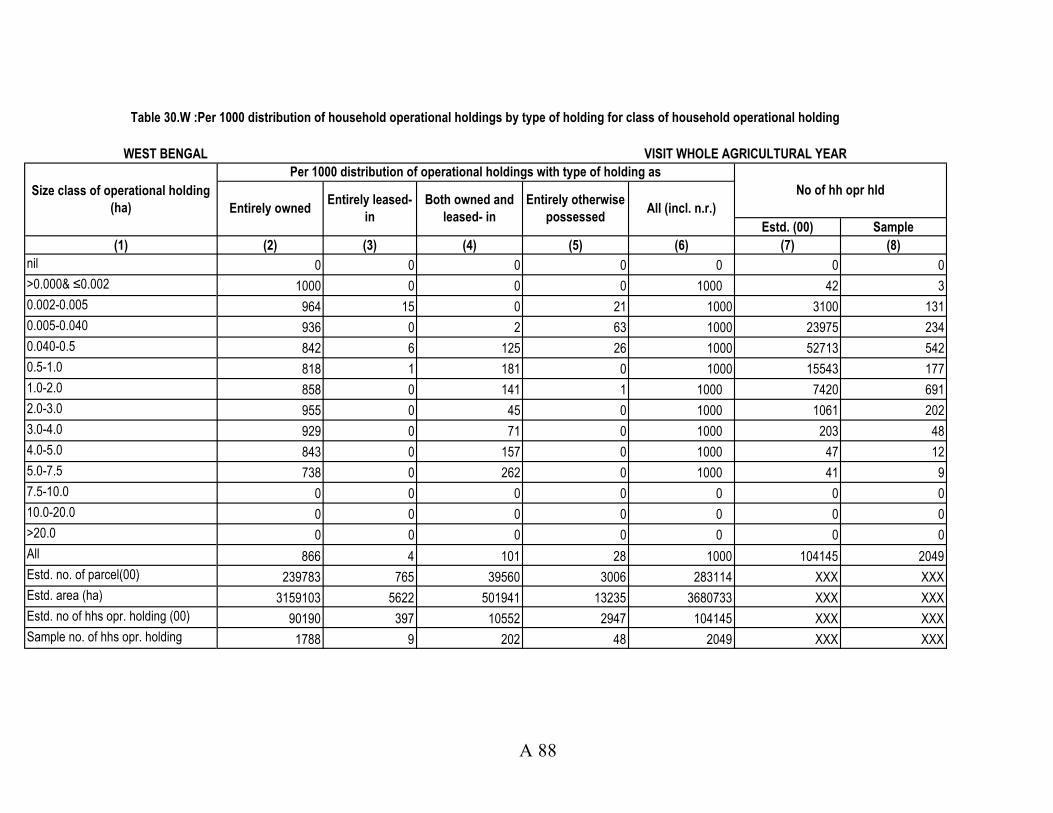
Estd. (00) Sample
(1) (2) (3) (4) (5) (6) (7) (8)
nil 0 0 0 0 0 0 0
>0.000& ≤0.002 1000 0 0 0 1000 42 3
0.002-0.005 964 15 0 21 1000 3100 131
0.005-0.040 936 0 2 63 1000 23975 234
0.040-0.5 842 6 125 26 1000 52713 542
0.5-1.0 818 1 181 0 1000 15543 177
1.0-2.0 858 0 141 1 1000 7420 691
2.0-3.0 955 0 45 0 1000 1061 202
3.0-4.0 929 0 71 0 1000 203 48
4.0-5.0 843 0 157 0 1000 47 12
5.0-7.5 738 0 262 0 1000 41 9
7.5-10.0 0 0 0 0 0 0 0
10.0-20.0 0 0 0 0 0 0 0
>20.0 0 0 0 0 0 0 0
All 866 4 101 28 1000 104145 2049
Estd. no. of parcel(00) 239783 765 39560 3006 283114 XXX XXX
Estd. area (ha) 3159103 5622 501941 13235 3680733 XXX XXX
Estd. no of hhs opr. holding (00) 90190 397 10552 2947 104145 XXX XXX
Sample no. of hhs opr. holding 1788 9 202 48 2049 XXX XXX
Table 30.W :Per 1000 distribution of household operational holdings by type of holding for class of household operational holding
WEST BENGAL VISIT WHOLE AGRICULTURAL YEAR
Size class of operational holding
(ha)
Per 1000 distribution of operational holdings with type of holding as
Entirely ownedEntirely leased-
in
Both owned and
leased- in
Entirely otherwise
possessedAll (incl. n.r.)
No of hh opr hld
A 88

Only crop
prod. on
jhum land
Only crop prod.
on land other han
jhum land
only farming of
animal/ fishery
Both crop prod.
and farming of
animal/ fishery
Other
agricultural
uses
All (incl.
n.r.)Estd (00) Sample
(1) (2) (3) (4) (5) (6) (7) (8) (9) (10)
nil 0 0 0 0 0 0 0 0 0
>0.000& ≤0.002 0 0 1000 0 0 1000 0.002 43 4
0.002-0.005 0 0 891 37 72 1000 0.004 3552 152
0.005-0.040 0 31 872 80 18 1000 0.02 24538 217
0.040-0.5 0 276 38 658 16 1000 0.223 49585 504
0.5-1.0 0 167 2 826 0 1000 0.706 14373 174
1.0-2.0 0 206 8 770 1 1000 1.369 7321 698
2.0-3.0 0 239 2 756 0 1000 2.409 1023 200
3.0-4.0 0 94 0 906 0 1000 3.367 186 44
4.0-5.0 0 65 58 877 0 1000 4.238 37 10
5.0-7.5 0 40 0 960 0 1000 5.834 36 6
7.5-10.0 0 0 0 0 0 0 0 0 0
10.0-20.0 0 0 0 0 0 0 0 0 0
>20.0 0 0 0 0 0 0 0 0 0
All 0 185 264 528 15 1000 0.349 100695 2009
Estd. area(ha) 0 716740 74081 2674269 9892 3518849 XXX XXX XXX
Estd. no of hhs opr. holding (00) 0 18629 26581 53204 1486 100695 XXX XXX XXX
Sample no. of hhs opr. holding 0 372 351 1243 25 2009 XXX XXX XXX
Table 31.1: Per 1000 distribution of household operational holdings by main use of the holding for each size class of household operational
holding
WEST BENGAL Visit 1
Size class of operational holding
(ha)
Per 1000 distribution of operational holdings with main use of holding as Avg. area
per opr.
holding
(0.00
ha)
No of hhs opr.
holding
A 89
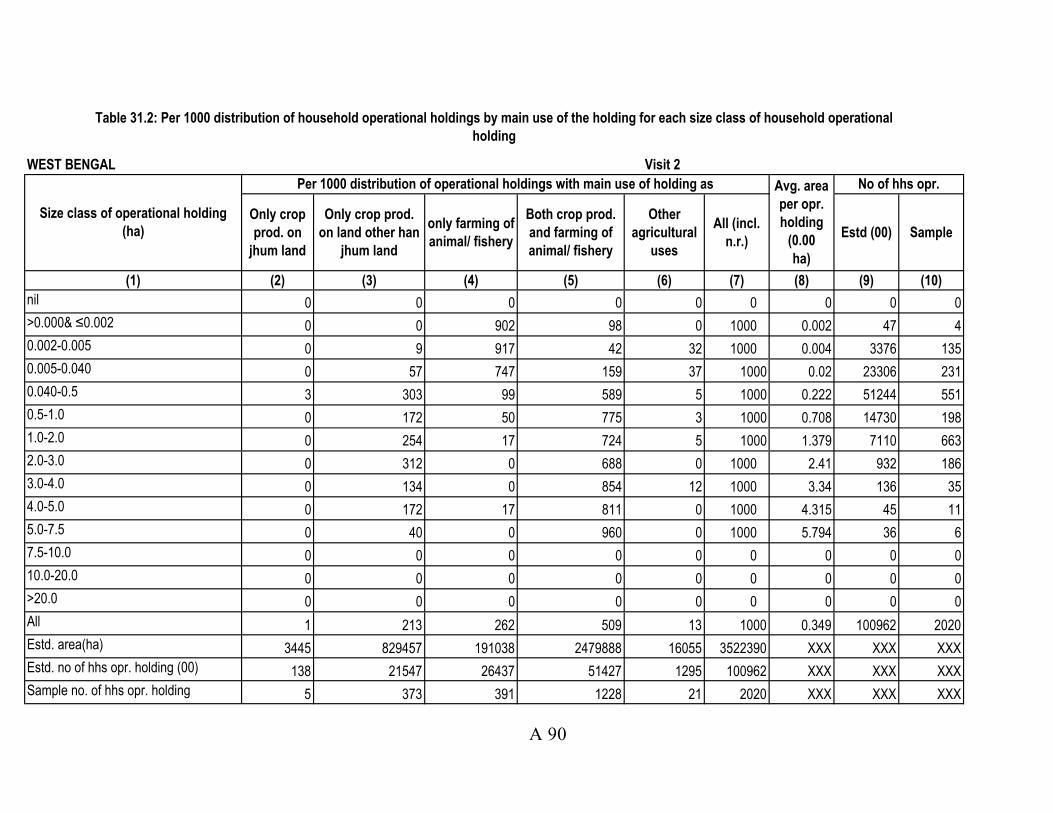
Only crop
prod. on
jhum land
Only crop prod.
on land other han
jhum land
only farming of
animal/ fishery
Both crop prod.
and farming of
animal/ fishery
Other
agricultural
uses
All (incl.
n.r.)Estd (00) Sample
(1) (2) (3) (4) (5) (6) (7) (8) (9) (10)
nil 0 0 0 0 0 0 0 0 0
>0.000& ≤0.002 0 0 902 98 0 1000 0.002 47 4
0.002-0.005 0 9 917 42 32 1000 0.004 3376 135
0.005-0.040 0 57 747 159 37 1000 0.02 23306 231
0.040-0.5 3 303 99 589 5 1000 0.222 51244 551
0.5-1.0 0 172 50 775 3 1000 0.708 14730 198
1.0-2.0 0 254 17 724 5 1000 1.379 7110 663
2.0-3.0 0 312 0 688 0 1000 2.41 932 186
3.0-4.0 0 134 0 854 12 1000 3.34 136 35
4.0-5.0 0 172 17 811 0 1000 4.315 45 11
5.0-7.5 0 40 0 960 0 1000 5.794 36 6
7.5-10.0 0 0 0 0 0 0 0 0 0
10.0-20.0 0 0 0 0 0 0 0 0 0
>20.0 0 0 0 0 0 0 0 0 0
All 1 213 262 509 13 1000 0.349 100962 2020
Estd. area(ha) 3445 829457 191038 2479888 16055 3522390 XXX XXX XXX
Estd. no of hhs opr. holding (00) 138 21547 26437 51427 1295 100962 XXX XXX XXX
Sample no. of hhs opr. holding 5 373 391 1228 21 2020 XXX XXX XXX
Table 31.2: Per 1000 distribution of household operational holdings by main use of the holding for each size class of household operational
holding
WEST BENGAL Visit 2
Size class of operational holding
(ha)
Per 1000 distribution of operational holdings with main use of holding as Avg. area
per opr.
holding
(0.00
ha)
No of hhs opr.
A 90

Only crop
prod. on
jhum land
Only crop prod.
on land other han
jhum land
only farming of
animal/ fishery
Both crop prod.
and farming of
animal/ fishery
Other
agricultural
uses
All (incl.
n.r.)Estd (00) Sample
(1) (2) (3) (4) (5) (6) (7) (8) (9) (10)
nil 0 0 0 0 0 0 0 0 0
>0.000& ≤0.002 0 0 1000 0 0 1000 0.002 42 3
0.002-0.005 0 12 895 53 40 1000 0.004 3100 131
0.005-0.040 0 52 798 117 33 1000 0.02 23975 234
0.040-0.5 3 312 27 652 5 1000 0.22 52713 542
0.5-1.0 0 147 0 849 4 1000 0.699 15543 177
1.0-2.0 0 234 7 754 5 1000 1.374 7420 691
2.0-3.0 0 242 0 758 0 1000 2.414 1061 202
3.0-4.0 0 142 0 858 0 1000 3.347 203 48
4.0-5.0 0 57 17 927 0 1000 4.322 47 12
5.0-7.5 0 36 0 964 0 1000 5.797 41 9
7.5-10.0 0 0 0 0 0 0 0 0 0
10.0-20.0 0 0 0 0 0 0 0 0 0
>20.0 0 0 0 0 0 0 0 0 0
All 1 212 225 549 12 1000 0.353 104145 2049
Estd. area(ha) 3445 819255 60878 2780667 15793 3680733 XXX XXX XXX
Estd. no of hhs opr. holding (00) 138 22061 23442 57207 1249 104145 XXX XXX XXX
Sample no. of hhs opr. holding 5 383 315 1327 18 2049 XXX XXX XXX
Table 31.W: Per 1000 distribution of household operational holdings by main use of the holding for each size class of household operational
holding
WEST BENGAL Visit WHOLE AGRICULTURAL YEAR
Size class of operational holding
(ha)
Per 1000 distribution of operational holdings with main use of holding as Avg. area
per opr.
holding
(0.00
ha)
No of hhs opr.
A 91
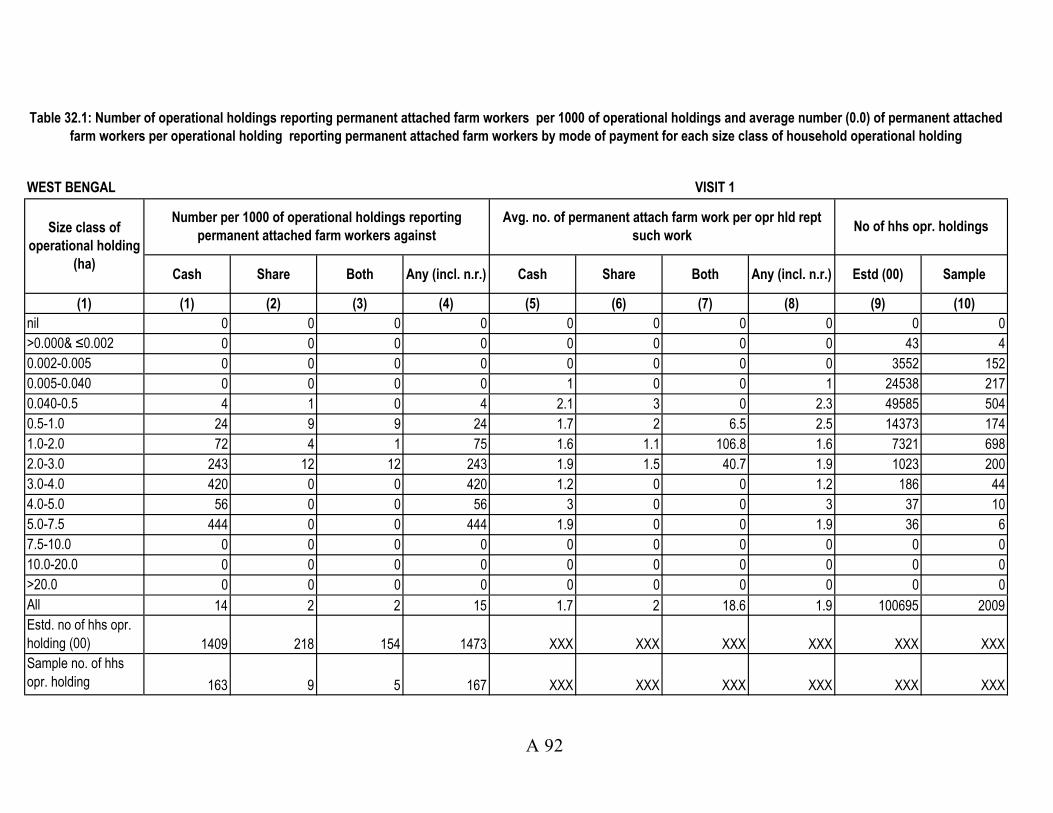
Cash Share Both Any (incl. n.r.) Cash Share Both Any (incl. n.r.) Estd (00) Sample
(1) (1) (2) (3) (4) (5) (6) (7) (8) (9) (10)
nil 0 0 0 0 0 0 0 0 0 0
>0.000& ≤0.002 0 0 0 0 0 0 0 0 43 4
0.002-0.005 0 0 0 0 0 0 0 0 3552 152
0.005-0.040 0 0 0 0 1 0 0 1 24538 217
0.040-0.5 4 1 0 4 2.1 3 0 2.3 49585 504
0.5-1.0 24 9 9 24 1.7 2 6.5 2.5 14373 174
1.0-2.0 72 4 1 75 1.6 1.1 106.8 1.6 7321 698
2.0-3.0 243 12 12 243 1.9 1.5 40.7 1.9 1023 200
3.0-4.0 420 0 0 420 1.2 0 0 1.2 186 44
4.0-5.0 56 0 0 56 3 0 0 3 37 10
5.0-7.5 444 0 0 444 1.9 0 0 1.9 36 6
7.5-10.0 0 0 0 0 0 0 0 0 0 0
10.0-20.0 0 0 0 0 0 0 0 0 0 0
>20.0 0 0 0 0 0 0 0 0 0 0
All 14 2 2 15 1.7 2 18.6 1.9 100695 2009
Estd. no of hhs opr.
holding (00) 1409 218 154 1473 XXX XXX XXX XXX XXX XXX
Sample no. of hhs
opr. holding 163 9 5 167 XXX XXX XXX XXX XXX XXX
WEST BENGAL VISIT 1
Size class of
operational holding
(ha)
Number per 1000 of operational holdings reporting
permanent attached farm workers againstNo of hhs opr. holdings
Table 32.1: Number of operational holdings reporting permanent attached farm workers per 1000 of operational holdings and average number (0.0) of permanent attached
farm workers per operational holding reporting permanent attached farm workers by mode of payment for each size class of household operational holding
Avg. no. of permanent attach farm work per opr hld rept
such work
A 92
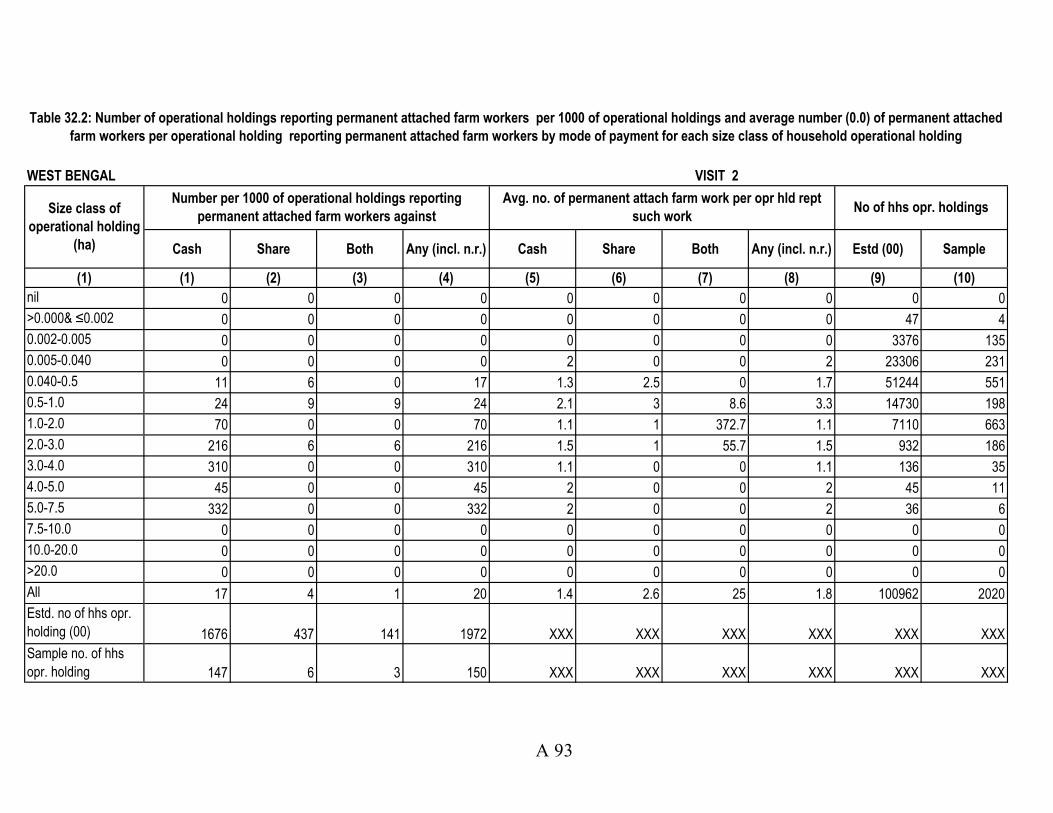
Cash Share Both Any (incl. n.r.) Cash Share Both Any (incl. n.r.) Estd (00) Sample
(1) (1) (2) (3) (4) (5) (6) (7) (8) (9) (10)
nil 0 0 0 0 0 0 0 0 0 0
>0.000& ≤0.002 0 0 0 0 0 0 0 0 47 4
0.002-0.005 0 0 0 0 0 0 0 0 3376 135
0.005-0.040 0 0 0 0 2 0 0 2 23306 231
0.040-0.5 11 6 0 17 1.3 2.5 0 1.7 51244 551
0.5-1.0 24 9 9 24 2.1 3 8.6 3.3 14730 198
1.0-2.0 70 0 0 70 1.1 1 372.7 1.1 7110 663
2.0-3.0 216 6 6 216 1.5 1 55.7 1.5 932 186
3.0-4.0 310 0 0 310 1.1 0 0 1.1 136 35
4.0-5.0 45 0 0 45 2 0 0 2 45 11
5.0-7.5 332 0 0 332 2 0 0 2 36 6
7.5-10.0 0 0 0 0 0 0 0 0 0 0
10.0-20.0 0 0 0 0 0 0 0 0 0 0
>20.0 0 0 0 0 0 0 0 0 0 0
All 17 4 1 20 1.4 2.6 25 1.8 100962 2020
Estd. no of hhs opr.
holding (00) 1676 437 141 1972 XXX XXX XXX XXX XXX XXX
Sample no. of hhs
opr. holding 147 6 3 150 XXX XXX XXX XXX XXX XXX
Table 32.2: Number of operational holdings reporting permanent attached farm workers per 1000 of operational holdings and average number (0.0) of permanent attached
farm workers per operational holding reporting permanent attached farm workers by mode of payment for each size class of household operational holding
WEST BENGAL VISIT 2
Size class of
operational holding
(ha)
Number per 1000 of operational holdings reporting
permanent attached farm workers against
Avg. no. of permanent attach farm work per opr hld rept
such workNo of hhs opr. holdings
A 93
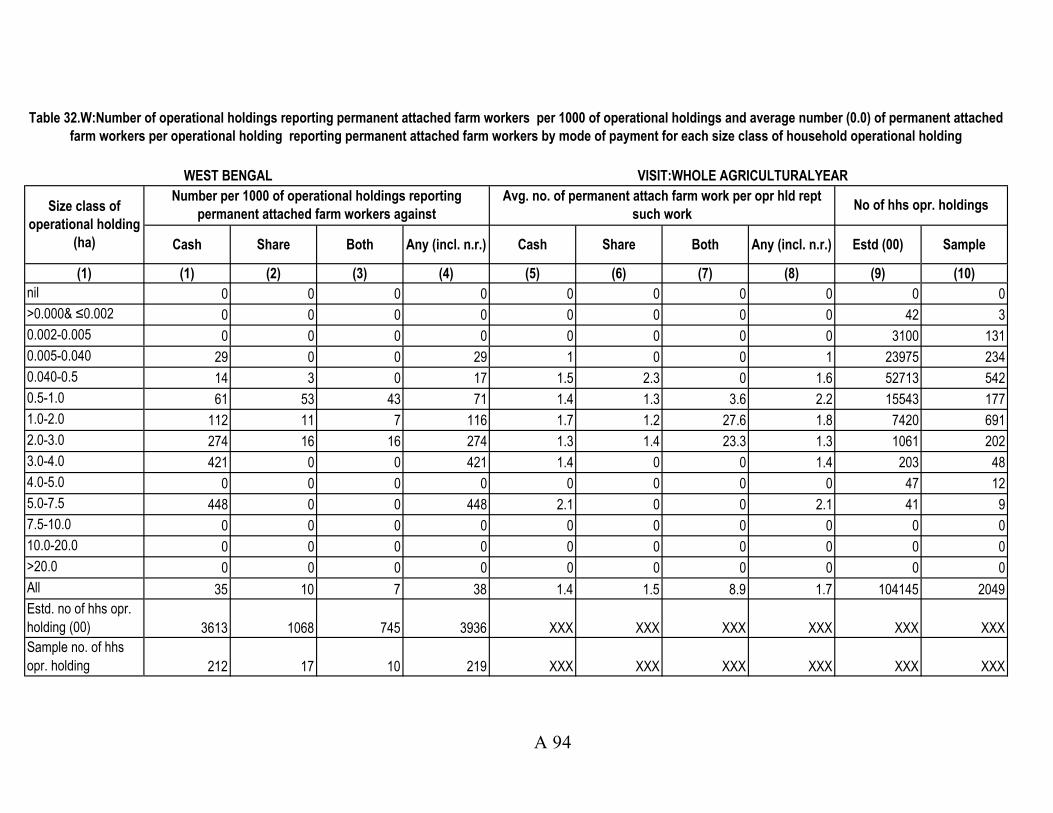
Cash Share Both Any (incl. n.r.) Cash Share Both Any (incl. n.r.) Estd (00) Sample
(1) (1) (2) (3) (4) (5) (6) (7) (8) (9) (10)
nil 0 0 0 0 0 0 0 0 0 0
>0.000& ≤0.002 0 0 0 0 0 0 0 0 42 3
0.002-0.005 0 0 0 0 0 0 0 0 3100 131
0.005-0.040 29 0 0 29 1 0 0 1 23975 234
0.040-0.5 14 3 0 17 1.5 2.3 0 1.6 52713 542
0.5-1.0 61 53 43 71 1.4 1.3 3.6 2.2 15543 177
1.0-2.0 112 11 7 116 1.7 1.2 27.6 1.8 7420 691
2.0-3.0 274 16 16 274 1.3 1.4 23.3 1.3 1061 202
3.0-4.0 421 0 0 421 1.4 0 0 1.4 203 48
4.0-5.0 0 0 0 0 0 0 0 0 47 12
5.0-7.5 448 0 0 448 2.1 0 0 2.1 41 9
7.5-10.0 0 0 0 0 0 0 0 0 0 0
10.0-20.0 0 0 0 0 0 0 0 0 0 0
>20.0 0 0 0 0 0 0 0 0 0 0
All 35 10 7 38 1.4 1.5 8.9 1.7 104145 2049
Estd. no of hhs opr.
holding (00) 3613 1068 745 3936 XXX XXX XXX XXX XXX XXX
Sample no. of hhs
opr. holding 212 17 10 219 XXX XXX XXX XXX XXX XXX
Table 32.W:Number of operational holdings reporting permanent attached farm workers per 1000 of operational holdings and average number (0.0) of permanent attached
farm workers per operational holding reporting permanent attached farm workers by mode of payment for each size class of household operational holding
WEST BENGAL VISIT:WHOLE AGRICULTURALYEAR
Size class of
operational holding
(ha)
Number per 1000 of operational holdings reporting
permanent attached farm workers against
Avg. no. of permanent attach farm work per opr hld rept
such workNo of hhs opr. holdings
A 94
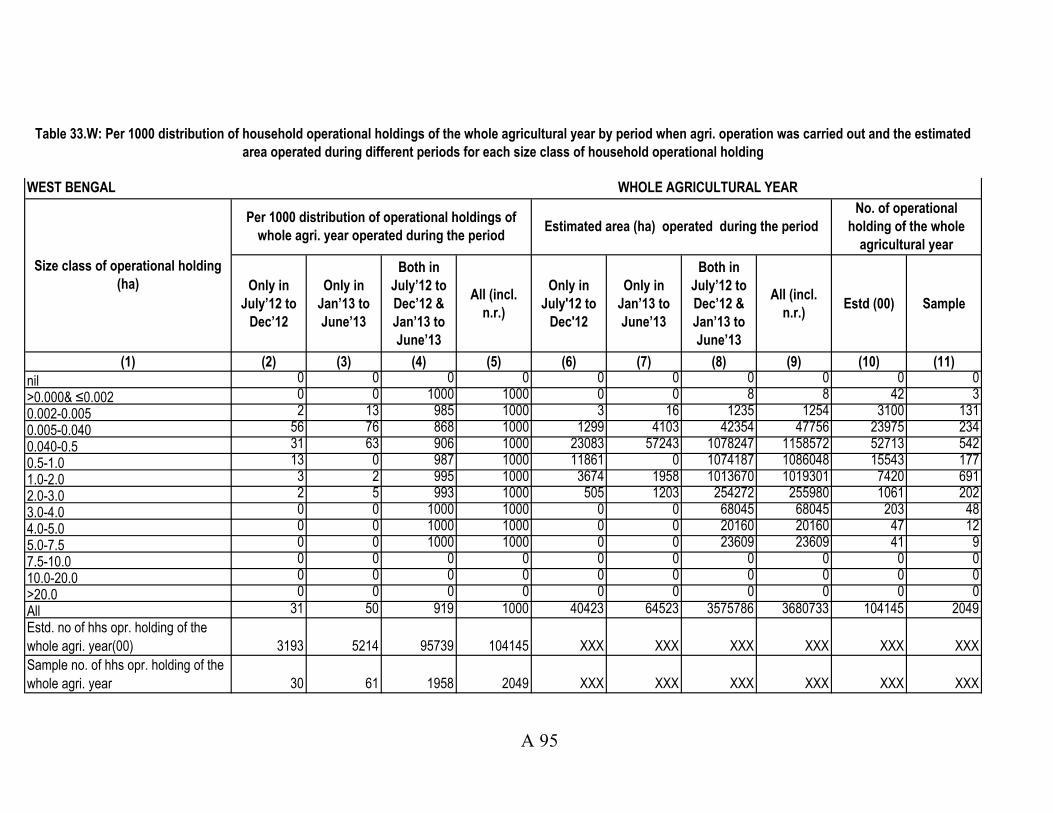
Only in
July’12 to
Dec’12
Only in
Jan’13 to
June’13
Both in
July’12 to
Dec’12 &
Jan’13 to
June’13
All (incl.
n.r.)
Only in
July'12 to
Dec'12
Only in
Jan’13 to
June’13
Both in
July’12 to
Dec’12 &
Jan’13 to
June’13
All (incl.
n.r.)Estd (00) Sample
(1) (2) (3) (4) (5) (6) (7) (8) (9) (10) (11)
nil 0 0 0 0 0 0 0 0 0 0
>0.000& ≤0.002 0 0 1000 1000 0 0 8 8 42 3
0.002-0.005 2 13 985 1000 3 16 1235 1254 3100 131
0.005-0.040 56 76 868 1000 1299 4103 42354 47756 23975 234
0.040-0.5 31 63 906 1000 23083 57243 1078247 1158572 52713 542
0.5-1.0 13 0 987 1000 11861 0 1074187 1086048 15543 177
1.0-2.0 3 2 995 1000 3674 1958 1013670 1019301 7420 691
2.0-3.0 2 5 993 1000 505 1203 254272 255980 1061 202
3.0-4.0 0 0 1000 1000 0 0 68045 68045 203 48
4.0-5.0 0 0 1000 1000 0 0 20160 20160 47 12
5.0-7.5 0 0 1000 1000 0 0 23609 23609 41 9
7.5-10.0 0 0 0 0 0 0 0 0 0 0
10.0-20.0 0 0 0 0 0 0 0 0 0 0
>20.0 0 0 0 0 0 0 0 0 0 0
All 31 50 919 1000 40423 64523 3575786 3680733 104145 2049
Estd. no of hhs opr. holding of the
whole agri. year(00) 3193 5214 95739 104145 XXX XXX XXX XXX XXX XXX
Sample no. of hhs opr. holding of the
whole agri. year 30 61 1958 2049 XXX XXX XXX XXX XXX XXX
Table 33.W: Per 1000 distribution of household operational holdings of the whole agricultural year by period when agri. operation was carried out and the estimated
area operated during different periods for each size class of household operational holding
Size class of operational holding
(ha)
Per 1000 distribution of operational holdings of
whole agri. year operated during the periodEstimated area (ha) operated during the period
No. of operational
holding of the whole
agricultural year
WEST BENGAL WHOLE AGRICULTURAL YEAR
A 95

Male FemaleMale +
FemaleMale Female
Male +
FemaleMale Female
Male +
FemaleMale Female
Male +
Female
Estd.
(00)Sample
(1) (2) (3) (4) (5) (6) (7) (8) (9) (10) (11) (12) (13) (14) (15) (16) (17) (18) (19) (20) (21) (22) (23)
nil0 0 0 0 0 0 0 0 0 0 0 0 0 0 0 0 0 0 0 0 0 0
>0.000& ≤0.0020 0 0 0 0 0 0 0 0 0 0 0 0 0 0 0 0 0 0 0 11 1
0.002-0.00530 111 141 54 110 164 0 0 0 0 0 0 0 0 0 0 0 0 0 0 360 33
0.005-0.04017 356 367 63 392 455 0 0 0 0 0 0 0 0 0 0 0 0 0 0 1654 28
0.040-0.5238 359 511 280 397 487 12 12 12 11 0 11 0 0 0 0 0 0 0 0 2798 60
0.5-1.0751 880 1000 459 626 795 0 0 0 0 0 0 0 0 0 0 0 0 0 0 361 17
1.0-2.0408 668 797 618 387 682 173 0 173 0 1 1 0 0 0 0 0 0 0 0 1144 56
2.0-3.0751 751 782 870 1000 1000 232 287 493 26 0 26 0 0 0 0 0 0 0 0 121 21
3.0-4.01000 623 1000 623 623 623 0 0 0 0 0 0 0 0 0 0 0 0 0 0 5 3
4.0-5.0533 533 533 533 533 533 0 0 0 0 0 0 0 0 0 0 0 0 0 0 2 2
5.0-7.50 0 0 0 0 0 0 0 0 0 0 0 0 0 0 0 0 0 0 0 0 0
7.5-10.00 0 0 0 0 0 0 0 0 0 0 0 0 0 0 0 0 0 0 0 0 0
10.0-20.00 0 0 0 0 0 0 0 0 0 0 0 0 0 0 0 0 0 0 0 0 0
>20.00 0 0 0 0 0 0 0 0 0 0 0 0 0 0 0 0 0 0 0 0 0
All238 435 536 293 401 521 40 11 45 5 0 5 0 0 0 0 0 0 0 0 6456 221
Estd. no of opr.
holdings (00) 1539 2810 3462 1890 2592 3365 261 69 292 34 1 35 0 0 0 0 0 0 0 0 XXX XXX
Sample no of opr.
holdings 90 99 133 59 88 108 14 4 16 2 1 3 0 0 0 0 0 0 0 0 XXX XXX
Table 34: Number of households reporting owning of livestock of different types per 1000 households for each size class of household operational holding
WEST BENGAL SOCIAL GROUP:SCHEDULE TRIBE VISIT 1
Size class of hh
operational
holding (ha)
Number per 1000 households reporting owning of No. of opr.
holdingsAdult cattle Young cattle Young buffaloHorse
and
pony
Mule Donkey Camel Yak Mithun Elephant
Other
live
stock
Adult buffalo
A 96

Male FemaleMale +
FemaleMale Female
Male +
FemaleMale Female
Male +
FemaleMale Female
Male +
Female
Estd.
(00)Sample
(1) (2) (3) (4) (5) (6) (7) (8) (9) (10) (11) (12) (13) (14) (15) (16) (17) (18) (19) (20) (21) (22) (23)
nil0 0 0 0 0 0 0 0 0 0 0 0 0 0 0 0 0 0 0 0 0 0
>0.000& ≤0.0020 0 0 0 858 858 0 0 0 0 0 0 0 0 0 0 0 0 0 0 31 3
0.002-0.00512 207 219 178 302 472 19 19 19 0 0 0 0 0 0 0 0 0 0 0 1477 65
0.005-0.04091 274 366 84 275 319 0 0 0 0 0 0 0 0 0 0 0 0 0 0 7558 71
0.040-0.5138 311 407 95 277 349 5 9 12 0 0 0 0 0 0 0 0 0 0 0 19425 159
0.5-1.0649 701 782 347 677 784 0 12 12 0 0 0 0 0 0 0 0 0 0 5 4559 51
1.0-2.0635 802 858 528 776 814 147 76 185 77 0 77 0 0 0 0 0 0 0 0 2067 196
2.0-3.0633 816 894 584 811 877 214 130 214 130 65 130 0 0 0 0 0 0 0 0 228 51
3.0-4.0676 697 904 691 915 936 207 0 207 0 0 0 0 0 0 0 0 0 0 0 42 8
4.0-5.0269 269 269 0 269 269 0 0 0 0 0 0 0 0 0 0 0 0 0 0 7 2
5.0-7.50 0 0 0 0 0 0 0 0 0 0 0 0 0 0 0 0 0 0 0 0 0
7.5-10.00 0 0 0 0 0 0 0 0 0 0 0 0 0 0 0 0 0 0 0 0 0
10.0-20.00 0 0 0 0 0 0 0 0 0 0 0 0 0 0 0 0 0 0 0 0 0
>20.00 0 0 0 0 0 0 0 0 0 0 0 0 0 0 0 0 0 0 0 0 0
All222 381 468 158 363 435 14 12 21 5 0 5 0 0 0 0 0 0 0 1 35396 606
Estd. no of opr.
holdings (00) 7840 13502 16573 5582 12858 15408 481 441 752 189 15 189 0 0 0 0 0 0 0 22 XXX XXX
Sample no of opr.
holdings 179 327 373 152 270 337 14 8 17 6 1 6 0 0 0 0 0 0 0 1 XXX XXX
Table 34: Number of households reporting owning of livestock of different types per 1000 households for each size class of household operational holding
WEST BENGAL SOCIAL GROUP:SCHEDULE CASTE VISIT 1
No. of opr.
holdingsAdult cattle Young cattle Adult buffalo Young buffaloHorse
and
pony
Mule Donkey Camel Yak Mithun Elephant
Other
live
stock
Size class of hh
operational
holding (ha)
Number per 1000 households reporting owning of
A 97
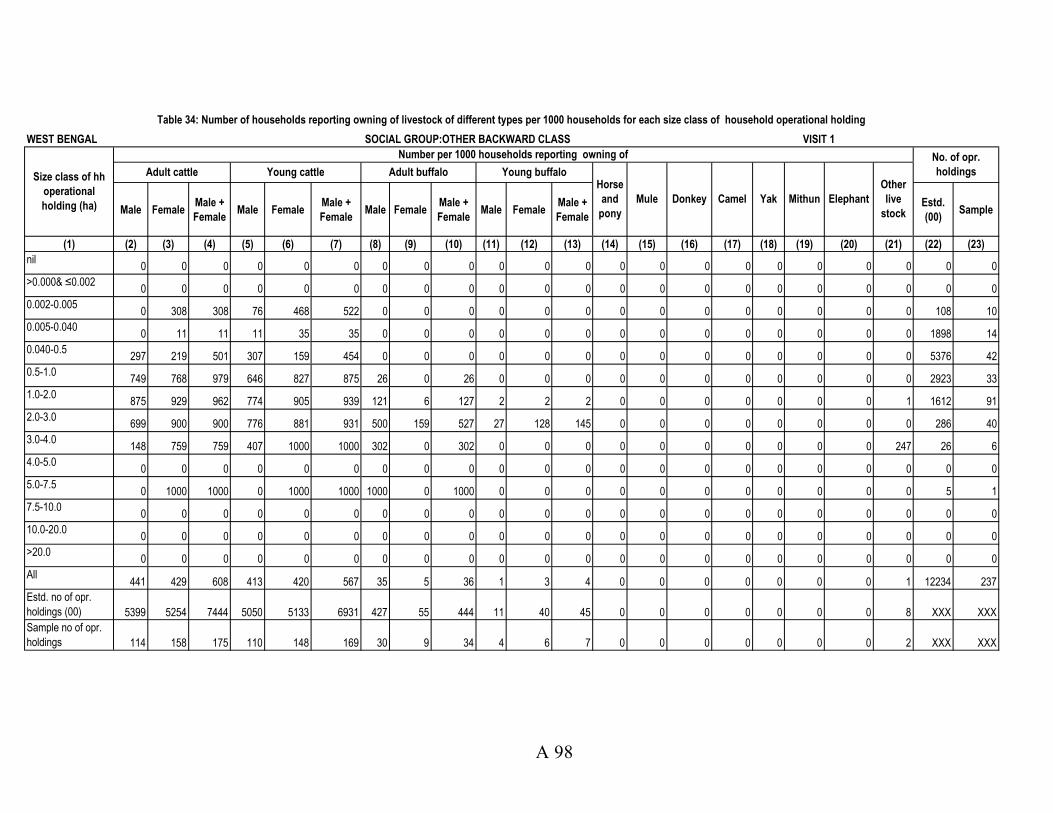
Male FemaleMale +
FemaleMale Female
Male +
FemaleMale Female
Male +
FemaleMale Female
Male +
Female
Estd.
(00)Sample
(1) (2) (3) (4) (5) (6) (7) (8) (9) (10) (11) (12) (13) (14) (15) (16) (17) (18) (19) (20) (21) (22) (23)
nil0 0 0 0 0 0 0 0 0 0 0 0 0 0 0 0 0 0 0 0 0 0
>0.000& ≤0.0020 0 0 0 0 0 0 0 0 0 0 0 0 0 0 0 0 0 0 0 0 0
0.002-0.0050 308 308 76 468 522 0 0 0 0 0 0 0 0 0 0 0 0 0 0 108 10
0.005-0.0400 11 11 11 35 35 0 0 0 0 0 0 0 0 0 0 0 0 0 0 1898 14
0.040-0.5297 219 501 307 159 454 0 0 0 0 0 0 0 0 0 0 0 0 0 0 5376 42
0.5-1.0749 768 979 646 827 875 26 0 26 0 0 0 0 0 0 0 0 0 0 0 2923 33
1.0-2.0875 929 962 774 905 939 121 6 127 2 2 2 0 0 0 0 0 0 0 1 1612 91
2.0-3.0699 900 900 776 881 931 500 159 527 27 128 145 0 0 0 0 0 0 0 0 286 40
3.0-4.0148 759 759 407 1000 1000 302 0 302 0 0 0 0 0 0 0 0 0 0 247 26 6
4.0-5.00 0 0 0 0 0 0 0 0 0 0 0 0 0 0 0 0 0 0 0 0 0
5.0-7.50 1000 1000 0 1000 1000 1000 0 1000 0 0 0 0 0 0 0 0 0 0 0 5 1
7.5-10.00 0 0 0 0 0 0 0 0 0 0 0 0 0 0 0 0 0 0 0 0 0
10.0-20.00 0 0 0 0 0 0 0 0 0 0 0 0 0 0 0 0 0 0 0 0 0
>20.00 0 0 0 0 0 0 0 0 0 0 0 0 0 0 0 0 0 0 0 0 0
All441 429 608 413 420 567 35 5 36 1 3 4 0 0 0 0 0 0 0 1 12234 237
Estd. no of opr.
holdings (00) 5399 5254 7444 5050 5133 6931 427 55 444 11 40 45 0 0 0 0 0 0 0 8 XXX XXX
Sample no of opr.
holdings 114 158 175 110 148 169 30 9 34 4 6 7 0 0 0 0 0 0 0 2 XXX XXX
Yak Mithun Elephant
Table 34: Number of households reporting owning of livestock of different types per 1000 households for each size class of household operational holding
WEST BENGAL SOCIAL GROUP:OTHER BACKWARD CLASS VISIT 1
Size class of hh
operational
holding (ha)
Number per 1000 households reporting owning of No. of opr.
holdingsAdult cattle Young cattle Adult buffalo Young buffaloHorse
and
pony
Mule Donkey Camel
Other
live
stock
A 98
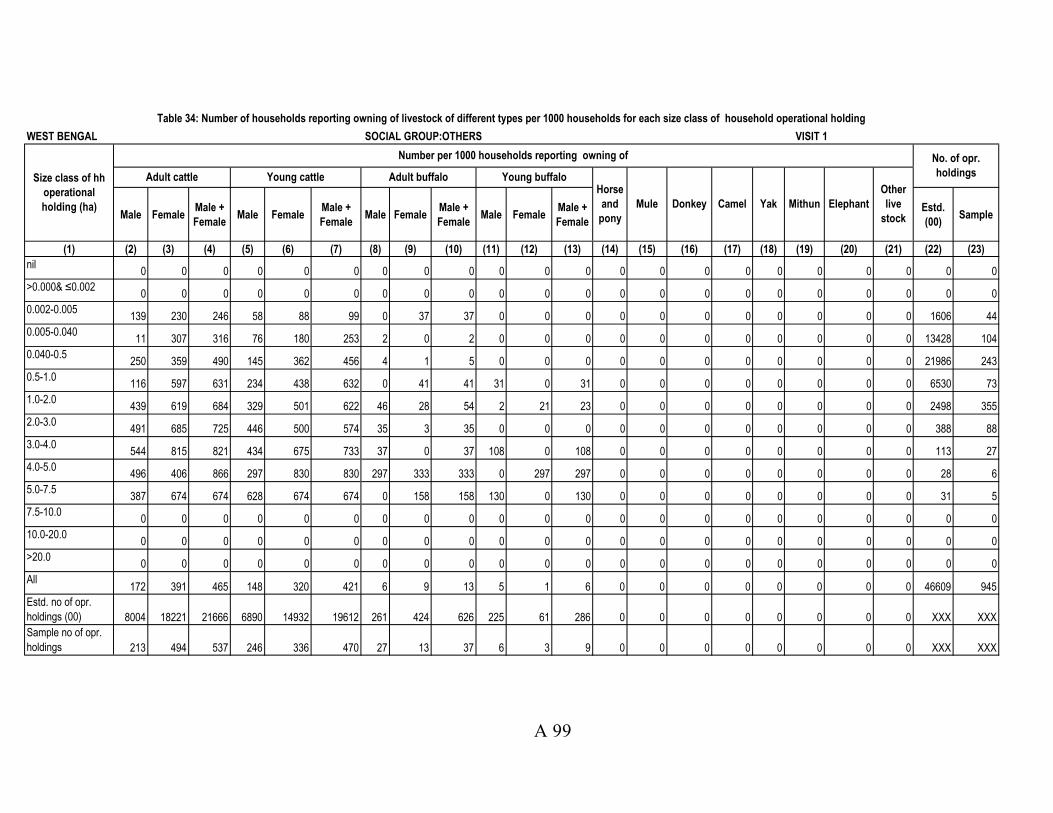
Male FemaleMale +
FemaleMale Female
Male +
FemaleMale Female
Male +
FemaleMale Female
Male +
Female
Estd.
(00)Sample
(1) (2) (3) (4) (5) (6) (7) (8) (9) (10) (11) (12) (13) (14) (15) (16) (17) (18) (19) (20) (21) (22) (23)
nil0 0 0 0 0 0 0 0 0 0 0 0 0 0 0 0 0 0 0 0 0 0
>0.000& ≤0.0020 0 0 0 0 0 0 0 0 0 0 0 0 0 0 0 0 0 0 0 0 0
0.002-0.005139 230 246 58 88 99 0 37 37 0 0 0 0 0 0 0 0 0 0 0 1606 44
0.005-0.04011 307 316 76 180 253 2 0 2 0 0 0 0 0 0 0 0 0 0 0 13428 104
0.040-0.5250 359 490 145 362 456 4 1 5 0 0 0 0 0 0 0 0 0 0 0 21986 243
0.5-1.0116 597 631 234 438 632 0 41 41 31 0 31 0 0 0 0 0 0 0 0 6530 73
1.0-2.0439 619 684 329 501 622 46 28 54 2 21 23 0 0 0 0 0 0 0 0 2498 355
2.0-3.0491 685 725 446 500 574 35 3 35 0 0 0 0 0 0 0 0 0 0 0 388 88
3.0-4.0544 815 821 434 675 733 37 0 37 108 0 108 0 0 0 0 0 0 0 0 113 27
4.0-5.0496 406 866 297 830 830 297 333 333 0 297 297 0 0 0 0 0 0 0 0 28 6
5.0-7.5387 674 674 628 674 674 0 158 158 130 0 130 0 0 0 0 0 0 0 0 31 5
7.5-10.00 0 0 0 0 0 0 0 0 0 0 0 0 0 0 0 0 0 0 0 0 0
10.0-20.00 0 0 0 0 0 0 0 0 0 0 0 0 0 0 0 0 0 0 0 0 0
>20.00 0 0 0 0 0 0 0 0 0 0 0 0 0 0 0 0 0 0 0 0 0
All172 391 465 148 320 421 6 9 13 5 1 6 0 0 0 0 0 0 0 0 46609 945
Estd. no of opr.
holdings (00) 8004 18221 21666 6890 14932 19612 261 424 626 225 61 286 0 0 0 0 0 0 0 0 XXX XXX
Sample no of opr.
holdings 213 494 537 246 336 470 27 13 37 6 3 9 0 0 0 0 0 0 0 0 XXX XXX
Camel Yak Mithun
Table 34: Number of households reporting owning of livestock of different types per 1000 households for each size class of household operational holding
WEST BENGAL SOCIAL GROUP:OTHERS VISIT 1
Size class of hh
operational
holding (ha)
Number per 1000 households reporting owning of No. of opr.
holdingsAdult cattle Young cattle Adult buffalo Young buffaloHorse
and
pony
Mule Donkey Elephant
Other
live
stock
A 99
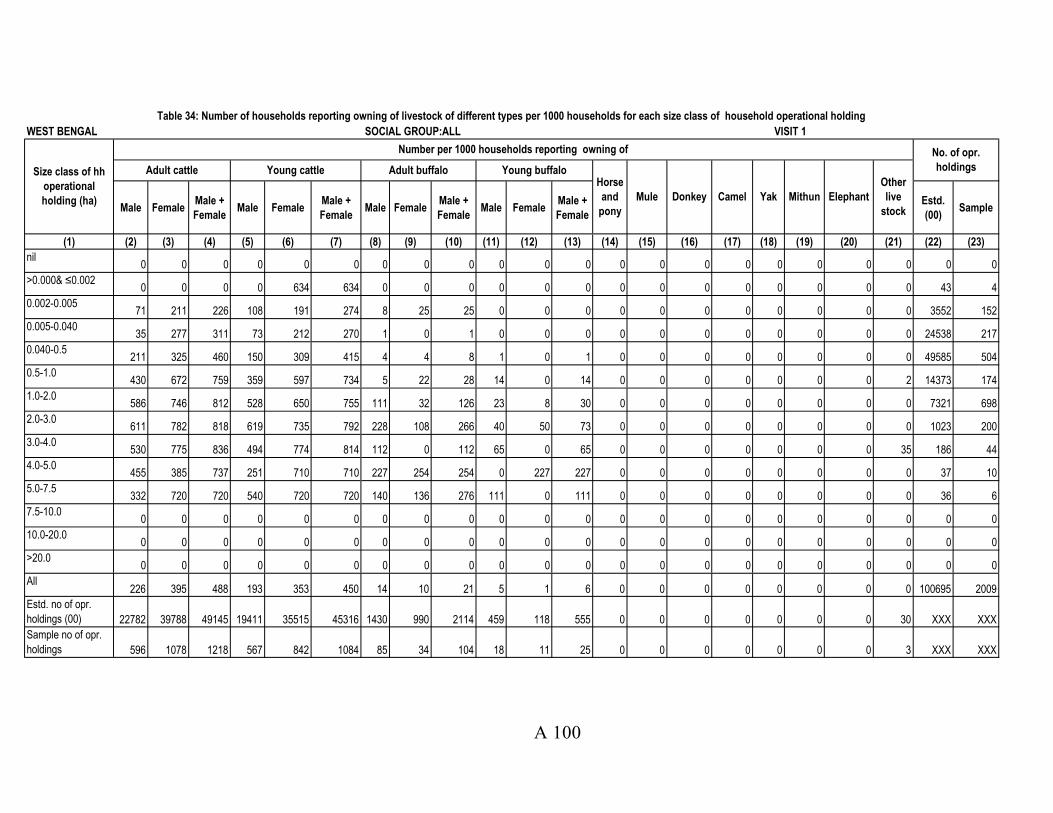
Male FemaleMale +
FemaleMale Female
Male +
FemaleMale Female
Male +
FemaleMale Female
Male +
Female
Estd.
(00)Sample
(1) (2) (3) (4) (5) (6) (7) (8) (9) (10) (11) (12) (13) (14) (15) (16) (17) (18) (19) (20) (21) (22) (23)
nil0 0 0 0 0 0 0 0 0 0 0 0 0 0 0 0 0 0 0 0 0 0
>0.000& ≤0.0020 0 0 0 634 634 0 0 0 0 0 0 0 0 0 0 0 0 0 0 43 4
0.002-0.00571 211 226 108 191 274 8 25 25 0 0 0 0 0 0 0 0 0 0 0 3552 152
0.005-0.04035 277 311 73 212 270 1 0 1 0 0 0 0 0 0 0 0 0 0 0 24538 217
0.040-0.5211 325 460 150 309 415 4 4 8 1 0 1 0 0 0 0 0 0 0 0 49585 504
0.5-1.0430 672 759 359 597 734 5 22 28 14 0 14 0 0 0 0 0 0 0 2 14373 174
1.0-2.0586 746 812 528 650 755 111 32 126 23 8 30 0 0 0 0 0 0 0 0 7321 698
2.0-3.0611 782 818 619 735 792 228 108 266 40 50 73 0 0 0 0 0 0 0 0 1023 200
3.0-4.0530 775 836 494 774 814 112 0 112 65 0 65 0 0 0 0 0 0 0 35 186 44
4.0-5.0455 385 737 251 710 710 227 254 254 0 227 227 0 0 0 0 0 0 0 0 37 10
5.0-7.5332 720 720 540 720 720 140 136 276 111 0 111 0 0 0 0 0 0 0 0 36 6
7.5-10.00 0 0 0 0 0 0 0 0 0 0 0 0 0 0 0 0 0 0 0 0 0
10.0-20.00 0 0 0 0 0 0 0 0 0 0 0 0 0 0 0 0 0 0 0 0 0
>20.00 0 0 0 0 0 0 0 0 0 0 0 0 0 0 0 0 0 0 0 0 0
All226 395 488 193 353 450 14 10 21 5 1 6 0 0 0 0 0 0 0 0 100695 2009
Estd. no of opr.
holdings (00) 22782 39788 49145 19411 35515 45316 1430 990 2114 459 118 555 0 0 0 0 0 0 0 30 XXX XXX
Sample no of opr.
holdings 596 1078 1218 567 842 1084 85 34 104 18 11 25 0 0 0 0 0 0 0 3 XXX XXX
Donkey Camel Yak Mithun Elephant
Other
live
stock
Table 34: Number of households reporting owning of livestock of different types per 1000 households for each size class of household operational holding
WEST BENGAL SOCIAL GROUP:ALL VISIT 1
Size class of hh
operational
holding (ha)
Number per 1000 households reporting owning of No. of opr.
holdingsAdult cattle Young cattle Adult buffalo Young buffaloHorse
and
pony
Mule
A 100
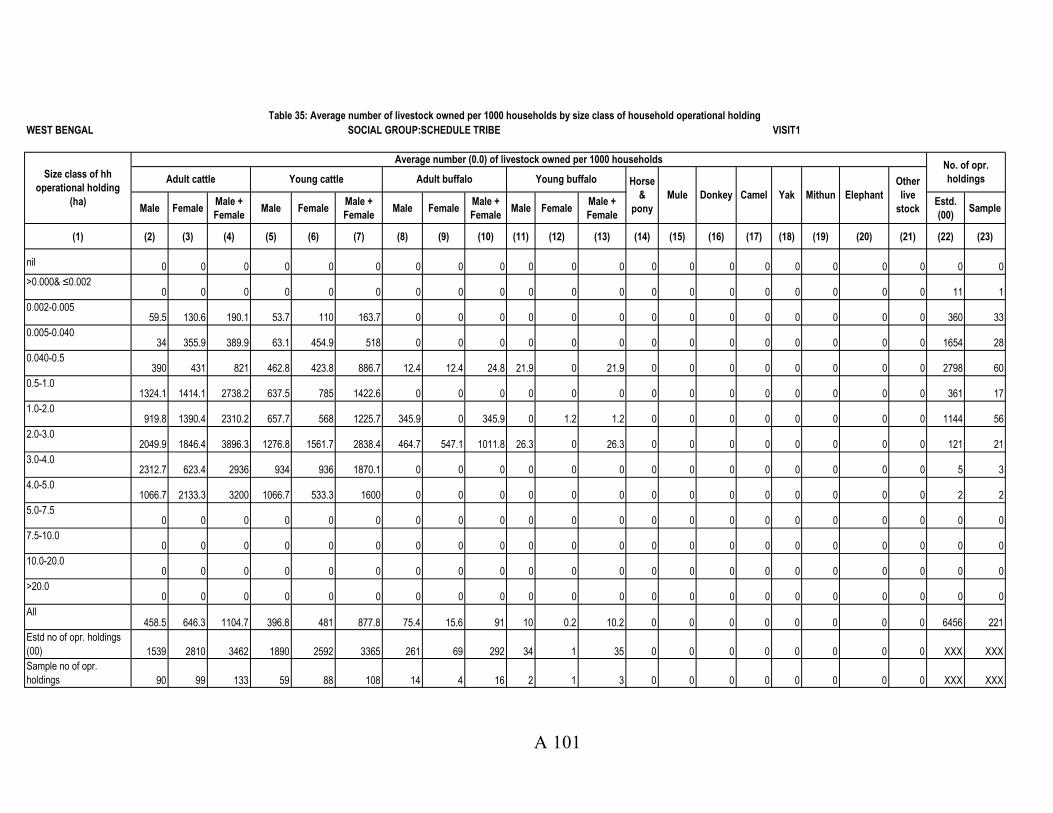
Male FemaleMale +
FemaleMale Female
Male +
FemaleMale Female
Male +
FemaleMale Female
Male +
Female
Estd.
(00)Sample
(1) (2) (3) (4) (5) (6) (7) (8) (9) (10) (11) (12) (13) (14) (15) (16) (17) (18) (19) (20) (21) (22) (23)
nil 0 0 0 0 0 0 0 0 0 0 0 0 0 0 0 0 0 0 0 0 0 0
>0.000& ≤0.0020 0 0 0 0 0 0 0 0 0 0 0 0 0 0 0 0 0 0 0 11 1
0.002-0.00559.5 130.6 190.1 53.7 110 163.7 0 0 0 0 0 0 0 0 0 0 0 0 0 0 360 33
0.005-0.04034 355.9 389.9 63.1 454.9 518 0 0 0 0 0 0 0 0 0 0 0 0 0 0 1654 28
0.040-0.5390 431 821 462.8 423.8 886.7 12.4 12.4 24.8 21.9 0 21.9 0 0 0 0 0 0 0 0 2798 60
0.5-1.01324.1 1414.1 2738.2 637.5 785 1422.6 0 0 0 0 0 0 0 0 0 0 0 0 0 0 361 17
1.0-2.0919.8 1390.4 2310.2 657.7 568 1225.7 345.9 0 345.9 0 1.2 1.2 0 0 0 0 0 0 0 0 1144 56
2.0-3.02049.9 1846.4 3896.3 1276.8 1561.7 2838.4 464.7 547.1 1011.8 26.3 0 26.3 0 0 0 0 0 0 0 0 121 21
3.0-4.02312.7 623.4 2936 934 936 1870.1 0 0 0 0 0 0 0 0 0 0 0 0 0 0 5 3
4.0-5.01066.7 2133.3 3200 1066.7 533.3 1600 0 0 0 0 0 0 0 0 0 0 0 0 0 0 2 2
5.0-7.50 0 0 0 0 0 0 0 0 0 0 0 0 0 0 0 0 0 0 0 0 0
7.5-10.00 0 0 0 0 0 0 0 0 0 0 0 0 0 0 0 0 0 0 0 0 0
10.0-20.00 0 0 0 0 0 0 0 0 0 0 0 0 0 0 0 0 0 0 0 0 0
>20.00 0 0 0 0 0 0 0 0 0 0 0 0 0 0 0 0 0 0 0 0 0
All458.5 646.3 1104.7 396.8 481 877.8 75.4 15.6 91 10 0.2 10.2 0 0 0 0 0 0 0 0 6456 221
Estd no of opr. holdings
(00) 1539 2810 3462 1890 2592 3365 261 69 292 34 1 35 0 0 0 0 0 0 0 0 XXX XXX
Sample no of opr.
holdings 90 99 133 59 88 108 14 4 16 2 1 3 0 0 0 0 0 0 0 0 XXX XXX
Adult buffalo
Table 35: Average number of livestock owned per 1000 households by size class of household operational holding
WEST BENGAL SOCIAL GROUP:SCHEDULE TRIBE VISIT1
Size class of hh
operational holding
(ha)
Average number (0.0) of livestock owned per 1000 householdsNo. of opr.
holdingsAdult cattle Young cattle Horse
&
pony
Mule Donkey Camel Yak Mithun Elephant
Other
live
stock
Young buffalo
A 101
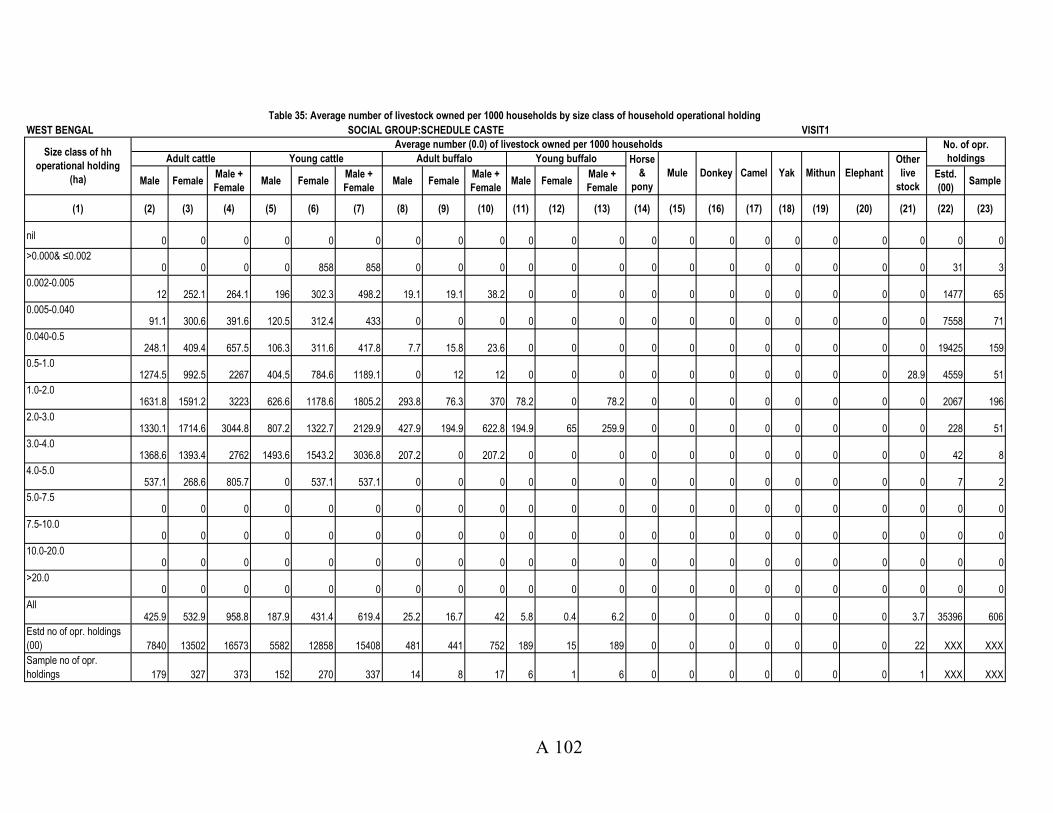
Male FemaleMale +
FemaleMale Female
Male +
FemaleMale Female
Male +
FemaleMale Female
Male +
Female
Estd.
(00)Sample
(1) (2) (3) (4) (5) (6) (7) (8) (9) (10) (11) (12) (13) (14) (15) (16) (17) (18) (19) (20) (21) (22) (23)
nil0 0 0 0 0 0 0 0 0 0 0 0 0 0 0 0 0 0 0 0 0 0
>0.000& ≤0.0020 0 0 0 858 858 0 0 0 0 0 0 0 0 0 0 0 0 0 0 31 3
0.002-0.00512 252.1 264.1 196 302.3 498.2 19.1 19.1 38.2 0 0 0 0 0 0 0 0 0 0 0 1477 65
0.005-0.04091.1 300.6 391.6 120.5 312.4 433 0 0 0 0 0 0 0 0 0 0 0 0 0 0 7558 71
0.040-0.5248.1 409.4 657.5 106.3 311.6 417.8 7.7 15.8 23.6 0 0 0 0 0 0 0 0 0 0 0 19425 159
0.5-1.01274.5 992.5 2267 404.5 784.6 1189.1 0 12 12 0 0 0 0 0 0 0 0 0 0 28.9 4559 51
1.0-2.01631.8 1591.2 3223 626.6 1178.6 1805.2 293.8 76.3 370 78.2 0 78.2 0 0 0 0 0 0 0 0 2067 196
2.0-3.01330.1 1714.6 3044.8 807.2 1322.7 2129.9 427.9 194.9 622.8 194.9 65 259.9 0 0 0 0 0 0 0 0 228 51
3.0-4.01368.6 1393.4 2762 1493.6 1543.2 3036.8 207.2 0 207.2 0 0 0 0 0 0 0 0 0 0 0 42 8
4.0-5.0537.1 268.6 805.7 0 537.1 537.1 0 0 0 0 0 0 0 0 0 0 0 0 0 0 7 2
5.0-7.50 0 0 0 0 0 0 0 0 0 0 0 0 0 0 0 0 0 0 0 0 0
7.5-10.00 0 0 0 0 0 0 0 0 0 0 0 0 0 0 0 0 0 0 0 0 0
10.0-20.00 0 0 0 0 0 0 0 0 0 0 0 0 0 0 0 0 0 0 0 0 0
>20.00 0 0 0 0 0 0 0 0 0 0 0 0 0 0 0 0 0 0 0 0 0
All425.9 532.9 958.8 187.9 431.4 619.4 25.2 16.7 42 5.8 0.4 6.2 0 0 0 0 0 0 0 3.7 35396 606
Estd no of opr. holdings
(00) 7840 13502 16573 5582 12858 15408 481 441 752 189 15 189 0 0 0 0 0 0 0 22 XXX XXX
Sample no of opr.
holdings 179 327 373 152 270 337 14 8 17 6 1 6 0 0 0 0 0 0 0 1 XXX XXX
Adult buffalo Young buffalo
Average number (0.0) of livestock owned per 1000 households
Table 35: Average number of livestock owned per 1000 households by size class of household operational holding
WEST BENGAL SOCIAL GROUP:SCHEDULE CASTE VISIT1
Size class of hh
operational holding
(ha)
No. of opr.
holdingsAdult cattle Young cattle Horse
&
pony
Mule Donkey Camel Yak Mithun Elephant
Other
live
stock
A 102
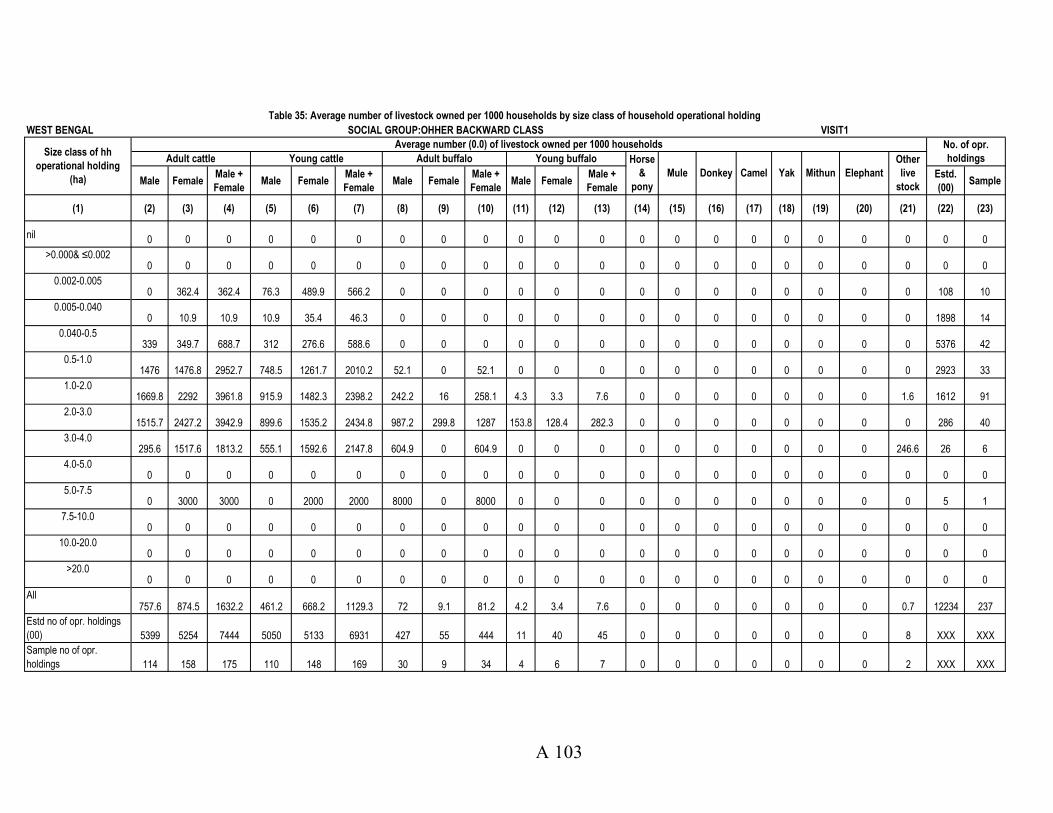
Male FemaleMale +
FemaleMale Female
Male +
FemaleMale Female
Male +
FemaleMale Female
Male +
Female
Estd.
(00)Sample
(1) (2) (3) (4) (5) (6) (7) (8) (9) (10) (11) (12) (13) (14) (15) (16) (17) (18) (19) (20) (21) (22) (23)
nil 0 0 0 0 0 0 0 0 0 0 0 0 0 0 0 0 0 0 0 0 0 0
>0.000& ≤0.0020 0 0 0 0 0 0 0 0 0 0 0 0 0 0 0 0 0 0 0 0 0
0.002-0.0050 362.4 362.4 76.3 489.9 566.2 0 0 0 0 0 0 0 0 0 0 0 0 0 0 108 10
0.005-0.0400 10.9 10.9 10.9 35.4 46.3 0 0 0 0 0 0 0 0 0 0 0 0 0 0 1898 14
0.040-0.5339 349.7 688.7 312 276.6 588.6 0 0 0 0 0 0 0 0 0 0 0 0 0 0 5376 42
0.5-1.01476 1476.8 2952.7 748.5 1261.7 2010.2 52.1 0 52.1 0 0 0 0 0 0 0 0 0 0 0 2923 33
1.0-2.01669.8 2292 3961.8 915.9 1482.3 2398.2 242.2 16 258.1 4.3 3.3 7.6 0 0 0 0 0 0 0 1.6 1612 91
2.0-3.01515.7 2427.2 3942.9 899.6 1535.2 2434.8 987.2 299.8 1287 153.8 128.4 282.3 0 0 0 0 0 0 0 0 286 40
3.0-4.0295.6 1517.6 1813.2 555.1 1592.6 2147.8 604.9 0 604.9 0 0 0 0 0 0 0 0 0 0 246.6 26 6
4.0-5.00 0 0 0 0 0 0 0 0 0 0 0 0 0 0 0 0 0 0 0 0 0
5.0-7.50 3000 3000 0 2000 2000 8000 0 8000 0 0 0 0 0 0 0 0 0 0 0 5 1
7.5-10.00 0 0 0 0 0 0 0 0 0 0 0 0 0 0 0 0 0 0 0 0 0
10.0-20.00 0 0 0 0 0 0 0 0 0 0 0 0 0 0 0 0 0 0 0 0 0
>20.00 0 0 0 0 0 0 0 0 0 0 0 0 0 0 0 0 0 0 0 0 0
All757.6 874.5 1632.2 461.2 668.2 1129.3 72 9.1 81.2 4.2 3.4 7.6 0 0 0 0 0 0 0 0.7 12234 237
Estd no of opr. holdings
(00) 5399 5254 7444 5050 5133 6931 427 55 444 11 40 45 0 0 0 0 0 0 0 8 XXX XXX
Sample no of opr.
holdings 114 158 175 110 148 169 30 9 34 4 6 7 0 0 0 0 0 0 0 2 XXX XXX
Adult buffalo Young buffalo
Table 35: Average number of livestock owned per 1000 households by size class of household operational holding
WEST BENGAL SOCIAL GROUP:OHHER BACKWARD CLASS VISIT1
Size class of hh
operational holding
(ha)
Average number (0.0) of livestock owned per 1000 households No. of opr.
holdingsAdult cattle Young cattle Horse
&
pony
Mule Donkey Camel Yak Mithun Elephant
Other
live
stock
A 103
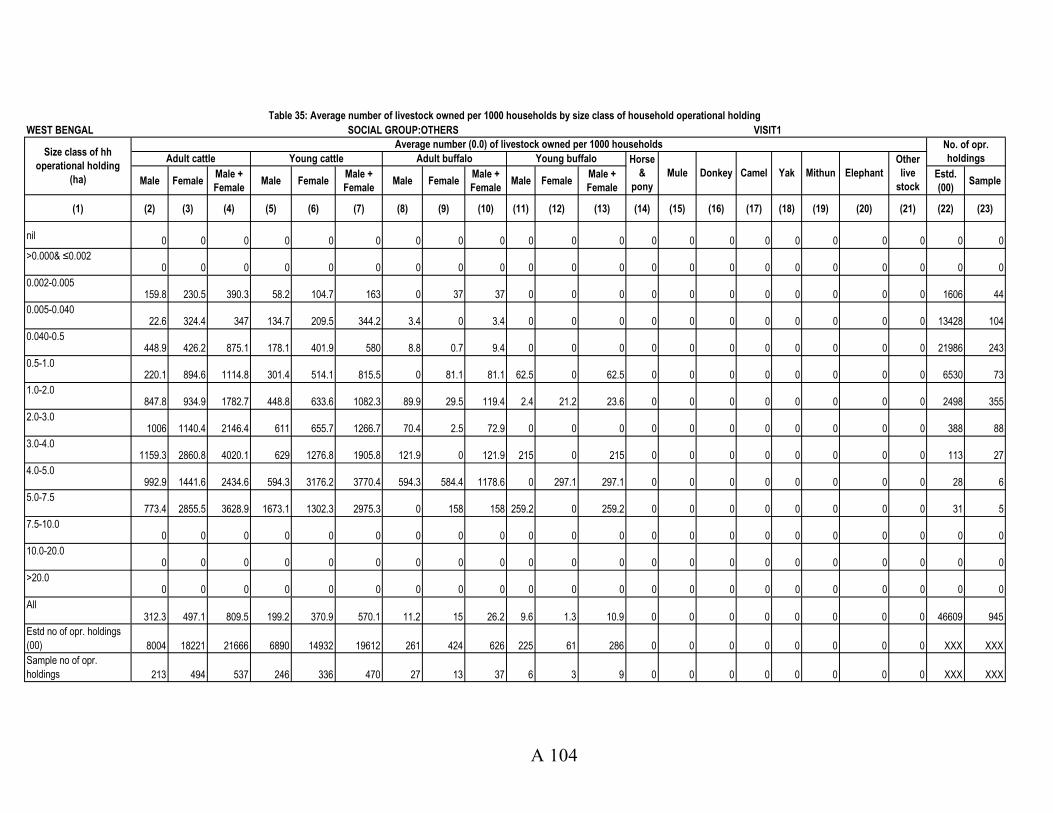
Male FemaleMale +
FemaleMale Female
Male +
FemaleMale Female
Male +
FemaleMale Female
Male +
Female
Estd.
(00)Sample
(1) (2) (3) (4) (5) (6) (7) (8) (9) (10) (11) (12) (13) (14) (15) (16) (17) (18) (19) (20) (21) (22) (23)
nil0 0 0 0 0 0 0 0 0 0 0 0 0 0 0 0 0 0 0 0 0 0
>0.000& ≤0.0020 0 0 0 0 0 0 0 0 0 0 0 0 0 0 0 0 0 0 0 0 0
0.002-0.005159.8 230.5 390.3 58.2 104.7 163 0 37 37 0 0 0 0 0 0 0 0 0 0 0 1606 44
0.005-0.04022.6 324.4 347 134.7 209.5 344.2 3.4 0 3.4 0 0 0 0 0 0 0 0 0 0 0 13428 104
0.040-0.5448.9 426.2 875.1 178.1 401.9 580 8.8 0.7 9.4 0 0 0 0 0 0 0 0 0 0 0 21986 243
0.5-1.0220.1 894.6 1114.8 301.4 514.1 815.5 0 81.1 81.1 62.5 0 62.5 0 0 0 0 0 0 0 0 6530 73
1.0-2.0847.8 934.9 1782.7 448.8 633.6 1082.3 89.9 29.5 119.4 2.4 21.2 23.6 0 0 0 0 0 0 0 0 2498 355
2.0-3.01006 1140.4 2146.4 611 655.7 1266.7 70.4 2.5 72.9 0 0 0 0 0 0 0 0 0 0 0 388 88
3.0-4.01159.3 2860.8 4020.1 629 1276.8 1905.8 121.9 0 121.9 215 0 215 0 0 0 0 0 0 0 0 113 27
4.0-5.0992.9 1441.6 2434.6 594.3 3176.2 3770.4 594.3 584.4 1178.6 0 297.1 297.1 0 0 0 0 0 0 0 0 28 6
5.0-7.5773.4 2855.5 3628.9 1673.1 1302.3 2975.3 0 158 158 259.2 0 259.2 0 0 0 0 0 0 0 0 31 5
7.5-10.00 0 0 0 0 0 0 0 0 0 0 0 0 0 0 0 0 0 0 0 0 0
10.0-20.00 0 0 0 0 0 0 0 0 0 0 0 0 0 0 0 0 0 0 0 0 0
>20.00 0 0 0 0 0 0 0 0 0 0 0 0 0 0 0 0 0 0 0 0 0
All312.3 497.1 809.5 199.2 370.9 570.1 11.2 15 26.2 9.6 1.3 10.9 0 0 0 0 0 0 0 0 46609 945
Estd no of opr. holdings
(00) 8004 18221 21666 6890 14932 19612 261 424 626 225 61 286 0 0 0 0 0 0 0 0 XXX XXX
Sample no of opr.
holdings 213 494 537 246 336 470 27 13 37 6 3 9 0 0 0 0 0 0 0 0 XXX XXX
Size class of hh
operational holding
(ha)
Average number (0.0) of livestock owned per 1000 households
Adult buffalo Young buffalo
Table 35: Average number of livestock owned per 1000 households by size class of household operational holding
WEST BENGAL SOCIAL GROUP:OTHERS VISIT1
No. of opr.
holdingsAdult cattle Young cattle Horse
&
pony
Mule Donkey Camel Yak Mithun Elephant
Other
live
stock
A 104

Male FemaleMale +
FemaleMale Female
Male +
FemaleMale Female
Male +
FemaleMale Female
Male +
Female
Estd.
(00)Sample
(1) (2) (3) (4) (5) (6) (7) (8) (9) (10) (11) (12) (13) (14) (15) (16) (17) (18) (19) (20) (21) (22) (23)
nil0 0 0 0 0 0 0 0 0 0 0 0 0 0 0 0 0 0 0 0 0 0
>0.000& ≤0.0020 0 0 0 634.1 634.1 0 0 0 0 0 0 0 0 0 0 0 0 0 0 43 4
0.002-0.00583.3 233.4 316.7 115.6 199.1 314.7 8 24.7 32.6 0 0 0 0 0 0 0 0 0 0 0 3552 152
0.005-0.04042.7 294.9 337.6 116 244.3 360.2 1.9 0 1.9 0 0 0 0 0 0 0 0 0 0 0 24538 217
0.040-0.5355 411.6 766.6 180.6 354.2 534.7 7.6 7.2 14.8 1.2 0 1.2 0 0 0 0 0 0 0 0 49585 504
0.5-1.0837.7 1057.1 1894.8 433.4 758.7 1192.2 10.6 40.7 51.3 28.4 0 28.4 0 0 0 0 0 0 0 9.2 14373 174
1.0-2.01261.4 1490.1 2751.5 634.5 964 1598.5 221 35.1 256.1 23.8 8.1 32 0 0 0 0 0 0 0 0.4 7321 698
2.0-3.01343.8 1711.2 3055 813.9 1157.1 1971 452.7 192.7 645.5 89.6 50.4 139.9 0 0 0 0 0 0 0 0 1023 200
3.0-4.01116.4 2278.6 3395 823.9 1372.8 2196.7 205.9 0 205.9 130.1 0 130.1 0 0 0 0 0 0 0 34.6 186 44
4.0-5.0909 1248.1 2157.2 501.7 2553.6 3055.3 454.1 446.5 900.7 0 227.1 227.1 0 0 0 0 0 0 0 0 37 10
5.0-7.5664.9 2875.7 3540.6 1438.3 1400.2 2838.5 1122.5 135.9 1258.4 222.9 0 222.9 0 0 0 0 0 0 0 0 36 6
7.5-10.00 0 0 0 0 0 0 0 0 0 0 0 0 0 0 0 0 0 0 0 0 0
10.0-20.00 0 0 0 0 0 0 0 0 0 0 0 0 0 0 0 0 0 0 0 0 0
>20.00 0 0 0 0 0 0 0 0 0 0 0 0 0 0 0 0 0 0 0 0 0
All415.7 565.1 980.8 239.7 435.4 675.1 27.6 14.9 42.6 7.6 1.2 8.8 0 0 0 0 0 0 0 1.4 100695 2009
Estd no of opr. holdings
(00) 22782 39788 49145 19411 35515 45316 1430 990 2114 459 118 555 0 0 0 0 0 0 0 30 XXX XXX
Sample no of opr.
holdings 596 1078 1218 567 842 1084 85 34 104 18 11 25 0 0 0 0 0 0 0 3 XXX XXX
Adult cattle Young cattle Horse
&
pony
Mule Donkey Camel Yak Mithun Elephant
Adult buffalo Young buffalo Other
live
stock
Table 35: Average number of livestock owned per 1000 households by size class of household operational holding
WEST BENGAL SOCIAL GROUP: ALL VISIT1
Size class of hh
operational holding
(ha)
Average number (0.0) of livestock owned per 1000 households No. of opr.
holdings
A 105
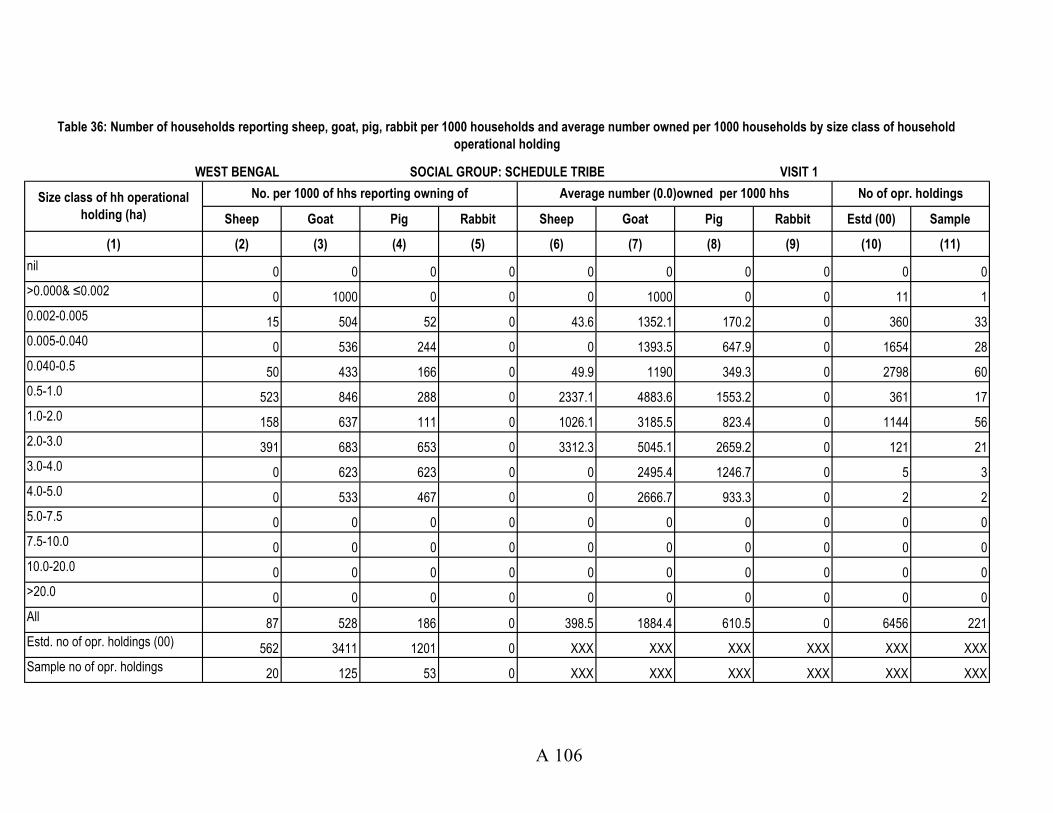
Sheep Goat Pig Rabbit Sheep Goat Pig Rabbit Estd (00) Sample
(1) (2) (3) (4) (5) (6) (7) (8) (9) (10) (11)
nil 0 0 0 0 0 0 0 0 0 0
>0.000& ≤0.002 0 1000 0 0 0 1000 0 0 11 1
0.002-0.005 15 504 52 0 43.6 1352.1 170.2 0 360 33
0.005-0.040 0 536 244 0 0 1393.5 647.9 0 1654 28
0.040-0.5 50 433 166 0 49.9 1190 349.3 0 2798 60
0.5-1.0 523 846 288 0 2337.1 4883.6 1553.2 0 361 17
1.0-2.0 158 637 111 0 1026.1 3185.5 823.4 0 1144 56
2.0-3.0 391 683 653 0 3312.3 5045.1 2659.2 0 121 21
3.0-4.0 0 623 623 0 0 2495.4 1246.7 0 5 3
4.0-5.0 0 533 467 0 0 2666.7 933.3 0 2 2
5.0-7.5 0 0 0 0 0 0 0 0 0 0
7.5-10.0 0 0 0 0 0 0 0 0 0 0
10.0-20.0 0 0 0 0 0 0 0 0 0 0
>20.0 0 0 0 0 0 0 0 0 0 0
All87 528 186 0 398.5 1884.4 610.5 0 6456 221
Estd. no of opr. holdings (00)562 3411 1201 0 XXX XXX XXX XXX XXX XXX
Sample no of opr. holdings20 125 53 0 XXX XXX XXX XXX XXX XXX
Table 36: Number of households reporting sheep, goat, pig, rabbit per 1000 households and average number owned per 1000 households by size class of household
operational holding
WEST BENGAL SOCIAL GROUP: SCHEDULE TRIBE VISIT 1
Size class of hh operational
holding (ha)
No. per 1000 of hhs reporting owning of Average number (0.0)owned per 1000 hhs No of opr. holdings
A 106
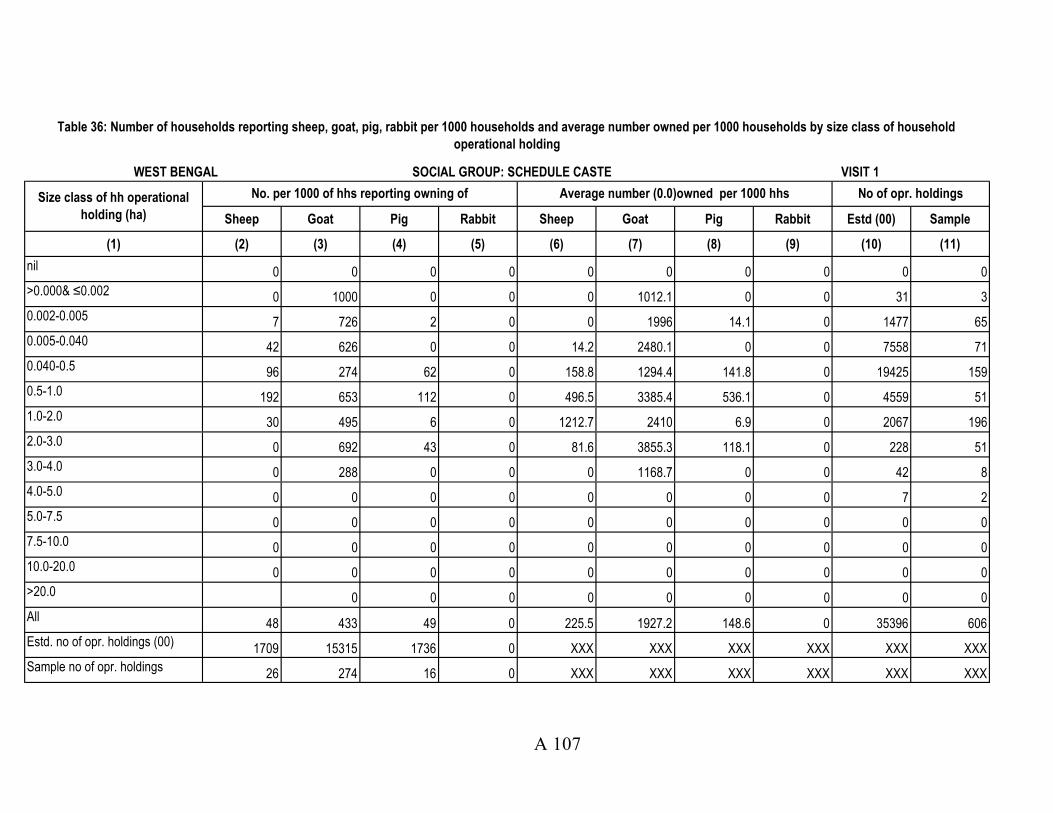
Sheep Goat Pig Rabbit Sheep Goat Pig Rabbit Estd (00) Sample
(1) (2) (3) (4) (5) (6) (7) (8) (9) (10) (11)
nil 0 0 0 0 0 0 0 0 0 0
>0.000& ≤0.002 0 1000 0 0 0 1012.1 0 0 31 3
0.002-0.005 7 726 2 0 0 1996 14.1 0 1477 65
0.005-0.040 42 626 0 0 14.2 2480.1 0 0 7558 71
0.040-0.5 96 274 62 0 158.8 1294.4 141.8 0 19425 159
0.5-1.0 192 653 112 0 496.5 3385.4 536.1 0 4559 51
1.0-2.0 30 495 6 0 1212.7 2410 6.9 0 2067 196
2.0-3.0 0 692 43 0 81.6 3855.3 118.1 0 228 51
3.0-4.0 0 288 0 0 0 1168.7 0 0 42 8
4.0-5.0 0 0 0 0 0 0 0 0 7 2
5.0-7.5 0 0 0 0 0 0 0 0 0 0
7.5-10.0 0 0 0 0 0 0 0 0 0 0
10.0-20.0 0 0 0 0 0 0 0 0 0 0
>20.0 0 0 0 0 0 0 0 0 0
All48 433 49 0 225.5 1927.2 148.6 0 35396 606
Estd. no of opr. holdings (00)1709 15315 1736 0 XXX XXX XXX XXX XXX XXX
Sample no of opr. holdings26 274 16 0 XXX XXX XXX XXX XXX XXX
WEST BENGAL SOCIAL GROUP: SCHEDULE CASTE VISIT 1
Size class of hh operational
holding (ha)
No. per 1000 of hhs reporting owning of Average number (0.0)owned per 1000 hhs No of opr. holdings
Table 36: Number of households reporting sheep, goat, pig, rabbit per 1000 households and average number owned per 1000 households by size class of household
operational holding
A 107

Sheep Goat Pig Rabbit Sheep Goat Pig Rabbit Estd (00) Sample
(1) (2) (3) (4) (5) (6) (7) (8) (9) (10) (11)
nil 0 0 0 0 0 0 0 0 0 0
>0.000& ≤0.002 22 0 0 0 0 0 0 0 0 0
0.002-0.005 53 602 0 0 88.5 2381.5 0 0 108 10
0.005-0.040 38 261 0 0 53.2 557.7 0 0 1898 14
0.040-0.5 207 440 0 0 153.9 1474.5 0 0 5376 42
0.5-1.0 200 602 12 0 880.2 2675.5 124.9 0 2923 33
1.0-2.0 220 683 73 0 1062.1 4920.7 890.9 0 1612 91
2.0-3.0 0 543 0 0 1400.5 4241.7 0 0 286 40
3.0-4.0 0 606 148 0 0 2792.5 1182.2 0 26 6
4.0-5.0 0 0 0 0 0 0 0 0 0 0
5.0-7.5 0 0 0 0 0 0 0 0 5 1
7.5-10.0 0 0 0 0 0 0 0 0 0 0
10.0-20.0 0 0 0 0 0 0 0 0 0 0
>20.0 106 0 0 0 0 0 0 0 0 0
All106 487 13 0 459.6 2148 149.7 0 12234 237
Estd. no of opr. holdings (00)1301 5954 158 0 XXX XXX XXX XXX XXX XXX
Sample no of opr. holdings29 108 4 0 XXX XXX XXX XXX XXX XXX
WEST BENGAL SOCIAL GROUP: OTHER BACKWARD CLASS VISIT 1
Size class of hh operational
holding (ha)
No. per 1000 of hhs reporting owning of Average number (0.0)owned per 1000 hhs No of opr. holdings
Table 36: Number of households reporting sheep, goat, pig, rabbit per 1000 households and average number owned per 1000 households by size class of household
operational holding
A 108

Sheep Goat Pig Rabbit Sheep Goat Pig Rabbit Estd (00) Sample
(1) (2) (3) (4) (5) (6) (7) (8) (9) (10) (11)
nil 0 0 0 0 0 0 0 0 0 0
>0.000& ≤0.002 21 0 0 0 0 0 0 0 0 0
0.002-0.005 2 236 0 7 20.5 905.1 0 13.2 1606 44
0.005-0.040 11 434 0 0 4.6 1290.4 0 0 13428 104
0.040-0.5 31 244 0 0 22.2 678.1 0 0 21986 243
0.5-1.0 14 329 0 6 156.2 1178.5 0 60.7 6530 73
1.0-2.0 51 436 1 0 35.2 1554.1 4.5 0 2498 355
2.0-3.0 0 223 0 8 157.8 876.3 0 31.9 388 88
3.0-4.0 0 31 0 0 0 102.7 0 0 113 27
4.0-5.0 0 906 0 0 0 4546.5 0 0 28 6
5.0-7.5 0 666 0 0 0 1331.8 0 0 31 5
7.5-10.0 0 0 0 0 0 0 0 0 0 0
10.0-20.0 0 0 0 0 0 0 0 0 0 0
>20.0 0 0 0 0 0 0 0 0 0 0
All12 321 0 1 37.6 982.4 0.2 9.2 46609 945
Estd. no of opr. holdings (00)566 14961 3 53 XXX XXX XXX XXX XXX XXX
Sample no of opr. holdings15 282 3 3 XXX XXX XXX XXX XXX XXX
WEST BENGAL SOCIAL GROUP: OTHERS VISIT 1
Size class of hh operational
holding (ha)
No. per 1000 of hhs reporting owning of Average number (0.0)owned per 1000 hhs No of opr. holdings
Table 36: Number of households reporting sheep, goat, pig, rabbit per 1000 households and average number owned per 1000 households by size class of household
operational holding
A 109
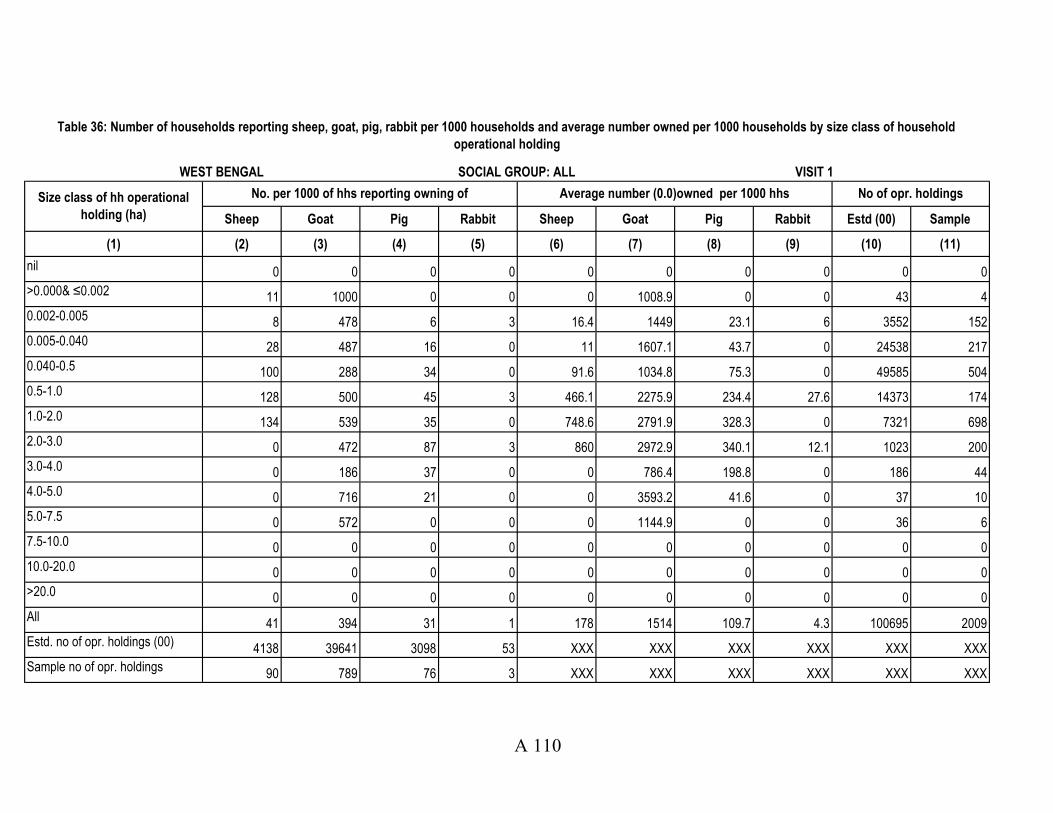
Sheep Goat Pig Rabbit Sheep Goat Pig Rabbit Estd (00) Sample
(1) (2) (3) (4) (5) (6) (7) (8) (9) (10) (11)
nil 0 0 0 0 0 0 0 0 0 0
>0.000& ≤0.002 11 1000 0 0 0 1008.9 0 0 43 4
0.002-0.005 8 478 6 3 16.4 1449 23.1 6 3552 152
0.005-0.040 28 487 16 0 11 1607.1 43.7 0 24538 217
0.040-0.5 100 288 34 0 91.6 1034.8 75.3 0 49585 504
0.5-1.0 128 500 45 3 466.1 2275.9 234.4 27.6 14373 174
1.0-2.0 134 539 35 0 748.6 2791.9 328.3 0 7321 698
2.0-3.0 0 472 87 3 860 2972.9 340.1 12.1 1023 200
3.0-4.0 0 186 37 0 0 786.4 198.8 0 186 44
4.0-5.0 0 716 21 0 0 3593.2 41.6 0 37 10
5.0-7.5 0 572 0 0 0 1144.9 0 0 36 6
7.5-10.0 0 0 0 0 0 0 0 0 0 0
10.0-20.0 0 0 0 0 0 0 0 0 0 0
>20.0 0 0 0 0 0 0 0 0 0 0
All41 394 31 1 178 1514 109.7 4.3 100695 2009
Estd. no of opr. holdings (00)4138 39641 3098 53 XXX XXX XXX XXX XXX XXX
Sample no of opr. holdings90 789 76 3 XXX XXX XXX XXX XXX XXX
WEST BENGAL SOCIAL GROUP: ALL VISIT 1
Size class of hh operational
holding (ha)
No. per 1000 of hhs reporting owning of Average number (0.0)owned per 1000 hhs No of opr. holdings
Table 36: Number of households reporting sheep, goat, pig, rabbit per 1000 households and average number owned per 1000 households by size class of household
operational holding
A 110
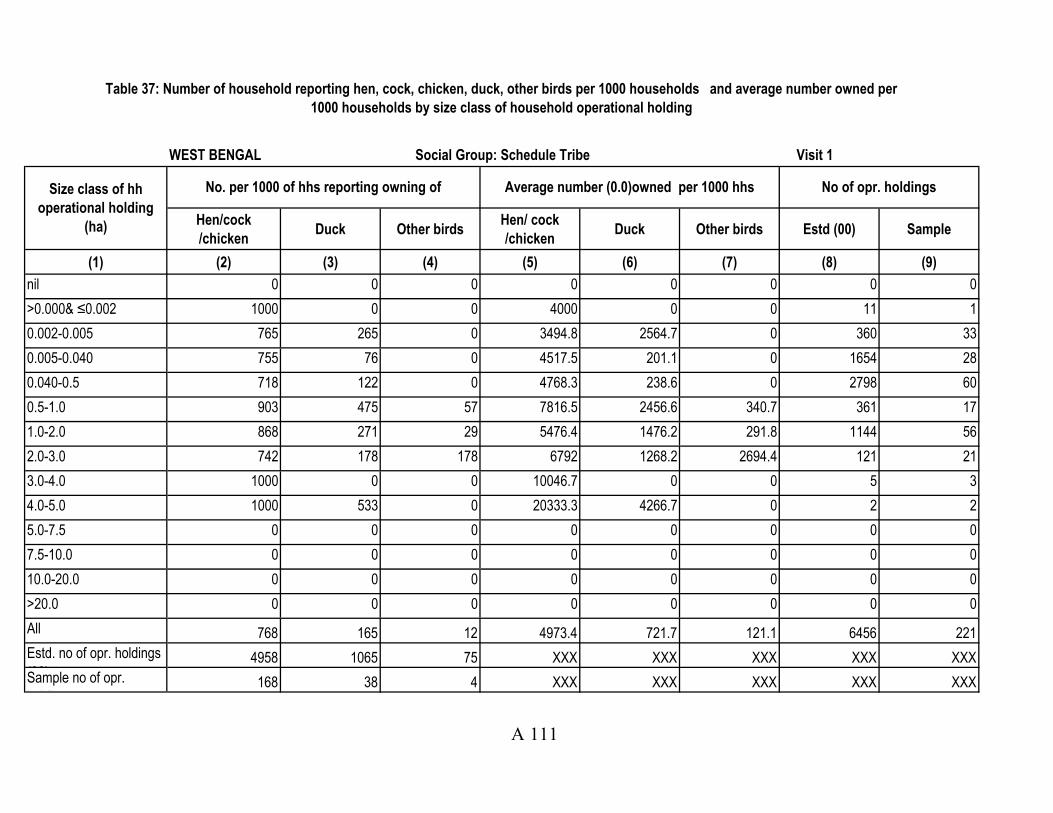
Hen/cock
/chickenDuck Other birds
Hen/ cock
/chickenDuck Other birds Estd (00) Sample
(1) (2) (3) (4) (5) (6) (7) (8) (9)
nil 0 0 0 0 0 0 0 0
>0.000& ≤0.002 1000 0 0 4000 0 0 11 1
0.002-0.005 765 265 0 3494.8 2564.7 0 360 33
0.005-0.040 755 76 0 4517.5 201.1 0 1654 28
0.040-0.5 718 122 0 4768.3 238.6 0 2798 60
0.5-1.0 903 475 57 7816.5 2456.6 340.7 361 17
1.0-2.0 868 271 29 5476.4 1476.2 291.8 1144 56
2.0-3.0 742 178 178 6792 1268.2 2694.4 121 21
3.0-4.0 1000 0 0 10046.7 0 0 5 3
4.0-5.0 1000 533 0 20333.3 4266.7 0 2 2
5.0-7.5 0 0 0 0 0 0 0 0
7.5-10.0 0 0 0 0 0 0 0 0
10.0-20.0 0 0 0 0 0 0 0 0
>20.0 0 0 0 0 0 0 0 0
All 768 165 12 4973.4 721.7 121.1 6456 221
Estd. no of opr. holdings
(00)4958 1065 75 XXX XXX XXX XXX XXX
Sample no of opr.
holdings168 38 4 XXX XXX XXX XXX XXX
WEST BENGAL Social Group: Schedule Tribe Visit 1
Size class of hh
operational holding
(ha)
No. per 1000 of hhs reporting owning of Average number (0.0)owned per 1000 hhs No of opr. holdings
Table 37: Number of household reporting hen, cock, chicken, duck, other birds per 1000 households and average number owned per
1000 households by size class of household operational holding
A 111

Hen/cock
/chickenDuck Other birds
Hen/ cock
/chickenDuck Other birds Estd (00) Sample
(1) (2) (3) (4) (5) (6) (7) (8) (9)
nil 0 0 0 0 0 0 0 0
>0.000& ≤0.002 1000 0 0 4012.1 0 0 31 3
0.002-0.005 434 152 0 2012.3 664.2 0 1477 65
0.005-0.040 196 206 0 910.1 763.4 0 7558 71
0.040-0.5 272 71 0 1393.2 281.2 0 19425 159
0.5-1.0 523 375 59 3633.9 1873.6 603 4559 51
1.0-2.0 326 476 3 2371.8 2708.3 33.5 2067 196
2.0-3.0 263 719 15 1792.1 4712.6 179 228 51
3.0-4.0 516 479 0 1914.8 2457.3 0 42 8
4.0-5.0 269 0 0 3222.6 0 0 7 2
5.0-7.5 0 0 0 0 0 0 0 0
7.5-10.0 0 0 0 0 0 0 0 0
10.0-20.0 0 0 0 0 0 0 0 0
>20.0 0 0 0 0 0 0 0 0
All 299 171 8 1667.6 777.9 80.8 35396 606
Estd. no of opr. holdings
(00)10578 6049 281 XXX XXX XXX XXX XXX
Sample no of opr.
holdings213 141 9 XXX XXX XXX XXX XXX
Table 37: Number of household reporting hen, cock, chicken, duck, other birds per 1000 households and average number owned per
1000 households by size class of household operational holding
WEST BENGAL Social Group: Schedule Caste Visit 1
Size class of hh
operational holding
(ha)
No. per 1000 of hhs reporting owning of Average number (0.0)owned per 1000 hhs No of opr. holdings
A 112
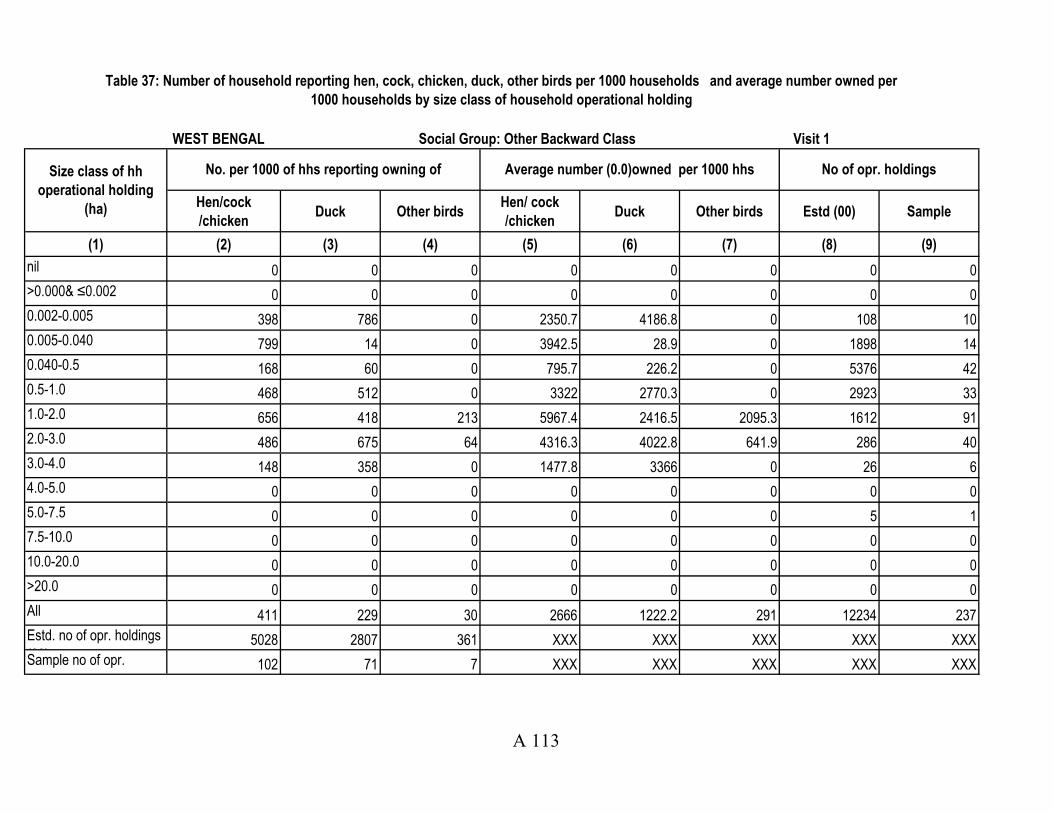
Hen/cock
/chickenDuck Other birds
Hen/ cock
/chickenDuck Other birds Estd (00) Sample
(1) (2) (3) (4) (5) (6) (7) (8) (9)
nil 0 0 0 0 0 0 0 0
>0.000& ≤0.002 0 0 0 0 0 0 0 0
0.002-0.005 398 786 0 2350.7 4186.8 0 108 10
0.005-0.040 799 14 0 3942.5 28.9 0 1898 14
0.040-0.5 168 60 0 795.7 226.2 0 5376 42
0.5-1.0 468 512 0 3322 2770.3 0 2923 33
1.0-2.0 656 418 213 5967.4 2416.5 2095.3 1612 91
2.0-3.0 486 675 64 4316.3 4022.8 641.9 286 40
3.0-4.0 148 358 0 1477.8 3366 0 26 6
4.0-5.0 0 0 0 0 0 0 0 0
5.0-7.5 0 0 0 0 0 0 5 1
7.5-10.0 0 0 0 0 0 0 0 0
10.0-20.0 0 0 0 0 0 0 0 0
>20.0 0 0 0 0 0 0 0 0
All 411 229 30 2666 1222.2 291 12234 237
Estd. no of opr. holdings
(00)5028 2807 361 XXX XXX XXX XXX XXX
Sample no of opr.
holdings102 71 7 XXX XXX XXX XXX XXX
Table 37: Number of household reporting hen, cock, chicken, duck, other birds per 1000 households and average number owned per
1000 households by size class of household operational holding
WEST BENGAL Social Group: Other Backward Class Visit 1
Size class of hh
operational holding
(ha)
No. per 1000 of hhs reporting owning of Average number (0.0)owned per 1000 hhs No of opr. holdings
A 113

Hen/cock
/chickenDuck Other birds
Hen/ cock
/chickenDuck Other birds Estd (00) Sample
(1) (2) (3) (4) (5) (6) (7) (8) (9)
nil 0 0 0 0 0 0 0 0
>0.000& ≤0.002 0 0 0 0 0 0 0 0
0.002-0.005 655 125 52 4069.5 658.1 403 1606 44
0.005-0.040 579 137 0 3173.5 604.4 0 13428 104
0.040-0.5 305 124 0 1658.1 611.4 0 21986 243
0.5-1.0 415 242 0 2905.1 1316 0 6530 73
1.0-2.0 308 258 1 2067 1957.8 3.5 2498 355
2.0-3.0 196 159 22 1567.6 842 280.4 388 88
3.0-4.0 112 109 0 1810.7 1321.7 0 113 27
4.0-5.0 461 373 0 6908.4 1637.8 0 28 6
5.0-7.5 46 46 0 557.4 371.6 0 31 5
7.5-10.0 0 0 0 0 0 0 0 0
10.0-20.0 0 0 0 0 0 0 0 0
>20.0 0 0 0 0 0 0 0 0
All 410 152 2 2376.5 786 16.4 46609 945
Estd. no of opr. holdings
(00)19118 7073 94 XXX XXX XXX XXX XXX
Sample no of opr.
holdings334 147 8 XXX XXX XXX XXX XXX
WEST BENGAL Social Group: Others Visit 1
Size class of hh
operational holding
(ha)
No. per 1000 of hhs reporting owning of Average number (0.0)owned per 1000 hhs No of opr. holdings
Table 37: Number of household reporting hen, cock, chicken, duck, other birds per 1000 households and average number owned per
1000 households by size class of household operational holding
A 114
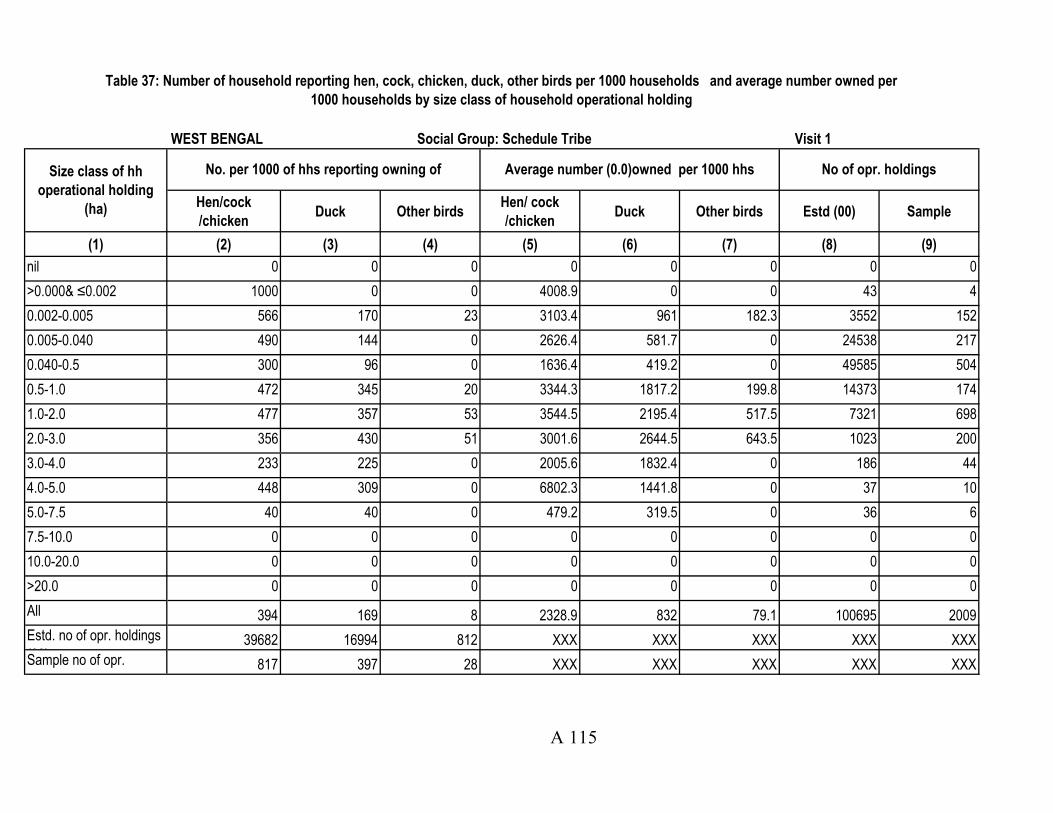
Hen/cock
/chickenDuck Other birds
Hen/ cock
/chickenDuck Other birds Estd (00) Sample
(1) (2) (3) (4) (5) (6) (7) (8) (9)
nil 0 0 0 0 0 0 0 0
>0.000& ≤0.002 1000 0 0 4008.9 0 0 43 4
0.002-0.005 566 170 23 3103.4 961 182.3 3552 152
0.005-0.040 490 144 0 2626.4 581.7 0 24538 217
0.040-0.5 300 96 0 1636.4 419.2 0 49585 504
0.5-1.0 472 345 20 3344.3 1817.2 199.8 14373 174
1.0-2.0 477 357 53 3544.5 2195.4 517.5 7321 698
2.0-3.0 356 430 51 3001.6 2644.5 643.5 1023 200
3.0-4.0 233 225 0 2005.6 1832.4 0 186 44
4.0-5.0 448 309 0 6802.3 1441.8 0 37 10
5.0-7.5 40 40 0 479.2 319.5 0 36 6
7.5-10.0 0 0 0 0 0 0 0 0
10.0-20.0 0 0 0 0 0 0 0 0
>20.0 0 0 0 0 0 0 0 0
All 394 169 8 2328.9 832 79.1 100695 2009
Estd. no of opr. holdings
(00)39682 16994 812 XXX XXX XXX XXX XXX
Sample no of opr.
holdings817 397 28 XXX XXX XXX XXX XXX
Size class of hh
operational holding
(ha)
No. per 1000 of hhs reporting owning of Average number (0.0)owned per 1000 hhs No of opr. holdings
Table 37: Number of household reporting hen, cock, chicken, duck, other birds per 1000 households and average number owned per
1000 households by size class of household operational holding
WEST BENGAL Social Group: Schedule Tribe Visit 1
A 115

Annexure B Concepts and Definitions For ensuring uniform concepts while collecting data on Land and Livestock holdings, certain concepts and definitions were formulated, which are explained below. Household Operational Holding: Household operational holding constituted of all land that was used wholly or partly for agricultural production and was operated (directed/managed) by one household member alone or with assistance of others, without regard to title, size or location. Within a household, multiple operational holdings were not distinguished. The land might be operated by members belonging to a single household or by members belonging to more than one household operating jointly. However, holdings operated as cooperative farms were not considered as operational holding in this survey. The holding might consist of one or more parcels of land, provided that they were located within the country. A household growing vegetable in the kitchen garden or flowers in the courtyard, or raising livestock & poultry or carrying out pisciculture was considered to operate a holding, even if no crop production was undertaken by it during the reference period. However, in all cases an operational holding would relate to some amount of land possessed by the household. Thus, if a household carried out any agricultural production during the reference period, plots possessed by the household during the major part of the reference period and put to uses other than agricultural production, such as house-sites, paths, buildings, etc., was also included in the operated area of the household operational holding. Only when a household does not undertake any agricultural production on any part of the land possessed by it during the reference period, it will not be considered to have any operational holding. Plot: A plot was a distinct patch of land demarcated generally by a strip of raised land, commonly known as ‘ails’ or ‘bunds’. House site (Homestead land): Homestead of a household was defined as the dwelling house of the household together with the courtyard, compound, garden, out-house, place of worship, family graveyard, guest house, shop, workshop and offices for running household enterprises, tanks, wells, latrines, drains and boundary walls annexed to the dwelling house. All land coming under homestead was defined as house site (homestead land). It might constitute only a part of a plot and as such, gardens, orchards or plantations, etc. adjacent to the homestead and lying within the boundary walls were not considered as homestead land. Ownership of land: A plot of land was considered to be owned by the household if permanent heritable possession, with or without the right to transfer the title, was vested in a member or members of the household. Land held in owner-like possession under long term lease or assignment was also considered as land owned. A plot of land might be leased out to others by the owner without losing the right of permanent heritable possession. Plots possessed by a tribal person in accordance with traditional tribal rights from local chieftains or village/district council, were considered owned by the tribal person. Land possessed: Land possessed was given by land owned (including land under ‘owner like possession’) + land leased in - land leased out + land held by the household but neither owned nor leased in (e.g., encroached land).
B 1

Lease of land: Land given to others on rent or free by owner of the land without surrendering the right of permanent heritable title was defined as land leased-out. It was defined as land leased-in if it was taken by a household on rent or free without any right of permanent or heritable possession. The lease contract might be written or oral. Orchards and plantations given to others for harvesting the produce, for which the owner receives a payment in cash or kind, were not treated as ‘lease’ for the purpose of this survey. Otherwise possessed land: This means all public/institutional land possessed by the household without title of ownership or occupancy right. The possession was without the consent of the owner. Private land (i.e. land owned by the household sector) possessed by the household without title of ownership and occupancy right was not included in this category. All private land encroached upon by the household was treated as leased-in land. Individual and joint operational holding: If the household operational holding was managed by one or more members of a single household it was taken as individual holding. It was treated as a joint operational holding only when it was managed by members of more than one household. Parcels: A parcel of a household operational holding was a piece of land surrounded entirely by land not forming part of the household operational holding. It might consist of more than one plot. Orchards: A piece of land put to production of horticulture crops, viz., fruits, nuts, dates, grapes, etc. (other than those treated as plantation crops), was regarded as an orchard, if it has at least 0.10 hectare in size or was having at least 12 trees planted on it. In case of trees where distance between the trees was quite large, the orchard was defined according to the minimum number of 12 trees planted in it. When distance was less than six meters as in the case of bananas, papayas, grapevines etc., the orchard was defined on the basis of the minimum area of 1/10th of a hectare. Plantations: Area devoted to production of plantation crops, viz., tea, coffee, cashew nut, areca nut, oil palm, clove and nutmeg, was treated as area under plantation. The size restriction given for orchards was also applicable for plantations for the purpose of the survey. Irrigation: Irrigation was considered as a device of purposively providing land with water, other than rain water, by artificial means for crop production. Permanent attached farm workers: A person who was employed by the management of an operational holding was considered to be a permanent attached farm worker of the operational holding for an agricultural season if (i) the person was employed more or less continuously during the season in the holding and (ii) the employment was under some sort of a contract that was binding on the person to serve the holding during the period of various agricultural operations (from preparation of soil to storing of grains) in respect of the crops of the seasons. A permanent attached farm worker did not refer to the same person working continuously, but to a position. Livestock: Livestock were those animals which were used for food, fibre, labour, etc. Animals kept as pets, snakes, reptiles, frogs, fishes were excluded from the coverage of livestock.
B 2
Annexure C
Note on Sample Design and Estimation Procedure 1. Introduction 1.1 The National Sample Survey (NSS), set up by the Government of India in 1950 to collect socio-economic data employing scientific sampling methods, started its seventieth round from 1st January 2013. The survey continued till 31st December 2013. 1.2 Subject Coverage: The 70th round (January 2013 - December 2013) of NSS was earmarked for surveys on land and livestock holdings, debt and investment and situation assessment survey of agricultural households. The last survey on these subjects was conducted in 59th round of NSS (January 2003 - December 2003). 2. Outline of Survey Programme 2.1 Geographical coverage: This survey covered the whole of the Indian Union. 2.2 Visits 1 & 2: Each sample FSU was visited twice during this round. Since the workload of the first visit (i.e. visit 1) was more, the first visit continued till the end of July 2013. Thus, period of the first visit was January – July 2013 and that of the second visit (i.e. visit 2) was August – December 2013. The listing schedule (sch 0.0) was canvassed only in the first visit. Schedules 18.1, was canvassed in independent sets of sample households. Each sample household was visited twice. Visit 1 and visit 2 schedules were canvassed in the same set of sample households during first and second visit respectively. Contents of the schedules for the two visits were not same since the information relate to two different seasons. 2.3 Sub-rounds: The survey period of the round were divided into two sub-rounds. Sub-round one consisted of the first half of the survey period of each visit i.e. 1st Jan -15th April 2013 for visit 1 and 1st August – 15th October 2013 for visit 2 while sub-round two consisted of the remaining period of the respective visits. Thus, each sub-round was of three and a half months duration for visit 1 and two and a half months for visit 2. In each of these two sub-rounds equal number of sample villages/ blocks (FSUs) were allotted for survey with a view to ensuring uniform spread of sample FSUs over the entire survey period. Attempt was made to survey each of the FSUs during the sub-round to which it was allotted. The villages/blocks visited in the first sub-round of first visit were revisited during the first sub-round of the second visit. Similarly, villages/blocks of sub-round 2 of visit 1 were revisited in sub-round 2 of visit 2. 2.4 Schedules of enquiry: During this round, the following schedules of enquiry were canvassed: Schedule 0.0 : list of households Schedule 18.1 : land and livestock holdings (rural only) 3. Sample Design 3.1 Outline of sample design: A stratified multi-stage design was adopted for the 70th round survey. The first stage units (FSU) were the census villages (Panchayat wards in case of Kerala) in the rural sector and Urban Frame Survey (UFS) blocks in the urban sector. The ultimate stage units (USU) were households in both the sectors. In case of large FSUs, one intermediate stage of
C 1

sampling was the selection of two hamlet-groups (hgs)/ sub-blocks (sbs) from each rural/ urban FSU. 3.2 Sampling Frame for First Stage Units: For the rural sector, the list of 2001 census villages updated by excluding the villages urbanised and including the towns de-urbanised after 2001 census (henceforth the term ‘village’ would mean Panchayat wards for Kerala) constituted the sampling frame. For the urban sector, the latest updated list of UFS blocks (2007-12) was considered as the sampling frame. 3.3 Stratification:
(a) Stratum had been formed at district level. Within each district of a State/ UT, generally speaking, two basic strata were formed: i) rural stratum comprising of all rural areas of the district and (ii) urban stratum comprising all the urban areas of the district. However, within the urban areas of a district, if there were one or more towns with population 10 lakhs or more as per population census 2011 in a district, each of them formed a separate basic stratum and the remaining urban areas of the district was considered as another basic stratum. (b) However, a special stratum in the rural sector only was formed at State level before district- strata were formed in case of each of the following 20 States/UTs: Andaman & Nicobar Islands, Andhra Pradesh, Assam, Bihar, Chhattisgarh, Delhi, Goa, Gujarat, Haryana, Jharkhand, Karnataka, Lakshadweep, Madhya Pradesh, Maharashtra, Odisha, Punjab, Rajasthan, Tamil Nadu, Uttar Pradesh and West Bengal. This stratum comprised all the villages of the State with population less than 50 as per census 2001. (c) In case of rural sectors of Nagaland one special stratum was formed within the State consisting of all the interior and inaccessible villages. 3.4 Sub-stratification: Rural sector: Different sub-stratifications were done for ‘hilly’ States and other States. Ten (10) States were considered as hilly States. They were: Jammu & Kashmir, Himachal Pradesh, Uttarakhand, Sikkim, Meghalaya, Tripura, Mizoram, Manipur, Nagaland and Arunachal Pradesh. (a) sub-stratification for hilly States: If ‘r’ be the sample size allocated for a rural stratum, the number of sub-strata formed was ‘r/2’. The villages within a district as per frame were first arranged in ascending order of population. Then sub-strata 1 to ‘r/2’ was demarcated in such a way that each substratum comprised a group of villages of the arranged frame and had more or less equal population. (b) sub-stratification for other States (non-hilly States except Kerala): The villages within a district as per frame were first arranged in ascending order of proportion of irrigated area in the cultivated area of the village. Then sub-strata 1 to ‘r/2’ was demarcated in such a way that each sub-stratum comprised a group of villages of the arranged frame and had more or less equal cultivated area. The information on irrigated area and cultivated area was obtained from the village directory of census 2001. (c) sub-stratification for Kerala: Although Kerala is a non-hilly State but because of non-availability of information on irrigation at FSU (Panchayat Ward) level, sub-stratification by proportion of irrigated area was not possible. Hence the procedure for sub-stratification was same as that of hilly States in case of Kerala. Urban sector: There was no sub-stratification for the strata of million plus cities. For other strata,
C 2

each district was divided into 2 sub-strata as follows: sub-stratum 1: all towns of the district with population less than 50000 as per census 2011 sub-stratum 2: remaining non-million plus towns of the district 3.5 Total sample size (FSUs): 8042 FSUs were allocated for the central sample at all-India level. 3.6 Allocation of total sample to States and UTs: The total number of sample FSUs were allocated to the States and UTs in proportion to population as per census 2011 subject to a minimum sample allocation to each State/ UT. While doing so, the resource availability in terms of number of field investigators as well as comparability with previous round of survey on the same subjects was also kept in view. 3.7 Allocation of State/ UT level sample to rural and urban sectors: State/ UT level sample size was allocated between two sectors in proportion to population as per census 2011 with double weightage to urban sector subject to the restriction that urban sample size for bigger states like Maharashtra, Tamil Nadu etc. did not exceed the rural sample size. A minimum of 16 FSUs (minimum 8 each for rural and urban sector separately) was allocated to each state/ UT. 3.8 Allocation to strata: Within each sector of a State/ UT, the respective sample size was allocated to the different strata in proportion to the population as per census 2011. Allocations at stratum level were adjusted to multiples of 2 with a minimum sample size of 2. For special stratum formed in the rural areas of 20 States/UTs, as discussed in para 3.3 (b), 2 FSUs were allocated to each. For special stratum 1 in the rural areas of Nagaland and Andaman & Nicobar Islands, 4 and 2 FSUs were allocated respectively. 3.9 Allocation to sub-strata: 3.9.1 Rural: Allocation was 2 for each sub-stratum. 3.9.2 Urban: Stratum allocations were distributed among the two sub-strata in proportion to the number of FSUs in the sub-strata. Minimum allocation for each sub-stratum was 2. 3.10 Selection of FSUs: For the rural sector, from each stratum x sub-stratum, required number of sample villages were selected by Simple Random Sampling Without Replacement (SRSWOR) procedure. For the urban sector, FSUs were selected by using Simple Random Sampling Without Replacement (SRSWOR) from each stratum x sub-stratum. Both rural and urban samples were drawn in the form of two independent sub-samples and equal number of samples were allocated among the two sub rounds. 3.11 Formation and selection of hamlet-groups/ sub-blocks: In case hamlet-groups/ sub-blocks were formed in the sample FSU, the same was done by more or less equalizing population. While doing so, it was ensured that the hamlet-groups/ sub-blocks formed were clearly identifiable in terms of physical landmarks. Two hamlet-groups (hg)/ sub-blocks (sb) were selected from a large FSU wherever hamlet-groups/ sub-blocks were formed in the following manner – one hg/ sb with maximum percentage share of population was always selected and termed as hg/ sb 1; one more hg/ sb was selected from the remaining hg’s/ sb’s by simple random sampling (SRS) and termed as hg/ sb 2. Listing and selection of the households was done independently in the two selected hamlet-groups/ sub-blocks.
C 3

3.12 Formation of second stage strata and allocation of households for Schedule 18.1: Land &
Livestock Holdings Survey (LHS) (rural only):
3.12.1 Four SSS were formed for schedule 18.1 based on four land possessed codes. SSS number was
same as the land possessed code.
Each household was given a land possessed code according to the following criteria:
land possessed code
criterion: area of the land possessed by the household
as on the date of survey
1 less than 0.005 hectare
2 equal to or more than 0.005 hectare but less than 1.000 hectare
3 equal to or more than 1.000 hectare but less than 2.000 hectares
4 equal to or more than 2.000 hectares
3.12.2 Allocation and selection of sample households: The total number of households surveyed in an
FSU as below.Two households were selected from each SSS for schedule 18.1. In case of hamlet
group formation, one household was selected from each hg × SSS for schedule 18.1. The number
of SSS, allocations and sampling scheme is shown below:
Schedule type
Number of SSS
Number of sample households surveyed (rural)
Sampling scheme Within each SSS
18.1 4 8 SRSWOR
(2 households from each SSS)
3.12.3 Selection of households: From each SSS the sample households for each of the schedules were selected by SRSWOR. 4. Estimation Procedure 4.1 Notations: s = subscript for s-th stratum t = subscript for t-th sub-stratum m = subscript for sub-sample (m =1, 2) i = subscript for i-th FSU [village (panchayat ward)] d = subscript for a hamlet-group (d = 1, 2) j = subscript for j-th second stage stratum in an FSU/ hg k = subscript for k-th sample household under a particular second stage stratum within an FSU/ hg D = total number of hg’s formed in the sample FSU D* = (D – 1) for FSUs with D > 1 N = total number of FSUs in any rural sub-stratum n = number of sample FSUs surveyed including ‘uninhabited’ and ‘zero cases’ but excluding casualty for a particular sub-sample and sub-stratum. H = total number of households listed in a second-stage stratum of an FSU / hamlet-group of sample FSU
C 4

h = number of households surveyed in a second-stage stratum of an FSU / hamlet-group of sample FSU x, y = observed value of characteristics x, y under estimation Xˆ , Yˆ = estimate of population total X, Y for the characteristics x, y Under the above symbols, ystmidjk = observed value of the characteristic y for the k-th household in the j-th second stage stratum of the d-th hg (d = 1, 2) of the i-th FSU belonging to the m-th sub-sample for the t-th sub-stratum of s-th stratum. However, for ease of understanding, a few symbols are suppressed in following paragraphs where they are obvious. 4.2 Formulae for Estimation of Aggregates for a particular sub-sample and stratum × substratum: 4.2.1 Schedules 18.1: 4.2.1.1 Rural: (i) For j-th second stage stratum:
j
i
h
k
jki
ji
ji
i
h
k
jki
ji
ji
j
j
ny
h
HDy
h
H
n
NY
jiji
1 1
2
2
2*
1
1
1
121
ˆ
(ii) For all second-stage strata combined:
j
jYY ˆˆ
Note: i) Schedules 18.1 were canvassed in rural sector only, ii) Values of j for Sch 18.1 are as follows: j = 1, 2, 3 or 4; 4.2.1.2 Estimates in respect of joint operational holdings: In the case of joint operational holdings operated by the sample household jointly with other household(s), the value of a characteristic of the operational holding is first multiplied by the percentage share of land of the sample household(s) and then the higher estimates are built up. 4.3 Overall Estimate for Aggregates for a sub-stratum:
Overall estimate for aggregates for a sub-stratum ( Y st ) based on two sub-samples is obtained as:
2ˆ
2
1ˆ1m
stmst YY
4.4 Overall Estimate for Aggregates for a stratum: Overall estimate for a stratum (Yˆs ) is obtained as
t
sts YY ˆˆ
4.5 Overall Estimate of Aggregates at State/UT/all-India level:
C 5
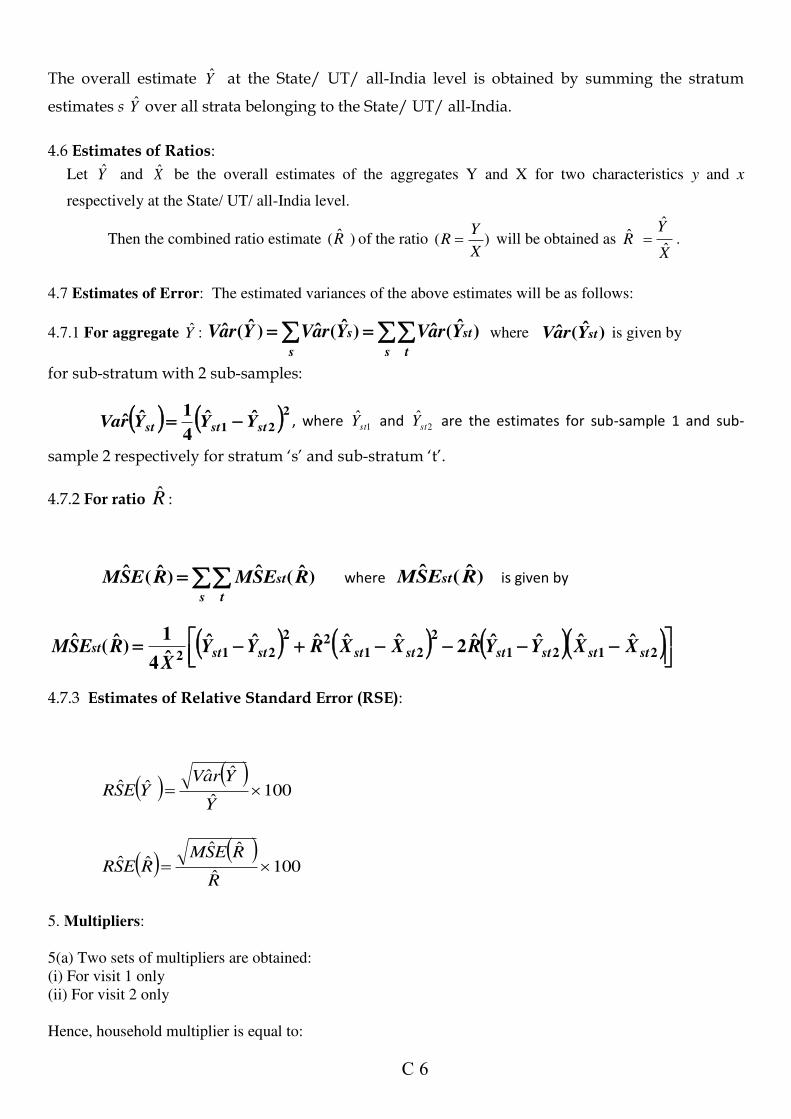
The overall estimate Y at the State/ UT/ all-India level is obtained by summing the stratum
estimates s Y over all strata belonging to the State/ UT/ all-India.
4.6 Estimates of Ratios:
Let Y and X be the overall estimates of the aggregates Y and X for two characteristics y and x
respectively at the State/ UT/ all-India level.
Then the combined ratio estimate )ˆ(R of the ratio )(X
YR will be obtained as
X
YR ˆ
ˆˆ .
4.7 Estimates of Error: The estimated variances of the above estimates will be as follows:
4.7.1 For aggregate Y : s t
st
s
s YraVYraVYraV )ˆ(ˆ)ˆ(ˆ)ˆ(ˆ where )ˆ(ˆ stYraV is given by
for sub-stratum with 2 sub-samples:
221ˆˆ
4
1ˆˆ ststst YYYrVa , where 1stY and 2stY are the estimates for sub-sample 1 and sub-
sample 2 respectively for stratum ‘s’ and sub-stratum ‘t’.
4.7.2 For ratio R :
s t
st RESMRESM )ˆ(ˆ)ˆ(ˆ
where )ˆ(ˆ RESM st is given by
2121
2
2122
212ˆˆˆˆˆ2ˆˆˆˆˆ
ˆ4
1)ˆ(ˆ
ststststststststst XXYYRXXRYYX
RESM
4.7.3 Estimates of Relative Standard Error (RSE):
100ˆ
ˆˆˆˆ Y
YraVYESR
100ˆ
ˆˆˆˆ
R
RESMRESR
5. Multipliers:
5(a) Two sets of multipliers are obtained:
(i) For visit 1 only
(ii) For visit 2 only
Hence, household multiplier is equal to:
C 6
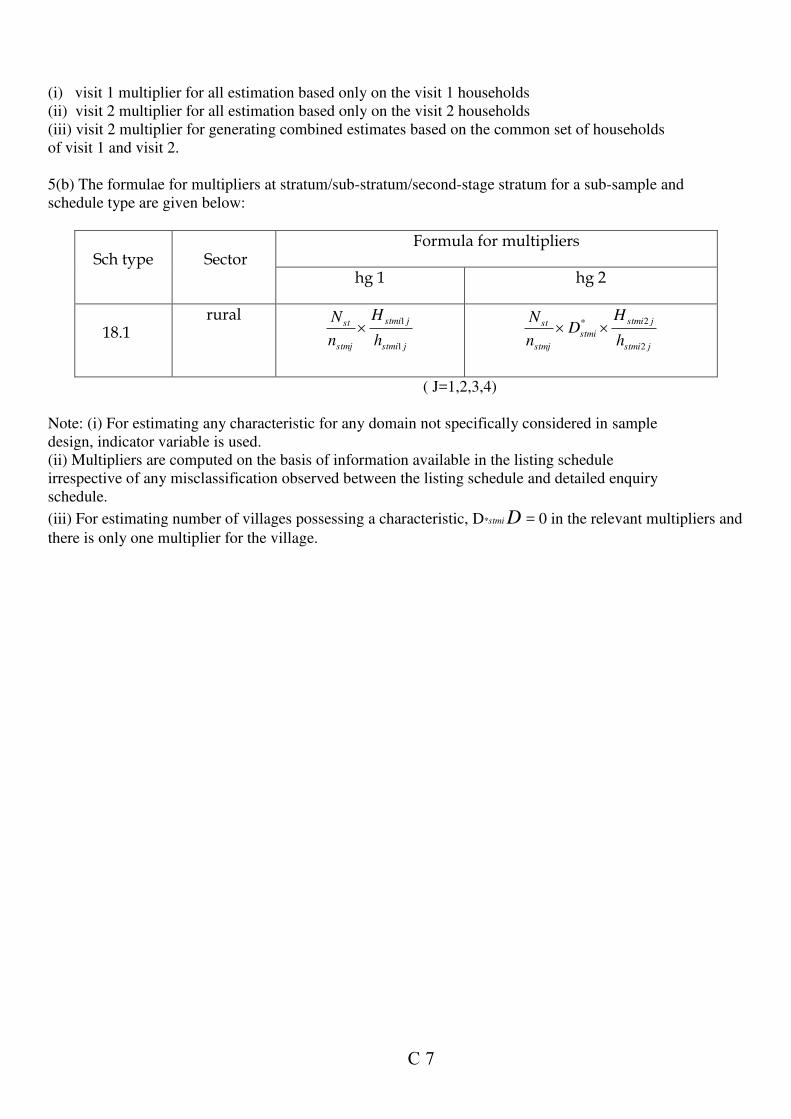
(i) visit 1 multiplier for all estimation based only on the visit 1 households
(ii) visit 2 multiplier for all estimation based only on the visit 2 households
(iii) visit 2 multiplier for generating combined estimates based on the common set of households
of visit 1 and visit 2.
5(b) The formulae for multipliers at stratum/sub-stratum/second-stage stratum for a sub-sample and
schedule type are given below:
Sch type Sector Formula for multipliers
hg 1 hg 2
18.1 rural
jstmi
jstmi
stmj
st
h
H
n
N
1
1 jstmi
jstmi
stmi
stmj
st
h
HD
n
N
2
2*
( J=1,2,3,4)
Note: (i) For estimating any characteristic for any domain not specifically considered in sample
design, indicator variable is used.
(ii) Multipliers are computed on the basis of information available in the listing schedule
irrespective of any misclassification observed between the listing schedule and detailed enquiry
schedule.
(iii) For estimating number of villages possessing a characteristic, D*stmi D = 0 in the relevant multipliers and
there is only one multiplier for the village.
C 7

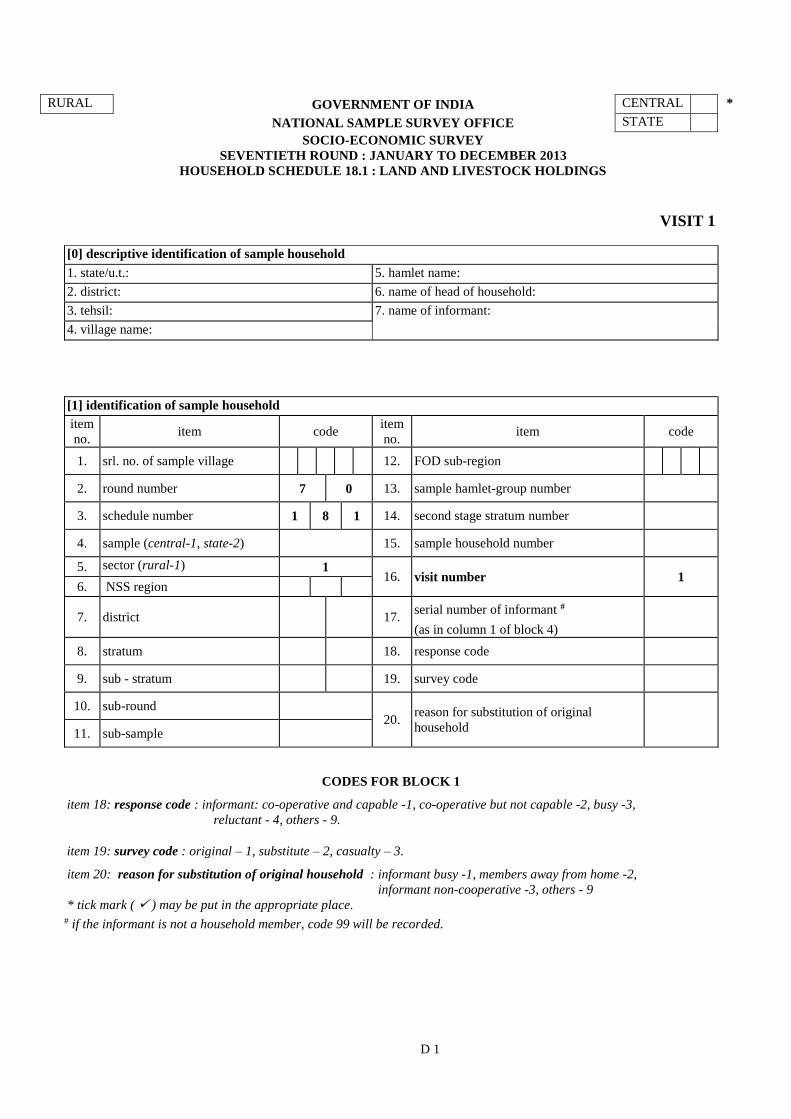
RURAL GOVERNMENT OF INDIA CENTRAL *
NATIONAL SAMPLE SURVEY OFFICE STATE
SOCIO-ECONOMIC SURVEY
SEVENTIETH ROUND : JANUARY TO DECEMBER 2013
HOUSEHOLD SCHEDULE 18.1 : LAND AND LIVESTOCK HOLDINGS
VISIT 1
[0] descriptive identification of sample household
1. state/u.t.: 5. hamlet name:
2. district: 6. name of head of household:
3. tehsil: 7. name of informant:
4. village name:
[1] identification of sample household
item
no. item code
item
no. item code
1. srl. no. of sample village 12. FOD sub-region
2. round number 7 0 13. sample hamlet-group number
3. schedule number 1 8 1 14. second stage stratum number
4. sample (central-1, state-2) 15. sample household number
5. sector (rural-1) 1 16. visit number 1
6. NSS region
7. district
17. serial number of informant #
(as in column 1 of block 4)
8. stratum 18. response code
9. sub - stratum 19. survey code
10. sub-round
20. reason for substitution of original
household
11. sub-sample
CODES FOR BLOCK 1
item 18: response code : informant: co-operative and capable -1, co-operative but not capable -2, busy -3,
reluctant - 4, others - 9.
item 19: survey code : original – 1, substitute – 2, casualty – 3.
item 20: reason for substitution of original household : informant busy -1, members away from home -2,
informant non-cooperative -3, others - 9
* tick mark ( ) may be put in the appropriate place. # if the informant is not a household member, code 99 will be recorded.
D 1
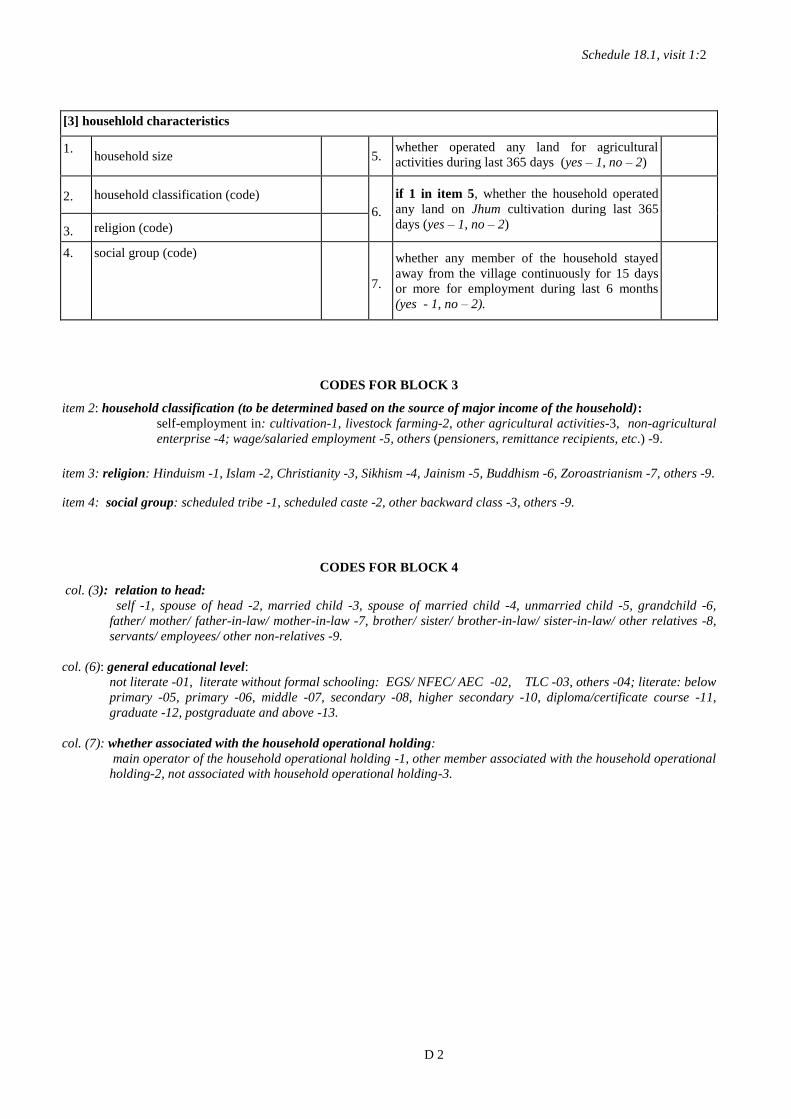
Schedule 18.1, visit 1:2
[3] househlold characteristics
1. household size
5.
whether operated any land for agricultural
activities during last 365 days (yes – 1, no – 2)
2. household classification (code)
6.
if 1 in item 5, whether the household operated
any land on Jhum cultivation during last 365
days (yes – 1, no – 2)
3. religion (code)
4. social group (code)
7.
whether any member of the household stayed
away from the village continuously for 15 days
or more for employment during last 6 months (yes - 1, no – 2).
CODES FOR BLOCK 3
item 2: household classification (to be determined based on the source of major income of the household):
self-employment in: cultivation-1, livestock farming-2, other agricultural activities-3, non-agricultural
enterprise -4; wage/salaried employment -5, others (pensioners, remittance recipients, etc.) -9.
item 3: religion: Hinduism -1, Islam -2, Christianity -3, Sikhism -4, Jainism -5, Buddhism -6, Zoroastrianism -7, others -9.
item 4: social group: scheduled tribe -1, scheduled caste -2, other backward class -3, others -9.
CODES FOR BLOCK 4
col. (3): relation to head:
self -1, spouse of head -2, married child -3, spouse of married child -4, unmarried child -5, grandchild -6,
father/ mother/ father-in-law/ mother-in-law -7, brother/ sister/ brother-in-law/ sister-in-law/ other relatives -8,
servants/ employees/ other non-relatives -9.
col. (6): general educational level:
not literate -01, literate without formal schooling: EGS/ NFEC/ AEC -02, TLC -03, others -04; literate: below
primary -05, primary -06, middle -07, secondary -08, higher secondary -10, diploma/certificate course -11,
graduate -12, postgraduate and above -13.
col. (7): whether associated with the household operational holding:
main operator of the household operational holding -1, other member associated with the household operational
holding-2, not associated with household operational holding-3.
D 2

Schedule 18.1, visit 1:3
[4] demographic and other particulars of household members
srl. no. name of the member relation
to head
(code)
sex
(male-1,
female-2)
age
(years)
general
educational
level
(code)
if 1 in item 5 of block 3,
whether associated
with the household
operational holding* (code)
(1) (2) (3) (4) (5) (6) (7)
* for persons of age below 5 years, enter code 3.
D 3

Schedule 18.1, visit 1:4
CODES FOR BLOCK 5
col.(3): location :
within village...........................................................................1
outside village but within the district .....................................2
outside the district but within the state...................................3
outside the state but within the country...................................4
col.(11): use of the leased-out land by the lessee household:
used for cultivation.............................................. 1
other uses............................................................. 9
not known................................................................ 2
col.(12): whether flooded during July 2012 to December 2012?:
col.(4): kind of possession for the major part of the period July 2012 to
December 2012:
flooded and agricultural activities could not be carried out....... 1
flooded but agricultural activities were carried out…………… 2
owned and possessed ………………………....................................... 1 flooded but the plot was not for agricultural activities……… 3
leased-in ………………………………………..................................... 2 not flooded ………………………............................................. 4
otherwise possessed ……………………………................................. 3
leased-out ………………………........................................................ 4 col.(13): land use:
col.(7): type of possession: only crop production:
leased in: on jhum land............................... 1
recorded lease................................................................................... 1 on land other than jhum land................... 2
not recorded lease............................................................................. 2 only farming of animal/fishery........................... 3
other.............................................................................................................. 9 both crop production and farming of animal /fishery...... 4
other agricultural uses................................................ 5
col. (8): duration of possession: other uses (non-agricultural uses)................................................ 9
less than one agricultural season …………………………….................. 1 col.(14): type of crop production/ livestock farming:
at least one agricultural season but less than one agricultural year ... 2 cereals……......................... 01 orchards ……… 07
at least one agricultural year but less than two agricultural years …. 3 pulses ………….................... 02 plantation…… 08
two agricultural years or more........................................................... 4 oilseeds ……………... 03 dairy………......... 10
vegetables.............................. 04 poultry/duckery.... 11
col.(10): terms of lease: fodder................................... 05 piggery ……… 12
for fixed money ………………………………………....................... 1 other crop................... 06 fishery ……… 13
for fixed produce ………………………………….....................….. 2 farming of other animals.. 19
for share of produce ………………………………......................… 3 col.(17):source of irrigation:
for service contract ………………………..……......................….. 4 canal…………………………………..............…….. 1
for share of produce together with other terms …...................... 5 minor surface works (pond, tank, etc)..................... 2
under usufructuary mortgage …………..……......................……. 6 ground water (tube well, well etc.)............................... 3
from relatives under no specified terms ……........................……... 7 combination of codes 1, 2, 3................................ 4
under other terms ……………………………......................……… 9 others................................................................ 9
D 4

Schedule 18.1, visit 1:5
[5] particulars of land of the household* and its operation during July 2012 to December 2012
srl.
no
. of
plo
t
surv
ey n
o.
or
oth
er i
den
tifi
cati
on
par
ticu
lars
(li
ke n
am
e o
f th
e p
lot)
loca
tio
n
(cod
e)
kin
d o
f p
oss
essi
on
fo
r th
e m
ajo
r p
art
of
the
per
iod
Ju
ly 2
01
2 t
o D
ecem
ber
20
12
(c
od
e)
area
of
land
(0
.000
ha
)
if 2
or
3 i
n c
ol.
(4
),
typ
e o
f p
oss
essi
on
(co
de)
if 1
, 2
or
3 i
n c
ol.
(4
),
du
rati
on
of
po
sses
sio
n (
cod
e)
if 2 or 4 in
col. (4)
if 4
in
co
l. 4
, u
se o
f l
ease
d-o
ut
lan
d
by
th
e le
ssee
ho
use
ho
ld d
uri
ng
Ju
ly
20
12
to
Dec
emb
er 2
01
2 (
cod
e)
if 1
to
3 i
n c
olu
mn
4,
wh
eth
er f
loo
ded
du
rin
g J
uly
201
2 t
o D
ecem
ber
20
12
?
(co
de)
if 1
to
3 i
n c
olu
mn
4,
lan
d u
se d
uri
ng
July
20
12
to
Dec
emb
er 2
01
2 (
cod
e)
if
1,
2 ,
3 o
r 4
in
co
l.(1
3),
ty
pe
of
cro
p p
rodu
ctio
n/
liv
esto
ck f
arm
ing
(co
de)
if
01
to
08
in
co
l.(1
4),
wh
ether
mo
re
than
on
e cr
op w
as g
row
n i
n t
he
plo
t
du
rin
g J
uly
201
2 t
o D
ecem
ber
20
12
(yes
-1,
no-2
)
if
01
to
08
in
co
l.(1
4),
wh
ether
irri
gat
ed
du
rin
g J
uly
20
12
to
Dec
emb
er 2
01
2?
(ye
s-1
, n
o-2
)
if ‘
1’
in c
ol.
(1
6),
so
urc
e o
f ir
rig
atio
n
(co
de)
no
. of
less
or/
less
ee h
ou
seh
old
s
term
s o
f l
ease
(co
de)
(1) (2) (3) (4) (5)# (6) (7) (8) (9) (10) (11) (12) (13) (14) (15) (16) (17)
*:List only those plots which were ‘owned and possessed’ or ‘leased in’ or ‘otherwise possessed’ or ‘leased out’ during the major part of July 2012 to December 2012.
#: This shaded dummy column (column 5) is not meant for recording any information. This column has been added in visit 1 to ensure that column numbers of different
items of information are same between visit 1 and visit 2 Schedules.
D 5
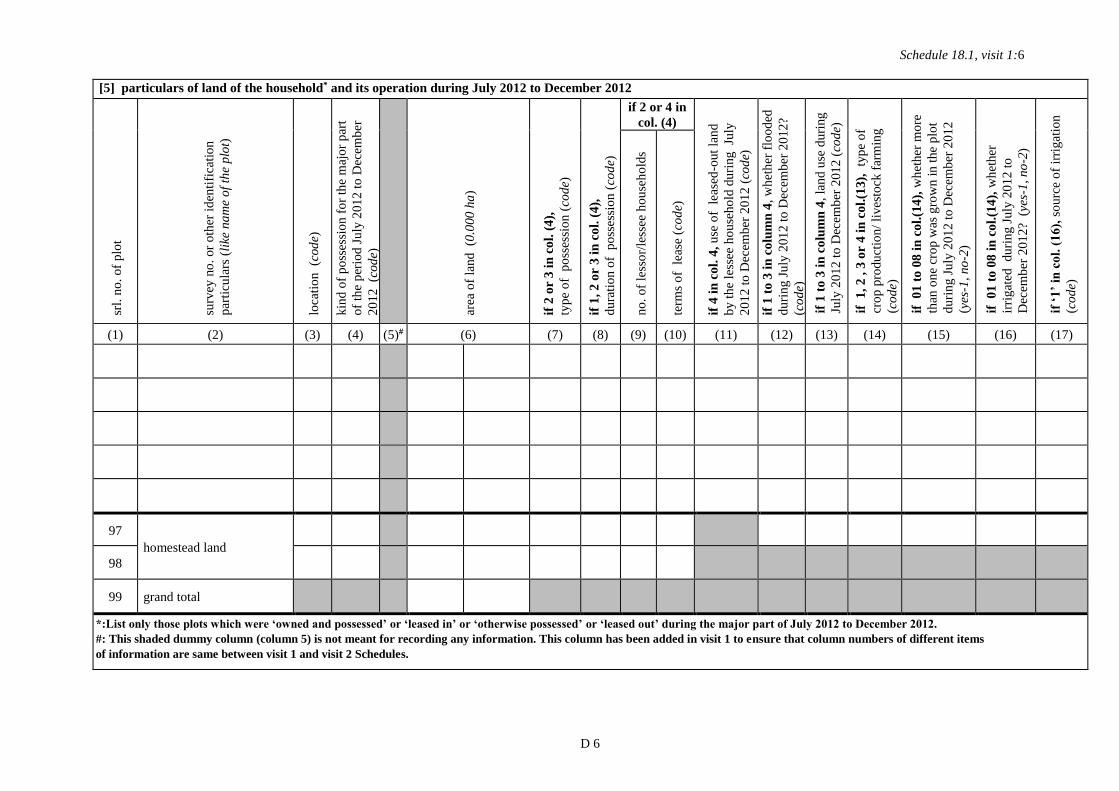
Schedule 18.1, visit 1:6
[5] particulars of land of the household* and its operation during July 2012 to December 2012
srl.
no
. of
plo
t
surv
ey n
o.
or
oth
er i
den
tifi
cati
on
par
ticu
lars
(li
ke n
am
e o
f th
e p
lot)
loca
tio
n
(cod
e)
kin
d o
f p
oss
essi
on
fo
r th
e m
ajo
r p
art
of
the
per
iod
Ju
ly 2
01
2 t
o D
ecem
ber
20
12
(c
od
e)
area
of
land
(0
.000
ha
)
if 2
or
3 i
n c
ol.
(4
),
typ
e o
f p
oss
essi
on
(co
de)
if 1
, 2
or
3 i
n c
ol.
(4
),
du
rati
on
of
po
sses
sio
n (
cod
e)
if 2 or 4 in
col. (4)
if 4
in
co
l. 4
, u
se o
f l
ease
d-o
ut
lan
d
by
th
e le
ssee
ho
use
ho
ld d
uri
ng
Ju
ly
20
12
to
Dec
emb
er 2
01
2 (
cod
e)
if 1
to
3 i
n c
olu
mn
4,
wh
eth
er f
loo
ded
du
rin
g J
uly
201
2 t
o D
ecem
ber
20
12
?
(co
de)
if 1
to
3 i
n c
olu
mn
4,
lan
d u
se d
uri
ng
July
20
12
to
Dec
emb
er 2
01
2 (
cod
e)
if
1,
2 ,
3 o
r 4
in
co
l.(1
3),
ty
pe
of
cro
p p
rodu
ctio
n/
liv
esto
ck f
arm
ing
(co
de)
if
01
to
08
in
co
l.(1
4),
wh
ether
mo
re
than
on
e cr
op w
as g
row
n i
n t
he
plo
t
du
rin
g J
uly
201
2 t
o D
ecem
ber
20
12
(yes
-1,
no-2
)
if
01
to
08
in
co
l.(1
4),
wh
ether
irri
gat
ed
du
rin
g J
uly
20
12
to
Dec
emb
er 2
01
2?
(ye
s-1
, n
o-2
)
if ‘
1’
in c
ol.
(1
6),
so
urc
e o
f ir
rig
atio
n
(co
de)
no
. of
less
or/
less
ee h
ou
seh
old
s
term
s o
f l
ease
(co
de)
(1) (2) (3) (4) (5)# (6) (7) (8) (9) (10) (11) (12) (13) (14) (15) (16) (17)
97
homestead land
98
99 grand total
*:List only those plots which were ‘owned and possessed’ or ‘leased in’ or ‘otherwise possessed’ or ‘leased out’ during the major part of July 2012 to December 2012.
#: This shaded dummy column (column 5) is not meant for recording any information. This column has been added in visit 1 to ensure that column numbers of different items
of information are same between visit 1 and visit 2 Schedules.
D 6
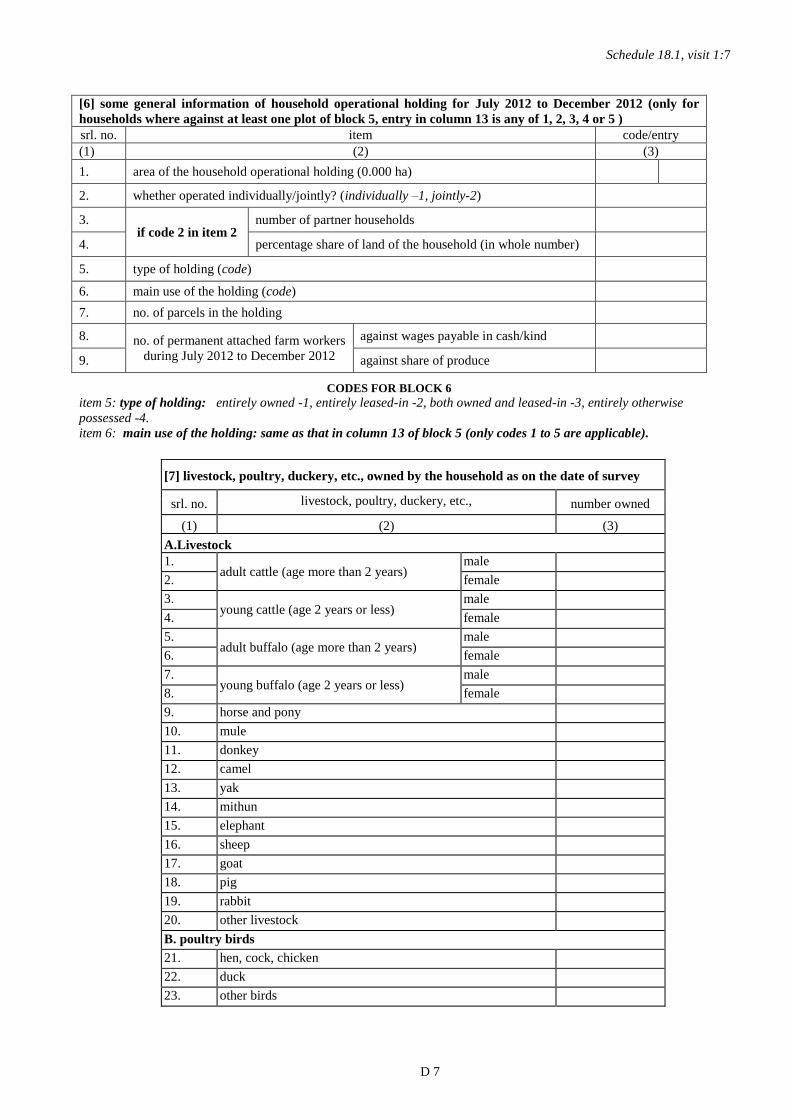
Schedule 18.1, visit 1:7
[6] some general information of household operational holding for July 2012 to December 2012 (only for
households where against at least one plot of block 5, entry in column 13 is any of 1, 2, 3, 4 or 5 )
srl. no. item code/entry
(1) (2) (3)
1. area of the household operational holding (0.000 ha)
2. whether operated individually/jointly? (individually –1, jointly-2)
3. if code 2 in item 2
number of partner households
4. percentage share of land of the household (in whole number)
5. type of holding (code)
6. main use of the holding (code)
7. no. of parcels in the holding
8. no. of permanent attached farm workers
during July 2012 to December 2012
against wages payable in cash/kind
9. against share of produce
CODES FOR BLOCK 6
item 5: type of holding: entirely owned -1, entirely leased-in -2, both owned and leased-in -3, entirely otherwise
possessed -4.
item 6: main use of the holding: same as that in column 13 of block 5 (only codes 1 to 5 are applicable).
[7] livestock, poultry, duckery, etc., owned by the household as on the date of survey
srl. no. livestock, poultry, duckery, etc.,
number owned
(1) (2) (3)
A.Livestock
1. adult cattle (age more than 2 years)
male
2. female
3. young cattle (age 2 years or less)
male
4. female
5. adult buffalo (age more than 2 years)
male
6. female
7. young buffalo (age 2 years or less)
male
8. female
9. horse and pony
10. mule
11. donkey
12. camel
13. yak
14. mithun
15. elephant
16. sheep
17. goat
18. pig
19. rabbit
20. other livestock
B. poultry birds
21. hen, cock, chicken
22. duck
23. other birds
D 7
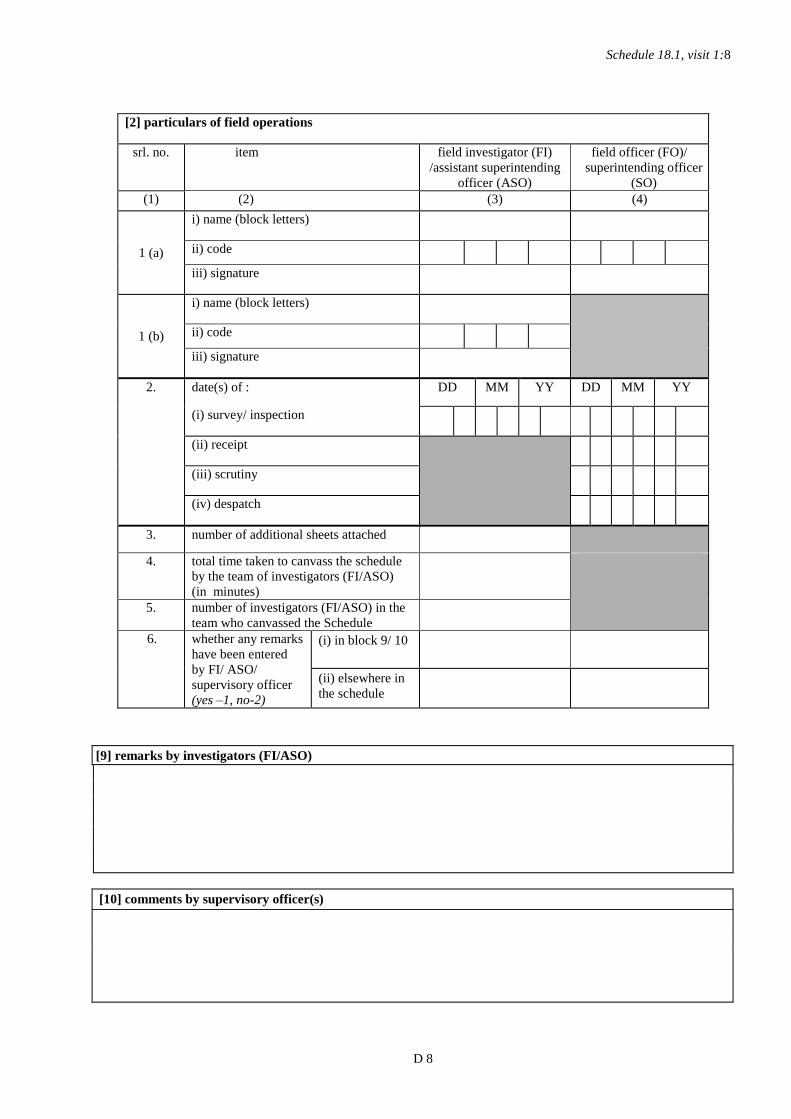
Schedule 18.1, visit 1:8
[2] particulars of field operations
srl. no. item field investigator (FI)
/assistant superintending
officer (ASO)
field officer (FO)/
superintending officer
(SO)
(1) (2) (3) (4)
1 (a)
i) name (block letters)
ii) code
iii) signature
1 (b)
i) name (block letters)
ii) code
iii) signature
2. date(s) of : DD MM YY DD MM YY
(i) survey/ inspection
(ii) receipt
(iii) scrutiny
(iv) despatch
3. number of additional sheets attached
4. total time taken to canvass the schedule
by the team of investigators (FI/ASO)
(in minutes)
5. number of investigators (FI/ASO) in the
team who canvassed the Schedule
6. whether any remarks
have been entered
by FI/ ASO/
supervisory officer
(yes –1, no-2)
(i) in block 9/ 10
(ii) elsewhere in
the schedule
[9] remarks by investigators (FI/ASO)
[10] comments by supervisory officer(s)
D 8

RURAL GOVERNMENT OF INDIA CENTRAL *
NATIONAL SAMPLE SURVEY OFFICE STATE
SOCIO-ECONOMIC SURVEY
SEVENTIETH ROUND : JANUARY TO DECEMBER 2013
HOUSEHOLD SCHEDULE 18.1 : LAND AND LIVESTOCK HOLDINGS
VISIT 2
[0] descriptive identification of sample household
1. state/u.t.: 5. hamlet name:
2. district: 6. name of head of household:
3. tehsil: 7. name of informant:
4. village name:
[1] identification of sample household
item
no. item code
item
no. item code
1. srl. no. of sample village 12. FOD sub-region
2. round number 7 0 13. sample hamlet-group number
3. schedule number 1 8 1 14. second stage stratum number
4. sample (central-1, state-2) 15. sample household number
5. sector (rural-1) 1 16. visit number 2
6. NSS region
7. district
17.
serial number of informant #
(as in column 1 of block 4 of visit 1
schedule )
8. stratum 18. response code
9. sub - stratum 19. survey code
10. sub-round
20. reason for casualty of the household
11. sub-sample
CODES FOR BLOCK 1
item 18: response code : informant: co-operative and capable -1, co-operative but not capable -2, busy -3,
reluctant - 4, others - 9.
item 19: survey code : surveyed – 1, casualty – 3.
item 20: reason for casualty of the household: informant busy -1, members away from home -2, informant
non-cooperative -3, others - 9
* tick mark ( ) may be put in the appropriate place. # if the informant is not a household member, code 99 will be recorded.
D 9

Schedule 18.1, visit 2:2
CODES FOR BLOCK 5
col.(3): location : col.(11): use of the leased-out land by the lessee household:
within village.................................................................... 1 used for cultivation................................................................... 1
outside village but within the district ............................... 2 other uses................................................................................... 9
outside the district but within the state............................ 3 not known................................................................................. 2
outside the state but within the country............................. 4 col.(12): whether flooded during January 2013 to June 2013?:
flooded and agricultural activities could not be carried out.... 1
col.(4): kind of possession for the major part of the period January 2013 to June
2013:
flooded but agricultural activities were carried out………… 2
flooded but the plot was not for agricultural activities…… 3
owned and possessed ……………………….............................. 1 not flooded ………….......................................................... 4
leased-in ………………………………………….......................... 2
otherwise possessed …………………………….......................... 3 col.(13): land use:
leased-out ………………………................................................ 4 only crop production:
plots listed in visit 1but not covered in codes 1 to 4 above……. 5 on jhum land..................................... 1
on land other than jhum land............. 2
col.(7): type of possession: only farming of animal/fishery............................................... 3
leased in: both crop production and farming of animal /fishery............. 4
recorded lease................................................................................. 1 other agricultural uses............................................................ 5
not recorded lease.......................................................................... 2 other uses (non-agricultural uses).......................................... 9
other............................................................................................................. 9
col.(14): type of crop production/ livestock farming:
col. (8): duration of possession: cereals………........... 01 orchards……. ……… 07
pulses ……………….... 02 plantation………...... 08
less than one agricultural season ………………............................... 1 oilseeds ……………….. 03 dairy………… 10
at least one agricultural season but less than one agricultural year ... 2 vegetables........................ 04 poultry/duckery ……… 11
at least one agricultural year but less than two agricultural years …. 3 fodder........................... 05 piggery ……............... 12
two agricultural years or more............................................... 4 other crop....... 06 fishery ……........ 13
col.(10): terms of lease: farming of other animals …... 19
for fixed money ………………………………………. 1 col.(17):source of irrigation:
for fixed produce …………………………………….. 2 canal…………………………………..............…….. 1
for share of produce ………………………………… 3 minor surface works (pond, tank, etc)..................... 2
for service contract ………………………..……….. 4 ground water (tube well, well etc.)............................... 3
for share of produce together with other terms …. 5 combination of codes 1, 2, 3................................ 4
under usufructuary mortgage …………..…………. 6 others................................................................ 9
from relatives under no specified terms …………... 7 col.(19): type of crop production/ livestock farming for the agriculture
year July 2012-June 2013: code structure same as column 14, with
additional code, not used for crop production/livestock farming/fishery
-20
under other terms …………………………………… 9
D 10
Schedule 18.1, visit 2:3
[5] particulars of land of the household and its operation during January 2013 to June 2013 sr
l. n
o.
of
plo
t (P
art
A:
srl.
no
. a
s in
blo
ck 5
of
visi
t 1
exc
lud
ing
97
an
d 9
8;
Pa
rt B
:
con
tin
uou
s se
ria
l n
um
ber
aft
er t
he
last
srl
.
no
. i
n P
art
A)
surv
ey n
o.
or
oth
er i
den
tifi
cati
on
par
ticu
lars
(lik
e n
am
e o
f th
e p
lot)
loca
tio
n
(cod
e)
kin
d o
f p
oss
essi
on
fo
r th
e m
ajo
r p
art
of
the
per
iod
Jan
uar
y 2
013
to
Ju
ne
20
13
(co
de)
is t
her
e an
y c
han
ge
in t
he
area
of
the
plo
t
reco
rded
in
vis
it 1
? (y
es-1
, no
-2)
area
of
land
(0
.000
ha
)
if 2
or
3 i
n c
ol.
(4
),
typ
e o
f p
oss
essi
on
(co
de)
if 1
, 2
o
r 3 i
n c
ol.
(4),
du
rati
on
of
po
sses
sio
n (
cod
e)
if 2 or 4 in
col. (4)
if 4
in
co
l. 4
, u
se o
f le
ased
-ou
t la
nd
by
th
e
less
ee h
ou
seh
old
duri
ng
Jan
uar
y 2
01
3 t
o
Jun
e 2
013
(co
de)
if 1
to
3 i
n c
olu
mn
4,
wh
eth
er f
loo
ded
du
rin
g J
anu
ary 2
01
3 t
o J
un
e 20
13
? (c
od
e)
if 1
to
3 i
n c
olu
mn
4,
lan
d u
se d
uri
ng
Jan
uar
y 2
01
3 t
o J
un
e 2
013
(co
de)
if
1,
2 ,
3 o
r 4
in
co
l.(1
3),
ty
pe
of
cro
p
pro
du
ctio
n/
liv
esto
ck f
arm
ing
(c
od
e)
if
01
to
08
in
co
l.(1
4),
wh
ether
mo
re t
han
on
e cr
op
was
gro
wn
in
th
e p
lot
du
rin
g
Jan
uar
y 2
01
3 t
o J
un
e 2
013
(y
es-1
, n
o-2
)
if
01
to
08
in
co
l.(1
4),
wh
ether
irr
igat
ed
du
rin
g J
anu
ary 2
01
3 t
o J
un
e 20
13
?
(yes
-1,
no-2
)
if ‘
1’
in c
ol.
(1
6),
so
urc
e o
f ir
rig
atio
n
(co
de)
wh
eth
er p
oss
esse
d f
or
maj
or
par
t o
f th
e
agri
cult
ure
yea
r Ju
ly 2
012
to
Ju
ne
201
3?
(yes
-1,
no-2
)
if 1
in
co
l. 1
8,
typ
e o
f cr
op
pro
du
ctio
n/
liv
esto
ck f
arm
ing
for
the
agri
cult
ure
yea
r
July
20
12
to
Ju
ne
20
13
(co
de)
wh
eth
er o
wn
ed f
or
maj
or
par
t o
f th
e of
the
agri
cult
ure
yea
r Ju
ly 2
012
to
Ju
ne
201
3?
(yes
-1,
no-2
)
no
. of
less
or/
less
ee
ho
use
ho
lds
term
s o
f l
ease
(co
de)
(1) (2) (3) (4) (5) (6) (7) (8) (9) (10) (11) (12) (13) (14) (15) (16) (17) (18) (19) (20)
A. plots listed in block 5 of visit 1 (excluding homestead land)
D 11

Schedule 18.1, visit 2:4
[5] particulars of land of the household and its operation during January 2013 to June 2013 sr
l. n
o.
of
plo
t (P
art
A:
srl.
no
. a
s in
blo
ck 5
of
visi
t 1
exc
lud
ing
97
an
d 9
8;
Pa
rt B
:
con
tin
uou
s se
ria
l n
um
ber
aft
er t
he
last
srl
.
no
. i
n P
art
A)
surv
ey n
o.
or
oth
er i
den
tifi
cati
on
par
ticu
lars
(lik
e n
am
e o
f th
e p
lot)
loca
tio
n
(cod
e)
kin
d o
f p
oss
essi
on
fo
r th
e m
ajo
r p
art
of
the
per
iod
Jan
uar
y 2
013
to
Ju
ne
20
13
(co
de)
is t
her
e an
y c
han
ge
in t
he
area
of
the
plo
t
reco
rded
in
vis
it 1
? (y
es-1
, no
-2)
area
of
land
(0
.000
ha
)
if 2
or
3 i
n c
ol.
(4
),
typ
e o
f p
oss
essi
on
(co
de)
if 1
, 2
o
r 3 i
n c
ol.
(4),
du
rati
on
of
po
sses
sio
n (
cod
e)
if 2 or 4 in
col. (4)
if 4
in
co
l. 4
, u
se o
f le
ased
-ou
t la
nd
by
th
e
less
ee h
ou
seh
old
duri
ng
Jan
uar
y 2
01
3 t
o
Jun
e 2
013
(co
de)
if 1
to
3 i
n c
olu
mn
4,
wh
eth
er f
loo
ded
du
rin
g J
anu
ary 2
01
3 t
o J
un
e 20
13
? (c
od
e)
if 1
to
3 i
n c
olu
mn
4,
lan
d u
se d
uri
ng
Jan
uar
y 2
01
3 t
o J
un
e 2
013
(co
de)
if
1,
2 ,
3 o
r 4
in
co
l.(1
3),
ty
pe
of
cro
p
pro
du
ctio
n/
liv
esto
ck f
arm
ing
(c
od
e)
if
01
to
08
in
co
l.(1
4),
wh
ether
mo
re t
han
on
e cr
op
was
gro
wn
in
th
e p
lot
du
rin
g
Jan
uar
y 2
01
3 t
o J
un
e 2
013
(y
es-1
, n
o-2
)
if
01
to
08
in
co
l.(1
4),
wh
ether
irr
igat
ed
du
rin
g J
anu
ary 2
01
3 t
o J
un
e 20
13
?
(yes
-1,
no-2
)
if ‘
1’
in c
ol.
(1
6),
so
urc
e o
f ir
rig
atio
n
(co
de)
wh
eth
er p
oss
esse
d f
or
maj
or
par
t o
f th
e
agri
cult
ure
yea
r Ju
ly 2
012
to
Ju
ne
201
3?
(yes
-1,
no-2
)
if 1
in
co
l. 1
8,
typ
e o
f cr
op
pro
du
ctio
n/
liv
esto
ck f
arm
ing
for
the
agri
cult
ure
yea
r
July
20
12
to
Ju
ne
20
13
(co
de)
wh
eth
er o
wn
ed f
or
maj
or
par
t o
f th
e of
the
agri
cult
ure
yea
r Ju
ly 2
012
to
Ju
ne
201
3?
(yes
-1,
no-2
)
no
. of
less
or/
less
ee
ho
use
ho
lds
term
s o
f l
ease
(co
de)
(1) (2) (3) (4) (5) (6) (7) (8) (9) (10) (11) (12) (13) (14) (15) (16) (17) (18) (19) (20)
A. plots listed in block 5 of visit 1 (excluding homestead land): continued from previous page
B. plots not listed in part A but were either ‘owned and possessed’ or ‘leased in’ or ‘otherwise possessed’ or ‘leased out’ during the major part of January 2013 to June 2013
(excluding homestead land)
D 12
Schedule 18.1, visit 2:5
[5] particulars of land of the household and its operation during January 2013 to June 2013 sr
l. n
o.
of
plo
t (P
art
A:
srl.
no
. a
s in
blo
ck 5
of
visi
t 1
exc
lud
ing
97
an
d 9
8;
Pa
rt B
:
con
tin
uou
s se
ria
l n
um
ber
aft
er t
he
last
srl
.
no
. i
n P
art
A)
surv
ey n
o.
or
oth
er i
den
tifi
cati
on
par
ticu
lars
(lik
e n
am
e o
f th
e p
lot)
loca
tio
n
(cod
e)
kin
d o
f p
oss
essi
on
fo
r th
e m
ajo
r p
art
of
the
per
iod
Jan
uar
y 2
013
to
Ju
ne
20
13
(co
de)
is t
her
e an
y c
han
ge
in t
he
area
of
the
plo
t
reco
rded
in
vis
it 1
? (y
es-1
, no
-2)
area
of
land
(0
.000
ha
)
if 2
or
3 i
n c
ol.
(4
),
typ
e o
f p
oss
essi
on
(co
de)
if 1
, 2
o
r 3 i
n c
ol.
(4),
du
rati
on
of
po
sses
sio
n (
cod
e)
if 2 or 4 in
col. (4)
if 4
in
co
l. 4
, u
se o
f le
ased
-ou
t la
nd
by
th
e
less
ee h
ou
seh
old
duri
ng
Jan
uar
y 2
01
3 t
o
Jun
e 2
013
(co
de)
if 1
to
3 i
n c
olu
mn
4,
wh
eth
er f
loo
ded
du
rin
g J
anu
ary 2
01
3 t
o J
un
e 20
13
? (c
od
e)
if 1
to
3 i
n c
olu
mn
4,
lan
d u
se d
uri
ng
Jan
uar
y 2
01
3 t
o J
un
e 2
013
(co
de)
if
1,
2 ,
3 o
r 4
in
co
l.(1
3),
ty
pe
of
cro
p
pro
du
ctio
n/
liv
esto
ck f
arm
ing
(c
od
e)
if
01
to
08
in
co
l.(1
4),
wh
ether
mo
re t
han
on
e cr
op
was
gro
wn
in
th
e p
lot
du
rin
g
Jan
uar
y 2
01
3 t
o J
un
e 2
013
(y
es-1
, n
o-2
)
if
01
to
08
in
co
l.(1
4),
wh
ether
irr
igat
ed
du
rin
g J
anu
ary 2
01
3 t
o J
un
e 20
13
?
(yes
-1,
no-2
)
if ‘
1’
in c
ol.
(1
6),
so
urc
e o
f ir
rig
atio
n
(co
de)
wh
eth
er p
oss
esse
d f
or
maj
or
par
t o
f th
e
agri
cult
ure
yea
r Ju
ly 2
012
to
Ju
ne
201
3?
(yes
-1,
no-2
)
if 1
in
co
l. 1
8,
typ
e o
f cr
op
pro
du
ctio
n/
liv
esto
ck f
arm
ing
for
the
agri
cult
ure
yea
r
July
20
12
to
Ju
ne
20
13
(co
de)
wh
eth
er o
wn
ed f
or
maj
or
par
t o
f th
e of
the
agri
cult
ure
yea
r Ju
ly 2
012
to
Ju
ne
201
3?
(yes
-1,
no-2
)
no
. of
less
or/
less
ee
ho
use
ho
lds
term
s o
f l
ease
(co
de)
(1) (2) (3) (4) (5) (6) (7) (8) (9) (10) (11) (12) (13) (14) (15) (16) (17) (18) (19) (20)
B. plots not listed in part A but were either ‘owned and possessed’ or ‘leased in’ or ‘otherwise possessed’ or ‘leased out’ during the major part of January 2013 to June 2013
(excluding homestead land) : continued from previous page
C. homestead land: plots which were either ‘owned and possessed’ or ‘leased in’ or ‘otherwise possessed’ during the major part of January 2013 to June 2013
97
homestead land
98
99 grand total
D 13

Schedule 18.1, visit 2:6
[6] some general information of household operational holding for January 2013 to June 2013 (only for
households where against at least one plot of block 5, entry in column 13 is any of 1, 2, 3, 4 or 5)
srl. no. item code/entry
(1) (2) (3)
1. area of the household operational holding (0.000 ha)
2. whether operated individually/jointly? (individually –1, jointly-2)
3. if code 2 in item 2
number of partner households
4. percentage share of land of the household (in whole number)
5. type of holding (code)
6. main use of the holding (code)
7. no. of parcels in the holding
8. no. of permanent attached farm workers
during January 2013 to June 2013
against wages payable in cash/kind
9. against share of produce
[8] some general information of household operational holding for the whole agricultural year: July 2012 to
June 2013 (only for households where against at least one plot of block 5, entry in column 13 of visit 1/visit 2,
is any of 1, 2, 3, 4 or 5 along with entry in visit 2, block 5 column 18 as 1)
srl. no. item code/entry
(1) (2) (3)
1. area of the household operational holding (0.000 ha)
2. whether operated individually/jointly? (individually –1, jointly-2)
3. if code 2 in item 2
number of partner households
4. percentage share of land of the household (in whole number)
5. type of holding (code)
6. main use of the holding (code)
7. no. of parcels in the holding
8. no. of permanent attached farm workers
during the agricultureal year 2012-13
against wages payable in cash/kind
9. against share of produce
10. whether the household carried out agricultural operation in July 2012 to December
2012/January 2013 to June 2013 (code)
CODES FOR BLOCK 6 & BLOCK 8
item 5: type of holding: entirely owned -1, entirely leased-in -2, both owned and leased-in -3, entirely otherwise
possessed -4.
item 6: main use of the holding: same as that in column 13 of block 5 (only codes 1 to 5 are applicable).
item 10: whether the household carried out agricultural operation in July 2012 to December 2012/January 2013
to June 2013: only in July 2012 to December 2012-1, only in January 2013 to June 2013-2, both in July
2012 to December 2012 and January 2013 to June 2013-3.
D 14

Schedule 18.1, visit 2:7
[2] particulars of field operations
srl. no. item field investigator (FI)
/assistant superintending
officer (ASO)
field officer (FO)/
superintending officer
(SO)
(1) (2) (3) (4)
1 (a)
i) name (block letters)
ii) code
iii) signature
1 (b)
i) name (block letters)
ii) code
iii) signature
2. date(s) of : DD MM YY DD MM YY
(i) survey/ inspection
(ii) receipt
(iii) scrutiny
(iv) despatch
3. number of additional sheets attached
4. total time taken to canvass the schedule by
the team of investigators (FI/ASO)
(in minutes)
5. number of investigators (FI/ASO) in the
team who canvassed the Schedule
6. whether any remarks
have been entered by
FI/ASO/ supervisory
officer
(yes –1, no-2)
(i) in block 9/ 10
(ii) elsewhere in
the schedule
[9] remarks by investigators (FI/ASO)
[10] comments by supervisory officer(s)
D 15