a nutrigenomic perspective to search for gene …
TRANSCRIPT

A NUTRIGENOMIC PERSPECTIVE TO SEARCH FOR GENE VARIANTS THAT
INFLUENCE CARCASS TRAITS OF FEEDLOT CATTLE
A Thesis Submitted to the College of
Graduate and Postdoctoral Studies
in Partial Fulfillment of the Requirement
for the Degree of Masters of Science
in the Department of Animal and Poultry Science
University of Saskatchewan
Saskatoon, SK Canada
Submitted by
Kelsey Evelyn Hamilton
© Copyright Kelsey Evelyn Hamilton, October 2018. All rights reserved.

i
PERMISSION TO USE
In presenting this thesis in partial fulfillment of the requirements for a Postgraduate degree from
the University of Saskatchewan, I agree that the Libraries of this University may make it freely
available for inspection. I further agree that permission for copying of this thesis in any manner,
in whole or in part, for scholarly purposes may be granted by the professor or professors who
supervised my thesis work, or in their absence, by the Head of the Department or the Dean of the
College in which my thesis work was done. It is understood that any copying or publication or
use of this thesis or parts thereof for financial gain shall not be allowed without my written
permission. It is also understood that due recognition shall be given to me and to the University
of Saskatchewan in any scholarly use which may be of any material in my thesis.
Request for permission to copy or to make other use of material in this thesis in whole or
part should be addressed to:
Head of the Department of Animal and Poultry Science
University of Saskatchewan
Saskatoon, Saskatchewan S7N 5A8, Canada
Dean
College of Graduate and Postdoctoral Studies
University of Saskatchwan
116 Thorvaldson Building, 110 Science Place
Saskatoon, Sakatchewan, S7N 5C9, Canada

ii
ACKNOWLEDGEMENTS
Firstly, I would like to thank my committee members. Thank you to Dr. Tim Mutsvangwa for
chairing my committee at the start of my program and to Dr. Ryan Brook from chairing my committee
during my defense, as well as to Dr. Kirstin Bett for serving as my external examiner. Thank you to Drs.
John McKinnon and Mika Asai-Coakwell for agreeing to be my committee members, and a special thanks
to Dr. Sheila Schmutz for coming out retirement to sit on my committee for an interim period.
Importanly, thank you to Dr. Fiona Buchanan for being my supervisor through not only my masters but
also through my undergraduate thesis. You have been so kind and caring and treated me as a sort of
academic-adopted daughter. I am very proud and honoured to be your final genetics Masters student.
Thank – you to Kayla Madder for mentoring me in the lab and also in life. You have taught me so
many skills and I would have been completely lost without you. I am greatful for all of the guidance you
have given me as well as the friendship we have. Rachel Jacob, thanks for helping me genotype summer
2017. I would also like to give a general thanks to the Animal Science department which I have called
home through both my BSc Animal Bioscience and MSc Animal Science. Every prof, staff member and
student is so amazing and I have always felt at home here, I will miss everyone! Thank you to my funding
agency within the Government of Saskatchewan for making this project a reality.
Thanks to my family, Mom, Dad, Marcus and Kennady, who have been so supportive in dealing
with me and my busy student life and student grumblings, especially Mom for all of the help editing and
more. Thanks to my dog Buddy for all the cuddles and dog therapy you gave me until March of this year
at fourteen years old, I’ll always miss you big guy. My Crossfit 3126 fam also deserves aknowlegement,
especially Reg for being so understanding. The gym as served as a refuge to my sanity and you are all
some of my greatest friends/ seond family. Finally, although new to my life, you were here through the
end of my Masters and probably the most stressful time. Thank you Abe for being extrememly
understanding and supportive, as well as helping with the finishing touches of formatting my thesis.

iii
ABSTRACT
Vitamin A (VA) has a nutrigenomic effect on intramuscular fat. Discovering variants in genes
involved in fat deposition that are also affected by vitamin A could allow feedlots to precision
feed to optimize carcass traits. A single nucleotide polymorphism (SNP) in alcohol
dehydrogenase 1C (ADH1C) has previously shown promise for this approach but has yet to be
effective at a commercial level; therefore we hypothesized a variant in another gene or its
interaction with ADH1Cc.-64T>C might be the solution. Genes previously shown to be affected
by retinoic acid, a metabolite of vitamin A: aminopeptidase (ANPEP), clusterin (CLU), adipose
differentiation-related protein (ADFP), glutathione peroxidase (GPX3), secreted protein, acidic,
cysteine-rich (SPARC), and insulin growth factor binding protein 6 (IGFBP6) were sequenced
and screened for variants. The ANPEPc.410G>A SNP was selected for genotyping in a
population of mixed breed steers (n=988). This population was fed vitamin A at 100% (100VA)
or 50% (50VA the NRC recommended level (2200 IU/kg dry matter). No interaction was found
with ADH1Cc.-64T>C however, ANPEPc.410G>A affected carcass yield (P<0.01;
AA=2.47±0.03, GA=2.36±0.03, GG=2.14±0.08), marbling score (P<0.01; AA=397.2±2.7,
GA=388.6±3.3, GG=370.4±7.2), and fat (P<0.01; AA=8.52±0.17 GA=7.58±0.21, GG=7.04±0.44;
mm). Vitamin A also had an effect on backfat (P<0.05; 100VA= 8.13±0.24, 50VA = 7.35±0.25),
and an interaction with ANPEPc.410c.G>A affected rib-eye area (P<0.05). The ANPEP SNP
was genotyped in a second population of mixed breed steers (N=708) fed a standard feedlot
ration with the NRC recommended level of vitamin A. There was an association with yield,
marbling, fat, and rib-eye area (P<0.01). The AA genotype was more marbled, while GG animals
were leaner with higher yields. Interestingly, ANPEPc.410G>A is the fourth variant in a
haplotype containing twelve SNPs that are in linkage disequilibrium in exon 1 and intron 1. This

iv
was confirmed by sequencing cattle of various breeds from different populations. The three
haplotypes could affect gene expression by altering transcription or translation efficiency.
Investigation of the functional effects of these variants needs to be completed in order to
understand how it alters traits related to feedlot cattle performance.

v
TABLE OF CONTENTS
PERMISSION TO USE .................................................................................................................................. i
ACKNOWLEDGEMENTS ...........................................................................................................................ii
ABSTRACT ................................................................................................................................................ iii
TABLE OF CONTENTS .............................................................................................................................. v
LIST OF TABLES .......................................................................................................................................vii
LIST OF FIGURES ................................................................................................................................... viii
LIST OF APPENDICES............................................................................................................................... ix
LIST OF ABBREVIATIONS........................................................................................................................ x
1.0 GENERAL INTRODUCTION ............................................................................................................... 1
2.0 LITERATURE REVIEW ........................................................................................................................ 3
2.1 Consumer Beef Preferences ................................................................................................................. 3
2.2 Adipogenesis........................................................................................................................................ 5
2.3 Nutrigenomics & Nutrigenetics ........................................................................................................... 8
2.3.1 Vitamin A ..................................................................................................................................... 8
2.4 Gene Expression ................................................................................................................................ 10
2.4.1 Gene variations ........................................................................................................................... 10
2.4.2 Haplotypes .................................................................................................................................. 12
2.5 Candidate Genes ................................................................................................................................ 12
2.5.1 Alcohol Dehydrogenase 1 C ....................................................................................................... 12
2.5.2 Adipose differentiation-related protein ...................................................................................... 13
2.5.3 Glutathione peroxidase 3 ............................................................................................................ 14
2.5.4 Secreted Protein, acidic cysteine-rich ........................................................................................ 14
2.5.5 Insulin growth factor binding protein 6...................................................................................... 15
2.5.6 Clusterin ..................................................................................................................................... 16
2.5.7 Aminopeptidase........................................................................................................................... 16
2.6 Hypothesis ......................................................................................................................................... 18
3.0 ANPEP VARIANTS AFFECT CARCASS TRAITS OF BEEF CATTLE .......................................... 19
3.1 Introduction........................................................................................................................................ 19
3.2 Materials and Methods: ..................................................................................................................... 22
3.2.1 Animals ........................................................................................................................................... 22
3.2.2 Carcass Evaluation ...................................................................................................................... 23
3.2.3 DNA Extraction .......................................................................................................................... 23
3.2.4 SNP Discovery & Selection........................................................................................................ 24
3.2.5 Genotyping ................................................................................................................................. 25
3.2.6 Haplotype confirmation .............................................................................................................. 25

vi
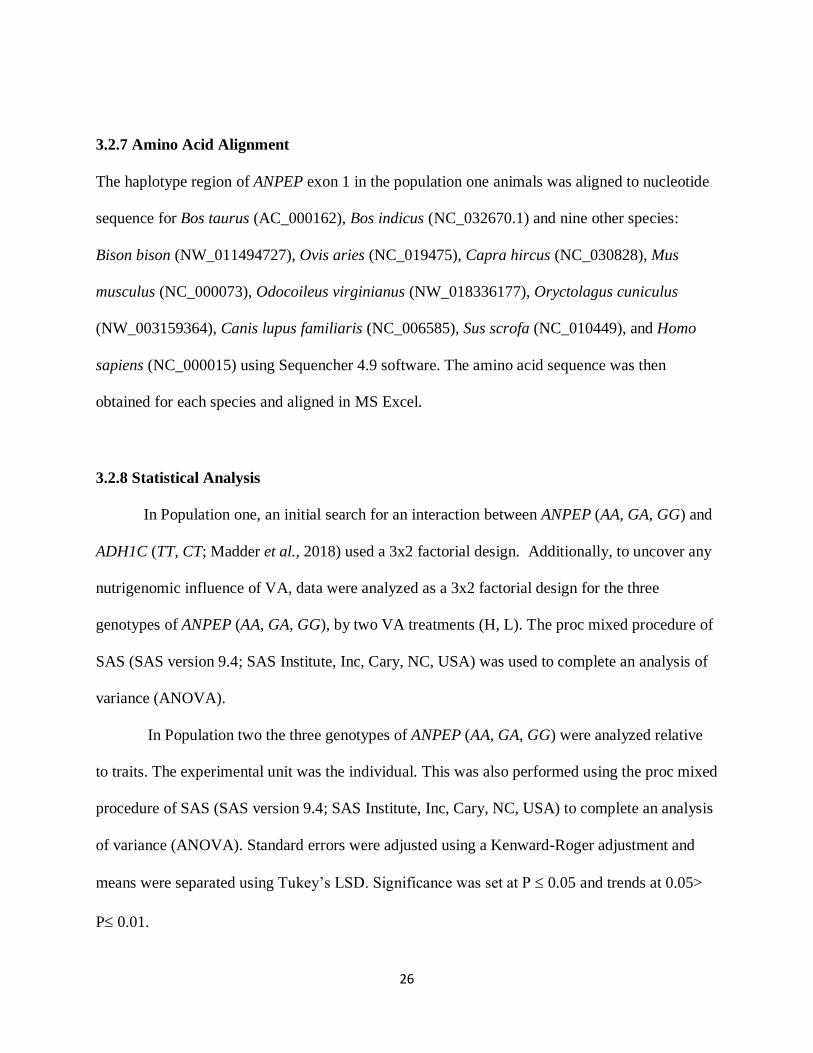
3.2.7 Amino Acid Alignment .............................................................................................................. 26
3.2.8 Statistical Analysis...................................................................................................................... 26
3.3 Results and Discussion ...................................................................................................................... 27
3.3.1 SNP Discovery and Selection ..................................................................................................... 27
3.3.2 Association studies with production and carcass traits ............................................................... 32
3.3.3 Haplotype sequencing confirmation ........................................................................................... 36
3.3.4 Amino acid alignment ................................................................................................................. 38
4.0 GENERAL DISCUSSION .................................................................................................................... 39
5.0 CONCLUSION...................................................................................................................................... 40
6.0 REFERENCES ...................................................................................................................................... 41
APPENDICIES ............................................................................................................................................ 48

vii
LIST OF TABLES
Table 3.1 Single nucleotide polymorphisms identified in the six-candidate
genes in the discovery population …………………………………….. 28
Table 3.2 Allele frequencies and number of animals genotyped at
ANPEPc.410G>A for each population …………………………..…..… 31
Table 3.3 Statistical results of ANPEPc.410G>A genotype, VA and the
interaction on camera graded carcass traits in Population 1 ….…….….. 33
Table 3.4 Confirmation of ANPEP haplotype ……………………………………. 38

viii
LIST OF FIGURES
Figure 2.1 Order of the main genes that are expressed throughout the process of
adipogenesis in ruminants ……………………………………………..… 6
Figure 2.2 Schematic of retinol metabolism within the cell ………………………… 9
Figure 3.1 Demonstration of how steers were separated into treatment pens based
on ADH1C.-64T>C genotype, implants and vitamin A treatments ……. 23
Figure 3.2 The ANPEP gene showing twenty exons with a close-up view of exon 1
to show the positions of SNPs within the haplotype and the ANPEP
peptide pertaining to exon one …………………………………………. 32
Figure 3.3 The ANPEPc.410G>A genotype effect on carcass traits in
population one steers ...….……………………………………………… 35
Figure 3.4 Interaction of ANPEPc.410G>A genotypes (AA, GA, GG) and VA...…. 36
Figure 3.5 The ANPEPc.410G>A genotype effect on carcass traits in
population two steers …………......……………………………………. 37

ix
LIST OF APPENDICES
APPENDIX A Primers used for amplification of genes sequenced in the discovery
population ……………………………………………………………… 49
APPENDIX B Amino acid sequence alignment of exon 1 in ANPEP for
Bos taurus (reference) and population 1 (alternate allele sequence)
compared to other species …………….…………………………….….. 53
APPENDIX C PAG 2018 poster ……………………………………………………….. 57

x
LIST OF ABBREVIATIONS
ADFP
Adipose differentiation related protein
ADH1C
Alcohol dehydrogenase 1 C
ANOVA
Analysis of Variance
ANPEP
Aminopeptidase
ATRA
All-trans retinoic acid
BIP
Bovine intramuscular preadipocyte
BSA
Bovine serum albumin
BSU36I
E.coli carried BSU36 gene from Bacillus subtillus 36
C/EBP
CAAT/Enhancer-binding protein
CD
Cluster of differentiation
CLA
Conjugated Linoleic acid
CLU
Clusterin
CRABP2
Cellular retinoic acid binding protein 2
ddH2O
double distilled water
DMSO
Dimethyl Sulfoxide
DNA
Deoxyribonucleic acid
E2F2
E2F Transcription factor 2
ECM
Extracellular membrane
ERK
Extracellular regulated kinases
Exo sap
Exonuclease I shrimp alkaline phosphatase
FAT
back fat thickness
GPX3
Glutathione peroxidase 3
xi
H3K27me3
methylation of histone 3 on lysine 27
H3K4/9ac
acetylation of histone 3 lysine 4 or 9
HCW
Hot carcass weight
IARC
International Agency for Research on Cancer
IGF
Insulin growth factor binding protein 6
IGFBP6
Insulin growth factor
IMF
Intramuscular fat
in
inch
IRAP
Insulin-regulated aminopeptidase
IU
International unit
kg
kilogram
LEP
Leptin
LSD
Least significant difference
MAF
Minor allele frequency
MAM
Marker assisted management
MAPK
mitogen-activated protein kinase
microRNA
micro ribonucleic acid
ml
millilitre
l
microlitre
mRNA
messenger ribonucleic acid
NRC
National research council
PCR
Polymerase chain reaction
PPAR
Peroxisome proliferator-activated receptor

xii
pref-1
Preadipocyte factor - 1
RA
Retinoic acid
RANBP10
Ras-related nuclear protein binding protein 10
RAR
Retinoic acid receptor
RARE
Retinoic acid response element
RAS
Renin-angiotensin system
RFLP
Restriction fragment length polymorphism
RXR
Retinoid X receptor
SAGE
Serial analysis of gene expression
SNP
Single nucleotide polymorphism
SOX9
Sex-determining region Y (SRY) -Box 9
SPARC
Secreted protein, acidic, cysteine-rich
sq cm
square centimeter
US
United States
UTR
Untranslated region
VA
Vitamin A
VGMARB
Vision grade marbling
VGYLD
Vision grade yield
Wnt
Wingless (Drosophila) + integration site (mouse)

1
1.0 GENERAL INTRODUCTION
In the beef cattle industry, from a management standpoint, it is essential for cattle to have
reached the desired growth of skeletal muscle and intramuscular fat (IMF) in the most cost-
effective way possible. Feed accounts for the major portion of the total cost of cattle production,
and, therefore, it is vital to maximize the outcomes from the ration fed to the animals. Although
inexpensive in itself, a component of feed that has gained recent attention is vitamin A (VA).
The VA metabolites and isomers, such as all-trans retinoic acid (ATRA) have known powerful
effects on gene regulation (McGrane, 2007). Nutrigenomics and nutrigenetics can be powerful
tools to use to find genes and gene variants that would be profitable in a marker-assisted
management (MAM) system. Knowledge of genes that affect traits such as IMF that are also
affected by certain nutrients, such as VA, could allow managers to adjust the level of these in the
diet to have the most desired outcome. Genes that are affected by VA during the differentiation
phase of cells involved in IMF production, such as preadipocytes, could be useful in a search for
single nucleotide polymorphisms (SNP)s to use in a MAM system.
The expression levels in six genes: adipose differentiation-related protein (ADFP),
glutathione peroxidase 3 (GPX3), insulin growth factor binding protein 6 (IGFBP6), secreted
protein, acidic, cysteine-rich (SPARC), clusterin (CLU) and aminopeptidase (ANPEP), changed
greatly in bovine intramuscular preadipocyte cell (BIP) culture after exposure to ATRA during
differentiation (Mizoguchi et al., 2014). Gene expression levels were increased after addition of
ATRA in five of the six genes, whereas ANPEP had decreased expression (Mizoguchi et al.,
2014). Additionally, a series of studies on a SNP in alcohol dehydrogenase 1 C gene (ADH1C;
Ward et al., 2012; Krone et al., 2015), interacted with VA in the diet and showed an association
with IMF in finished steers when VA was limiting in the diet. Recently, the ADH1Cc.-64T>C

2
genotype was tested in a commercial setting with 50% of the NRC recommended level of VA
and included both hormone implanted (Component TE100; 100 mg trenbolone acetate and 10
mg estradiol) and non-implanted steers. They did not observe any significant differences with
respect to IMF (Madder et al., 2018) but perhaps this gene interacts with others regulated by VA.

3
2.0 LITERATURE REVIEW
2.1 Consumer Beef Preferences
Consumer preferences influence their decisions and therefore control what types of products the
beef industry must provide to remain competitive. This is important at the storefront but begins
at the cow-calf and feedlot levels. Those looking for high-quality beef products will often choose
cuts that contain higher marbling content and are willing to pay more for it (Killinger et al.,
2004). Marbling, although not the main contributor to beef tenderness is often associated with it
and contributes to the eating experience by adding flavor and juiciness (Killinger et al., 2004).
Unsaturated fatty acids found in marbling decrease the melting point of fat and increase the
palatability (Smith et al., 2016). A study of consumers in the United States showed that locally
sourced beef, breed, traceability, and quality of the meat were the most important factors
influencing their buying choices (Mennecke et al., 2007). It is reasonable to assume that
Canadian consumers would have similar preferences. Since Canada exports approximately 45%
of its total beef production, 75% of which goes to the US (Canadian Cattlemen’s Association,
2018), it is essential that US consumers are willing to purchase beef produced in Canada. When
US consumers were asked to score Canadian AAA and AA along with US Choice and Select
steaks for tenderness, taste, flavour, juiciness, and likelihood to buy, there were no significant
differences between the steaks of equivalent grades. The higher marbled Canadian AAA and US
Choice were equally preferred over the other grades (Tedford et al., 2014). Additionally, the
consumers in the Tedford et al. (2014) study indicated high perceptions towards the quality and
safety of Canadian beef and very few had a concern about country of origin labeling information.
4
2.1.1 Health Concerns
Although a preference for marbling is based on palatability, consumers are becoming
increasingly health conscious and are selecting leaner meat cuts. In studies which investigated
disparities of gender when making or selecting food choices reviewed by Mennecke et al. (2007),
women are suggested to be more concerned than men about the health effects of meat. Beef is
very high in nutrients that are important in a healthy diet such as creatine, conjugated linoleic
acid, certain antioxidants, vitamin B12 and zinc among other vitamins and minerals. In
particular, iron from red meat is well absorbed and even improves the absorption of iron from
vegetable sources when consumed together (Troy et al., 2016). There have been claims in the
popular media that the fat in beef is a contributor to heart disease. Marbling, however, is
different from other fat on the beef carcass; while intermuscular fat contains many saturated fatty
acids, intramuscular fat contains many healthy unsaturated fatty acids (Troy et al., 2016). Oleic
acid can increase beneficial high-density lipoprotein cholesterol but not the harmful low-density
lipoprotein and has no risk for increased cardiovascular disease (Smith et al., 2016). Beef
products are the highest sources of conjugated linoleic acids (CLA) which are known to have
powerful anti-carcinogenic effects (Nuernberg et al., 2005). Grass-feeding can increase CLA in
marbling, but because cattle on grass have lower marbling, the proportion is similar to that in
marbling of beef finished on concentrate diets (Nuernberg et al., 2005). Despite this information,
there is a growing concern that red meats can be carcinogenic to humans. A report on red meats
by the International Agency for Research on Cancer (IARC) has classified it as probably
carcinogenic to humans based on several epidemiological studies (IARC, 2015). Reviews of this
investigation have noted problems with this claim and the way the public has interpreted it. The
problems were based on the challenging nature of epidemiological studies to determine cause and
5
effect (Troy et al., 2016; De Smet & Vossen, 2016). Rather than the meat itself, the preparation
and cooking methods that cause charring and the production of heterocyclic aromatic amines is
the concern for carcinogenic effects (De Smet & Vossen, 2016). There is much agreement that
contributions of the overall diet to either promote or protect against the carcinogenic effects of
red meats needs to be investigated but when diets and lifestyles are balanced there is little
concern for any adverse health effects (Troy et al., 2016; De Smet & Vossen, 2016).
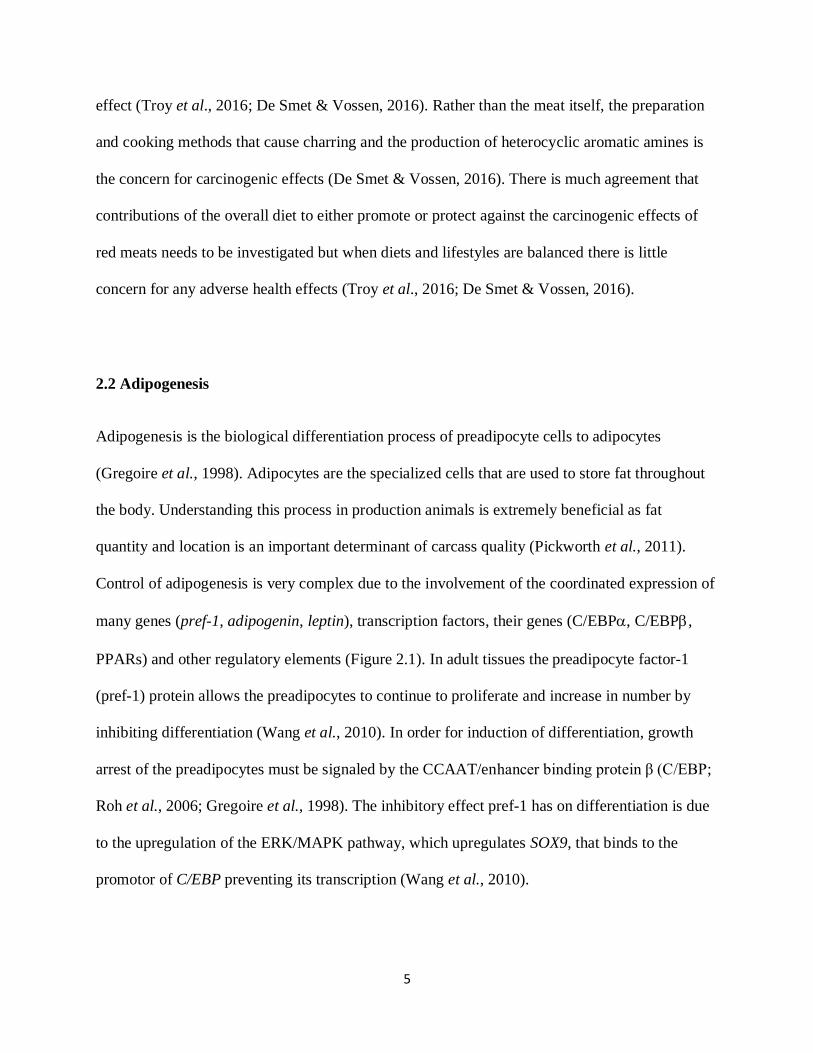
2.2 Adipogenesis
Adipogenesis is the biological differentiation process of preadipocyte cells to adipocytes
(Gregoire et al., 1998). Adipocytes are the specialized cells that are used to store fat throughout
the body. Understanding this process in production animals is extremely beneficial as fat
quantity and location is an important determinant of carcass quality (Pickworth et al., 2011).
Control of adipogenesis is very complex due to the involvement of the coordinated expression of
many genes (pref-1, adipogenin, leptin), transcription factors, their genes (C/EBP, C/EBP,
PPARs) and other regulatory elements (Figure 2.1). In adult tissues the preadipocyte factor-1
(pref-1) protein allows the preadipocytes to continue to proliferate and increase in number by
inhibiting differentiation (Wang et al., 2010). In order for induction of differentiation, growth
arrest of the preadipocytes must be signaled by the CCAAT/enhancer binding protein β (C/EBP;
Roh et al., 2006; Gregoire et al., 1998). The inhibitory effect pref-1 has on differentiation is due
to the upregulation of the ERK/MAPK pathway, which upregulates SOX9, that binds to the
promotor of C/EBP preventing its transcription (Wang et al., 2010).

6
Recently, a study in mouse 3T3-L1 cell lines found that pref-1 is regulated by a
microRNA (miRNA-143), which is a small non-coding RNA molecule, that binds to a conserved
site in the 3’UTR, which causes complete downregulation of pref-1 and allows expression of
C/EBPβ to initiate differentiation (Kim et al., 2015). Further regulation by microRNAs,
investigated in bovine preadipocytes, revealed that microRNA-378 post-transcriptionally targets
two important transcription factors in cell growth, E2F2, and RANBP10, which decreases their
expression and promotes differentiation of preadipocytes (Liu et al., 2015). Expression of
PPARɣ follows C/EBPβ to bring about growth arrest of the preadipocytes and promotes the
maturation stage along with expression of adipogenic genes. As adipocytes begin to mature the
C/EBPα isomer replaces C/EBP (Figure 2.2; Roh et al., 2006; Gregoire et al., 1998).
Figure 2.1. Order of the main genes that are expressed throughout the process of adipogenesis in
ruminants (Roh et al., 2006 with permission)
7
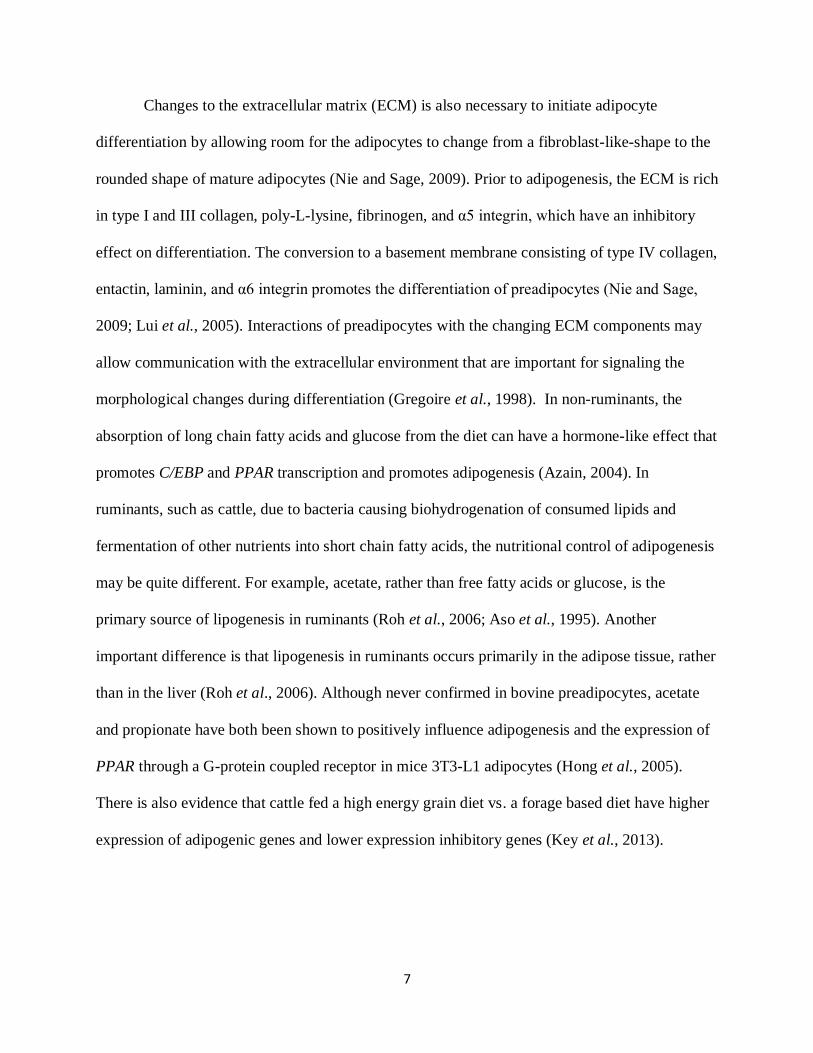
Changes to the extracellular matrix (ECM) is also necessary to initiate adipocyte
differentiation by allowing room for the adipocytes to change from a fibroblast-like-shape to the
rounded shape of mature adipocytes (Nie and Sage, 2009). Prior to adipogenesis, the ECM is rich
in type I and III collagen, poly-L-lysine, fibrinogen, and α5 integrin, which have an inhibitory
effect on differentiation. The conversion to a basement membrane consisting of type IV collagen,
entactin, laminin, and α6 integrin promotes the differentiation of preadipocytes (Nie and Sage,
2009; Lui et al., 2005). Interactions of preadipocytes with the changing ECM components may
allow communication with the extracellular environment that are important for signaling the
morphological changes during differentiation (Gregoire et al., 1998). In non-ruminants, the
absorption of long chain fatty acids and glucose from the diet can have a hormone-like effect that
promotes C/EBP and PPAR transcription and promotes adipogenesis (Azain, 2004). In
ruminants, such as cattle, due to bacteria causing biohydrogenation of consumed lipids and
fermentation of other nutrients into short chain fatty acids, the nutritional control of adipogenesis
may be quite different. For example, acetate, rather than free fatty acids or glucose, is the
primary source of lipogenesis in ruminants (Roh et al., 2006; Aso et al., 1995). Another
important difference is that lipogenesis in ruminants occurs primarily in the adipose tissue, rather
than in the liver (Roh et al., 2006). Although never confirmed in bovine preadipocytes, acetate
and propionate have both been shown to positively influence adipogenesis and the expression of
PPAR through a G-protein coupled receptor in mice 3T3-L1 adipocytes (Hong et al., 2005).
There is also evidence that cattle fed a high energy grain diet vs. a forage based diet have higher
expression of adipogenic genes and lower expression inhibitory genes (Key et al., 2013).

8
2.3 Nutrigenomics & Nutrigenetics
Nutrigenomics involves the study of nutrients and how they affect the whole genome. A branch
of nutrigenomics is nutrigenetics. Nutrigenetics investigates inherited genetic variation and
involves the study of an animal’s response to various nutrients, based on genotype (Farhud et al.,
2010; Fenech et al., 2011). Nutrigenomics can act in an epigenetic mannor, with epigenetics
being described as heritable changes that involve the regulation of genes more broadly than in
the DNA sequence. Specifically factors that determine how and when genes are turned on or off,
through DNA methylation and histone modifications (Bar-El Dadon and Reifen, 2017; Fenech et
al., 2011). Understanding how nutrients act in epigenetic pathways in animals with specific
genotypes can be extremely beneficial to understanding health and important traits of livestock
in their various environments throughout their lives from on pasture to feedlot management.
There are limitations to understanding how nutrigenetics can influence an animal based on
varying intake levels across individuals and due to genetic differences in genes outside of the
scope of study (Fenech et al., 2011).
2.3.1 Vitamin A
Vitamin A is the general term that refers to dietary -carotene and its metabolite retinoids.
Vitamin A is involved in gene regulation due to the ability of retinoids to regulate gene
expression. This is an example of nutrigenomics. One of these metabolites, retinoic acid (RA),
could potentially regulate expression levels of more than 500 genes (Ambrosio et al., 2011).
Isomers of RA such as ATRA and 9-cis-retinoic acid enter into the nucleus via cellular retinoic
acid binding protein 2 (CRABP2) and then bind to RA receptors (RAR) and retinoid X receptors
(RXR), respectively (Figure 2.2; Bar-El Dadon and Reifen, 2017). These homo- or heterodimers

9
target response elements, such as the retinoic acid response element (RARE), in the promoter
regions of genes, regulating their transcription (Figure 2.2; McGrane, 2007). Regulation by RA
in genes that influence growth can have an effect on adipocyte formation by altering
differentiation and maturation (Wang et al., 2016). Furthermore, there has been evidence that RA
exposure in genes regulated by RAR causes decreased repressive methylation (H3K27me3) and
increased activation acetylation (H3K4/9ac) epigenetic marks (Bar-El Dadon and Reifen, 2017).
Nutrigenomics effects of VA occur when genetic variation among individuals results in VA
affecting these individuals differently. The sequence differences at these critical regulatory
regions can alter the binding of RA receptor complexes or a number of other regulatory
mechanisms.
Figure 2.2 Schematic of retinol metabolism in the cell.
10
2.4 Gene Expression
Gene expression is the process by which the genetic information results in a gene product,
usually a protein. Transcription is required for gene expression by converting the DNA code into
RNA. The RNA is then translated into a protein. Interruption at any of these steps will affect
gene expression, whether this is a change to the DNA sequence or to the regulatory mechanisms
and proteins that control transcription and translation. Simply possessing a gene does not
necessarily mean that the gene will be expressed and also does not determine the amount of
expression. There are many factors and elements that control and modify the expression of
genes. This can be a permanent change such as activation or silencing of a gene, or a minor
change within genes can also affect transcription levels or the bioactivity of the resultant protein.
2.4.1 Gene variations
A powerful tool for animal selection is the identification of SNPs in association with production
traits. These SNPs can alter the protein in ways that affect production traits. Most often the SNPs
that occur in the 5’ region of the gene will have the greatest effect on expression, while non-
conserved missense mutations within exons have the greatest effect on resultant protein structure
and function. Important regulatory elements are found within the 5’ region of genes, and
therefore any changes to the DNA sequence could change transcription factor binding. An
example of a 5’ SNP in cattle is ADH1Cc.-64T>C studied by Ward et al. (2012). The variant
causes the removal of a motif for a binding site for the C/EBP transcription factor and results in
less transcription of AHD1C (Ward et al., 2012).
Non-conserved missense mutations are a single base change that result in the substitution
of an amino acid with another one that belongs to another group. A well known Bos taurus non-

11
conserved SNP is in the Leptin gene (LEPc.73C>T) resulting in a change of amino acid from
arginine (basic) to cysteine (polar and sulfur-containing). Animals with the TT genotype have
higher carcass fat, whereas CC animals are leaner (Buchanan et al., 2002). Conserved missense
mutations result in a codon corresponding to a different amino acid, but one that remains in the
same group according to the side chain. A conserved mutation is found in the appetite regulation
gene Melanocortin-4 receptor (MC4Rc.122C>G) in cattle, where the SNP causes an amino acid
change from valine to leucine, both of which are polar (Thue et al., 2001). The conserved SNP
MC4Rc.122C>G tends to affect hot carcass weight (HCW) and an interaction with a SNP in
corticotropin-releasing hormone (CRHc.22C>G) gene results in lower HCW in steers with the
CC genotype at both SNPs.
Silent mutations are those that change a nucleotide, often in the third position of a codon,
and despite the base change they still code for the same amino acid. It is often thought that since
a SNP in the third position of a codon does not result in the change of an amino acid that the
SNP has no functional effect on the resultant protein and therefore are relatively ignored. Silent
mutations may, however, have a functional role and undergo selection pressures (Chamary et al.,
2006; Zhou et al., 2009). In a base change that occurs in pro-opiomelanocortin
(POMCc.288C>T), no amino acid change occurs, and the codon still corresponds to serine (Thue
and Buchanan, 2003). An association with POMCc.288C>T was found for average daily gain
and carcass weight (Buchanan et al., 2005). While a silent SNP may not cause an amino acid
change that would affect the resulting protein structure, the altered sequence could affect mRNA
structure and consequently translation (Shabalina et al., 2013). It is also important to consider
that an amino acid has about four codons that correspond to that particular amino acid, and a
phenomenon known as codon bias, states that not all codons will be used as often as the others.
12
(Zhou et al., 2009). A variant in the third position of the codon may result in a less common
codon which can interrupt translation (Zhou et al., 2009).
2.4.2 Haplotypes
A haplotype is a series of genetic variants that are inherited together from one parent.
Commonly, a haplotype refers to variants that span a large section on a chromosome, and are
frequently found in inbred or closely related populations. Trait inheritance information can be
used to predict performance of an animal in terms of production traits or disease resistance and
species evolution (Calafell et al., 2001; Barendse, 2011). Haplotypes can also be isolated to
specific genes. Similar to the haplotypes that span a chromosome, those within genes can provide
information about gene evolution and inheritance throughout a population, as well as information
about specific traits (Ueyama et al., 2012). Allele variations within a haplotype can be very
useful for identifying frequency of cross-over events and understanding genes at the population
levels (Wall and Pritchard, 2003).
2.5 Candidate Genes
2.5.1 Alcohol Dehydrogenase 1 C
Alcohol dehydrogenase 1 C (ADH1C) is the enzyme that oxidizes retinol to retinaldehyde which
is later oxidized to retinoic acid. A previous study identified a SNP in the ADH1C gene of Bos
taurus cattle (ADH1Cc.-64T>C). This variant eliminated the binding motif for an important
transcription enhancer factor (C/EBP), with the C allele, causing lower levels of transcribed
ADH1C in animals with one or two copies of this allele (Ward et al., 2012). The ADH1Cc.-
64T>C SNP showed promise in MAM to optimize IMF at low dietary VA levels (Ward et al.,

13
2012; Krone et al., 2014). Animals homozygous for the C allele have less ADH1C to oxidize
retinol to retinaldehyde and when VA is limiting the next oxidation step of retinaldehyde to
retinoic by retinaldehyde dehydrogenase is increased threefold (Ward et al., 2012).
Consequently, the TT animals had higher IMF (Ward et al., 2012; Krone et al., 2014). An
extensive commercial trial of ADH1Cc.-64T>C genotype on 50% of the recommended level of
VA did not have an effect on IMF (Madder et al., 2018). VA is important for gene regulation by
activating RA receptors that combine in either homo or heterodimers and further activate RAREs
in the promoter regions of genes involved in adipogenesis. The effect of the ADH1Cc.-64T>C
SNP on the metabolism of the VA pathway may still effect IMF through an interaction with a
gene involved in adipogenesis or required for IMF production.
2.5.2 Adipose differentiation-related protein
In cattle, the adipose differentiation-related protein gene is located on chromosome 8 and
contains 9 exons. The ADFP gene codes for the ADFP protein, which belongs to a lipid droplet-
associated protein family. Lipid droplets are the storage form of triglycerides in tissues and are
found in association with proteins such as ADFP in skeletal muscle. The more ADFP present, the
higher the capacity to store triglycerides (Shaw et al., 2009). Despite high expression of ADFP
mRNA in adipose tissues throughout differentiation, the protein content of ADFP begins to
decrease at day three of adipose cell differentiation and is replaced by perilipins, which are
predominant in mature adipocytes (Brasaemle et al., 1997).
An in-vitro study of BIP cells showed ADFP to be upregulated during differentiation
(Mizoguchi et al., 2014). Furthermore, this study observed increased expression of ADFP when
ATRA was present. In a study of Korean cattle, a SNP (ADFPc.-56-18A>G) was found to be

14
associated with marbling (Cheong et al., 2009). The same variant may not be present in North
American cattle populations, but knowledge of this association with marbling in the Korean
cattle make this gene worth investigating.
2.5.3 Glutathione peroxidase 3
The mammalian glutathione peroxidase (GPX) gene family has four members that contain
selenocysteine at the active site (Arthur, 2001). The GPX3 gene has been sequenced in human,
rat, mouse, and cattle (Arthur, 2001). It is found on bovine chromosome 7 and has 5 exons.
Glutathione peroxidase serves as an antioxidant protein with one of its main roles to reduce
hydrogen peroxide, preventing oxidative damage (Yamasaki et al., 2006). During differentiation
of BIP in-vitro, GPX3 was upregulated with a further increase when ATRA was present
(Mizoguchi et al., 2014). An increased expression of GPX3 during BIP cell differentiation may
be due to GPX acting to reduce oxidative damage during lipid metabolism (Yamaskaki et al.,
2006).
2.5.4 Secreted Protein, acidic cysteine-rich
In cattle, the Secreted Protein, acidic cysteine-rich (SPARC) gene is found on chromosome 7 and
has 10 exons. This highly conserved gene throughout all species has a matricellular protein that
regulates cell interactions with the extracellular membrane that can be expressed in many tissues
at times of development, cell turnover and tissue repair (Yan and Sage, 1999). The SPARC
protein is found to interact with growth factors and is known to have relatively diverse activity
(Joseph et al., 2012). In a study comparing SPARC-null to wildtype mice, the null mice had a
larger number and size of adipocyte cells in their fat pads (Bradshaw et al., 2003). This is

15
consistent with studies that have shown SPARC to activate integrin-linked kinase which led to
increased levels of β-catenin (part of the Wnt/β-catenin pathway that determines the tissue fate of
mesenchymal stem cells) and inhibits adipogenesis by favoring osteoblastogenesis (Nie and
Sage, 2009). Additionally, SPARC enhances preadipocyte growth and proliferation by enhancing
fibrinogen in the extracellular matrix and the α5 integrin and prevents expression of α6 integrin
and deposition of laminin which is associated with growth arrest (Nie and Sage, 2009). When
BIPs undergo differentiation SPARC is downregulated, however, with ATRA present during
differentiation, SPARC mRNA levels are higher (Mizogouchi et al., 2014).
2.5.5 Insulin growth factor binding protein 6
The bovine insulin growth factor binding protein 6 (IGFBP6) gene, has 4 exons, is located on
chromosome 5, and is an important binding protein for insulin growth factors (IGFs). Although
IGFBP6 binds both IGF-1 and IGF-2, it is especially important for IGF-2 inhibition, having a 50
fold preferential binding affinity for IGF-2 over IGF-1 (Bach, 2015). Since IGF-2 is still
prevalent in adult tissues, while IGF-1 is downregulated after birth (Bach, 2015), the preferential
binding of IGFBP6 for IGF-2 may indicate its importance to growth and development.
The regulation of IGFBP6 is cell-specific and is controlled by effectors such as cAMP,
IGFs, vitamin D, p53, glucocorticoids and most importantly for our purposes, RA (Bach, 2015).
Regulation of IGFPB6 expression has been shown to be controlled by retinoid X receptor (RXR)
and retinoic acid receptor (RAR) in the first intron, in which expression is increased by
binding of retinoids (Uray et al., 2009). It has also been proposed that the suppression of
IGFBP6 upon adipogenic stimulation may be an indication that this gene controls the
proliferation of pre-adipocytes (Mizoguchi et al., 2014).

16
2.5.6 Clusterin
The Clusterin (CLU) gene, is located on chromosome 8 and contains 11 exons in Bos taurus. The
gene is highly conserved, and expression is found in many mammalian tissues; in humans, two
distinct mRNA transcripts have been found, due to regulation by two different promoters (Rizzi
et al., 2009). The CLU protein, also known as apolipoprotein J, is most commonly found in the
cell cytosol under stress conditions (Poon et al., 2002). Determining the exact physiological role
of CLU has been problematic due to the fact that the protein appears to be involved in many
different processes, interacting with many molecules, including itself, often acting as a
chaperone protein (Jones and Jomary, 2002). Most of the research on CLU has been in humans
on cancer, Alzheimer’s and male fertility, although some research has investigated CLU in the
area of obesity (Oberbach et al., 2011). An important role of CLU may be in its association with
high-density lipoproteins which reduces the level of low-density lipoproteins and therefore helps
to reduce inflammation and oxidation (Park et al., 2017; Brites et al., 2017). In-vitro study of
BIP cells showed increased expression of CLU during differentiation, and even more expression
occurred when ATRA was present when the BIP cells were maturing (Mizoguchi et al., 2014).
2.5.7 Aminopeptidase
Aminopeptidase (ANPEP), also known as CD13, APN, and P150, has 20 exons and is found on
chromosome 21 in Bos taurus. The ANPEP gene is conserved throughout many species. Exon
one is highly conserved as it contains the vital cytoplasmic domain as well as the transmembrane
anchoring region (Luan and Xu, 2007). Expression of ANPEP is found in many different tissues
throughout the body but shows the highest expression in the brush border membranes of the

17
kidney, mucosa of the small intestine and in the liver (Chen et al., 2012). The ANPEP protein is
known for having many different biological roles, however, its extent of importance and
involvement is not well known. It is a membrane-bound member of the M1 zinc
aminopeptidases, cleaving amino acids from the N-terminal ends of proteins, especially
favouring alanine (Sato, 2003). A function of ANPEP may be influencing angiogenesis (Rangel
et al., 2006; Sato 2003).
Aminopeptidase may influence the amount of adipose tissue present throughout the body
due to its role in the Renin-Angiotensin System (RAS). The most well-known role of RAS is in
the maintenance of blood pressure and electrolyte balance in the body through controlling water
and solute filtration of the kidneys. Recent research, however, has focused on how the role of
RAS in other tissues may affect feed intake and adipose tissue growth and metabolism
(Sunagawa et al., 2001). There are several aminopeptidases involved in the RAS pathway that
result from different genes. Aminopeptidase N has been identified as the enzyme that converts
angiotensin III to angiotensin IV. Angiotensin IV is one of the final products of the RAS
pathway and activates insulin-regulated aminopeptidase (IRAP), which downstream regulates
glucose uptake. The main hormone of the RAS pathway, angiotensin II has been shown to inhibit
adipogenesis (Slamkova et al., 2016). There is evidence that angiotensin III function very
similarly to angiotensin II and in some cases may be the preferred ligand (Yugandhar and Clark,
2013).

18
2.6 Hypothesis
I hypothesized that based on function, one or more of the six candidate genes (ANPEP, CLU,
ADFP, IGFBP6, GPX3, and SPARC) will contain a variant that will affect marbling content and
overall carcass quality of steers. The candidate gene may also have an interaction effect with
ADH1C when vitamin A is limited.

19
3.0 ANPEP VARIANTS AFFECT CARCASS TRAITS OF BEEF CATTLE
3.1 Introduction
Identification of gene variants that modify the performance of beef cattle at any stage of
production is a valuable tool that producers can use to maximize the outputs of their management
practices. Knowledge of the effects of gene variants can be of particular importance at the feedlot
as this is the point in production where management practices make a large impact on the well-
being and growth of the animals. Since management at the feedlot level is a highly controlled
and expensive process, it can be advantageous if genotype based management improves the
efficiency of current practices in North American feedlots; this is termed marker-assisted
management (MAM). At the feedlot, diets are tightly regulated and formulated specifically to the
growth stage of the animal. North American practices of raising beef with hormone implants to
increase lean meat yield can negatively affect the intramuscular fat (IMF) or marbling of these
animals (Wang et al., 2016). Therefore, it is important to find other ways to generate marbled
carcasses for consumer demands. Marbling is important because it adds value to meat cuts by
contributing to tenderness, flavor, and juiciness. Consumers in North America find higher
marbled beef more preferable and are willing to pay more for it (Killinger et al., 2004).
Vitamin A is an important component of a mammalian diet. It is necessary for many
processes within the body, including vision, immune function, reproduction, adipogenesis and
growth (Li and Tso, 2003). According to NRC beef (1996), the recommended level of VA in the
diet of feedlot cattle is 2200 IU/kg dry matter. Vitamin A is consumed in the pro-retinoid
carotenoid form, known as β-carotene, which is later converted to retinol in the intestine
(D’Ambrosio et al., 2011). The bioactive metabolites of VA are retinol and retinoic acid (RA).
The isomers of RA, all-trans-retinoic acid (ATRA) and 9-cis-retinoic acid, bind to retinoic acid

20
receptors (RAR) and retinoid X receptors (RXR), respectively. In either homo- or heterodimers
these then bind to RA response elements (RARE) in the promoter regions of genes regulating
their transcription and affecting adipogenesis (McGrane, 2007). The ability of retinoids to
regulate gene expression is an example of nutrigenomics.
Nutrigenomics has been described as the study of the interaction of nutrients and the
whole genome. Nutrigenetics considers genetic variation and involves the study of an animal’s
response to various nutrients, based on genotype (Farhud et al., 2010). It is thought that RA
could regulate expression levels of greater than 500 genes (D’Ambrosio et al., 2011).
Nutrigenomic effects of RA regulate gene expression affecting adipocyte formation, and
differentiation or maturation (Wang et al., 2016).
Many research projects have been conducted to identify genes involved in IMF or
associated with the amount of IMF (Ward et al., 2012; Buchanan et al., 2005; Buchanan et al.,
2002). One example is a gene variant in leptin (LEP) that has been implemented into feedlots
(Buchanan et al., 2002; Kononoff et al., 2005) in North America. The genotypes from
LEPc.73C>T are sorted by genotype in North American feedlots to optimize IMF utilizing
MAM. Another promising gene variant was in alcohol dehydrogenase 1C (ADH1C; Ward et al.,
2012; Krone et al., 2015), which interacts with VA in the diet. The ADH1Cc.-64T>C SNP had
an association with IMF in finished steers when VA was limiting in the diet. Recently, the
ADH1Cc.-64T>C genotype was tested in a commercial setting with 50% of the NRC
recommended level of VA and included both hormone implanted and non-implanted steers. They
did not observe any differences with respect to IMF (Madder et al., 2018). We are now
considering other genes affected by RA that might have a greater effect on IMF, perhaps also
having an interaction effect with ADH1C.

21
Identification of genes that affect traits such as IMF that are also affected by certain
nutrients, such as VA, could allow managers to adjust the level of these in the diet to have the
most desired outcome. A preliminary study evaluated differentially expressed genes in response
to ATRA in bovine intramuscular preadipocyte (BIP) cells from Japanese Black cattle
(Mizoguchi et al., 2010). In this study, serial analysis of gene expression (SAGE) was performed
that identified 878 genes that were differentially expressed during intramuscular adipocyte
differentiation (Mizoguchi et al., 2010). Sixteen genes from this study were selected for further
investigation due to the magnitude of change observed in expression levels, in the presence of
ATRA (Mizoguchi et al., 2014). Gene expression levels for each of the genes was compared
with and without exposure to ATRA (Mizoguchi et al., 2014).
Six of these genes were selected: adipose differentiation-related protein (ADFP),
glutathione peroxidase 3 (GPX3), insulin growth factor binding protein 6 (IGFBP6), secreted
protein, acidic, cysteine-rich (SPARC), clusterin (CLU) and aminopeptidase (ANPEP) whose
expression levels changed the most in BIP cell culture after exposure to ATRA (Mizoguchi et
al., 2014). These genes were screened for variants in Canadian beef cattle, and association
studies with carcass traits were assessed. The nutrigenetic and nutrigenomic effect of VA with
the gene variant was evaluated.

22
3.2 Materials and Methods:
3.2.1 Animals
3.2.1.1 Discovery population
Sixteen cattle were used for gene sequencing to search for SNPs. These samples consisted of five
purebreds (Limousin, Hereford, and three Simmental) and seven crossbred animals from the
Canadian Beef Reference Herd (Schmutz et al., 2001) and an additional four crossbred steers
(Pugh et al., 2011).
3.2.1.2 Population 1
This population of 1000 steers was finished at Cattleland Feedyards Ltd (Strathmore, AB) and
was used to determine the effect of SNPs and their interaction with VA and/or ADH1Cc.-64T>C.
This population was previously described by Madder et al. (2018). Briefly, 1000 TT steers and
1000 CT steers at ADH1Cc.-64T>C were each further divided into 500 hormone implanted
(Component TE100; 100mg trenbolone acetate and 10mg estradiol, at sorting and after 70 days
on feed) and 500 not implanted. Within each group of 500, 250 were fed 50% and 250 were fed
100% of the NRC recommended level of VA during finishing (Figure 3.1). Animals were
slaughtered at an average pen weight of 612 kg. For the purpose of this study only the implanted
animals of both TT and CT genotypes were investigated (n=1000).
3.2.1.3 Population 2
This population of 700 steers was representative of feedlot cattle in Canada. Steers were finished
at Cattleland Feedyards Ltd. (Strathmore, AB) and were fed a standard feedlot diet with 100%
NRC recommended level of vitamin A. The steers were grouped in pens according to standard
feedlot procedures.

23
Figure 3.1 Demonstration of how steers were separated into treatment pens based on ADH1C.-
64T>C genotype, implants and vitamin A treatments (percentage of NRC 1996
recommendation). The orange cell depicts the group of animals that would follow the same
pattern as shown for the implanted animals but were excluded from this study.
3.2.2 Carcass Evaluation
Both populations were slaughtered at JBS Food Canada (Brooks, AB) where carcass data was
collected. This included hot carcass weight (HCW) and further carcass evaluation was performed
via a VBG 2000 (e+v Technology GmbH & Co. K.G, Oranienburg, Germany) vision camera
grading system for vision grade yield (YLD; 1.0-5.9), vision grade marbling (MARB; 00-900),
ribeye area (REA) and fat thickness.
3.2.3 DNA Extraction
Skin tissue samples were collected from all animals and the DNA extraction was performed at
Quantum Genetix (Saskatoon, Sk). The tissue samples were placed into 96 well plates and 0.2 M
2000
1000 TT
500 Implanted
250
100% NRC VA
250
50% NRC VA500 No Implant
1000 CT
500 Implanted
250
100% NRC VA
250
50% NRC VA500 No Implant
24
NaOH was added followed by an incubation period of 15 mins at 58-62C. Following
incubation, 1.6% concentration HCl + 0.1M Tris was added to each well. Plates were then
centrifuged to ensure sufficient mixing of the solutions.
3.2.4 SNP Discovery & Selection
The selected candidate genes, ADFP, GPX3, CLU, SPARC, IGFBP6, and ANPEP were screened
for SNPs. The Bos taurus reference sequence was obtained for each gene (GenBank
NC_007306, AC_000165, NC_007305, NC_007305, AC_000178, AC_000162 respectively).
Primers were designed using Primer 3 software (ELIXER) and purchased from IDT (Coralville,
Iowa). The primers were designed so that sequence of the coding regions, as well as the 5’ UTR
and the 3’ UTR of each gene, could be searched for variants (Appendix A).
Polymerase chain reaction (PCR) was performed to amplify genomic DNA in 16 animals
from the discovery population. The 25 l PCR cocktail was made with 0.2 pmol forward and
reverse primers (Integrated DNA Technologies, Coralville, IA) 2mM MgCl2, 0.2mM dNTP
(Burlington, ON), 10X taq buffer with (NH4)2SO4MgCl2), 2 l Taq polymerase (Fermentas,
Burlington, ON) and 0.5 mg/ml BSA and ddH2O. The PCR was performed on a T100
Thermocycler (Biorad, Mississauga, ON) at 52-62C for 30 cycles. The program began with
initial denaturation at 95C for 2 minutes followed by 29 cycles of 30 seconds at 95C, 30
seconds at the annealing temperature (52-62C) and 45 seconds at 72C. Finally, an extension
period completed the program at 72C for 10 minutes.
Post-PCR samples were cleaned using an Exonuclease I, FastAp protocol (Thermo
Fisher, Waltham, MA) before being sequenced by Sanger sequencing at the National Research
Council of Canada (Saskatoon, SK). Sequences were aligned to the Bos taurus reference
25
sequence and analyzed for SNPs with Sequencher 4.9 software (Gene codes corporation, Ann
Arbor, MI).
3.2.5 Genotyping
In order to genotype, a polymerase chain reaction-restriction fragment polymorphism (PCR-
RFLP) was designed for the ANPEPc.410G>A SNP which is part of an 12-SNP haplotype in
exon 1 and intron 1 of ANPEP. These SNPs were in linkage disequilibrium so this SNP
effectively genotyped 12 SNPs at once. Due to lower quality DNA samples extracted from ear
tissue samples in population one and two, as opposed to DNA extracted from blood in the
discovery population, a different forward and reverse primer set (forward 5’- ACC TTG GAC
CAG AG CAA GC-3’; reverse 5’-CTG CTT CCA GGG AGC TC TT-3’) had to be used to
obtain a product. Amplification by PCR was performed as described above, with an annealing
temperature of 61C and BSA as the additive. The PCR product was then digested with the
restriction endonuclease BSU36I (New England Biolabs, Ispwich, MA) overnight at 37C, and
visualized via gel electrophoresis on an ethidium bromide stained 3% agarose gel.
3.2.6 Haplotype confirmation
In order to determine if the ANPEP haplotypes identified in the initial SNP discovery population
still held in the experimental population, 14 randomly selected animals from population one were
selected for sequencing. The primer set (forward 5’- ACC TTG GAC CAG AG CAA GC-3’;
reverse 5’-CTG CTT CCA GGG AGC TC TT-3’) for a shorter amplicon had to be used to allow
for amplification in the experimental population. Sequencing was performed as described above
and analyzed using Sequencher 4.9 software (Gene codes corporation, Ann Arbor, MI).
26
3.2.7 Amino Acid Alignment
The haplotype region of ANPEP exon 1 in the population one animals was aligned to nucleotide
sequence for Bos taurus (AC_000162), Bos indicus (NC_032670.1) and nine other species:
Bison bison (NW_011494727), Ovis aries (NC_019475), Capra hircus (NC_030828), Mus
musculus (NC_000073), Odocoileus virginianus (NW_018336177), Oryctolagus cuniculus
(NW_003159364), Canis lupus familiaris (NC_006585), Sus scrofa (NC_010449), and Homo
sapiens (NC_000015) using Sequencher 4.9 software. The amino acid sequence was then
obtained for each species and aligned in MS Excel.
3.2.8 Statistical Analysis
In Population one, an initial search for an interaction between ANPEP (AA, GA, GG) and
ADH1C (TT, CT; Madder et al., 2018) used a 3x2 factorial design. Additionally, to uncover any
nutrigenomic influence of VA, data were analyzed as a 3x2 factorial design for the three
genotypes of ANPEP (AA, GA, GG), by two VA treatments (H, L). The proc mixed procedure of
SAS (SAS version 9.4; SAS Institute, Inc, Cary, NC, USA) was used to complete an analysis of
variance (ANOVA).
In Population two the three genotypes of ANPEP (AA, GA, GG) were analyzed relative
to traits. The experimental unit was the individual. This was also performed using the proc mixed
procedure of SAS (SAS version 9.4; SAS Institute, Inc, Cary, NC, USA) to complete an analysis
of variance (ANOVA). Standard errors were adjusted using a Kenward-Roger adjustment and
means were separated using Tukey’s LSD. Significance was set at P 0.05 and trends at 0.05>
P 0.01.

27
3.3 Results and Discussion
3.3.1 SNP Discovery and Selection
Seventy-six SNPs were found throughout the six candidate genes (Table 3.1) sequenced in the
discovery population. Many of these SNPs were in non-coding areas such as introns (n=50), 3’
(n=3) and 5’ (n=1). Of the SNPs identified in the exons fourteen were silent (did not change the
amino acid), five were conserved missense mutations (the amino acid substituted was from the
same grouping according to the side chain), and two were non-conserved missense mutations
(amino acid substituted was from a different group according to side chain properties). Allele
frequencies were calculated (Table 3.1) and taken into consideration when selecting a gene SNP
for genotyping. To consider a marker for genotyping the minor allele frequency (MAF) had to be
greater than or equal to 30%.
Table 3.1. Single nucleotide polymorphisms identified in the six candidate genes in
the discovery population.
Gene Location Annotation Amino acid change
Allele Frequencies
ADFP Exon 1 ADFPc.17C>T Ala>Val1 C=0.17 T=0.83
Intron 1 ADFPc.30+21G>A -
Intron 1 ADFPc.30+27T>C -
Exon 2 ADFPc.53A>G Gln>Gln A=0.76 G=0.24
Intron 2 ADFPc.226+54G>T -
Intron 3 ADFPc.309+758A>G -
Exon 4 ADFPc.462C>T Ser>Ser C=0.92 T=0.08
Intron 4 ADFPc.595+23A>G -
Intron 4 ADFPc.595+865A>G -
Intron 4 ADFPc.595+931T>C -
Intron 4 ADFPc.595+944A>T -
Intron 5 ADFPc.777+64T>C -
Intron 5 ADFPc.777+107A>G -
Intron 6 ADFPc.912+33G>C -
Intron 6 ADFPc.912+1180T>C -
CLU 5' CLUc.-53C>G - C=0.70 G=0.30
Intron 1 CLUc.79+1060C>G -

28
Intron 1 CLUc.79+1144A>G -
Intron 1 CLUc.79+1260C>T -
Exon 4 CLUc.448C>T Asn>Asn C=0.80 T=0.20
Exon 4 CLUc.634C>G Leu>Leu C=0.95 G=0.05
Intron 5 CLUc.910+3318G>A -
Intron 5 CLUc.910+3380G>A -
Intron 5 CLUc.910+3384G>A -
Exon 6 CLUc.930G>A Pro>Pro G=0.75 A=0.25
Intron 6 CLUc.1140+9C>T -
Intron 6 CLUc.1140+666A>G -
Intron 7 CLUc.1310+7T>G -
Intron 7 CLUc.1310+10T>C -
3' CLUc.*1320+28Gindel -
SPARC Intron 1 SPARCc.57+716T>C -
Intron 2 SPARCc.120+40T>C -
Intron 8 SPARCc.886+355G>C -
GPX3 Exon 1 GPX3c.33C>T Leu>Leu
Intron 1 GPX3c.89+110G>A -
Intron 3 GPX3c.361+112T>C -
Intron 4 GPX3c.465+94G>A -
Intron 4 GPX3c.465+106A>C>T -
Intron 4 GPX3c.465+251T>A -
Intron 4 GPX3c.465+360A>G -
Exon 5 GPX3c.573C>T Asp>Asp
3' GPX3c.*681+85G>A -
3' GPX3c.*681+149T>C -
IGFBP6 Exon 1 IGFBP6c.87C>T Gly>Gly C=0.97 T=0.03
Intron 3 IGFBP6c.663+615A>G -
Intron 3 IGFBP6c.663+722T>C -
ANPEP Exon 1 ANPEPc.57T>C Gly>Gly T=0.50 C=0.50
Exon 1 ANPEPc.201A>G Pro>Pro A=0.50 G=0.50
Exon 1 ANPEPc.404T>C Val>Ala1 T=0.50 C=0.50
Exon 1 ANPEPc.410G>A Arg>Lys1 G=0.50 A=0.50
Exon 1 ANPEPc.483C>G Val>Val C=0.50 G=0.50
Exon 1 ANPEPc.516G>A Thr>Thr G=0.50 A=0.50
Exon 1 ANPEPc.519T>C Tyr>Tyr T=0.50 C=0.50
Exon 1 ANPEPc.555C>T Asp>Asp C=0.50 T=0.50
Intron 1 ANPEPc.606+18A>C -
Intron 1 ANPEPc.606+53T>C -
Intron 1 ANPEPc.606+123G>A -
Intron 1 ANPEPc.606+478G>A -
Intron 6 ANPEPc.1284+48T>C -
Intron 6 ANPEPc.1284+51G>A -
29
Intron 7 ANPEPc.1428+13T>C -
Intron 7 ANPEPc.1428+125G>C -
Intron 8 ANPEPc.1494+79G>A -
Exon 12 ANPEPc.1946G>C Arg>Pro2 G=0.81 C=0.19
Exon 14 ANPEPc.2065A>C Met>Leu1 A=0.88 C=0.12
Intron 14 ANPEPc.2154G>A -
Intron 14 ANPEPc.2154+1533C>G -
Intron 15 ANPEPc.2246+39T>G -
Intron 17 ANPEPc.2525+105G>A -
Intron 17 ANPEPc.2525+1026T>G -
Intron 17 ANPEPc.2525+1042G>A -
Exon 18 ANPEPc.2610C>T Ile>Ile C=0.86 T=0.14
Intron 18 ANPEPc.2666+103A>G -
Intron 18 ANPEPc.2748+82G>A -
Exon 20 ANPEPc.2875A>C Asn>His2 A=0.96 C=0.04
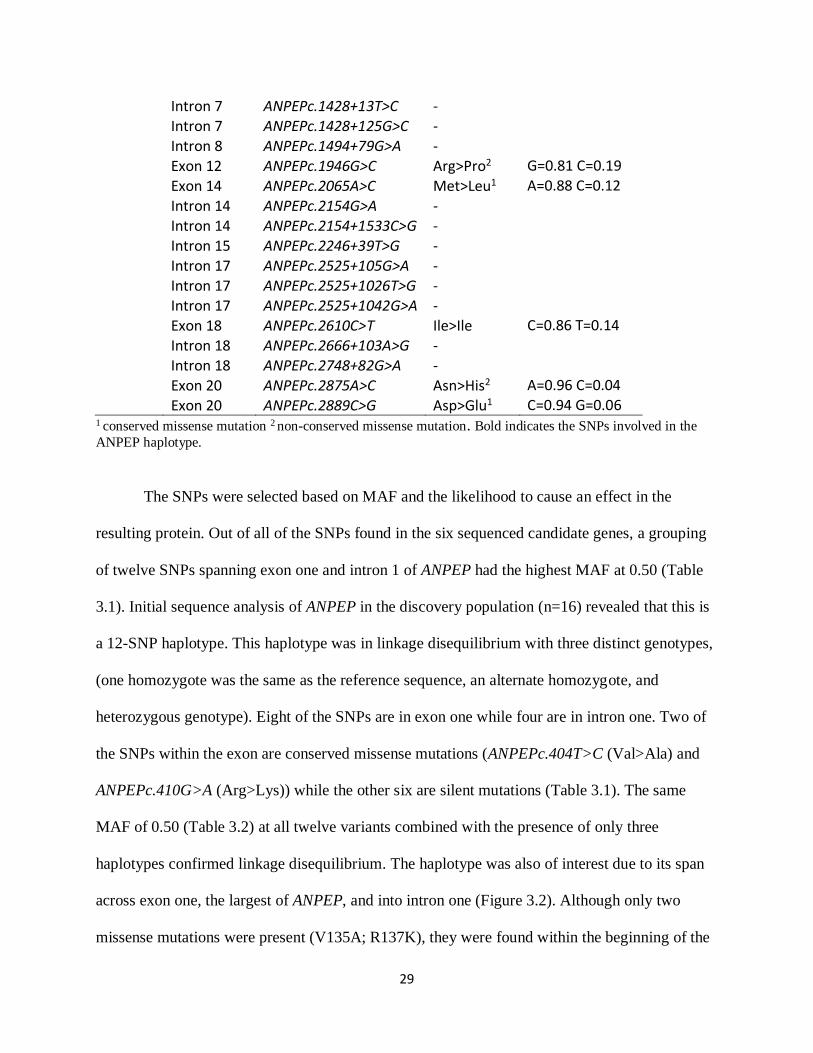
Exon 20 ANPEPc.2889C>G Asp>Glu1 C=0.94 G=0.06 1 conserved missense mutation 2 non-conserved missense mutation. Bold indicates the SNPs involved in the
ANPEP haplotype.
The SNPs were selected based on MAF and the likelihood to cause an effect in the
resulting protein. Out of all of the SNPs found in the six sequenced candidate genes, a grouping
of twelve SNPs spanning exon one and intron 1 of ANPEP had the highest MAF at 0.50 (Table
3.1). Initial sequence analysis of ANPEP in the discovery population (n=16) revealed that this is
a 12-SNP haplotype. This haplotype was in linkage disequilibrium with three distinct genotypes,
(one homozygote was the same as the reference sequence, an alternate homozygote, and
heterozygous genotype). Eight of the SNPs are in exon one while four are in intron one. Two of
the SNPs within the exon are conserved missense mutations (ANPEPc.404T>C (Val>Ala) and
ANPEPc.410G>A (Arg>Lys)) while the other six are silent mutations (Table 3.1). The same
MAF of 0.50 (Table 3.2) at all twelve variants combined with the presence of only three
haplotypes confirmed linkage disequilibrium. The haplotype was also of interest due to its span
across exon one, the largest of ANPEP, and into intron one (Figure 3.2). Although only two
missense mutations were present (V135A; R137K), they were found within the beginning of the

30
polypeptide chain of the catayltic domain and could affect structure of the protein (Figure 3.2).
The eight exonic SNPs occur in the membrane-spanning (1), supporting stalk (1), and
polypeptide chain of the catalytic domain regions of the protein (6, Figure 3.2). The two
missense mutations are in the polypeptide chain of the catalytic domain and could affect the
protein structure. The SNPs found in ADFP, CLU, SPARC, GPX3, and IGFBP6 either did not
have a great enough minor allele frequency or a variant that was likely to have an effect on the
resultant protein structure, and therefore none were selected for further analysis.
We genotyped the two populations of steers using a PCR-RFLP test for
ANPEPc.410G>A SNP, using it as a tag for the haplotype. This SNP was chosen as it was one of
the conserved missense mutations within the haplotype and a restriction endonuclease was
identified that could distinguish the alleles. Due to the shorter fragment amplified in population
one and two, the twelfth SNP of the haplotype (ANPEPc.606+478G>A) was not included in the
amplicon. Genotyping of ANPEPc.410G>A in both populations one and two resulted in lower
MAFs of 0.27 and 0.28 respectively as comparared to the discovery population (Table 3.2).
Table 3.2 Allele frequencies and number of animals genotyped at ANPEPc.410G>A for each
population
Discovery Population 1 Population 2
A allele 0.50 0.73 0.72
G allele 0.50 0.27 0.28
Animals (n) 16 968 674

31
Figure 3.2 The twenty exons of ANPEP with a close-up view of exon 1 to show the positions of SNPs within the haplotype and the
ANPEP peptide pertaining to exon one. The intronic SNPs are identified by the grey arrows. Arrows point to the SNP positions in the
amino acid sequence. Orange arrows indicate the positions at which the SNP causes an amino acid change. The orange star indicates
the SNP that was used for genotyping by PCR-RFLP.

32
3.3.2 Association studies with production and carcass traits
3.3.2.1 Population 1 (ANPEP, ADH1C, and vitamin A)
The ANPEP haplotype was first genotyped in Population one (n=1000). There was no effect of
ADH1Cc.-64T>C nor was there an interaction between ANPEPc.410G>A and ADH1Cc.-64T>C
with carcass traits (data not shown). Madder et al. (2018) did not observe an effect of ADH1Cc.-
64T>C or an interaction between ADH1C genotypes and VA with carcass traits. Subsequently,
ADH1C was left out of any further analysis using this population. This population was also used
to determine the nutrigenomic relationship between ANPEP genotypes and vitamin A level in the
diet for an effect on carcass traits of the feedlot steers. Vitamin A had an effect on backfat
thickness (FAT) and an interaction of ANPEP and VA was found for ribeye area (REA; Table
3.3). A significant effect of ANPEP was found for all carcass traits except hot carcass weight
(HCW; Table 3.3).
Table 3.3 Statistical results of ANPEPc.410G>A genotype, VA and the interaction on
camera graded carcass traits in Population 1.
Variable HCW YLD MARB REA FAT
(sq inch) (inch)
ANPEP 0.253 <0.001 0.001 0.027 <0.001
VA 0.618 0.627 0.203 0.008 0.023
ANPEP*VA 0.063 0.388 0.743 0.016 0.247 Bold values indicate significance (P<0.05). HCW = hot carcass weight, YLD = vision grade yield grade,
MARB = vision grade marbling score, REA= ribeye area (inch2), FAT= back fat thickness (inch), VA=
vitamin A treatment, ANPEP= ANPEPc.410G>A genotype
Hot carcass weight (HCW) is important to feedlot producers since most abattoirs pay
producers based on this value. No association for HCW with ANPEP was found (P = 0.253)
however, feedlot producers do have the opportunity to receive premiums for carcass quality. The
vision grade yield (YLD) is a scale from 1.0 to 5.9, with a lower score being more desirable. This

33
calculation considers back fat, internal fat (kidney, pelvic and heart fat), REA, and HCW. The
steers with the GG genotype had the lowest YLD (2.15 0.075), the GA were intermediate (2.36
0.034) and AA had the highest (2.48 0.029; Figure 3.3A). Since all of the genotypes are
significantly different from each other this would suggest an additive mode of action. A low
YLD would make GG animals the preferred genotype when it comes to YLD.
In Canada, beef that grades ‘AAA’ and “prime” are the most desirable to consumers and
therefore cost the most at the grocery store (Killinger et al., 2004). Canadian “prime” beef is
described as having slightly abundant marbling (MARB score between 700-799 by camera
grading systems at the processing plant). Canadian ‘AAA’ is the next best grade of beef and is
described as having small marbling and scores between 400-699. The two lower grades are
Canadian ‘A’ and Canadian ‘AA’ score 200-299 and 300-399, respectively (Canadian beef
grading agency). The effect of ANPEP on MARB revealed the AA genotype had higher (397.60
2.68) MARB than the GG genotype (370.76 7.02), while GA animals were intermediate
(388.40 3.22; Figure 3.3). Although ANPEPc.410A>G SNP statistically influences MARB
these results may not be of economic importance. The MARB score only changes the quality
grade (Canada A to “prime”) every100 points with the exception being within “AAA” where
there is a 300-point difference. On average there would be no change in quality grade between
ANPEPc.410A>G genotypes except for potentially some animals with a AA genotype that might
grade Canadian ‘AAA’ as opposed to Canadian ‘AA’.
Since animals develop back fat before intramuscular fat (Roh et al., 2006), a certain
amount is necessary, but it is only optimal within a range of 0.20-0.50 in (Aalhus et al., 2014).
The FAT in population one was within this range for all genotypes of ANPEP, but the AA
genotype was higher (8.52 0.17 in) than GG genotype (7.12 0.44 in) and the heterozygous

34
animals (7.58 0.20 in; Figure 3.3C). This further supports the A allele is associated with higher
fat production.
Figure 3.3 The ANPEPc.410G>A genotype effect on carcass traits in population one steers
(n=1000), A) Vision grade yield (YLD), B) Marbling score (MARB), C) Backfat thickness
(FAT; inch). Bars with differing superscripts are significantly different (P<0.05). Error bars
indicate the SEM.
The interaction of ANPEP and VA for REA (Table 3.3; Figure 3.4) is likely a type I error
(false positive) as only the GG animals on the high vitamin A diet (n=39 out of 1000) showed a
statistical difference. The main effect of VA on FAT resulted in higher FAT in the animals on
the high VA diet (0.32 ± 0.0095 inches) as compared to animals on the low VA diet (0.29 ±
0.0097 inches). Since limited VA is typically associated with higher fat content (Ward et al.,
2012; Krone et al., 2015), not high VA, this result was unexpected.
ab
c
1.5
1.7
1.9
2.1
2.3
2.5
2.7V
isio
n G
rad
e Yi
eld
ANPEPc.410G>A
AA
GA
GG
a
ab
b
340
350
360
370
380
390
400
410
Mar
blin
g Sc
ore
ANPEPc.410G>A
AA
GA
GG
ab
b
0.1
0.2
0.3
0.4
Bac
k Fa
t th
ickn
ess
(in
ch)
ANPEPc.410G>A
AA
GA
GG
A) B)
C)
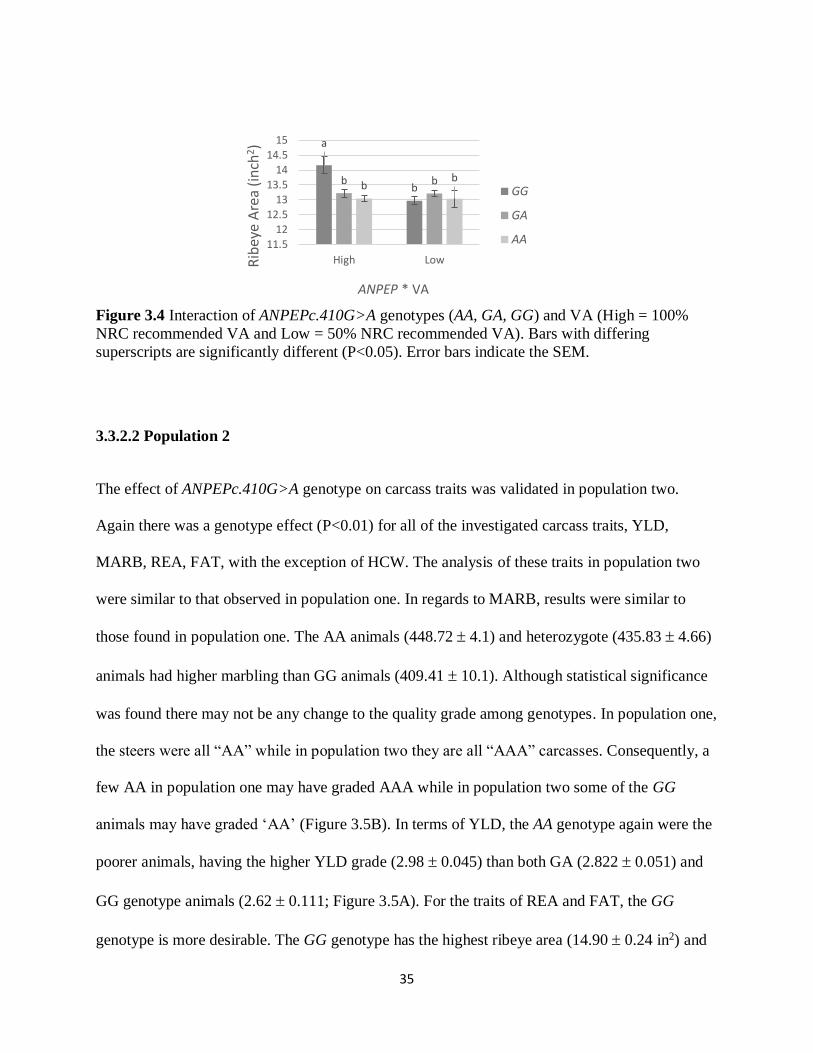
35
Figure 3.4 Interaction of ANPEPc.410G>A genotypes (AA, GA, GG) and VA (High = 100%
NRC recommended VA and Low = 50% NRC recommended VA). Bars with differing
superscripts are significantly different (P<0.05). Error bars indicate the SEM.
3.3.2.2 Population 2
The effect of ANPEPc.410G>A genotype on carcass traits was validated in population two.
Again there was a genotype effect (P<0.01) for all of the investigated carcass traits, YLD,
MARB, REA, FAT, with the exception of HCW. The analysis of these traits in population two
were similar to that observed in population one. In regards to MARB, results were similar to
those found in population one. The AA animals (448.72 4.1) and heterozygote (435.83 4.66)
animals had higher marbling than GG animals (409.41 10.1). Although statistical significance
was found there may not be any change to the quality grade among genotypes. In population one,
the steers were all “AA” while in population two they are all “AAA” carcasses. Consequently, a
few AA in population one may have graded AAA while in population two some of the GG
animals may have graded ‘AA’ (Figure 3.5B). In terms of YLD, the AA genotype again were the
poorer animals, having the higher YLD grade (2.98 0.045) than both GA (2.822 0.051) and
GG genotype animals (2.62 0.111; Figure 3.5A). For the traits of REA and FAT, the GG
genotype is more desirable. The GG genotype has the highest ribeye area (14.90 0.24 in2) and
a
bb bb
b
11.512
12.513
13.514
14.515
High LowRib
eye
Are
a (i
nch
2 )
ANPEP * VA
GG
GA
AA

36
the lowest amount of back fat (0.39 0.02 in) compared to AA genotype animals (14.22 0.91
in2 and 0.46 0.01 in, respectively) while GA genotype is the intermediate for these two carcass
traits (14.55 0.11 in2 and 0.43 0.01 in, respecitively; Figure 3.5C; D).
Figure 3.5 The ANPEPc.410G>A genotype effect on carcass traits in population two steers
(n=700) for the A) yield, B) marbling score, C) ribeye area, D) backfat. Bars with differing
superscripts are significantly different (P<0.05). Error bars indicate the SEM.
3.3.3 Haplotype sequencing confirmation
In order to confirm that the haplotypes found in the discovery population held the same linkage
disequilibrium, fourteen animals from population one were sequenced. Due to a lower quality
source DNA, primers were redesigned to amplify a smaller fragment. The shorter fragment only
contained eleven of the twelve SNPs in the haplotype, with ANPEPc.606+478G>A being
outside of the amplicon. There was still strong evidence that the haplotypes held. As shown in
ab
b
2.10
2.30
2.50
2.70
2.90
3.10
Yiel
d G
rad
e
ANPEPc.410G>A
AA
GA
GG
ab
b
350
370
390
410
430
450
470
Mar
blin
g Sc
ore
ANPEPc.410G>A
AA
GA
GG
aab
b
0.30
0.35
0.40
0.45
0.50
Bac
fFat
Th
ickn
ess
(in
)
ANPEPc.410G>A
AA
GA
GG
A) B)
b
ab
a
13.6
14
14.4
14.8
15.2
Rib
eye
area
(In
ch2)
ANPEPc.410G>A
AA
GA
GG
C) D)

37
Table 3.4 animals were either homozygous for the reference alleles, homozygous for the
alternate alleles, or heterozygous, giving only three options for the haplotype genotype. This
confirmed that by selecting one tag SNP for genotyping, in this case, ANPEPc.410G>A, we
could then accurately predict the genotype at the other positions of the haplotype.
Animal AN
PEP
c.57
T>C
AN
PEP
c.20
1A>G
AN
PEP
c.40
4T>C
AN
PEP
c.41
0G>A
*
AN
PEP
c.48
3C>G
AN
PEP
c.51
6G>A
AN
PEP
c.51
9T>C
AN
PEP
c.55
5C>T
AN
PEP
c.60
6+1
8A>C
AN
PEP
c.60
6+5
3T>
C
AN
PEP
c.60
6+1
23G
>A
1 CC GG CC AA GG AA CC TT CC CC AA
2 CC GG CC AA GG AA CC TT CC CC AA
3 CC GG CC AA GG AA CC TT CC CC AA
4 CC GG CC AA GG AA CC TT CC CC AA
5 CC GG CC AA GG AA CC TT CC CC AA
6 CC GG CC AA GG AA CC TT CC CC AA
7 TC AG TC GA CG GA TC CT AC TC GA
8 TC AG TC GA CG GA TC CT AC TC GA
9 TC AG TC GA CG GA TC CT AC TC GA
10 TC AG TC GA CG GA TC CT AC TC GA
11 TT AA TT GG CC GG TT CC AA TT GG
12 TT AA TT GG CC GG TT CC AA TT GG
13 TT AA TT GG CC GG TT CC AA TT GG
14 TT AA TT GG CC GG TT CC AA TT GG
Table 3.4 Confirmation of ANPEP haplotype. The haplotype was confirmed by sequencing 14
randomly selected animals in population 1. Pink = homozygous (reference alleles), Green =
heterozygous, Orange = homozygous (alternate alleles)
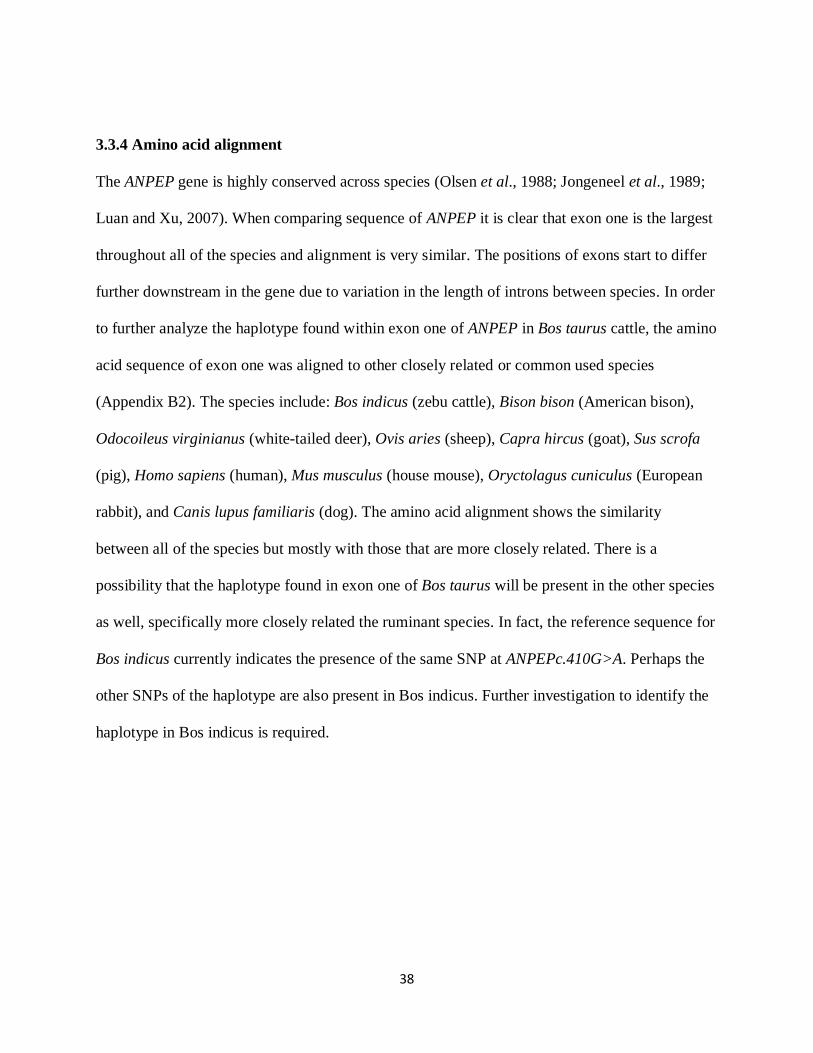
38
3.3.4 Amino acid alignment
The ANPEP gene is highly conserved across species (Olsen et al., 1988; Jongeneel et al., 1989;
Luan and Xu, 2007). When comparing sequence of ANPEP it is clear that exon one is the largest
throughout all of the species and alignment is very similar. The positions of exons start to differ
further downstream in the gene due to variation in the length of introns between species. In order
to further analyze the haplotype found within exon one of ANPEP in Bos taurus cattle, the amino
acid sequence of exon one was aligned to other closely related or common used species
(Appendix B2). The species include: Bos indicus (zebu cattle), Bison bison (American bison),
Odocoileus virginianus (white-tailed deer), Ovis aries (sheep), Capra hircus (goat), Sus scrofa
(pig), Homo sapiens (human), Mus musculus (house mouse), Oryctolagus cuniculus (European
rabbit), and Canis lupus familiaris (dog). The amino acid alignment shows the similarity
between all of the species but mostly with those that are more closely related. There is a
possibility that the haplotype found in exon one of Bos taurus will be present in the other species
as well, specifically more closely related the ruminant species. In fact, the reference sequence for
Bos indicus currently indicates the presence of the same SNP at ANPEPc.410G>A. Perhaps the
other SNPs of the haplotype are also present in Bos indicus. Further investigation to identify the
haplotype in Bos indicus is required.

39
4.0 GENERAL DISCUSSION
At this time it cannot be determined for certain how the ANPEP haplotype could be affecting
carcass traits. Since any true nutrigenetic interaction with VA and the haplotype genotypes is
unlikely, there must be a difference in the structural function of the ANPEP protein or the
mRNA transcript that would allow higher fat content in animals with the AA genotype at the SNP
(ANPEPc.410G>A), and therefore the alternate alleles at the other positions of the haplotype.
There are many phenomena that occur at the transcription and translation levels that can affect
expression. Polymorphisms of the haplotype could cause exon skipping during splicing of RNA
transcription splicing out the exon, such as in the cone opsin gene of humans (Ueyama et al.,
2012). Altered mRNA structure and codon bias could also affect the translation of ANPEP
(Shabalina et al., 2013; Zhou et al., 2009).
As described in the literature, ANPEP plays an important role as a membrane protein in
the intestinal wall (Maroux et al., 1973). Altered nutrient absorption in the gut could potentially
influence the carcass traits investigated. A role in nutrient absorption could also explain the
differences seen in the amino acid sequence of monogastric versus ruminant species (Appendix
B2). The activity of ANPEP as an enzyme cleaving amino acids (Chen et al., 2012) could also
potentially differentially affect metabolism. Additionally, ANPEP has been shown to have
associations with angiogenesis which is vital for growth as it brings blood flow to areas of
growth (Fukasawa et al., 2006). Since feedlot steers are youthful animals and undergo a large
amount of growth at the feedlot, an altered ANPEP and its role in angiogenesis affecting
adipogenesis (Sato, 2003; Cao, 2007; Guanghong et al., 2015) could contribute to differences
seen among genotypes for carcass traits.

40
5.0 CONCLUSION
The purpose of this study was to find a gene variant that could potentially be used in a marker-
assisted management program in a commercial feedlot. Specifically, gene variants that have a
nutrigenomic influence on carcass traits based on vitamin A inclusion level or are associated
with traits. Sequencing all of the candidate genes yielded ANPEP as the gene with the most
promising variant, or in this case, twelve variants found within a haplotype, that would most
likely have an effect on carcass traits. There were no interactions with ADH1C (previously
shown promise in experimental nutrigenomic based precision feeding trials) or more importantly
with the level of VA inclusion useful for a management program. The ANPEP genotypes did
effect carcass traits with the exception of hot carcass weight, and may have the potential to
impact the the marketing of cattle based on lean yield for the heterozygote animals. An
adjustment to the grid marketing system using an animal that can have high yields as well as
good marbling triats may benefit feedlot producers. The discovery of the haplotype in strong
linkage disequilibrium in exon one of ANPEP is extremely interesting and may be important
from an evolutionary perspective. Further investigation into the functional role of this region of
the ANPEP protein could provide insights into why it is inherited in this manner, as well as
studying how the haplotype may affect expression by altered transcription and translation.
41
6.0 REFERENCES
Aalhus JL, Lopez-Campos O, Prieto N, Rodas-Gonzalas A, Dugan MER, Uttaro B and
Juarez M. 2014. Review: Canadian beef grading – Opportunities to identify carcass and meat
quality traits valued by customers. Canadian Journal of Animal Science. 94: 545-556.
Arthur JR. 2001. The glutathione peroxidases. Cellular and Molecular Life Science. 57: 1825-
1835.
Aso H, Abe H, Nakajima I, Ozutsumi K, Yamaguchi T, Takamori Y, Kodama A, Hoshino
FB and Takano S. 1995. A Preadipocyte Clonal Line from Bovine Intramuscular Adipose
Tissue: Nonexpression of GLUT-4 Protein during Adipocyte Differentiation. Biochemical and
Biophysical Research Communications. 213(2): 369-375.
Azain MJ. 2004. Role of fatty acids in adipocyte growth and development. Journal of Animal
Science. 82: 916-924.
Bach LA. 2015. Insulin-like growth factor binding proteins 4-6. Best Practice Research Clinical
Endocrinology Metabolism. 29(5): 713-222.
Bar-El Dadon S and Reifen R. 2017. Vitamin A and the epigenome. Critical Reviews in Food
Science and Nutrition. 27(11): 2404-2411.
Barendse W. 2011. Haplotype analysis improved evidence for candidate genes for intramuscular
fat percentage from a genome wide association study of cattle. PLoS ONE 6(12): e2901
Bradshaw AD, Graves DC, Motamed K and Sage EH. 2003. SPARC-null mice exhibit
increased adiposity without differences in overall body weight. PNAS 100: 6045-6050.
Brasaemle DL, Barber T, Wolins NE, Serrero G, Blanchette-Mackie EJ, and Londos C.
1997. Adipose differentiation-related protein is an ubiquitously expressed lipid storage droplet-
associated protein. Journal of Lipid Research 38: 2249-2263.
Brites F, Martin M, Guillas I and Kontush A. 2017. Antioxidative activity of high-density
lipoprotein (HDL): Mechanistic insights into potential clinical benefit. BBA Clinical. 8:66-77.
Buchanan FC, Fitzsimmons CJ, Van Kessel AG, Thue TD, Winkelman-Sim DC and
Schmutz SM. 2002. Association of a missense mutation in the bovine leptin gene with carcass
fat content and leptin mRNA levels. Genetics Selection Evolution 34:105–116.
Buchanan FC, Thue TD, Yu P and Winkelman-Sim DC. 2005. Single nucleotide
polymorphisms in the corticotrophin-releasing hormone and pro-opiomelanocortin genes are
associated with growth and carcass yield in beef cattle. Animal Genetics 36: 127-131.
Canadian beef grading agency. http://beefgradingagency.ca/home.html
Canadian Cattlemen’s Association. http://www.beefgradingagency.ca/
Calafell F, Gringorenko EL, Chikanian AA, and Kid KK. 2001. Haplotype evolution and
linkage disequilibrium: A simulation study. Human Heredity 51: 85-96.

42
Chamary JV, Parmley JL and Hurst LD. 2006. Hearing silence: non-neutral evolution at
synonymous sites in mammals. Nature Reviews 7: 98-108.
Chen L, Lin Y, Peng G and Li F. 2012. Structural basis for multifunctional roles of mammalian
aminopeptidase N. PNAS 190: 17966-17971.
Cheong HS, Yoon DH, Bae JS, Kim LH, Kim EM, Kim JO, Hong J, Kim N and Shin HD.
2009. ADFP promoter polymorphism associated with marbling score in Korean cattle. BMB
Reports 42(8): 529-534.
Coa, Y. 2007. Angiogenesis modulates adipogenesis and obesity. The Journal of Clinical
Investigation 117: 2362–2368.
D’Ambrosio DN, Clugston RD and Blaner WS. 2011. Vitamin A metabolism: an update.
Nutrients. 3: 63-103.
De Smet S and Vossen E. 2016. Meat: The balance between nutrition and health. A review.
Journal of Meat Science. 120: 145-156.
Farhud DD, Yeganeh MZ and Yeganeh MZ. 2010. Nutrigenomics and Nutrigenetics. Iranian
Journal of Public Health 39(4): 1–14.
Fenech M, El-Sohmey A, Cahill L, Ferguson LR, French TC, Tai ES, Milner J, Koh W, Xie
L, Zucker M, Buckley M, Cosgrove L, Lockett T, Fung KYC and Head R. 2011.
Nutrigenetics and Nutrigenomics: Viewpoints on the current status and applications in nutrition
research and practice. Journal of Nutrigenetics and Nutrigenomics 4: 69-89.
Fukasawa K, Fujii H, Saitoh Y, Koizumi K, Aozuka Y, Sekine K, Yamada M, Saiki I and
Nishikawa K. 2006. Aminopeptidase N (APN/CD13) is selectively expressed in vascular
endothelial cells and plays multiple roles in angiogenesis. Cancer letters. 243(1): 135-143.
Gregoire FM, Smas CM and Sul HS. 1998. Understanding adipocyte differentiation.
Physiological Reviews 78: 782-809.
Gorocica-Buenfil MA, Fluharty FL, Bohn T, Schwartz SJ and Loerch SC. 2007. Effect of
low vitamin A diets with high-moisture or dry corn on marbling and adipose tissue fatty acid
composition of beef steers. Journal of Animal Science 85(12): 3355-66.
Guanghong J, Martinez-Lemus LA and Sowers JR. 2015. Interaction of Adipogenesis and
Angiogenesis in Dietary-Induced Obesity. Diabetes 64: 2326–2328.
Hong YH, Nishimura Y, Hishikawa D, Tsuzuki H, Miyahara H, Gotoh C, Choi KC, Feng
DD, Chen C, Lee HG, Katoh K, Roh SG and Sasaki S. 2005. Acetate and propionate short
chain fatty acids stimulate adipogenesis via GPCR43. Endocrinology 146(12): 5092-5099.
IARC working group. 2015. Red meat and processed meat/ IARC working group on the
evaluation of carcinogenic risk to humans. IARC monographs 114.
Jones SE and Jomary C. 2002. Clusterin. International Journal of Biochemical and Cell
43
Biology 34(5): 427-431.
Jongeneel CV, Bouvier J and Bairoch A. 1989. A unique signature identifies a family of zinc-
dependent metallopeptidases. FEBS Letters 242(2): 211-214.
Joseph C, Hunter MG, Sinclair KD and Robinson, RS. 2012. The expression, regulation, and
function of secreted protein, acidic, cysteine-rich in the follicle – luteal transition. Reproduction.
144:361-372.
Key CN, Perkins SD, Bratcher CL, Kreise-Anderson LA, and Brandebourg TD. 2013.
Grain feeding coordinately alters expression patterns of transcription factor and metabolic genes
in subcutaneous adipose tissue of crossbred heifers. Journal Animal Science 91: 2616-26127.
Killinger KM, Calkins CR, Umberger WJ, Feuz DM and Eskridge KM. 2004. Consumer
sensory acceptance and value for beef steaks of similar tenderness, but differing marbling level.
Journal of Animal Science 82: 3294–3301.
Kim YJ, Min TS, Seo KS, and Kim SH. 2015. Expression of pref-1/dlk-1 is regulated by
microRNA-143 in 3T3-L1 cells. Molecular Biology Reports 42: 617-624.
Kononoff PJ, Deobald HM, Stewart EL, Laycock AD and Marquess FLS. 2005. The effect
of a leptin single nucleotide polymorphism on quality grade, yield grade, and carcass weight of
beef cattle. Journal of Animal Science 83: 927–932.
Koressaar T and Remm M. 2007. Enhancements and modifications of primer design program
Primer3 Bioinformatics 23(10): 1289-1291.
Krone KG, Ward AK, Madder KM, Hendrick S, McKinnon JJ and Buchanan FC. 2015.
Interaction of vitamin A supplementation level with ADH1C genotype on intramuscular fat in
beef steers. Animal 10(3): 403-409.
Li E and Tso P. 2003. Vitamin A uptake from foods. Current Opinion in Lipidology 14: 241-
247.
Liu J, DeYoung SM, Zhang M, Zhang M, Cheng A and Saltiel AR. 2005. Changes in
integrin expression during adipocyte differentiation. Cell Metabolism 2: 165-177.
Liu SY, Zhang YY, Gao Y, Zhang LJ, Chen HY, Zhou Q, Chai QY, Jiang H, Yuan B, Dai
LS and Zhang JB. 2015. MiR-378 plays an important role in the differentiation of bovine
preadipocytes. Cell Physiology and Biochemistry 36: 1552-1562.
Luan Y and Xu W. 2007. The structure and Main functions of Aminopeptidase N. Current
Medicinal Chemistry 14: 639-647.
Madder, KM, McKinnon JJ, Torres, GW, Krone, KG, Duncombe, JL, Luby, CD and
Buchanan FC. 2018. Feedlot performance and immune function analysis of implanted and non-
44
implanted steers selected for alcohol dehydrogenase 1 C (ADH1C) genotype and fed a low
vitamin A diet. Animal 18: 1-9.
Maroux S, Louvard D and Baratti J. 1973. The aminopeptidase from hog intestinal brush
border. Biochimica et Biophysica Acta: 321: 282-295.
McGrane, MM. 2007. Vitamin A regulation of gene expression: molecular mechanism of a
prototype gene. Journal of Nutritional Biochemistry. 18: 497-508.
Mennecke BE, Townsend AM, Hayes DJ, and Lonergan SM. 2007. A study of the factors
that influence consumer attitudes towards beef products using the conjoint market analysis tool.
Journal of Animal Science 85: 2639-2659.
Mizoguchi Y, Hirano T, Itoh T, Aso H, Takasuga A, Sugimoto Y and Watanabe T. 2010.
Differentially expressed genes during bovine intramuscular adipocyte differentiation profiled by
serial analysis of gene expression. Animal Genetics 41(4): 436-41
Mizoguchi Y, Moriya M, Taniguchi D and Hasegawa A. 2014. Effects of retinoic acid on
gene expression profiles of bovine intramuscular preadipocytes during adipogenesis. Animal
Science Journal 85(2): 101-111.
Nei J and Sage EH. 2009. SPARC functions as an inhibitor of adipogenesis. J. Cell Commun.
Signal. 3: 247-254.
NRC. 1996. Nutrient requirements of beef cattle. 4th rev. ed. Natl. Acad. Pres., Washington DC.
Nuernberg K, Dannenberger D, Nuernberg G, Ender K, Voigt J, Scollan ND, Wood JD,
Nute GR, and Richardson RI. 2005. Effect of a grass-based and a concentrate feeding system
on meat quality characteristics and fatty acid composition of longissimus muscle in different
cattle breeds. Livestock Production Science 94:137-147.
Oberbach A, Blüher M, Wirth H, Till H, Kovacs P, Kullnick Y, Schlichting N, Tomm JM,
Rolle-Kampczyk U, Murugaiyan J, Binder H, Dietrich A and von Bergen M. 2011.
Combined Proteomic and Metabolomic Profiling of Serum Reveals Association of the
Complement System with Obesity and Identifies Novel Markers of Body Fat Mass Changes. J
Proteome Res 10(10): 4769-4788.
Olsen J, Cowell GM, Konigshofer E, Danielsen EM, Moller J, Lausten L, Hansen OC,
Welinder KG, Engberg J, Hunziker W, Spiess M, Sjostrom H and Noren O. 1988. Complete
amino acid sequence of human intestinal aminopeptidase N as deduced from cloned cDNA.
FEB. 238(2): 307-314.
Park S, Mathis KW, and Lee IK. 2014. The physiological roles of apolipoprotein J/clusterin in
metabolic and cardiovascular diseases. Reviews in Endocrine and Metabolic Disorders 15: 45-
53.

45
Pickworth CL, Loerch SC, Velleman SG, Pate JL, Poole DH and Fluharty FL. 2011.
Adipogenic differentiation state-specific gene expression as related to bovine adiposity. Journal
of Animal Science 89: 355-366.
Poon S, Treweek TM, Wilson MR, Easterbrook-Smith SB and Carver JA. 2002. Clusterin is
an extracellular chaperone that specifically interacts with slowly aggregating proteins on their
off-folding pathway. FEBS Letters 513(2-3): 259-266.
Pugh KA, Stookey JM, and Buchanan FC. 2011. An evaluation of corticotropin-releasing
hormone and leptin SNPs relative to cattle behaviour. Canadian Journal of Animal Science 91:
567-572.
Rangel R, Sun Y, Guzman-Rojas L, Ozawa MG, Sun J, Giordano RJ, Van Pelt CS, Tinkey
PT, Behringer RR, Sidman RL, Arap W and Pasqualini R. 2007. Impaired angiogenesis in
aminopeptidase N-null mice. PNAS 103: 4588-44593.
Rizzi F, Coletta M and Bettuzzi S. 2009. Clusterin (CLU): From One Gene and Two
Transcripts to Many Proteins. Advances in Cancer Research 104: 9-23.
Roh S, Hishikawa D, Hong Y and Sasaki S. 2006. Control of adipogenesis in ruminants.
Animal Science Journal 77: 472-477.
Rossenberg ME and Silkensen J. 1995. Clusterin: Physiologic and Pathologic Considerations.
The International Journal Biochemistry and Cell Biology. 27(7): 633-645.
Sato, Y. 2003. Aminopeptidase and Angiogenesis. Endothelium 10: 287–290.
Schmutz SM, Buchanan FC, Winkelman-Sim DC, Pawlyshyn V, Plante Y, McKinnon JJ
and Fournier BP. 2001. Development of the Canadian Beef Reference Herd for Gene Mapping
Studies. Theriogenology 55: 963-972.
Shabalina SA, Spiridonov NA and Kashina A. 2013. Sounds of silence: synonymous
nucleotides as a key to biological regulation and complexity. Nucleic Acid Research 42(1):
2073-2094.
Shaw CS, Sherlock M, Stewart PM and Wagenmakers AJM. 2009. Adipophilin distribution
and colocalization with lipid droplets in skeletal muscle. Histochemistry and Cell Biology 131:
575-581.
Slamkova M, Zorad S, and Krskova K. 2016. Alternative renin-angiotensin system in adipose
tissue and their role in the pathogenesis of obesity. Endocrine Regulations 50(4): 229-240.
Smith SB. 2016. Marbling and its nutritional impact on risk factors for cardiovascular disease.
Korean Journal for Food Science of Animal Resources 36(4): 435-444.
46
Sunagawa K, Weisinger RS, McKinley MJ, Purcell BS, Thomson C and Burns PL. 2001.
The role of angiotensin II in the central regulation of feed intake in sheep. Canadian Journal of
Animal Science 81: 216-221.
Tedford JL, Rodas-Gonzalez A, Garmyn AJ, Brooks JC, Johnson BJ, Starkey JD, Clark
GO, Derington AJ, Collins JA and Miller MF. 2014. U.S. consumer perceptions of U.S. and
Canadian beef quality grades. Journal of Animal Science 92: 3685-3692.
Thue TD and Buchanan FC. 2003. Linkage mapping of POMC to bovine chromosome 11.
Animal Genetics 34: 14-160.
Thue TD, Schmutz SM and Buchanan FC. 2001. A SNP in the cattle MC4R gene is used to
map MC4R to BTA 24. Animal Genetics 32: 390-393.
Troy DJ, Tiwari BK and Joo ST. 2016. Health implications of beef intramuscular fat
composition. Korean Journal for Food Science of Animal Resources 36(5): 577-582.
Ueyama H, Murki-Oda S, Yamade S, Tanabe S, Yamashita T, Shichida Y, and Ogita H.
2012. Unique haplotype in exon 3 of cone opsin mRNA affects splicing of its precursor, leading
to color vision defect. Biochemical and Biophysical Research Communications 424: 152-157.
Untergasser A, Cutcutache I, Koressaar T, Ye J, Faircloth BC, Remm M and Rozen SG.
2012. Primer3 - new capabilities and interfaces. Nucleic Acids Research 40(15): e115
Uray IP, Shen Q, Seo HS, Kim HT, Lamph WW, Bissonette RP and Brown PH. 2009.
Rexinoid-induced expression of IFGBP-6 requires RAR-dependent permissive cooperation of
retinoid receptors and AP-1. Journal of Biological Chemistry 248(1): 345-353.
Wall JD and Pritchard JK. 2003. Haplotype blocks and linkage disequilibrium in the human
genome. Nature Reviews. 4: 587-597.
Wang Y, Hudak C, and Sul HS. 2010. Role of preadipocyte factor 1 in adipocyte
differentiation. Journal of Clinical Lipidology 5(1): 109-115.
Wang B, Yang Q, Harris CL, Nelson ML, Busboom JR, Zhu M-J and Du M. 2016.
Nutrigenomic regulation of adipose tissue development — role of retinoic acid: A review.
Journal of Meat Science 120: 100-106.
Ward AK, McKinnon JJ, Hendrick S and Buchanan FC. 2012. The impact of vitamin A
restriction and ADH1C genotype on marbling in feedlot steers. Journal of Animal Science 90:
2476-2483.
Yamasaki T, Tahara K, Takano S, Inoue-Murayama M, Rose MT, Minashima T, Aso H
and Ito S. 2006. Mechanism of plasma glutathione peroxidase production in bovine adipocytes.
Cell Tissue Research. 326(1): 139-147.
Yan Q and Sage EH. 1999. SPARC, a matricellular glycoprotein with important biological
functions. J. Histochem. Cytochem. 47: 1495-1505.
Yugandhar VG and Clark MA. 2013. Angiotensin III: A physiological relevant peptide of
renin angiotensin system. Peptides 46: 26-32.

47
Zeng W, Lu YH, Lee J and Friedman JM. 2015. Reanalysis of parabiosis of obesity mutants
in the age of leptin. PNAS 112(29): 3874-3882.
Zhou T, Weems M, and Wilke CO. 2009. Translationally optimal codons associate with
structurally sensitive sites in proteins. Molecular Biology and Evolution 26(7): 1571-1580.

48
APPENDICIES
APPENDIX A
Table A: Primers used for amplification of genes sequenced in the discovery population
Target Forward Primer Reverse Primer Annealing
(◦C) Size (bp)
ANPEP
5' UTR & Exon 1 GAGCTCCCTCCCCATTCTC CCAAGGTGGCTTTCATTGTT 60 846
Exon 2 & 3 GTAAGGGGACAGGGATGAGG GACTCAGAGCTGGGGTTCAC 60 666
Exon 4 & 5 CCCCTCCCTATGACTCCAAG ATCCTGACTCCTCCCCAAAC 60 675
Exon 6 & 7 GGGGAGGAGTCAGGATGAAG CAGGAAATTCGAGAGCATCC 60 698
Exon 8 & 9 TCCCATGCTGGTCCTTAGAC GAGGAGCAGCCAGTAAGCAG 60 568
Exon 10 CCAGTGCTCCTCCACTACCT TGAGATGGGAACAATCCACA 59 590
Exon 11 AGAGTGGTGGGTGTCAGTCC TCAATGGGGGTAGATGTTGTC 60 498
Exon 12 & 13 GGCCACTGAGGTTCACAGAT TGGAGTTCCAGAGTTGGACA 60 845
Exon 14 TGAGCAAGGGAATGTGACTG CCCAACTTGCTCACCTTCTC 59 775
Exon 15 AGCACACGGGATCTTCGTT GTTCACAGGCCACATGGAG 60 715
Exon 16 & 17 AAAGCACCCAAAGGGTAGGT TCTGAGCCTCTGTGTCCTCA 59 809
Exon 18 CAGGAAAGGACGAAGGATGA GAGTCTGAACCCTGGACCAC 60 497
Exon 19 CTGCTCATGGCTCCTCTCTC TGGATACCCAGCTTCCTCTG 60 277
Exon 20 & 3'UTR ACACATAGGAGCCTGGTTGG AGTGAACATGGGCCAGAGAC 60 473
CLU
5' UTR & Exon 1 TCTTTTTAAAGTGCGCATTGG GGAACAGCTGAAGGAGATGC 60 500
Exon 2 GCTCCAGTGTTTGCTTTTCTG GAAATCTCACCCCTTGAAGC 59 600
Exon 3 GCAGGATGAAGATGGGAGGA CCTGAACTTGTGGGGTCTGA 59 794
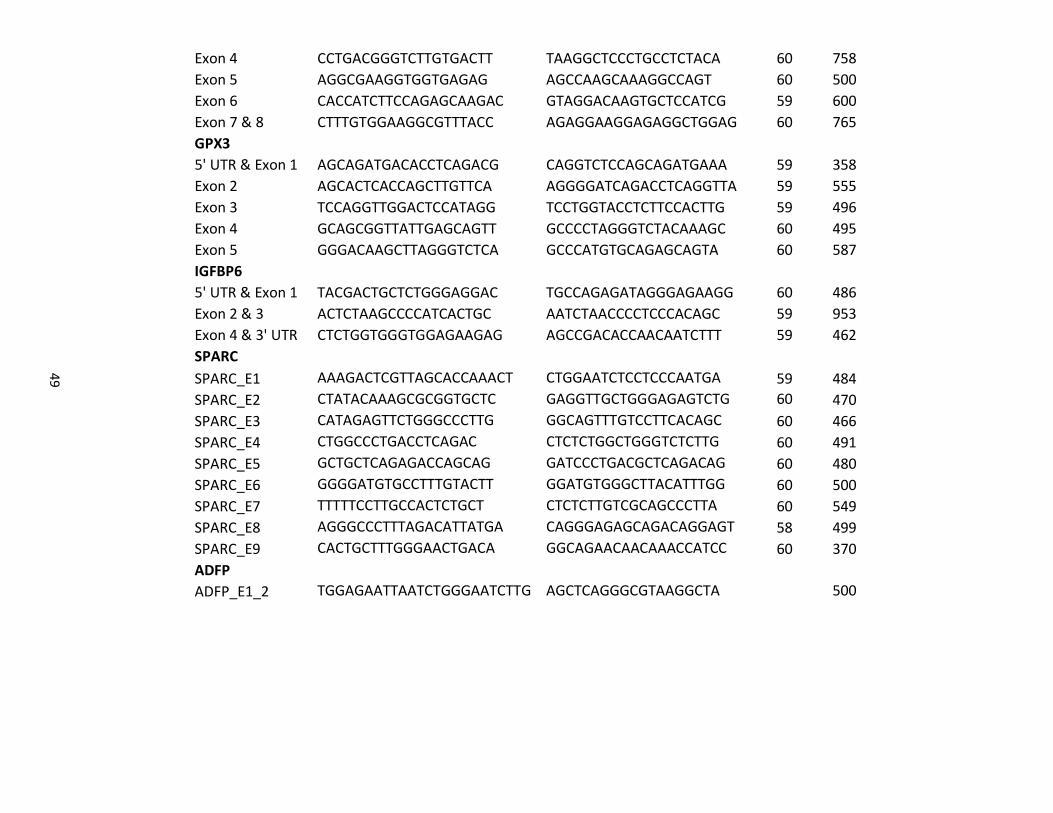
49
Exon 4 CCTGACGGGTCTTGTGACTT TAAGGCTCCCTGCCTCTACA 60 758
Exon 5 AGGCGAAGGTGGTGAGAG AGCCAAGCAAAGGCCAGT 60 500
Exon 6 CACCATCTTCCAGAGCAAGAC GTAGGACAAGTGCTCCATCG 59 600
Exon 7 & 8 CTTTGTGGAAGGCGTTTACC AGAGGAAGGAGAGGCTGGAG 60 765
GPX3
5' UTR & Exon 1 AGCAGATGACACCTCAGACG CAGGTCTCCAGCAGATGAAA 59 358
Exon 2 AGCACTCACCAGCTTGTTCA AGGGGATCAGACCTCAGGTTA 59 555
Exon 3 TCCAGGTTGGACTCCATAGG TCCTGGTACCTCTTCCACTTG 59 496
Exon 4 GCAGCGGTTATTGAGCAGTT GCCCCTAGGGTCTACAAAGC 60 495
Exon 5 GGGACAAGCTTAGGGTCTCA GCCCATGTGCAGAGCAGTA 60 587
IGFBP6
5' UTR & Exon 1 TACGACTGCTCTGGGAGGAC TGCCAGAGATAGGGAGAAGG 60 486
Exon 2 & 3 ACTCTAAGCCCCATCACTGC AATCTAACCCCTCCCACAGC 59 953
Exon 4 & 3' UTR CTCTGGTGGGTGGAGAAGAG AGCCGACACCAACAATCTTT 59 462
SPARC
SPARC_E1 AAAGACTCGTTAGCACCAAACT CTGGAATCTCCTCCCAATGA 59 484
SPARC_E2 CTATACAAAGCGCGGTGCTC GAGGTTGCTGGGAGAGTCTG 60 470
SPARC_E3 CATAGAGTTCTGGGCCCTTG GGCAGTTTGTCCTTCACAGC 60 466
SPARC_E4 CTGGCCCTGACCTCAGAC CTCTCTGGCTGGGTCTCTTG 60 491
SPARC_E5 GCTGCTCAGAGACCAGCAG GATCCCTGACGCTCAGACAG 60 480
SPARC_E6 GGGGATGTGCCTTTGTACTT GGATGTGGGCTTACATTTGG 60 500
SPARC_E7 TTTTTCCTTGCCACTCTGCT CTCTCTTGTCGCAGCCCTTA 60 549
SPARC_E8 AGGGCCCTTTAGACATTATGA CAGGGAGAGCAGACAGGAGT 58 499
SPARC_E9 CACTGCTTTGGGAACTGACA GGCAGAACAACAAACCATCC 60 370
ADFP
ADFP_E1_2 TGGAGAATTAATCTGGGAATCTTG AGCTCAGGGCGTAAGGCTA 500

50
ADFP_E3 TGGCAAGGATCTCTTTTCTGA CAAATAAGTACTGCCTGTTTGTGG 348
ADFP_E4 AAGGGCCAGATTCATCCTTT AAGGGCCAGATTCATCCTTT 500
ADFP_E5 GCAGATAGGAGCCATCTTGG TTGGCCCATTTTTCTACTGG 475
ADFP_E6 TGTAAGTATTGATGATGGCTGGTT AACAAGCAACGTGTGTATCCTG 375
ADFP_E7 TCCACATGTGTGGTGGACAT TTTTTCCAGCCAGGTAAGTAACA 686
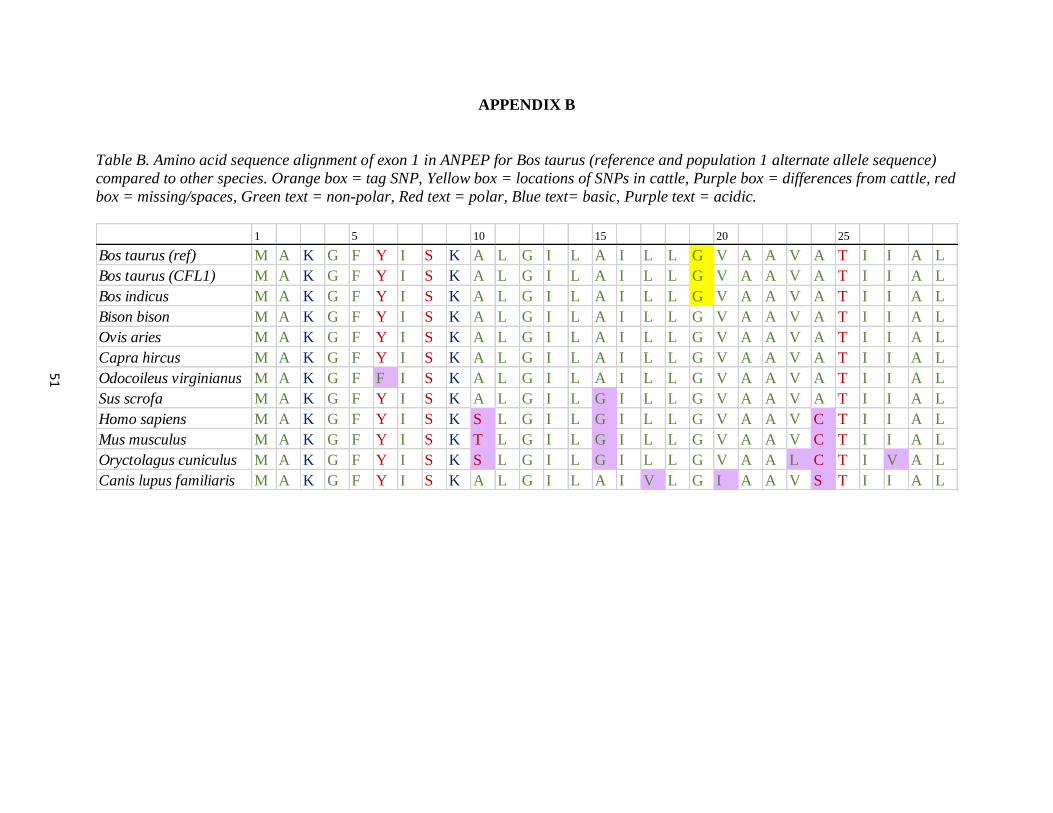
51
APPENDIX B
Table B. Amino acid sequence alignment of exon 1 in ANPEP for Bos taurus (reference and population 1 alternate allele sequence)
compared to other species. Orange box = tag SNP, Yellow box = locations of SNPs in cattle, Purple box = differences from cattle, red
box = missing/spaces, Green text = non-polar, Red text = polar, Blue text= basic, Purple text = acidic.
1 5 10 15 20 25
Bos taurus (ref) M A K G F Y I S K A L G I L A I L L G V A A V A T I I A L
Bos taurus (CFL1) M A K G F Y I S K A L G I L A I L L G V A A V A T I I A L
Bos indicus M A K G F Y I S K A L G I L A I L L G V A A V A T I I A L
Bison bison M A K G F Y I S K A L G I L A I L L G V A A V A T I I A L
Ovis aries M A K G F Y I S K A L G I L A I L L G V A A V A T I I A L
Capra hircus M A K G F Y I S K A L G I L A I L L G V A A V A T I I A L
Odocoileus virginianus M A K G F F I S K A L G I L A I L L G V A A V A T I I A L
Sus scrofa M A K G F Y I S K A L G I L G I L L G V A A V A T I I A L
Homo sapiens M A K G F Y I S K S L G I L G I L L G V A A V C T I I A L
Mus musculus M A K G F Y I S K T L G I L G I L L G V A A V C T I I A L
Oryctolagus cuniculus M A K G F Y I S K S L G I L G I L L G V A A L C T I V A L
Canis lupus familiaris M A K G F Y I S K A L G I L A I V L G I A A V S T I I A L

52
30 35 40 45 50 55
Bos taurus (ref) S V V Y A Q E K N K N A E R G T A A P T S P T
Bos taurus (CFL1) S V V Y A Q E K N K N A E R G T A A P T S P T
Bos indicus S V V Y A Q E K N K N A E R G T A A P T S P T
Bison bison S V V Y A Q E K N K N A E R G T A A P T S P T
Ovis aries S V V Y A Q E K N K S G P A S P P G P M S P T
Capra hircus S V V Y A Q E K N K N A E C G T S P T S P T S A T S P
Odocoileus virginianus S V V Y A Q E K N K N A E C G T A A P T S P T
Sus scrofa S V V Y A Q E K N K N A E H V P Q A P T S P T
Homo sapiens S V V Y S Q E K N K N A N S S P V A S T T P S A S A
Mus musculus S V V Y A Q E K N R N A E N S A T A P T L P G S T S A
Oryctolagus cuniculus S V V Y A Q E K N K N T S Q S P S M A P S N P T A T S
Canis lupus familiaris S V V Y A Q E K N K N A E S S P V S S P V S S P V S S P
60 65 70 75 80 85
Bos taurus (ref) G P T T T S A T T L D Q S K P W N R Y R L P T
Bos taurus (CFL1) G P T T T S A T T L D Q S K P W N R Y R L P T
Bos indicus G P T T T S A T T L D Q S K P W N R Y R L P T
Bison bison G P T T T S A T T L D Q S K P W N R Y R L P T
Ovis aries G P T S P T T T S A T T V D Q S K P W N R Y R L P T
Capra hircus T G P T S P T T T S A T T V D Q S K P W N R Y R L P T
Odocoileus virginianus G P T T T S A T T V D Q S K P W N R Y R L P T
Sus scrofa I T T T A A I T L D Q S K P W N R Y R L P T
Homo sapiens T T N P A S A T T L D Q S K A W N R Y R L P N
Mus musculus T T A T T T P A V D E S K P W N Q Y R L P K
Oryctolagus cuniculus S P A T T L D Q N L P W N R Y R L P K
Canis lupus familiaris V S P T N P S P T T A A T T L A Q S K P W N H Y R L P K

53
90 95 100 105 110 115
Bos taurus (ref) T L L P D S Y R V T L R P Y L T P N N N G L Y I F T G S S
Bos taurus (CFL1) T L L P D S Y R V T L R P Y L T P N N N G L Y I F T G S S
Bos indicus T L L P D S Y R V T L R P Y L T P N N N G L Y I F T G S S
Bison bison T L L P D S Y R V T L R P Y L T P N N N G L Y I F T G S S
Ovis aries T L L P D S Y R V T L R P Y L T L D K N G L Y I F T G S S
Capra hircus T L L P D S Y R V T L R P Y L T L D K N G L Y I F T G S S
Odocoileus virginianus T L L P D S Y R V T L R P Y L T P N E N G L Y I F T G S S
Sus scrofa T L L P D S Y N V T L R P Y L T P N A D G L Y I F K G K S
Homo sapiens T L K P D S Y R V T L R P Y L T P N D R G L Y V F K G S S
Mus musculus T L I P D S Y R V I L R P Y L T P N N Q G L Y I F Q G N S
Oryctolagus cuniculus T L I P D S Y N V V L R P Y L S P N S Q G L Y I F T G S S
Canis lupus familiaris T L I P S S Y N V T L R P Y L T P N S N G L Y T F K G S S
120 125 130 135 140 145
Bos taurus (ref) T V R F T C K E P T D V I I I H S K K L N Y T Q H S G H L
Bos taurus (CFL1) T V R F T C K E P T D V I I I H S K K L N Y T Q H S G H L
Bos indicus T V R F T C K E P T D V I I I H S K K L N Y T Q H S G H L
Bison bison T V R F T C K E P T D V I I I H S K K L N Y T Q H S G H L
Ovis aries T V R F A C K E S T D V I I I H S K K L N Y T T T N G H L
Capra hircus T V R F A C K E S T D V I I I H S K K L N Y T T T N G H L
Odocoileus virginianus A V R F T C K E S T D V I I I H S K K L N Y T S R D G H L
Sus scrofa I V R F I C Q E P T D V I I I H S K K L N Y T T Q G H M
Homo sapiens T V R F T C K E A T D V I I I H S K K L N Y T L S Q G H R
Mus musculus T V R F T C N Q T T D V I I I H S K K L N Y T L K G N H R
Oryctolagus cuniculus T V R F T C Q E A T N V I I I H S K K L N Y T I T Q G H P
Canis lupus familiaris T V R F T C K E S T S M I I I H S K K L N Y T N I Q G Q R
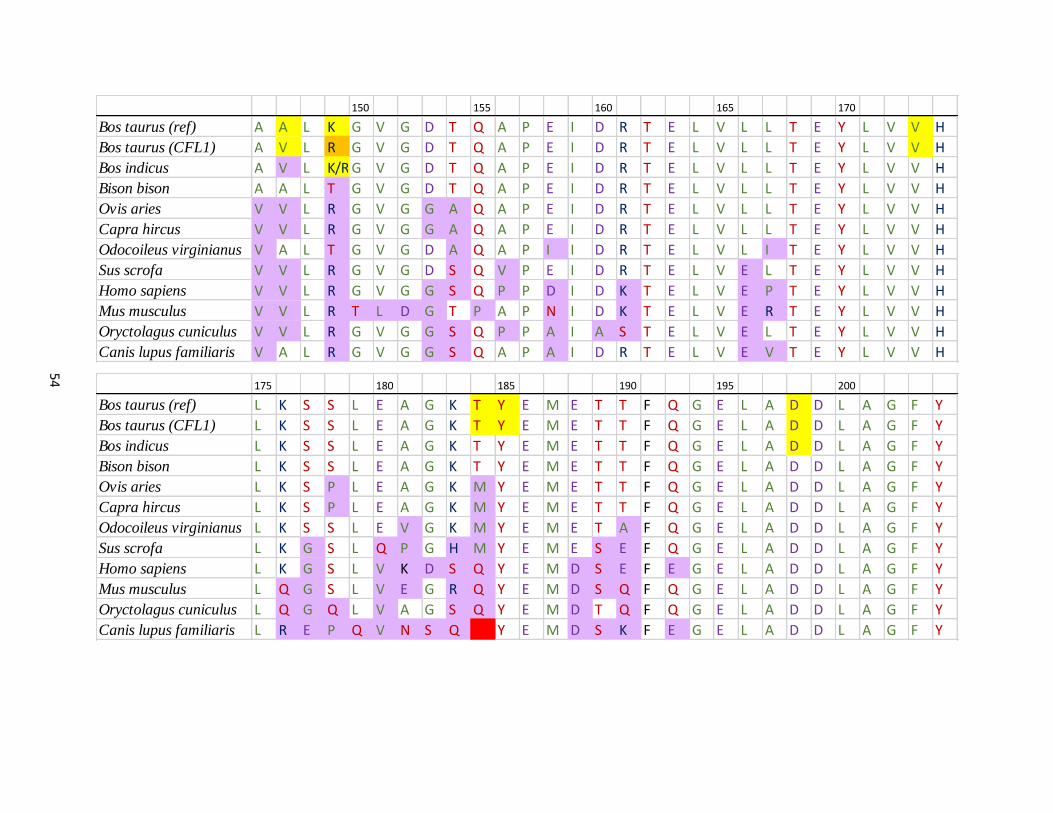
54
150 155 160 165 170
Bos taurus (ref) A A L K G V G D T Q A P E I D R T E L V L L T E Y L V V H
Bos taurus (CFL1) A V L R G V G D T Q A P E I D R T E L V L L T E Y L V V H
Bos indicus A V L K/R G V G D T Q A P E I D R T E L V L L T E Y L V V H
Bison bison A A L T G V G D T Q A P E I D R T E L V L L T E Y L V V H
Ovis aries V V L R G V G G A Q A P E I D R T E L V L L T E Y L V V H
Capra hircus V V L R G V G G A Q A P E I D R T E L V L L T E Y L V V H
Odocoileus virginianus V A L T G V G D A Q A P I I D R T E L V L I T E Y L V V H
Sus scrofa V V L R G V G D S Q V P E I D R T E L V E L T E Y L V V H
Homo sapiens V V L R G V G G S Q P P D I D K T E L V E P T E Y L V V H
Mus musculus V V L R T L D G T P A P N I D K T E L V E R T E Y L V V H
Oryctolagus cuniculus V V L R G V G G S Q P P A I A S T E L V E L T E Y L V V H
Canis lupus familiaris V A L R G V G G S Q A P A I D R T E L V E V T E Y L V V H
175 180 185 190 195 200
Bos taurus (ref) L K S S L E A G K T Y E M E T T F Q G E L A D D L A G F Y
Bos taurus (CFL1) L K S S L E A G K T Y E M E T T F Q G E L A D D L A G F Y
Bos indicus L K S S L E A G K T Y E M E T T F Q G E L A D D L A G F Y
Bison bison L K S S L E A G K T Y E M E T T F Q G E L A D D L A G F Y
Ovis aries L K S P L E A G K M Y E M E T T F Q G E L A D D L A G F Y
Capra hircus L K S P L E A G K M Y E M E T T F Q G E L A D D L A G F Y
Odocoileus virginianus L K S S L E V G K M Y E M E T A F Q G E L A D D L A G F Y
Sus scrofa L K G S L Q P G H M Y E M E S E F Q G E L A D D L A G F Y
Homo sapiens L K G S L V K D S Q Y E M D S E F E G E L A D D L A G F Y
Mus musculus L Q G S L V E G R Q Y E M D S Q F Q G E L A D D L A G F Y
Oryctolagus cuniculus L Q G Q L V A G S Q Y E M D T Q F Q G E L A D D L A G F Y
Canis lupus familiaris L R E P Q V N S Q Y E M D S K F E G E L A D D L A G F Y

55
205 210 215
Bos taurus (ref) R S E Y M D G N V K K
Bos taurus (CFL1) R S E Y M D G N V K K
Bos indicus R S E Y M D G N V K K
Bison bison R S E Y M D G N V K K
Ovis aries R S E Y M D G N V K K
Capra hircus R S E Y M D G N V K K
Odocoileus virginianus R S E Y M D G N V K K
Sus scrofa R S E Y M E G N V K K
Homo sapiens R S E Y M E G N V R K
Mus musculus R S E Y M E G D V K K
Oryctolagus cuniculus R S E Y M E G N V R K
Canis lupus familiaris R S E Y T E N G V K K

56
APPENDIX C