a numerical analysis on the arrangement of reinforcements ... · and geostudio slope/w, and as...
TRANSCRIPT

A numerical analysis on the arrangement of reinforcements in mechanically stabilized earth wall considering various wall heights
*Christine P. Langcuyan1, Tae-Woong Park2, Sung-Gil Moon3 and MyoungSoo Won4
1), 2), 3), 4)
Department of Civil Engineering, Kunsan National University, Gunsan, Korea 1)
and 4)
ABSTRACT
This paper studied the two-dimensional (2D) and three-dimensional (3D) numerical analyses of continuous and discrete geogrid reinforcements of mechanically stabilized earth (MSE) wall considering various wall heights. Both cases are designed having equal quantity of materials, similar wall conditions and material parameters, but with different vertical spacing. The MSE walls are modeled and analyzed numerically in Plaxis 3D and GeoStudio (2D) in phase-by-phase construction method having wall heights of 4m, 6m, 8m and 10m. Since discrete reinforcements have 3D geometry condition, modification on the reinforcement parameters were made in GeoStudio. Consequently, the results from Plaxis 3D and GeoStudio programs displayed similar patterns. The results showed that MSE wall with discrete reinforcements with shorter vertical spacing exhibited lesser deformations at the wall facing and higher stability level compared to MSE wall with continuous reinforcements and doubled vertical spacing. Therefore in this viewpoint, MSE wall with discrete reinforcements having shorter vertical spacing can better sustain wall facing horizontal displacements and more stable compared with MSE wall with continuous reinforcements having doubled vertical spacing considering both cases having equal quantity of materials used. 1. INTRODUCTION Over decades, the study of MSE wall continues in pursuit of innovative designs that could compete with the modern world’s demand for stronger, cheaper, faster and aesthetic design of retaining walls. A study showed that among the retaining wall designs, MSE wall reinforced with geosynthetics are the cheapest and extremely adaptable to extensive conditions (Koerner and Soong, 2001). Scrutinizing the various
1 Graduate Student
2 Graduate Student
3 Graduate Student
4 Associate Professor

designs of MSE wall reinforced with geosynthetics to come up with the most economical design is a tremendous task. Hence, moving a single step forward, this study came up with a simple comparison between continuous and discrete geogrid reinforcements having equal quantity of materials but with different spacing. In order to have a better view on the influence of reinforcement arrangements on MSE walls, various wall heights were considered. Since continuous reinforcements have 2D geometry conditions while discrete reinforcements have 3D geometry conditions, this study considered analyzing the MSE walls in 3D model using Plaxis 3D 2013 program and in 2D model using GeoStudio 2012 Sigma/W and Slope/W in staged construction. Numerical analysis is a break-through in technology which could provide fast and reliable predictions on the model’s deformations and stability. Hence, this study will focus on the horizontal deformation of the wall and its stability. 2. NUMERICAL MODELING 2.1 Construction of the Model The typical model of MSE wall in 3D is shown in Fig.1. The main components of the wall system are the backfill soil, reinforcements and facing elements. The MSE wall is modeled according to specifications stipulated from Plaxis 3D Manuals (2013), GeoStudio Manuals (2015) and FHWA NHI-10-024 (2009). The model is simulated in phase-by-phase construction and analyzed for plastic and safety calculations in Plaxis 3D, load-deformation in Sigma/W and Morgenstern-Price in Slope/W.
Fig. 1 Numerical Model of MSE Wall in 3D
The MSE wall is assumed to be built on a bedrock foundation in order to eliminate the influence of foundation settlement on the behavior of the MSE wall. Retained backfill and reinforced backfill soil are assumed to be made of same soil materials for simplicity of the analysis. The MSE wall facing is designed as precast concrete panels

and simplified into square form in staggered arrangement. A surcharge load of 13 kPa is assumed to be applied uniformly on top of the reinforced backfill. The reinforcements are arrangements as shown in the figure whose length is 0.75 times the height of the wall. The models are designed having different heights of 4m, 6m, 8m, and 10m. The reinforcement lengths and quantities varied depending on the wall height.
Table 1 Numerical Modeling Schedule Wall
Height
Numerical Analysis Program Arrangement of the Reinforcements
Plaxis 3D GeoStudio
4m
Case 1-A Case 1-B
6m
8m
10m
a. Continuous Reinforcements
4m
Case 2-A Case 2-B
6m
8m
10m
b. Discrete Reinforcements
As shown in Table 1, there will be two cases of reinforcement arrangement considered in this study. Case 1 refers to MSE wall with continuous or sheet geogrid reinforcements spaced at 0.75m. Case 2 refers to MSE wall with discrete and staggered geogrid reinforcements spaced at 0.375m vertically and 2.0m horizontally. Spacing in case 2 is designed in such a way that both cases will have equal quantity of geogrid reinforcements used in a particular wall. For simplicity, material properties and wall conditions of the models are the same for both cases.

2.2 Material Properties and Specifications Properties of the soil materials are tabulated in Table 2. The backfill is a granular soil modeled under Mohr-Coulomb with drained property condition. Its parameters are in effective unit measure. The foundation is modeled as jointed rock or bedrock with non-porous drainage property. Interface between reinforcements and soil were considered as rigid. Boundary conditions are considered under stress/strain category. The models are assigned to have free surface displacements along x-direction and y-direction at wall facing only. Table 2 Soil Material Properties and Specifications
Parameters Backfill Foundation
Material Category Effective-Drained Total Stress
Drainage Condition Drained Non-Porous
Material Model
Plaxis 3D Mohr-Coulomb Jointed Rock
GeoStudio Sigma/W Elastic-Plastic (Effective) Elastic-Plastic (Total)
GeoStudio Slope/W Mohr-Coulomb Bedrock
Unit Weight, 𝛾 20 kN/m³ 25 kN/m³
Young’s Modulus, E 10x103 kPa 60x106 kPa
Poisson’s Ratio, ν 0.40 0.30
Cohesion, c 10 kPa 500 kPa
Angle of Friction, ∅ 30° 40°
The wall facing is modeled as plate element in Plaxis 3D and as structural beam element in GeoStudio. It is designed with thickness of 14mm and square dimension of 1.50mH x 1.50mW (Table 3). Table 3 Precast Concrete Panel-type Wall Facing Properties and Specifications
Parameters Values
Material Model (Plaxis 3D/ GeoStudio) Plates/ Structural Beam
Thickness, t 0.14 m
Width, w 1.50 m
Height, h 1.50 m
Unit Weight, 𝛾 24 kN/m³
Cross-sectional area, A 0.14 m²
Elastic Modulus, E 30x106 kPa
Moment of Inertia, I 22.867x10⁻⁵ m4
Poisson’s Ratio, ν 0.15
The beam element is defined as linear elastic model and can resist forces in tension and compression. Moreover, since structural beams are only used in a plane strain analysis, the cross-sectional area and moment of inertia of the wall facing is specified in terms of unit thickness. Thus, the cross-sectional area, A, is computed as 0.14m2 and moment of inertia, I, is computed to 22.867x10⁻⁵ m4 per unit width of the

wall facing. The design is considered to have a firm or rigid joint connections between the reinforcements and the wall panels. The reinforcements are modeled as geogrid/geosynthetics elements for Plaxis 3D and GeoStudio Slope/W, and as structural bar element in GeoStudio Sigma/W (Table 4). The structural bar element is defined as linear elastic model and can resist force in tension only. Moreover, bar elements are only used in a plane strain analysis, hence, the cross-sectional area of the wall will be specified in terms of unit thickness. The length of the reinforcements are uniform in all layers equal to 0.75H. Since the height of the wall varies with 2.0m interval, the length of the reinforcement also varies accordingly with 1.50m difference. For continuous reinforcements, width of the reinforcement is equal to the full width of the modeled wall. However, the discrete reinforcement is fixed 1.0m width with 2.0m horizontal spacing all throughout the width of the wall model. Both reinforcements have 1.45mm thickness and normal stiffness of 1360 kN/m considering biaxial geogrid material. The vertical spacing of the discrete reinforcement is half with that of the continuous reinforcement. It is arranged in such a way that both models will have equal quantity of geogrid used in every particular wall height. The quantities are tabulated below. Table 4 Reinforcement Material Properties and Specifications
Parameters Case 1
Continuous/Sheet Case 2
Discrete/Staggered
Material Model
Plaxis 3D Geogrid Geogrid
GeoStudio Sigma/W Structural Bar Structural Bar
GeoStudio Slope/W Geosynthetics Geosynthetics
Length, L at H=4m/ 6m/ 8m/ 10m 3m/ 4.5m/ 6m/ 7.5m 3m/ 4.5m/ 6m/ 7.5m
Width, W at H=4m/ 6m/ 8m/ 10m 12m/ 18m/ 24m/ 30m 1 m
Thickness, t 1.45 mm 1.45 mm
Vertical Spacing, Sv 0.750 m 0.375 m
Horizontal Spacing, Sh 0 2.00 m
Normal Stiffness, EA 1360 kN/m 1360 kN/m
Tensile Capacity (computed), T 45.95 kN 22.975 kN
Cross-Sectional Area, A 0.00145 m2 0.000725 m2
Total Quantity Used
At wall height = 4m 180 m² 180 m²
At wall height = 6m 648 m² 648 m²
At wall height = 8m 1584 m² 1584 m²
At wall height = 10m 2925 m² 2925 m²
The MSE wall with continuous reinforcements can easily be modeled in both 3D and 2D conditions. However, MSE wall with discrete reinforcements need to be modified in order to transform from 3D geometry condition into its corresponding 2D geometry condition. Hence, a reduction factor is applied on the tensile capacity (T) and cross-sectional area (A) of the reinforcement. To modify, a coverage ratio, Rc, shall be applied on the parameters as expressed as Rc=b/Sh (FHWA NHI-10-024, 2009), where
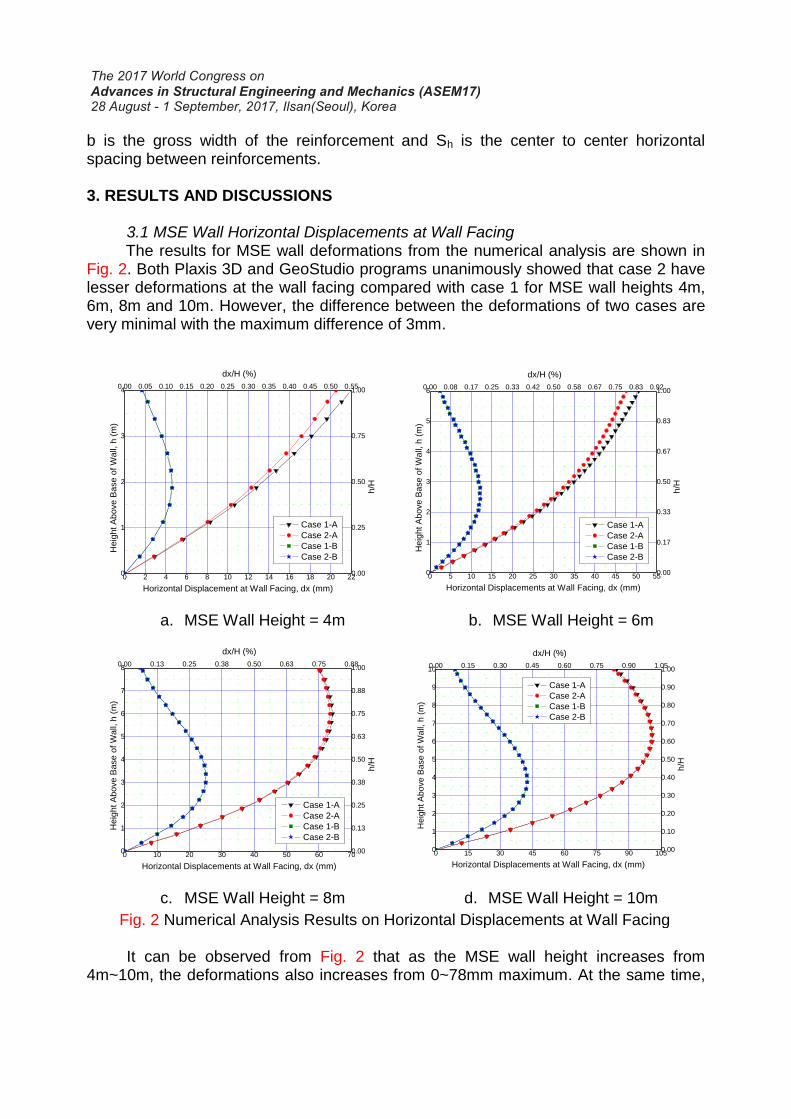
b is the gross width of the reinforcement and Sh is the center to center horizontal spacing between reinforcements. 3. RESULTS AND DISCUSSIONS 3.1 MSE Wall Horizontal Displacements at Wall Facing The results for MSE wall deformations from the numerical analysis are shown in Fig. 2. Both Plaxis 3D and GeoStudio programs unanimously showed that case 2 have lesser deformations at the wall facing compared with case 1 for MSE wall heights 4m, 6m, 8m and 10m. However, the difference between the deformations of two cases are very minimal with the maximum difference of 3mm.
0
1
2
3
4
0 2 4 6 8 10 12 14 16 18 20 220.00
0.25
0.50
0.75
1.000.00 0.05 0.10 0.15 0.20 0.25 0.30 0.35 0.40 0.45 0.50 0.55
h/H
dx/H (%)
Horizontal Displacement at Wall Facing, dx (mm)
He
igh
t A
bo
ve
Ba
se
of W
all,
h (
m)
Case 1-A
Case 2-A
Case 1-B
Case 2-B
0
1
2
3
4
5
6
0 5 10 15 20 25 30 35 40 45 50 550.00
0.17
0.33
0.50
0.67
0.83
1.000.00 0.08 0.17 0.25 0.33 0.42 0.50 0.58 0.67 0.75 0.83 0.92
h/H
dx/H (%)
Horizontal Displacements at Wall Facing, dx (mm)
He
igh
t A
bo
ve
Ba
se
of W
all,
h (
m)
Case 1-A
Case 2-A
Case 1-B
Case 2-B
a. MSE Wall Height = 4m b. MSE Wall Height = 6m
0
1
2
3
4
5
6
7
8
0 10 20 30 40 50 60 700.00
0.13
0.25
0.38
0.50
0.63
0.75
0.88
1.000.00 0.13 0.25 0.38 0.50 0.63 0.75 0.88
h/H
Horizontal Displacements at Wall Facing, dx (mm)
dx/H (%)
He
igh
t A
bo
ve
Ba
se
of W
all,
h (
m)
Case 1-A
Case 2-A
Case 1-B
Case 2-B
0
1
2
3
4
5
6
7
8
9
10
0 15 30 45 60 75 90 1050.00
0.10
0.20
0.30
0.40
0.50
0.60
0.70
0.80
0.90
1.000.00 0.15 0.30 0.45 0.60 0.75 0.90 1.05
h/H
dx/H (%)
Horizontal Displacements at Wall Facing, dx (mm)
He
igh
t A
bo
ve
Ba
se
of W
all,
h (
m)
Case 1-A
Case 2-A
Case 1-B
Case 2-B
c. MSE Wall Height = 8m d. MSE Wall Height = 10m
Fig. 2 Numerical Analysis Results on Horizontal Displacements at Wall Facing It can be observed from Fig. 2 that as the MSE wall height increases from 4m~10m, the deformations also increases from 0~78mm maximum. At the same time,

as the wall height increases from 4m~10m, the difference in deformations between the two cases also decreases and approaches to zero. The deformation pattern between the two cases are similar, however, the deformation pattern between the two programs are different. Plaxis 3D exhibited larger results compared with GeoStudio Sigma/W with the difference of 0~75mm maximum. For Plaxis 3D, deformations are great between 0.50~1.00 ratio of the wall height. While for GeoStudio, deformation are great between 0.30~0.50 ratio of the wall height. Since the soil foundation is bedrock, there is zero deformation at the base of the wall. 3.2 MSE Wall Factor of Safety The results from GeoStudio Slope/W and Plaxis 3D showed that the stability between case 1 and case 2 is more or less similar with few exceptions. Plaxis 3D stability analysis results gave larger values of safety factor, around 2.7~3.0, compared with GeoStudio Slope/W. As shown in Fig. 3, the safety factor of the MSE wall decreases when the wall height increases from 4m~10m.
1 2 3 4 5 6 7 81.4
1.6
1.8
2.0
2.2
2.4
1.555
1.610
1.867
1.773
2.1312.138
2.2982.310Model Case Number
and Definition
1 - Case 1 at 4mH
2 - Case 2 at 4mH
3 - Case 1 at 6mH
4 - Case 2 at 6mH
5 - Case 1 at 8mH
6 - Case 2 at 8mH
7 - Case 1 at 10mH
8 - Case 2 at 10mH
Model Case Number
Fa
cto
r o
f S
afe
ty
Fig. 3 GeoStudio Slope/W Results on Factor of Safety
3.2 MSE Wall Plastic Points Extracting the failure points and tension cut-off points in Plaxis 3D, Fig. 4 showed the results for the MSE wall plastic points. It can be observed that the failure points are concentrated at the bottom part of the wall. The mass of failure points became larger as the MSE wall height increases from 4m~10m. As the wall height increases, the failure points swollen forming a slope approximately 45° from the facing element. At wall height of 8m, tension-cut-off points are visible along the end of the top-layer reinforcements. Eventually, at wall height of 10m, the failure points are visible along the

end of the top-layer reinforcement. Nevertheless, both cases exhibited similar plastic points on a certain height of MSE wall.
a. Case 1 at 4m Height b. Case 2 at 4m Height
c. Case 1 at 6m Height d. Case 2 at 6m Height
e. Case 1 at 8m Height f. Case 2 at 8m Height
g. Case 1 at 10m Height h. Case 2 at 10m Height
Fig. 4 Plaxis 3D Results on MSE Wall Plastic Points

4. CONCLUSIONS This paper studied the 2D and 3D numerical analysis between continuous and discrete geogrid reinforcements of MSE wall. Both cases are designed with wall heights of 4m, 6m, 8m and 10m above a bedrock foundation. The MSE wall are modeled and numerically analyzed in Plaxis 3D 2013 and GeoStudio 2012 (Sigma/W and Slope/W). The numerical simulation results revealed the following statements:
MSE wall having discrete reinforcements exhibited lesser deformations compared with MSE wall having continuous reinforcements. However, the differences between the two cases are very minimal and are approaching to zero as the height of the wall increases up to 10m.
For MSE walls with continuous and discrete geogrid reinforcements having equal quantity of materials used, vertical spacing have significant effects on wall facing displacements. Therefore, shorter vertical spacing can better sustain wall deformations.
The MSE wall horizontal deformations at the wall facing increased by 0~78mm maximum as the height of the MSE wall increased from 4m to 10m.
MSE wall stability level decreased by 0.10~0.74 as the height of the wall increased from 4m to 10m.
The mass of plastic points magnified as the height of the MSE wall increased. The concentration of the failure points are visible at the bottom part of the MSE wall and expands approaching towards the end of the top-layer reinforcements developing approximately 45° slope from the wall facing.
Plaxis 3D exhibited larger results on horizontal deformations and safety factors compared with GeoStudio. However, both programs displayed similar pattern for both cases of reinforcement arrangements.
Therefore in this viewpoint, MSE wall with discrete reinforcements having shorter vertical spacing can better sustain wall facing horizontal displacements and more stable compared with MSE wall with continuous reinforcements having doubled vertical spacing and with equal quantity of materials used.
ACKNOWLEDGEMENTS This research was supported by Education & Human Resource Program through the National Research Foundation of Korea (NRF) funded by the Ministry of Education (BK21Plus). REFERENCES Koerner, R. M., and Soong, T-Y. (2001), “Geosynthetic Reinforced Segmental
Retaining Walls”, Journal of Geotextiles and Geomembranes, vol.19, no.6, pp. 359-386.
Federal Highway Administration (FHWA), Berg. R.R., Christopher, B.R., Samtani, N.C., (2009). Design and Construction of Mechanically Stabilized Earth Walls and Reinforced Soil Slopes – Volume I. FHWA-NHI-10-024, FHWA GEC 011-Vol I.

Plaxis 3D Manuals (2013). Plaxis Company (Plaxis bv), Netherlands. www.plaxis.nl. Stability modeling with SLOPE/W -an engineering methodology. June 2015 Edition.
GEO-SLOPE International Ltd. Canada. www.geo-slope.com. Stability of mechanically stabilized earth wall. GEO-SLOPE International Ltd. Canada.
www.geo-slope.com.