a novel phantom technique for evaluating the performance ... · the performance of pet...
TRANSCRIPT
Berthon et al. EJNMMI Physics (2015) 2:13 DOI 10.1186/s40658-015-0116-1
Open Access
A novel phantom technique for evaluatingthe performance of PET auto-segmentationmethods in delineating heterogeneous andirregular lesions
B Berthon1*, C Marshall1, R Holmes2 and E Spezi3* Correspondence: [email protected] Research and DiagnosticPositron Emission TomographyImaging Centre, Cardiff University -PETIC, room GF705 Ground floor ‘C’Block, Heath Park, CF14 4XN Cardiff,UKFull list of author information isavailable at the end of the article
©co
Abstract
Background: Positron Emission Tomography (PET)-based automatic segmentation(PET-AS) methods can improve tumour delineation for radiotherapy treatmentplanning, particularly for Head and Neck (H&N) cancer. Thorough validation ofPET-AS on relevant data is currently needed. Printed subresolution sandwich (SS)phantoms allow modelling heterogeneous and irregular tracer uptake, whileproviding reference uptake data. This work aimed to demonstrate the usefulness ofthe printed SS phantom technique in recreating complex realistic H&N radiotraceruptake for evaluating several PET-AS methods.
Methods: Ten SS phantoms were built from printouts representing 2mm-spaced slicesof modelled H&N uptake, printed using black ink mixed with 18F-fluorodeoxyglucose,and stacked between 2mm thick plastic sheets. Spherical lesions were modelled for twocontrasted uptake levels, and irregular and spheroidal tumours were modelled forhomogeneous, and heterogeneous uptake including necrotic patterns. The PET scansacquired were segmented with ten custom PET-AS methods: adaptive iterativethresholding (AT), region growing, clustering applied to 2 to 8 clusters, and watershedtransform-based segmentation. The difference between the resulting contours and theground truth from the image template was evaluated using the Dice SimilarityCoefficient (DSC), Sensitivity and Positive Predictive value.
Results: Realistic H&N images were obtained within 90 min of preparation. Thesensitivity of binary PET-AS and clustering using small numbers of clusters dropped forhighly heterogeneous spheres. The accuracy of PET-AS methods dropped between 4%and 68% for irregular lesions compared to spheres of the same volume. For eachgeometry and uptake modelled with the SS phantoms, we report the number ofclusters resulting in optimal segmentation. Radioisotope distributions representingnecrotic uptakes proved most challenging for most methods. Two PET-AS methods didnot include the necrotic region in the segmented volume.(Continued on next page)
2015 Berthon et al. This is an Open Access article distributed under the terms of the Creative Commons Attribution License (http://reativecommons.org/licenses/by/4.0), which permits unrestricted use, distribution, and reproduction in any medium, provided theriginal work is properly credited.
Berthon et al. EJNMMI Physics (2015) 2:13 Page 2 of 17
(Continued from previous page)
Conclusions: Printed SS phantoms allowed identifying advantages and drawbacks ofthe different methods, determining the most robust PET-AS for the segmentation ofheterogeneities and complex geometries, and quantifying differences across methods inthe delineation of necrotic lesions. The printed SS phantom technique provides keyadvantages in the development and evaluation of PET segmentation methods and hasa future in the field of radioisotope imaging.
Keywords: Positron emission tomography; 18F-fluorodeoxyglucose; Imaging phantoms;Image segmentation; Inkjet printing; Radiotherapy
BackgroundPositron emission tomography (PET) imaging using 18F-fluorodeoxyglucose (18F-FDG)
allows the observation of metabolic pathways in the human body and is therefore increas-
ingly used for gross tumour volume (GTV) delineation for a number of cancers, including
head and neck (H&N). The use of PET-based automatic segmentation (PET-AS) methods
could be useful in radiotherapy treatment planning and in the prediction of response to
therapy, for which accurate segmentation of the tumours is crucial. Some studies have
shown that PET-AS methods which perform well with homogeneous lesions show poor
accuracy in the case of more realistic inhomogeneous and irregular clinical lesions, using
clinical or simulated data [1, 2], in particular when using fixed thresholding methods,
which are highly dependent on the image type [3]. The use of advanced PET-AS beyond
thresholding was recommended to reduce dosimetry errors, especially in the case of het-
erogeneous tumours [4]. Although an increasingly large number of studies have investi-
gated and compared the performance of existing PET segmentation methods, the target
objects used are most frequently obtained with plastic fillable phantoms, including inserts
of spherical geometry [5, 6]. Plastic phantoms combine the advantage of a known ground
truth and a physical object, which can be scanned using patient protocols. However, these
phantoms are limited to modelling simplified and clinically unrealistic uptake patterns.
Furthermore, due to their fixed regular geometry, they do not allow modelling intra-
tumour heterogeneity, which is a key element of clinical lesions. In addition, we have
shown in a previous work that the presence of thick plastic walls encompassing the target
object has an important effect on the evaluation of PET-AS methods [7]. Therefore, such
phantoms are not adequate for studies requiring accurate modelling of patient metabolic
uptake [8, 9], particularly in the H&N where the intricate anatomy and heterogeneity oc-
curring in both background and tumour make the task of delineating the GTV very chal-
lenging. A small number of phantom studies have used deformed objects or molecular
sieves to model non-spherical lesions [10–13] or have included absorbent material into
their inserts to model inhomogeneities [14]. However, these techniques did not allow
modelling combined heterogeneity and geometrical complexity in a controlled and repro-
ducible manner and most still included the presence of glass or plastic walls. To our
knowledge, heterogeneity and complex geometry have not yet been modelled in combin-
ation in realistic phantoms.
The use of printed radioactive uptake patterns has been investigated in the literature
as a promising technique for generating radioactive sources for PET [15–17]. This al-
lows modelling any desired tracer distribution while providing reference data or ground

Berthon et al. EJNMMI Physics (2015) 2:13 Page 3 of 17
truth useful for a number of quality assurance purposes. A quantitative calibration
study of the printing method was described in detail by Markiewicz et al. [17] for gen-
erating single-slice patterns with applications to brain imaging studies. However, the
stacking of several printed patterns to produce a 3D object for quantitative applications
was not investigated. Recent work by Holmes et al. used a 3D-printed phantom, named
subresolution sandwich (SS) phantom, for the generation of realistic SPECT brain im-
ages [18]. However, to our knowledge, the use of stacked 18F-FDG-printed uptake pat-
terns to generate a 3D PET phantom has not yet been investigated nor used for the
evaluation of PET segmentation techniques.
This work aimed at demonstrating the advantages of using irregular and heterogeneous
target objects to evaluate and compare the performance of PET-AS methods. For this pur-
pose, we calibrated and used a novel 3D-printed SS phantom technique to acquire realis-
tic image data. We used the PET images obtained by scanning the 3D-printed SS
phantoms to evaluate and compare a set of ten PET-AS methods representing different
medical image segmentation approaches. We have investigated the benefits of using the
printed SS phantom compared to a standard plastic fillable phantom for testing PET-AS
methods intended for radiotherapy treatment planning.
MethodsExperimental method and reproducibility
Preparation of the SS phantom
The printed SS phantom structure consists of 120 oval poly(methyl methacrylate)
(PMMA) sheet of 2-mm thickness, corresponding to axial slices, which can be assem-
bled using three plastic rods attached to a cylindrical PMMA support. The radioactive
part of the phantom, when containing radioactive printouts, can reach a maximum
length of 240 mm. The paper and PMMA are held together by a thick plastic sheet,
which is screwed on top of the phantom once assembled, allowing it to be scanned as a
3D physical object. A picture of the assembled 3D phantom is shown on Fig. 1a, along
with the position of the phantom in the scanner on Fig. 1b.
Plain A4 80-mg paper was used, cut to 168 mm × 197 mm to fit into the phantom
and hole punched in order for it to be assembled on the rods. Uptake printouts were
generated as grey-level 3D images in Matlab (The MathWorks Inc., Natick, USA),
Fig. 1 a Partially assembled printed SS phantom and b assembled phantom positioned on the scanner bed

Berthon et al. EJNMMI Physics (2015) 2:13 Page 4 of 17
resampled to 2-mm slices and printed on a HP deskjet 990 cxi, using drop-on-demand
thermal inkjet printing. The advantage of this type of equipment is its use of refillable
ink cartridges, making it possible to add the desired quantity of radiotracer to the same
cartridge before each set of experiments. The printing settings “normal” and “black &
white” were chosen in order to minimise the printing time (and therefore the radio-
tracer decay and user exposure to gamma emissions) while ensuring a good printing
quality. The corresponding printing speed is 6.5 pages per minute. The printing reso-
lution used throughout this work was 600 × 600 dpi.
The cartridge was filled with the desired 18F-FDG volume and topped with black ink.
Various 18F-FDG activity concentrations were used for the different experiments. The
images were printed in a hot cell (Gravatom Engineering Systems Ltd, Southampton,
UK), after leaving the cartridge with its dispensing head down for 20 min to
homogenize its contents, as recommended by the manufacturer. All operations includ-
ing filling the ink cartridge and assembling the phantom were done behind a lead glass
shield (Bright Technologies Ltd, Sheffield, UK). Any inaccuracy in the positioning of
the pattern on the paper was corrected for by aligning markers printed as part of the
pattern to reference markers drawn on the PMMA sheet. The cross-shaped markers
were printed with the same radioactive ink as the printout and were visible on the PET
image obtained. The phantom was scanned immediately after assembling on a GE 690
Discovery PET/CT scanner for two bed positions with the protocol used for clinical
whole body diagnostic scans, given in Table 1. Both low-dose CT (used for attenuation
correction) and high-resolution CT were acquired. Operator exposure to the radio-
active tracer was controlled using standard safety equipment (e.g. lead glass shields,
shielded syringe carriers, hot cell) and monitored with electronic portable dosimeters
(RAD-60S, RADOS Technology, Oy, Finland). We assessed the homogeneity and re-
producibility of the printing to ensure reliable printing of the desired uptake
distributions.
The printing, assembling and scanning of the SS phantom took approximately
80 min for each experiment. This included (a) filling the cartridge (10 min), (b) leaving
the contents of the cartridge to homogenize (10 min), (c) printing (30 min), (d) assem-
bling (20 min) and (e) scanning (10 min). The whole body radiation dose to the oper-
ator for one session with a single scan was 4 μSv.
Table 1 Parameters used for the acquisition and reconstruction of PET scans
Parameter Value
2D matrix size CT (voxels) 512 × 512
2D matrix size PET (voxels) 256 × 256
Voxel size high resolution CT 0.977 mm× 0.977 mm× 2.5 mm
Voxel size PET 2.73 mm× 2.73 mm× 3.27 mm
Field of view dimensions 700 mm× 153 mm
Duration of bed position 3 min
Reconstruction algorithm Vue Point FX TOF-corrected
Algorithm settings 3D ML OSEM 24 subsets 2 iterations
Post-processing filter cut-off 6.4 mm
CT-based attenuation correction yes

Berthon et al. EJNMMI Physics (2015) 2:13 Page 5 of 17
Printing quality
To assess the printing homogeneity, we printed two 30 mm × 200 mm stripes with a
mixture of black ink and radiotracer along both width and length of an A4 paper. The
number of counts was measured along these stripes, using thin layer chromatography
(TLC) (iScan, Canberra, Uppsala, Sweden) at a speed of 1 mm/s.
The printing reproducibility was assessed using a 100 × 100 mm homogeneous
square. This was printed with the same grey level and radioactive ink mixture 66 con-
secutive times. The phantom obtained by stacking these printouts was then scanned,
and the resulting PET image was analysed. A region of interest (ROI) positioned at the
centre of each square was reproduced on 60 consecutive slices (the superior and infer-
ior edges of the phantom were excluded) of the PET image and the mean intensity of
each ROI was measured.
Printer calibration
Additional experiments aimed at determining the relationship between grey levels spe-
cified to the printer and obtained on the PET image and derive an adequate calibration
to ensure that the desired tissue uptake ratios were carried out. In this case, ten grey
levels ranging from 10 to 100 % of the maximum printed intensity were defined and
for each grey level, a 140 mm × 160 mm homogeneous rectangle was printed five times
with the same mixture of black ink and 18F-FDG. The paper was weighed before and
after printing to measure the amount of ink added by the printer. The weight of ink
printed for each grey level, averaged over the five instances, was then plotted against
the grey-level values specified. Furthermore, 20 distinct homogeneous 30 mm × 30 mm
squares of grey-level values evenly spaced within 5 and 100 % were printed with the
radioactive ink mixture. The number of counts detected across the different rectangles
was then measured using the iScan TLC. Correction for radioactive decay was applied to
compare all readings at the same time point. This process was repeated with three differ-
ent activity concentrations in the ink at the time of measurement corresponding to differ-
ent volumes of black ink added to 2 mL of the same radiotracer solution. The relationship
between counts and the amount of ink printed on the paper was then derived.
In all experiments, the accuracy of the paper positioning in the phantom was assessed
using radioactive cross-shaped markers printed at the top (T), left (L) and right (R) of
the printout. The markers’ position on the acquired PET image was determined for
each slice, as the highest intensity voxel in a 5 × 5 voxel square drawn around the im-
aged marker. For each one of the T, L and R markers, the difference in positioning with
the average marker position was measured.
Generation of realistic 3D uptake maps
A first uptake map was generated to model six spherical tumours of diameters 10, 13,
17, 22, 28 and 38 mm, named S1, S2, S3, S4, S5 and S6, respectively, with two levels of
intensity, with the difference between the highest (central) uptake and lowest uptake
equal to the difference between the lowest tumour uptake and background. This uptake
pattern is shown on Fig. 2b. The methods described in the next section were applied to
the six images obtained.
We further aimed at using the printed SS phantom to generate realistic irregular and
heterogeneous target lesions. For this purpose, a clinical tumour outline was extracted

Fig. 2 Modelled tumour patterns shown in a transverse slice of the irregular lesion. a Homogeneous. b 2-leveluptake. c Gaussian. d Necrotic. e Necrotic Gaussian
Berthon et al. EJNMMI Physics (2015) 2:13 Page 6 of 17
from an available H&N PET/CT scan using manual delineation. The background up-
take was modelled by segmenting normal anatomical structures on the CT scan and
assigning to each structure a grey-level value corresponding to its mean 18F-FDG up-
take, measured on the PET image. Ellipsoidal outlines were also used for different ex-
periments at the same locations as the irregular tumour outlines on the background
printout template. These target lesions were modelled with a volume of 11 mL, which
is large enough to allow better investigation of highly heterogeneous uptake patterns,
such as necrotic centres encountered in large lymph nodes. The different images
printed corresponded to the background image, in which one of the volumes (irregular
tumour or ellipsoid) was inserted with a grey-level value representing the desired 18F-FDG
uptake. The resulting templates were resampled to 2-mm slices in the superior-inferior
direction of the H&N scan, in order to match the thickness of the PMMA sheets. This
process allowed the retrieval of the modelled tumour contour from the final printout tem-
plate, providing a ground truth for the evaluation of segmentation results on the PET
image. Various tumour uptake distributions of the irregular and ellipsoidal lesions were
modelled for a tumour-to-background ratio (TBR) of 4. These are shown for the irregular
lesion on Fig. 2. The different uptake patterns included:
a) Homogeneous uptake
b) Two-level uptake as described above for the spherical lesions (only used for the
irregular lesion)
c) Heterogeneous Gaussian smoothed uptake: addition to the background uptake map
of a homogeneous uptake smoothed with a Gaussian filter to model higher uptake
at the centre
d) Necrotic: homogeneous high uptake with no uptake at the centre of the tumour
e) Necrotic Gaussian: necrotic uptake smoothed with a Gaussian filter
The phantoms obtained for each case were scanned with an activity concentration in
the cartridge of about 6000 kBq/mL, as this provided a PET image with activities corre-
sponding to the original PET scan.
Evaluation of PET-AS methods
In order to evaluate the performance of state-of-the-art PET-AS methods on heteroge-
neous target objects of complex geometry, we selected four advanced PET-AS approaches
(Table 2) from the recent literature to represent some of the categories described by
Bankman et al. [19]. One or more custom implementation of these approaches was

Berthon et al. EJNMMI Physics (2015) 2:13 Page 7 of 17
written and optimised in house into a common framework using the Matlab package,
with the Image Processing Toolbox available for testing. All approaches were imple-
mented as fully automatic 3D algorithms except for WT, since previous work had shown
better performance when implemented in 2D [20, 21]. The resulting segmentation
methods have been described in more details in the previous work [22]. The clustering ap-
proach was implemented for a total number of clusters ranging between 2 and 8, leading
to PET-AS methods named GCM2, GCM3, GCM4, GCM5, GCM6, GCM7 and GCM8
in this work. Each of these individual clustering algorithms identifies the lowest intensity
cluster as the background and the remaining clusters as the tumour in a final step and
provides a single contour for the tumour. This method is used because the aim of the seg-
mentation in this study is to identify the whole lesion outline and because no heterogene-
ities are modelled in the close neighbourhood of the lesions.
The resulting ten PET-AS methods were applied for all target lesions to the region of
the original scan corresponding to an extension of 10-mm margin of the true contour’s
bounding box. The segmentation accuracy of each PET-AS was assessed by comparing
the contour obtained to the true contour (extracted from the printout template) using
the dice similarity coefficient (DSC) [23] which quantifies the similarity between refer-
ence and evaluated volume returning a score between 0 and 1. We used a DSC above
0.7 as an indicator of good overlap:
DSC ¼ 2 � A∩Bj jAj j þ Bj j ð1Þ
where A is the set of voxels in the reference volume and B is the set of voxels in the
evaluated volume.
In addition, the sensitivity (S) and positive predictive value (PPV) were calculated
with the following equations:
S ¼ TPTPþ FN
¼ A∩BA
ð2Þ
PPV ¼ TPTPþ FP
¼ A∩BB
ð3Þ
with TP the true positives (voxels accurately classified), FN the false negatives (voxels
in true contour A not included in B) and FP the false positives (voxels in contour B not
included in true contour A).
For comparison purposes, the performance of the PET-AS methods was also evalu-
ated using the commonly used NEMA IEC body phantom with spherical plastic inserts.
Table 2 Description and name of PET-AS methods used in this study. The references correspondto recent publications using similar PET-AS algorithms
Segmentationapproach
Name Description
Adaptivethresholding
AT 3D iterative background-subtracted thresholding
Region-growing RG 3D iterative region-growing with automatic seed finder
Clustering GCM2-GCM8
3D fuzzy C-means segmentation with Gaussian mixture modelling, identifying2, 3, 4, 5, 6, 7 or 8 clusters
WatershedTransform
WT Slice-by-slice watershed transform-based segmentation, with automatic seedfinder
Berthon et al. EJNMMI Physics (2015) 2:13 Page 8 of 17
In particular, the results obtained for the irregular lesion which had a volume of 5.9 mL
were compared with the segmentation results obtained for the 5.6 mL sphere of the
NEMA IEC body phantom scanned at a TBR of 4.
ResultsExperimental method and reproducibility
Printing quality
In the homogeneity test, the number of counts measured with the TLC along the
stripes of paper printed in both directions was within ± √ μ (with μ as the mean value
measured). This is in line with a Poisson distribution expected for the decay of 18F atoms.
The resulting curves followed a horizontal trend, showing that there was no variation in
the number of counts across the stripes.
For the 60 ROIs drawn on consecutive slices corresponding to the same homoge-
neous grey-level square, the average difference to the mean ROI value was 4.2 %, with a
variation range of 0.27–12.8 %.
Printer calibration
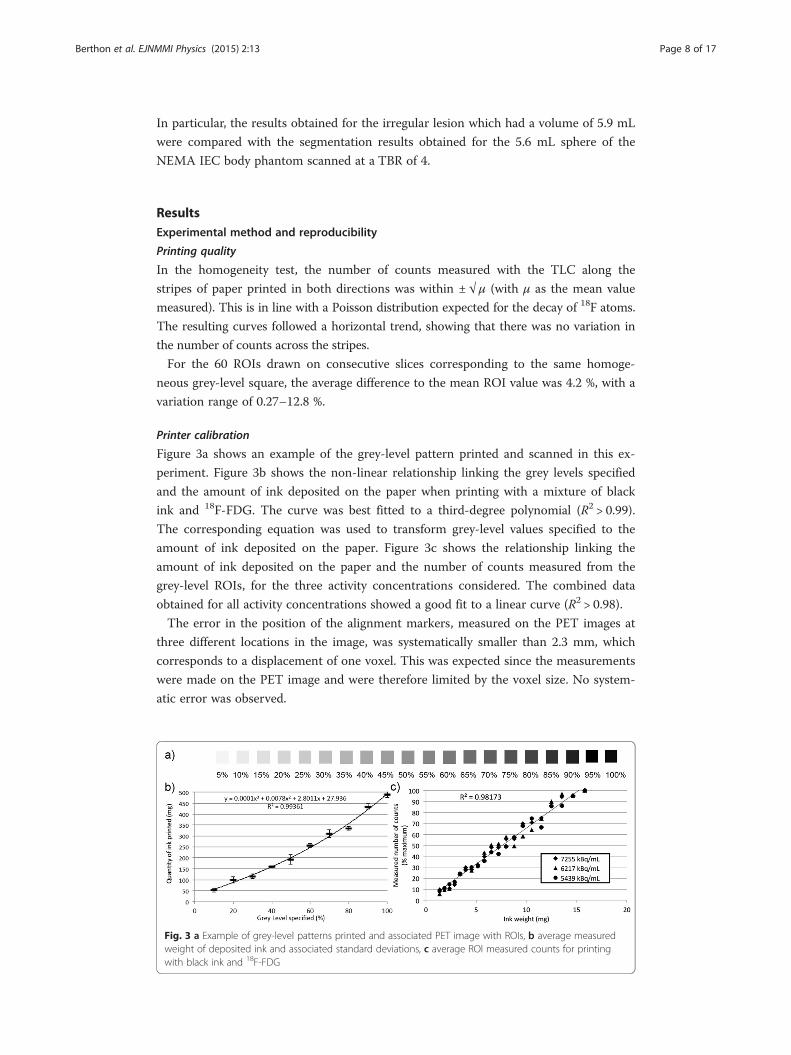
Figure 3a shows an example of the grey-level pattern printed and scanned in this ex-
periment. Figure 3b shows the non-linear relationship linking the grey levels specified
and the amount of ink deposited on the paper when printing with a mixture of black
ink and 18F-FDG. The curve was best fitted to a third-degree polynomial (R2 > 0.99).
The corresponding equation was used to transform grey-level values specified to the
amount of ink deposited on the paper. Figure 3c shows the relationship linking the
amount of ink deposited on the paper and the number of counts measured from the
grey-level ROIs, for the three activity concentrations considered. The combined data
obtained for all activity concentrations showed a good fit to a linear curve (R2 > 0.98).
The error in the position of the alignment markers, measured on the PET images at
three different locations in the image, was systematically smaller than 2.3 mm, which
corresponds to a displacement of one voxel. This was expected since the measurements
were made on the PET image and were therefore limited by the voxel size. No system-
atic error was observed.
Fig. 3 a Example of grey-level patterns printed and associated PET image with ROIs, b average measuredweight of deposited ink and associated standard deviations, c average ROI measured counts for printingwith black ink and 18F-FDG

Berthon et al. EJNMMI Physics (2015) 2:13 Page 9 of 17
Generation of realistic 3D uptake maps
Figure 4a, b shows a sagittal view of the images obtained with the printed SS phantom
modelling a homogeneous irregular and spheroidal H&N lesion, respectively. A total of
nine test images were obtained for the spheroidal and irregular lesions modelled with
four and five different uptake distributions. Figure 4c depicts a necrotic spheroidal le-
sion. The corresponding ground truth contour is shown in black.
Evaluation of PET-AS methods
Figure 5 depicts the DSC values obtained by the different PET-AS methods when delin-
eating spheres S1–S6 modelled with a two-level uptake. The corresponding S and PPV
are given in Table 3. It can be noticed that binary methods such as AT, RG and WT
failed to accurately delineate the largest sphere (DSC<0.6). The DSC values of these
binary methods decreased with sphere size, which was correlated to a low S value. On
the other hand, PPV for these methods was higher than 0.9 for all spheres larger than
S2. The GCM method reached DSC values close to 0.9 for S6, when used with 7 clus-
ters. In the case of small spheres, the accuracy of GCM was higher for small numbers
of clusters. When increasing the sphere size, the DSC obtained with GCM was grad-
ually higher for larger numbers of clusters. This was due to (a) decreased S of methods
with small number of clusters and (b) increased PPV with sphere size for methods with
larger number of cluster. The optimal number of clusters to use was 3, 2, 5, 5, 6 and 7
for spheres S1, S2, S3, S4, S5 and S6, respectively. Following these results and since the
lesion size in the next experiments was smaller than 11.5 mL, we used a maximum of 6
clusters with the GCM method in the rest of the work.
Figure 6 shows the accuracy (DSC) obtained by the different PET-AS methods listed
in Table 2 when delineating the irregular lesion modelled with the printed SS phantom,
with the results obtained for the 5.6 mL sphere of the NEMA IEC body phantom
shown for comparison. The error bars represent the estimated error on the DSC due to
errors in the experimental setup. In particular, the reproducibility error in the measure-
ment of the activity injected in the phantom or the cartridge was within 2 % of the true
value according to standard calibration test carried out in our centre. Consequently,
the error bars were derived as ±4 % of the value of (1−DSC), to account for the fact
that the most accurate methods are expected to be the least sensitive to variations in
the TBR and image quality. Lower accuracy was obtained for the irregular lesion com-
pared to the NEMA sphere for all methods except GCM3. Differences were larger than
Fig. 4 Sagittal view of the images obtained with the printed SS phantom for a the irregular homogeneouslesion, b the spheroidal homogeneous lesion and c the necrotic spheroidal lesion

Fig. 5 DSC obtained by the PET-AS methods for 6 spheres modelled with a two-level uptake
Berthon et al. EJNMMI Physics (2015) 2:13 Page 10 of 17
the 4 % error estimate for all methods except AT and GCM3, with the largest differ-
ences observed for the remaining clustering (GCM) methods and WT (68 % differ-
ence). The accuracy of GCM versions peaked for an optimal number of clusters, which
was 4 in the case of the NEMA sphere and 3 for the irregular lesion.
Figure 7a shows the DSC values obtained by the different PET-AS methods for the
spheroidal lesion. The corresponding S values and PPV are given in Table 4. For the
non-necrotic uptake distributions (homogeneous and Gaussian), DSC values were
within 5 % of each other for all methods except for GCM with more than 3 clusters.
The DSC values for non-necrotic uptake obtained by AT, RG, GCM2 and GCM3 were
also within 5 % of each other and within 10 % of the values obtained by WT. These
high DSC values (DSC>0.8) were linked to S values higher than 0.9 for WT, PPV values
higher than 0.9 for AT, and PPV and S values just below 0.9 for RG. GCM methods
had increasing S and decreasing PPV with an increasing number of clusters. For nec-
rotic lesions, differences between DSC values reached by the different methods were as
high as 25 %. The S for necrotic lesions was higher than 0.9 for the necrotic uptakes,
with a PPV lower than 0.7 for all methods except AT. The accuracy of GCM versions
Table 3 S and PPV obtained by the PET-AS methods for 6 spheres modelled with 2 uptake levels
S1 S2 S3 S4 S5 S6
S PPV S PPV S PPV S PPV S PPV S PPV
AT 0.625 0.882 0.771 0.902 0.579 1.000 0.379 1.000 0.443 0.995 0.214 1.000
RG 0.833 0.741 0.833 0.870 0.748 0.976 0.564 1.000 0.562 0.978 0.400 1.000
GCM2 0.583 0.778 0.792 0.884 0.692 0.949 0.546 0.969 0.560 0.978 0.421 1.000
GCM3 0.708 0.739 0.729 0.946 0.495 1.000 0.392 1.000 0.502 0.983 0.346 1.000
GCM4 0.833 0.400 0.875 0.700 0.794 0.914 0.617 0.959 0.715 0.936 0.581 0.994
GCM5 0.917 0.148 0.938 0.484 0.953 0.773 0.780 0.876 0.806 0.850 0.740 0.969
GCM6 0.958 0.096 0.958 0.326 0.991 0.639 0.868 0.764 0.921 0.761 0.845 0.915
GCM7 0.958 0.068 0.979 0.181 1.000 0.495 0.925 0.689 0.964 0.657 0.906 0.870
GCM8 1.000 0.055 1.000 0.119 1.000 0.334 0.952 0.612 0.992 0.558 0.951 0.814
WT 0.750 0.546 1.000 0.533 0.757 0.871 0.608 0.965 0.600 0.884 0.346 0.942
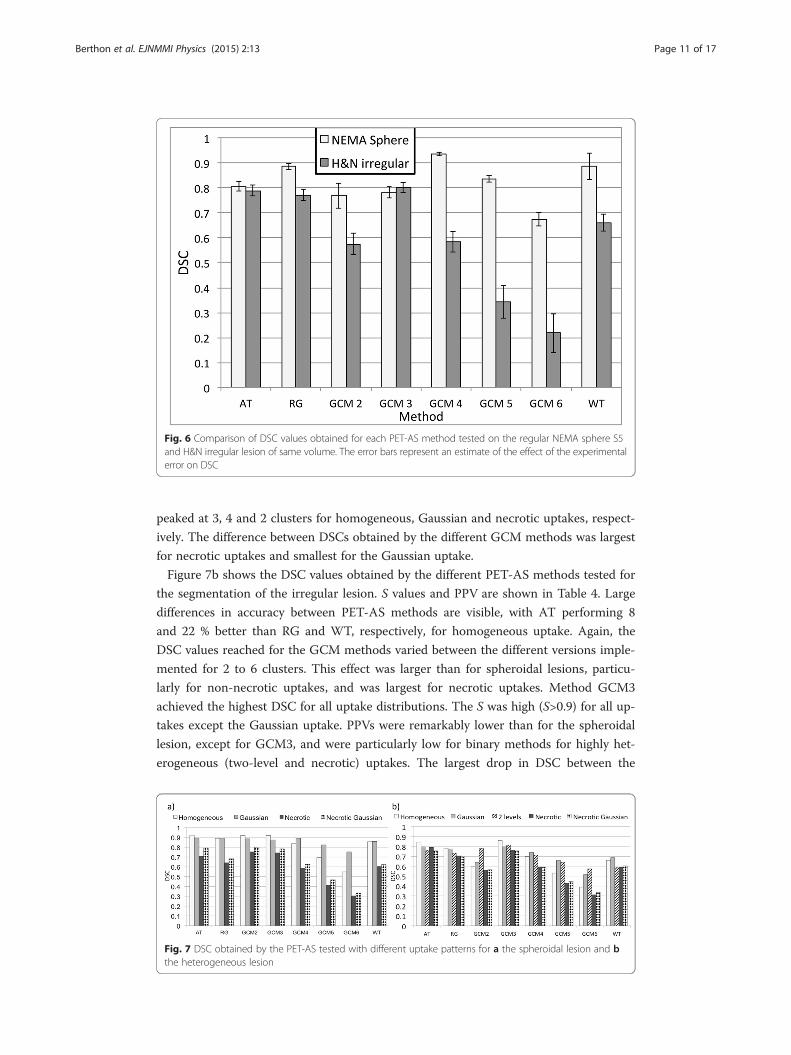
Fig. 6 Comparison of DSC values obtained for each PET-AS method tested on the regular NEMA sphere S5and H&N irregular lesion of same volume. The error bars represent an estimate of the effect of the experimentalerror on DSC
Berthon et al. EJNMMI Physics (2015) 2:13 Page 11 of 17
peaked at 3, 4 and 2 clusters for homogeneous, Gaussian and necrotic uptakes, respect-
ively. The difference between DSCs obtained by the different GCM methods was largest
for necrotic uptakes and smallest for the Gaussian uptake.
Figure 7b shows the DSC values obtained by the different PET-AS methods tested for
the segmentation of the irregular lesion. S values and PPV are shown in Table 4. Large
differences in accuracy between PET-AS methods are visible, with AT performing 8
and 22 % better than RG and WT, respectively, for homogeneous uptake. Again, the
DSC values reached for the GCM methods varied between the different versions imple-
mented for 2 to 6 clusters. This effect was larger than for spheroidal lesions, particu-
larly for non-necrotic uptakes, and was largest for necrotic uptakes. Method GCM3
achieved the highest DSC for all uptake distributions. The S was high (S>0.9) for all up-
takes except the Gaussian uptake. PPVs were remarkably lower than for the spheroidal
lesion, except for GCM3, and were particularly low for binary methods for highly het-
erogeneous (two-level and necrotic) uptakes. The largest drop in DSC between the
Fig. 7 DSC obtained by the PET-AS tested with different uptake patterns for a the spheroidal lesion and bthe heterogeneous lesion

Table 4 S and PPV obtained by the PET-AS methods for the spheroidal and irregular H&N lesionfor different uptake patterns (cf. Fig. 7)
Homogeneous Gaussian Two-level Necrotic Necrotic Gaussian
S PPV S PPV S PPV S PPV S PPV
Spheroids
AT 0.845 1.000 0.852 0.939 N/A N/A 0.814 0.626 0.922 0.696
RG 0.891 0.889 0.892 0.893 N/A N/A 0.998 0.473 1.000 0.518
GCM2 0.795 1.000 0.791 1.000 N/A N/A 0.924 0.635 0.983 0.673
GCM3 0.854 0.996 0.817 0.940 N/A N/A 0.956 0.605 0.998 0.645
GCM4 0.952 0.745 0.911 0.873 N/A N/A 0.996 0.416 1.000 0.455
GCM5 0.979 0.539 0.975 0.713 N/A N/A 1.000 0.261 1.000 0.306
GCM6 0.998 0.378 0.992 0.605 N/A N/A 1.000 0.179 1.000 0.200
WT 0.962 0.773 0.954 0.780 N/A N/A 0.956 0.440 0.979 0.539
Irregular lesions
AT 0.963 0.751 0.755 0.843 0.961 0.632 0.969 0.670 1.000 0.608
RG 0.994 0.645 0.810 0.742 0.993 0.581 1.000 0.543 1.000 0.533
GCM2 1.000 0.423 0.982 0.472 0.954 0.659 1.000 0.389 1.000 0.395
GCM3 0.976 0.768 0.767 0.828 0.934 0.721 0.994 0.616 1.000 0.608
GCM4 1.000 0.538 0.896 0.629 0.980 0.558 1.000 0.421 1.000 0.420
GCM5 1.000 0.362 0.976 0.497 0.993 0.470 1.000 0.270 1.000 0.287
GCM6 1.000 0.242 1.000 0.348 1.000 0.403 1.000 0.185 1.000 0.203
WT 0.988 0.495 0.865 0.571 1.000 0.420 1.000 0.419 0.994 0.433
Berthon et al. EJNMMI Physics (2015) 2:13 Page 12 of 17
lesions of 31 % of the value for the spheroid was obtained among the binary methods
for WT for Gaussian uptake. For the GCM methods, the largest drop in DSC between
the lesions was 35 % obtained for GCM3 for homogeneous uptake.
Figure 8 illustrates the fact that different methods included (RG and GCM2-6) or did
not include (AT and WT) the necrotic area in the segmented contour for spheroidal le-
sions. This is shown with the examples of methods AT and RG. Method RG, which did in-
clude the necrotic region in the delineated volume, reached 9 and 14 % lower DSC than
AT for necrotic and necrotic Gaussian uptakes, respectively, in the spheroidal lesion.
DiscussionThis work aimed at evaluating a variety of promising advanced PET-AS methods for
segmenting target objects of complex geometry and heterogeneous or necrotic uptake.
For this purpose, we have developed a printed SS phantom technique, which allows
generating a physical 3D object modelling any desired tracer uptake distribution with a
known ground truth, which is the printout template. The feasibility of producing radio-
active two-dimensional PET sources by printing a mixture of ink and 18F-FDG had
been demonstrated by Markiewicz et al. [17] previously. In this work, we have taken
this idea forward by generating a 3D object from a large number of printed sheets and
showed its usefulness for evaluating the performance of PET segmentation algorithms.
We obtained a good homogeneity and reproducibility of the grey-level printing, with
the equipment used for this work (cf. 3.A.2.). The technique was also calibrated for the
accurate modelling of uptake values, to ensure that the tumour-to-tissue ratios printed

Fig. 8 Result of the segmentation (white) of a necrotic spheroidal lesion for a AT and b RG. The black linecorresponds to the reference contour
Berthon et al. EJNMMI Physics (2015) 2:13 Page 13 of 17
corresponded to the values modelled. A non-linear relationship between the intensities
specified and those measured on the PET scan was found and accounted for through a
parametric calibration curve. This is in line with the observation made by Markiewicz
et al. with different equipment [17], but in addition, we have also shown that this effect
is due to the non-linear deposition of ink on the paper. The use of radioactive cross-
marks printed on the paper allowed good alignment of the printouts, with small mea-
sured errors likely to be due to noise in the PET image obtained. The distance between
the markers and the printout was set to 20 mm on average, to ensure that the signal
from the markers did not affect the signal from the lesions or neighbouring back-
ground. The protocol and calibration procedure described in this work may be applic-
able to other equipment. The amount of time necessary for a single operator to
prepare the phantom was small enough to allow scanning the phantom within one
half-life of the 18F decay. The total exposure to the radioactive tracer for one session
with a single scan was comparable to the exposure of manipulating a conventional fill-
able phantom.
Our phantom technique allowed modelling non-spherical target objects and large
heterogeneities in both background and lesion, which would not have been possible in
a controlled and reproducible way with a standard fillable phantom. The examples of
PET images obtained given on Fig. 4 show that realistic H&N uptake modelling was
achieved, without using walls to separate lesion and background 18F-FDG uptakes as in
fillable phantoms. In this work, phantom production was limited to oropharynx tu-
mours. However, a printout template could easily be derived for any other site of the
body for which a CT scan is available. The printout could also be made more realistic
by including a larger number of 18F-FDG uptake levels if needed.
The 15 PET scans of the printed SS phantom including both regular and irregular le-
sions modelled with different uptake patterns allowed a systematic evaluation of the ad-
vantages and disadvantage of the different PET-AS algorithms. Binary methods AT, RG
and WT, as well as GCM2 clearly lacked sensitivity for the highly heterogeneous
spheres (cf. Fig. 5 and Table 3). In these heterogeneous cases, the methods only delin-
eated the high uptake level in the lesion. This can be sufficient when delineating a
tumour subvolume for dose escalation. However, our data shows that multiple

Berthon et al. EJNMMI Physics (2015) 2:13 Page 14 of 17
clustering methods may be preferred when delineating the whole PET-avid tumour.
This lack of sensitivity was not observed for the irregular lesion, even when modelled
with two uptake levels. In this case, the smaller size of the lesion and its irregular con-
tours had a larger impact than the heterogeneous uptake and led to high S values and
low PPVs for the binary methods (cf. Table 4).
Table 3 also showed that GCM increased in sensitivity (and decreased in PPV) with
increasing numbers of clusters, which was observed for spheroidal and irregular mod-
elled H&N lesions as well (cf. Fig. 7 and Table 4). This is due to the inclusion of more
clusters in the tumour contour when a higher number of clusters is used in the algo-
rithm. Our results are in line with work by Hatt et al. [2] which showed the superiority
of their clustering algorithm using 3 clusters compared to binary segmentation in the
case of heterogeneous lesions. Hatt et al.’s method still differs from GCM in that it uses
fuzzy levels and a variety of cluster intensity distribution models, which may explain
their use of only 3 hard classes. The images obtained with our printed SS phantom
showed the need to use of a number of clusters higher than 2 for heterogeneous lesions
to delineate the whole tumour and allowed us to identify the optimal number of clus-
ters to apply in different cases.
The comparison between the segmentation of the irregular lesion modelled with
homogeneous uptake and the sphere from the NEMA IEC body phantom (cf. Fig. 6)
showed a visible decrease in performance of all segmentation methods. This can be ex-
plained by the more complex geometry and by the absence of plastic walls in the printed
SS phantom. In fact, we have previously shown that inactive walls lead to a lower activity
recovery [9, 20, 24] and can influence the accuracy of image segmentation. The compari-
son of spheroidal and irregular lesions (cf. Fig. 7, Tables 3 and 4) showed that larger differ-
ences in accuracy between methods as well as between uptake patterns for the same
method could be observed when testing the method on the smaller and irregular lesions.
Our data also highlighted the robustness of the AT method to lesion geometry (Fig. 6)
and to necrotic areas in the tumour (Fig. 7, Tables 3 and 4) compared to the other binary
methods. This may be due to the fact that AT does not include any spatial connectivity as-
pect in the segmentation, compared to methods using the region-growing process which
penalises complex shapes for RG and WT.
In the case of large necrotic lesions, our results showed that some PET-AS methods
generated a volume enclosing the central necrotic region in the final contour, while others
(AT and WT) did not include this region, and considered it as part of the background (cf.
Fig. 8). In this work, we decided not to include the necrotic volume in the ground truth
contour and evaluated the performance of the PET-AS algorithms accordingly. Although
no uptake was modelled in the necrotic area, the PET intensity was similar to the back-
ground intensity due to noise and spill-out effects. This led to low PPV for the methods
including the necrotic area, while PPV for AT remained above 0.6 (cf. Table 4). For RG,
this can be explained by the growing process used with one seed only, searching for neigh-
bouring voxels in all directions, and making the method unable to delineate annular
shapes. GCM used with more than 3 clusters also included the necrotic area, because the
large number of clusters, inadequate for such a homogeneous tumour (when excluding
the necrotic centre), makes it likely to add low uptake regions to the tumour.
It should be noted that although we covered a wide range of different segmentation
methods, more advanced PET-AS algorithms could be evaluated using the printed SS
Berthon et al. EJNMMI Physics (2015) 2:13 Page 15 of 17
technique presented in this work. In particular the use of image pre-processing tools to
denoise and deblur PET images as suggested by Geets et al. [25] and the application of
other recently published promising methods such as GMM [26] and FLAB [27, 28]
could provide and even more exhaustive set of data in evaluating the performance of
PET-AS methods in delineating heterogeneous and irregular lesions.
This study was conducted using the acquisition and scanning parameters routinely used
for clinical scans at our centre so that the results could be readily applicable to routine
clinical practice. Parameters such as image noise, reconstruction voxel size, post-filtering
and TOF correction have been shown in previous studies [29, 30] to have a potentially
important impact on image segmentation. Since this work mainly focused on the use of a
novel printed SS phantom technique to produce realistic heterogeneous and irregular
lesions, we did not evaluate the dependence of the performance of each PET-AS method
with image noise and other parameters used in image reconstruction. This topic could be
the subject of future work using the printed SS phantom technique.
The flexibility in the design of 18F-FDG uptake patterns provided by the printed SS
phantom allowed lesions to be represented with any geometry or uptake distribution,
modelling heterogeneities, necrotic regions and, theoretically, microscopic tumour ex-
tension. Our work has shown the information that can be extracted using such images
compared to homogeneous spherical uptake images. This is a key advantage, in the
light of recent studies showing the high impact of segmentation inaccuracies on the
dosimetry during radiotherapy treatment in the case of heterogeneous or low intensity
lesions [4]. The printed SS phantom technique could be used for many other applica-
tions beyond the evaluation of PET segmentation algorithms, such as the assessment
and characterisation of combined PET and computed tomography (CT) scanners and
the investigation of PET-reconstruction and post-processing methods. Although 3D
printing of hollow objects has been used to produce patient-specific plastic inserts [31],
such techniques did not provide any flexibility in modifying the phantom and do not
allow modelling any heterogeneity as was done in this study. In addition, the printed
SS phantom does not use any physical separation (i.e. plastic walls) between the model
tumour and background uptake in the transverse plane, which makes it again more
realistic than the use of fillable inserts. Although we have shown that the printed SS
phantom can be extremely useful in generating realistic target images for segmentation
evaluation purposes, the current technique may not yet be adequate for fully quantitative
studies. The presence of plastic sheets limits the modelling to details larger than 2 mm in
superior-inferior direction, and the scatter and attenuation properties of the plastic, which
is the main material in the phantom, do not currently allow modelling human tissue ap-
propriately. The use of a 3D printer to generate PET phantoms was investigated by Miller
et al. [32], but the authors acknowledge that the technique does not currently allow print-
ing non-uniform areas of tracer uptake. Work is in progress at our centres to further de-
velop the technique to make it applicable to other quantitative studies.
ConclusionThis work presents a novel phantom technique for the evaluation the performance of
PET auto-segmentation methods in delineating heterogeneous and irregular lesions.
We developed a method to print a subresolution sandwich phantom with radioactive

Berthon et al. EJNMMI Physics (2015) 2:13 Page 16 of 17
18F-FDG maps. We have shown that our method can be successfully used to design,
print and acquire PET images of complex and realistic H&N uptake with ground truth
data. We have also demonstrated the usefulness of the printed subresolution sandwich
phantom technique in assessing the performance of advanced PET automatic segmen-
tation methods when delineating target objects with highly heterogeneous uptake and
complex geometry. The printed subresolution sandwich phantom technique has the po-
tential of playing a key role in future 3D quantitative methods in radionuclide imaging.
Competing interestsThe authors declare that they have no competing interests.
Authors’ contributionsRH developed the concept of radioisotope printing, provided the equipment and participated in the acquisition of thedata. BB carried out the experimental set-up, data acquisition and analysis. ES and CM participated in the developmentof the concept and data analysis. All authors read and approved the final manuscript.
AcknowledgementsThe authors acknowledge Dr Sudar Jayaprakasam’s input in the design of the H&N template and lesions.
FundingThis work was carried out as part of the POSITIVE project (Optimization of Positron Emission Tomography based TargetVolume Delineation in Head and Neck Radiotherapy), which is funded through Cancer Research Wales grant No. 7061.
Author details1Wales Research and Diagnostic Positron Emission Tomography Imaging Centre, Cardiff University - PETIC, room GF705Ground floor ‘C’ Block, Heath Park, CF14 4XN Cardiff, UK. 2Department of Medical Physics and Bioengineering,University Hospitals Bristol, BS2 8HW Bristol, UK. 3School of Engineering, Cardiff University, Cardiff, Wales, UK.
Received: 29 March 2015 Accepted: 2 June 2015
References
1. Nestle U, Kremp S, Schaefer-Schuler A, Sebastian-Welsch C, Hellwig D, Ru C. Comparison of different methods fordelineation of 18F-FDG PET-positive tissue for target volume definition in radiotherapy of patients with non-smallcell lung cancer. J Nucl Med. 2005;46(8):1342–8.
2. Hatt M, Cheze le Rest C, Descourt P, Dekker A, De Ruysscher D, Oellers M, et al. Accurate automatic delineation ofheterogeneous functional volumes in positron emission tomography for oncology applications. Int J Radiat OncolBiol Phys. 2010;77(1):301–8.
3. Cheebsumon P, Yaqub M, van Velden FHP, Hoekstra OS, Lammertsma AA, Boellaard R. Impact of [18F]FDG PETimaging parameters on automatic tumour delineation: need for improved tumour delineation methodology. Eur JNucl Med Mol Imaging. 2011;38:2136–44.
4. Le Maitre A, Hatt M, Pradier O, Cheze-le Rest C, Visvikis D. Impact of the accuracy of automatic tumour functionalvolume delineation on radiotherapy treatment planning. Phys Med Biol. 2012;57(17):5381–97.
5. (NEMA) National Electrical Manufacturers Association, Performance measurements of scintillation cameras, WashingtonDC. Standards Publication No NU1. Wasgington, DC: National Electrical Manufacturers Association; 2001
6. J. A. Siegel, A. R. Benedetto, R. J. Jaszczak, J. L. Lancaster, M. T. Madsen, W. W. Woodsen, and R. E. Zimmerman,Rotating scintillation camera SPECT acceptance testing and quality control. AAPM report no. 22. NY, New York:American Institute of Physics; 1987
7. Berthon B, Marshall C, Evans M, Spezi E. Evaluation of advanced automatic PET segmentation methods usingnon-spherical thin-wall inserts. Med Phys. 2014;41(2):022502.
8. T. G. Turkington, T. R. Degrado, W. H. Sampson, Small spheres for lesion detection phantoms, in IEEE Nucl. Sci.Symp. Conf. Rec. 2001, 4, pp. 2234–2237.
9. Bazañez-Borgert M, Bundschuh R a, Herz M, Martínez M-J, Schwaiger M, Ziegler SI. Radioactive spheres withoutinactive wall for lesion simulation in PET. Z Med Phys. 2008;18(1):37–42.
10. Drever L a, Roa W, McEwan A, Robinson D. Comparison of three image segmentation techniques for targetvolume delineation in positron emission tomography. J Appl Clin Med Phys. 2007;8(2):93–109.
11. Nehmeh SA, El-Zeftawy H, Greco C, Schwartz J, Erdi YE, Kirov A, et al. An iterative technique to segment PETlesions using a Monte Carlo based mathematical model. Med Phys. 2009;36(10):4803.
12. Zito F, De Bernardi E, Soffientini C, Canzi C, Casati R, Gerundini P, et al. The use of zeolites to generate PETphantoms for the validation of quantification strategies in oncology. Med Phys. 2012;39(9):5353–61.
13. Shepherd T, Teras M, Beichel R, Boellaard R, Bruynooghe M, Dicken V, et al. Comparative study with new accuracymetrics for target volume contouring in PET image guided radiation therapy. IEEE Trans Med Imaging.2012;31(11):2006–24.
14. P. Tylski, G. Bonniaud, E. Decencière, J. Stawiaski, J. Coulot, and D. Lefkopoulos, F-FDG PET images segmentationusing morphological watershed : a phantom study, Nucl. Sci. Symp. Conf. Rec. 2006, IEEE, vol. 4. IEEE, pp.2063–2067, 2006

Berthon et al. EJNMMI Physics (2015) 2:13 Page 17 of 17
15. Larsson SA, Jonsson C, Pagani M, Johansson L, Jacobsson H. A novel phantom design for emission tomographyenabling scatter- and attenuation-‘free’ single-photon emission tomography imaging. Eur J Nucl Med.2000;27(2):131–9.
16. Sossi V, Buckley KR, Piccioni P, Rahmim A, Member S, Camborde M, et al. Printed sources for positron emissiontomography. IEEE Trans Nucl Sci. 2005;52(1):114–8.
17. Markiewicz PJ, Angelis GI, Kotasidis F, Green M, Lionheart WR, Reader AJ, et al. A custom-built PET phantom designfor quantitative imaging of printed distributions. Phys Med Biol. 2011;56(21):N247–61.
18. Holmes RB, Hoffman SMa, Kemp PM. Generation of realistic HMPAO SPECT images using a subresolutionsandwich phantom. Neuroimage. 2013;81:8–14.
19. Bankman I. Handbook of medical image processing and analysis. Part II. Segmentation. Baltimore, MD, USA:Academic; 2000.
20. B. Berthon Optimisation of positron emission tomography segmentation for head and neck radiotherapytreatment planning. PhD thesis, Cardiff University, Cardiff, UK, 2015
21. Ray S, Hagge R, Gillen M, Cerejo M, Shakeri S, Beckett L, et al. Comparison of two-dimensional andthree-dimensional iterative watershed segmentation methods in hepatic tumor volumetrics. Med Phys.2008;35(12):5869–81.
22. Berthon B, Marshall C, Edwards A, Evans M, Spezi E. Influence of cold walls on PET image quantification andvolume segmentation. Med Phys. 2013;40(8):1–13.
23. Dice L. Measures of the amount of ecologic association between species. Ecology. 1945;26:297–302.24. Hofheinz F, Dittrich S, Potzsch C, van den Hoff J. Effects of cold sphere walls in PET phantom measurements on
the volume reproducing threshold. Phys Med Biol. 2010;55(4):1099–113.25. Geets X, Lee J a, Bol A, Lonneux M, Grégoire V. A gradient-based method for segmenting FDG-PET images:
methodology and validation. Eur J Nucl Med Mol Imaging. 2007;34(9):1427–38.26. Aristophanous M, Penney BC, Martel MK, Pelizzari CA. A Gaussian mixture model for definition of lung tumor
volumes in positron emission tomography. Med Phys. 2007;34(11):4223.27. Hatt M, Cheze C, Turzo A, Roux C, Oncology IT. A fuzzy locally advanced bayesian segmentation approach for
volume determination in PET. IEEE Trans Med Imaging. 2009;28(6):881–93.28. E. De Bernardi, C. Soffientini, F. Zito, and G. Baselli, Joint segmentation and quantification of oncological lesions in
PET/CT: preliminary evaluation on a zeolite phantom, presented at Anaheim, USA 2012 IEEE Nuclear ScienceSymposium and Medical Imaging Conference Record (NSS/MIC), 2012, no. 1, pp. 3306–3310.
29. Daisne J-F, Sibomana M, Bol A, Doumont T, Lonneux M, Grégoire V. Tri-dimensional automatic segmentation ofPET volumes based on measured source-to-background ratios: influence of reconstruction algorithms. RadiotherOncol. 2003;69(3):247–50.
30. Hatt M, Cheze Le Rest C, Albarghach N, Pradier O, Visvikis D. PET functional volume delineation: a robustness andrepeatability study. Eur J Nucl Med Mol Imaging. 2011;38(4):663–72.
31. Gear JI, Long C, Rushforth D, Chittenden SJ, Cummings C, Flux GD. Development of patient-specific molecularimaging phantoms using a 3D printer. Med Phys. 2014;41(8):082502.
32. Miller M a, Hutchins GD. Development of anatomically realistic PET and PET/CT phantoms with rapid prototypingtechnology. IEEE Nucl Sci Symp Conf Rec. 2007;2007:4252–7.
Submit your manuscript to a journal and benefi t from:
7 Convenient online submission
7 Rigorous peer review
7 Immediate publication on acceptance
7 Open access: articles freely available online
7 High visibility within the fi eld
7 Retaining the copyright to your article
Submit your next manuscript at 7 springeropen.com