a novel method for the measurement of glucocorticoids in
TRANSCRIPT

. . . . . . . . . . . . . . . . . . . . . . . . . . . . . . . . . . . . . . . . . . . . . . . . . . . . . . . . . . . . . . . . . . . . . . . . . . . . . . . . . . . . . . . . . . . . . . . . . . . . . . . . . . . . . . . . . . . . . . . . . . . . . . . . . . . . . . . . . . . . . . . . . . . . . . . . . . . . . .
. . . . . . . . . . . . . . . . . . . . . . . . . . . . . . . . . . . . . . . . . . . . . . . . . . . . . . . . . . . . . . . . . . . . . . . . . . . . . . . . . . . . . . . . . . . . . . . . . . . . . . . . . . . . . . . . . . . . . . . . . . . . . . . . . . . . . . . . . . . . . . . . . . . . . . . . . . . . . .
Volume 6 • 2018 10.1093/conphys/coy008
Toolbox
A novel method for the measurementof glucocorticoids in dermal secretionsof amphibiansR.M. Santymire1,*, M. B. Manjerovic1,2 and A. Sacerdote-Velat3
1Lincoln Park Zoo, Conservation & Science Department, 2001 N. Clark St., Chicago, IL 60614, USA2Department of Biology, Virginia Military Institute, 301C Maury-Brooke Hall, Lexington, VA 24450, USA3The Chicago Academy of Sciences, Peggy Notebaert Nature Museum, 2430 North Cannon Drive, Chicago, IL 60614, USA
*Corresponding author: Lincoln Park Zoo, 2001N. Clark St., Chicago, IL 60614, USA. Tel: +1 312 742 3520; Email: [email protected]
Amphibians have been declining in both diversity and abundance due in large part to habitat degradation and the prevalenceof emerging diseases. Although stressors can suppress the immune system, affecting an individual’s health and susceptibilityto pathogens, established methods for directly collecting stress hormones are not suitable for rapid field use or for use onthreatened and endangered species. To overcome these challenges, we are developing an innovative method to collect andmeasure amphibian glucocorticoid secretions using non-invasive dermal swabs. We tested this methodology using multipleterrestrial, semi-aquatic and fully aquatic species. We swabbed the dorsal side of each animal six times and then induced astressor of either hand-restraint, ACTH injection, or saline as a control. We then repeated swab collection immediately after thestressor and at 15, 30, 45, 60, 90 and 120min intervals. Cortisol enzyme immunoassay detected changes in cortisol post-stressor. We also tested this methodology in the field and were successfully able to detect glucocorticoids from multiple spe-cies at varying life stages. When using in the field, capture technique should be considered since it may impact stress levels incertain species. Upon further testing, this novel method may be used to greatly increase our understanding of amphibianhealth especially as disease and environmental changes continue to impact fragile populations.
Key words: ACTH, herpetofauna, stress, trapping stress
Editor: Steven Cooke
Received 11 July 2017; Revised 19 January 2018; Editorial Decision 25 January 2018; accepted 5 February 2018
Cite as: Santymire R, Manjerovic MB, Sacerdote-Velat A (2018) A novel method for the measurement of glucocorticoids in dermal secretionsof amphibians. Conserv Physiol 6(1): coy008; doi:10.1093/conphys/coy008.
IntroductionThe rapid decline of amphibian populations is attributed to acomplex suite of natural and anthropogenic-induced envir-onmental challenges including, but not limited to, predation,resource availability, loss and degradation of habitat, inva-sive species, climate change and disease outbreaks. Theseabiotic and biotic factors interact in such a way that interspe-cific and intraspecific differences may be observed in
response to similar environmental threats (Blaustein andKiesecker, 2002; Hayes et al., 2010). Population levelresponses also can vary both spatially and temporally suchthat our understanding of population declines often cannotbe attributed to a single factor (Blaustein et al., 2011). Forexample, the recent emergence and spread of the amphibianfungal pathogen, Batrachochytrium dendrobatidis (Bd), hasled to mass mortalities of native amphibian populations glo-bally (Olson et al., 2013); however, population declines have
. . . . . . . . . . . . . . . . . . . . . . . . . . . . . . . . . . . . . . . . . . . . . . . . . . . . . . . . . . . . . . . . . . . . . . . . . . . . . . . . . . . . . . . . . . . . . . . . . . . . . . . . . . . . . . . . . . . . . . . . . . . . . . . . . . . . . . . . . . . . . . . . . . . . . . . . . . . . . .
1© The Author(s) 2018. Published by Oxford University Press and the Society for Experimental Biology.This is an Open Access article distributed under the terms of the Creative Commons Attribution License (http://creativecommons.org/licenses/by/4.0/), which permits unrestricted reuse, distribution, and reproduction in any medium, provided the original work is properly cited.

not been consistent across species, life stage or locations(Fisher et al., 2009; Searle et al., 2011). Therefore, it isimportant to understand how environmental conditionsimpact individuals, keying in on factors that may affect dis-ease susceptibility.
It is well known that chronic or repeated stressors cansuppress the immune system, affecting an individual’s suscep-tibility to pathogens. Stress also has been demonstrated toinhibit reproduction, promote severe protein loss (musclewasting), disrupt secondary cell messengers, cause neuronalcell malfunction and suppress growth (Sapolsky, 1992;Sapolsky et al., 2000; Wingfield, 2005; Wingfield andRomero, 2000; Boonstra, 2005). Psychological and/orphysiological stressors result in a cascade of hormonal eventsthat are initiated within the brain activating the hypothal-amus–pituitary–adrenal axis (HPA) or HP–interrenal (HPI)axis in amphibians (Rollins-Smith, 2017). First, a perceivedstressor results in the hypothalamus releases corticotrophin-releasing hormone, stimulating the anterior pituitary torelease adrenocorticotropic-releasing hormone (ACTH) intothe bloodstream where it travels to the adrenal/interrenalgland to cause the release of glucocorticoid (GC) hormones,including cortisol and/or corticosterone from the cortex(Reeder and Kramer, 2005). While GC production can bemeasured to evaluate how individuals are responding tostressors, the challenge is that capturing and restraining ani-mals often induces a stress response and can increase GCproduction rapidly, in under 5 min for some birds and smallmammals (Touma and Palme, 2005; Harper and Austad,2000; Mostl and Palme, 2002; Millsburgh and Washburn,2004). In order to reduce this effect, much of the previouswildlife endocrinological research employs non-invasive sam-pling, such as faecal collection (Monfort, 2003). Not onlydoes this type of sample collection minimally disturb the ani-mal, but faecal samples are a reflection of GCs that occurredover the previous 6–24 h and not from trapping and/orhandling, giving an accurate measure of an individual’sresponse to its environment.
In amphibians, rapid field collection of sufficient volumes offaecal material is unreliable such that current, established meth-ods for directly collecting stress hormones require either a blooddraw or urine collection (Kindermann et al., 2012; Narayanet al., 2010, 2013; Narayan and Hero, 2011). These methodsmay be invasive or not well adapted to field studies that requiresampling a large number of amphibians across sites. Other meth-ods for measuring amphibian stress require hour-long collectionperiods, such placing an amphibian into clean water then meas-uring hormone levels in the water (Gabor et al., 2013) or wholebody analysis, which requires euthanasia (Glennemeier andDenver, 2002; Barria et al., 2011), presenting a direct challengeto amphibian conservation projects. Because GCs can be pro-duced in a range of other sites besides the interrenal area,including skin (Zouboulis, 2004), we considered how inform-ative dermal swabs may be for understanding amphibian endo-crinology. Therefore, our goal was to develop an innovative
and non-invasive method to collect and measure amphibianGC production. Our specific objectives were to: (i) determine ifdermal swabs could be used to detect amphibian GC in aquatic,semi-aquatic and terrestrial amphibians; (ii) test if non-invasivedermal swabs could be applicable to field research; and (iii) testability to detect GCs across multiple life stages of amphibiansin the field.
Materials and methodsDermal swab methodWearing powder-free, latex gloves, we restrained amphibiansby, supporting the venter, with the swab collector’s fingersaround the sides of the body, making sure not to handle theportion of the mid-back where the skin was swabbed. Weimmediately swabbed the animal six times dorsally along themid-back, spanning ~2.54 cm (1 inch) long with a sterilecotton-tipped wood swab (Puritan Cotton-Tipped Applicators,#VWR 10 806-005), which had been pre-cut to ~4 cm. Thelength of the swabbing was kept consistent when swabbing allamphibians except if the animal was shorter than 2.54 cm;then, it was shortened, but kept consistent for that life-stagedepending on the species. We placed swabs in individuallylabelled 2.0ml tubes containing 1ml of 70% ethanol. We theninduced an acute stressor consisting of 5min of manualrestraint (in air or in water for fully aquatic species). Manualrestraint has been used to induce a mild acute stressor in amphi-bians for validation of plasma and urinary GC (Coddingtonand Cree, 1995; Narayan et al., 2010; Narayan, 2013).Following hand-restraint, we immediately collected a secondswab in the same manner and location as above, and thenrepeated the wood swab collection every 15min for 1 h fol-lowed by an additional hour where we collected samples everyhalf hour. This protocol resulted in a total of eight swabs: pre-stress, immediately following stressor (0min), 15, 30, 45, 60,90 and 120min post-stressor. All wood swabs were stored at5°C until processing.
Hand-restraint stress testTo determine if GC dermal swab sampling could detect anacute change in cortisol values to hand-restraint, we choseadults (n = 14 individuals) of eight species (n = 1–2 per species)housed at Lincoln Park Zoo (Chicago, IL), Northern IllinoisUniversity (Dekalb, IL), and Chicago Academy of Sciences(Chicago, IL) that represented different habitats and skin types.Species included green treefrogs (Hyla cinerea) as a semi-terres-trial/arboreal species, American toads (Anaxyrus americanus)as terrestrial with a high density of granular glands, northernleopard frogs (Lithobates pipiens) as semi-aquatic, axolotls(Ambystoma mexicanum) and a mudpuppy (Necturus maculosus)as fully aquatic, and adult red-spotted newts (Notophthalamusviridescens) as an aquatic species with a high density of granu-lar glands. Additional hand-restraint test swabs were submit-ted by collaborators from a captive-housed rough-skinnednewt (Taricha granulosa), cricket frogs (Acris crepitans) and
. . . . . . . . . . . . . . . . . . . . . . . . . . . . . . . . . . . . . . . . . . . . . . . . . . . . . . . . . . . . . . . . . . . . . . . . . . . . . . . . . . . . . . . . . . . . . . . . . . . . . . . . . . . . . . . . . . . . . . . . . . . . . . . . . . . . . . . . . . . . . . . . . . . . . . . . . . . . . .
2
. . . . . . . . . . . . . . . . . . . . . . . . . . . . . . . . . . . . . . . . . . . . . . . . . . . . . . . . . . . . . . . . . . . . . . . . . . . . . . . . . . . . . . . . . . . . . . . . . . . . . . . . . . . . . . . . . . . . . . . . . . . . . . . . . . . . . . . . . . . . . . . . . . . . . . . . . . . . . .Toolbox Conservation Physiology • Volume 6 2018

captive-housed larval and juvenile hellbenders (Cryptobranchusalleganiensis). All animal experiments conformed to the Guidefor Care and Use of Laboratory Animals and were approved bythe Lincoln Park Zoo Research Committee (Chicago, IL, USA).
ACTH challengeTo determine if GC dermal swab sampling could detect acutechanges in cortisol value from an ACTH challenge (andsaline injection as a control), we used two adult individualsfrom each of the following species: green treefrogs, Americantoads and red-spotted newts. In vertebrates, administeringACTH mimics the natural adrenal stress response by causinga rise in cortisol, which returns to baseline within a fewhours (Touma and Palme, 2005). Unfortunately, the sex ofthese individuals was unknown because these species are notsexually dimorphic and not in a breeding situation at thezoo. Using an ACTH challenge to test the utility of GC eva-luations has been used in other frog species to validate non-invasive measurements of stress hormones from urine andfaeces (Cikanek et al., 2014; Narayan et al., 2010). Theseauthors used a range of 1–5 individuals per treatment ofknown sex per treatment. Unfortunately, due to housing con-ditions at the zoo (large exhibits with multiple individuals),we could not collect biological samples, such as blood, urineor faeces.
The swabbing methodology for the ACTH challengeexperiment was identical to the protocol outlined aboveexcept instead of using a hand-restraint as the stressor,Lincoln Park Zoo veterinarians injected either ACTH or asaline control intraperitoneally (into the coelomic cavity atthe junction of the underbelly and thigh, away from the vitalorgans) using a 25-g needle after swabbing the site withNolvasan. ACTH was administered at 2.5 ul/g body mass;0.446 μg ACTH/g bodyweight in 100 μl saline vehicle (0.9%NaCL; Narayan et al., 2010) and saline was administered at100 μl 0.9% NaCL. Following the injection, we repeatedswabbing intervals post-injection for a total of eight swabs.
Field evaluationTo examine application of this technique for field cortisol sam-pling, we focused collection efforts on American bullfrogs (L.catesbeianus), green frogs (L. clamitans) and northern leopardfrogs. We opportunistically collected samples from several otherspecies of free-living amphibians including tiger salamanders(Ambystoma tigrinum), blue-spotted salamanders (A. laterale),spotted salamanders (A. maculatum), red-spotted newts, mud-puppies, spring peepers (Pseudacris crucifer), boreal chorusfrogs (Pseudacris maculata), American toads and wood frogs(L. sylvaticus). We swabbed both larval and adult L. clamitans,L. catesbeianus, L. pipiens, A. tigrinum, A. laterale and A.americanus to confirm that cutaneous GC could be detectedacross life stages. Pre-metamorphic larvae were gently held in apowder-free gloved hand and swabbed with light pressureacross the mid-dorsum, anterior to where the tail fin originates.
When working with smaller bodied animals, we adjusted swablength to approximately half an inch (~1.27 cm).
We captured wild amphibians either by Promar collapsibleminnow traps set the previous day or via dip-net. Within 3minof trap checks and wearing fresh gloves for each amphibian,we swabbed the dorsal side of each individual using the sameprotocol outlined above [i.e. six times dorsally, spanning~2.54 cm (1 inch) with a pre-cut, sterile cotton-tipped woodswab] and placed the wood swab in an individual 2ml tubecontaining 1ml of 70% ethanol. Typically, once amphibianswere in hand from the trap or the dip net, sample collectiontook <30 s and animals were released at the point of capture.We stored vials at 5°C until processing. To determine if corti-sol was detectable in the water, we collected pond water froma subset of our field sites (n = 5) throughout northeasternIllinois into 10ml vials.
Sample processing and hormonal analysisWe processed all samples at the Davee Centre forEpidemiology and Endocrinology (Lincoln Park Zoo, Chicago,IL). Sample vials containing the wood swab were shaken on amixer (Glas-col, Terre Haute, IN, USA; setting 60–70 rpm) for5min. Then, the wood swab was removed and 500 μl of sam-ple was pipetted into new, pre-labelled 15 × 75mm2 test tube.These aliquots were dried down under forced air in a warmwater bath at 60°C. Once dry, 2–3 glass beads were added toeach tube, then 500 μl of phosphate buffered saline (PBS; 0.2MNaH2PO4, 0.2M Na2HPO4, NaCl) was added. Tubes werevortexed briefly and sonicated for 20min. Samples were thenshaken again on the glas-col mixer (60–70 rpm) for 30minand stored at 5°C until analysis on an enzyme immunoassay(EIA). To analyse cortisol levels in the water, water sampleswere ran ‘neat’ on the EIA.
A cortisol EIA was used to measure GCs with the poly-clonal antiserum and HRP (R4866; provided by C. Munro,Davis, CA) used at a 1:8 500 and 1:20 000 dilution, respect-ively. Cross-reactivity to the cortisol antiserum has been previ-ously published (Munro and Stabenfeldt, 1984; Young et al.,2004; Loeding et al., 2011). The cortisol EIA was biochem-ically validated in the laboratory by demonstrating parallelismusing Pearson’s Product Moment correlation to compare therelationship of the parallelism between the cortisol standardsand serially diluted swab samples (2 × concentrated to 1:16)for all species separately (Table 1). For the percent recovery,we graphed a scatterplot of the observed over expected valuesof samples spiked with the cortisol standards and did linearregression to get the equation of the best fit line and R2 valuefor each species (Table 1). Assay sensitivity was 3.9 pg/welland intra- and inter-assay coefficients of variation were <15%.
To ensure the swab was not interfering with the cortisolresults, we placed the 4.0 cm wood swab with the cotton tipinto 1ml of 70% ethanol and repeated for a total of 50 swabs(i.e. blank swabs) and kept at room temperature overnight.
. . . . . . . . . . . . . . . . . . . . . . . . . . . . . . . . . . . . . . . . . . . . . . . . . . . . . . . . . . . . . . . . . . . . . . . . . . . . . . . . . . . . . . . . . . . . . . . . . . . . . . . . . . . . . . . . . . . . . . . . . . . . . . . . . . . . . . . . . . . . . . . . . . . . . . . . . . . . . .
3
. . . . . . . . . . . . . . . . . . . . . . . . . . . . . . . . . . . . . . . . . . . . . . . . . . . . . . . . . . . . . . . . . . . . . . . . . . . . . . . . . . . . . . . . . . . . . . . . . . . . . . . . . . . . . . . . . . . . . . . . . . . . . . . . . . . . . . . . . . . . . . . . . . . . . . . . . . . . . .Conservation Physiology • Volume 6 2018 Toolbox

Then, swabs were processed as above and analysed on the cor-tisol assay.
Furthermore, because some species of amphibians havebeen shown to produce skin peptides as a defense mechanismagainst disease, such as Bd (Woodhams et al., 2007), werepeated the percent recovery test with eight known Bd+and eight known Bd− frogs to ensure these peptides werenot interfering with the EIA results. We found no interfer-ence (Bd+: y = 0.9908x − 0.9887; R2 = 0.9997; P < 0.001;Bd−: y = 0.9911x + 0.8642; R2 = 0.9996; P < 0.001).
Data analysisTo determine the effect of the acute stressor on adrenocorti-cal activity and the time between HPI axis stimulation andpeak cortisol dermal secretions, we determined the absolutechange [i.e. the fold increase (Romero, 2004)] by calculatingthe quotient between the pre-stress samples and the peaksamples. For instance, a 1-fold increase above the pre-stressindicates no change in the HPA axis. We considered anytime point that was at or above 1.5-fold higher to acutechange in cortisol values. To determine if fold increase incortisol differed between individuals in response to the hand-restraint test, we used t-test, if data were normal (usingShapiro–Wilk for normality assumption testing and Levene’smedian test for equal variance assumption testing), or aMann Whitney Rank sum test if data were not normal.Then, for the three species (American toad, red-spotted newtand green treefrog) that had the three stress tests (ACTH,saline and hand-restraint), we compared fold changes in cor-tisol using an one-way ANOVA for normally distributeddata or Kruskal–Wallis ANOVA on ranks if data were notnormal (Schell et al., 2013). Correlation (parallelism) andlinear regression (percent recovery) for EIA biochemical ana-lysis were performed using Sigma Plot (2008, v 11; SystatSoftware, Inc., San Jose, CA, USA). Values are presented asmean ± SE. For field stress analysis, we used a Wilcoxonsigned-rank test to compare method of capture (e.g. dip-netvs. minnow trap) in adult frogs. All field data analyses wereperformed in RStudio (v 0.99.486). For all analyses, P <0.05 was considered significant.
ResultsLaboratory biochemical validationAll species passed the biochemical analysis of parallelism andpercent recovery except for the hellbender, which failed theparallelism test as cortisol was unmeasurable even at fourtimes concentration (Table 1). Because of this failure, werepeated the parallelism and percent recovery on our cortico-sterone EIA (CJM006; Santymire and Armstrong, 2010 forEIA details) and also were not able to measure cortico-sterone. Therefore, no further sampling and testing was con-ducted on this species.
For interference testing, we found that the blank 4.0 cmwood swabs with the cotton tip did produce measurable cor-tisol. Therefore we determined that 1.0 cm long swab pro-duced an average of 53.4 ± 3.1 pg/ml cortisol. Then, wemeasured all swabs in each sample to the nearest millimetreand subtracted the cortisol/stick value from all samples.
Hand-restraint testTerrestrial species
Both the green treefrogs 1 and 2 had similar (U = 16.0; P =0.318; range: 0.4–2.9-fold increase) fold increases in cortisolwith two peaks ranging from 506 to 834.8 pg/ml occurring0–90min post-restraint (Fig. 1A). For American toads 1 and2, fold increases in cortisol were similar (U = 21.0; P =0.710; range: 0.4–7.5-fold increase) and four time pointswere elevated from 430.0 to 2108.0 pg/ml occurring 15minthrough 120min post-restraint (Fig. 1B).
Semi-aquatic species
Both northern leopard frogs 1 and 2 experienced similarfold increases in cortisol (t = −1.13; P = 0.279; range:0.4–2.0-fold increase) with at least one peak ranging from645.4 to 817.2 pg/ml post-restraint that was greater than 1.5-fold higher than pre-stress cortisol (327.3 and 408.6 pg/ml;Fig. 1C). For the cricket frogs, changes in cortisol varied (U =2.0; P = 0.002) between the two individuals. Cricket frog 1had an elevated (3.0-fold higher) pre-stress value (1993.4 pg/mlcortisol) compared to cricket frog 2 (659.2 pg/ml cortisol) andnever demonstrated cortisol values above pre-stress value.However, cricket frog 2 had a 2-fold increase post-restraintand had elevated values from 1053.9 to 2275.6 pg/ml cortisoloccurring 60 through 120min post-restraint stress (Fig. 1D).
Aquatic species
The two axolotl individuals had a similar (t = −0.99; P =0.341; range: 0.3–2.0-fold increase) change in cortisol overtime. Specifically, Axolotl 1 never had a cortisol value over1.5-fold the pre-stress value (549.5 pg/ml cortisol); however,axolotl 2 had one peak >1.5-fold higher than the pre-stressvalue (431.7 pg/ml cortisol) that occurred 60min post-restraint stress (861.6 pg/ml cortisol; Fig. 1E). For red-spotted newt 1 and 2, change in cortisol was similar (t =−0.84; P = 0.934; range: 0.3–3.0-fold increase) and peaksexceeded the pre-stress value (425.0 and 238.3 pg/ml corti-sol, respectively) by >1.5-fold occurring at 0 and 45min and15, 45 and 60min post-restraint, respectively (Fig. 1F). Therough-skinned newt demonstrated peaks from the initial pre-stress value (348.8 pg/ml cortisol) at 0 and 15min and thenfrom 45 through 120min post-restraint stress (Fig. 1G). Themudpuppy demonstrated one peak (1078.5 pg/ml cortisol) at120min post-restraint stress (Fig. 1H). Finally, we wereunable to recover measurable cortisol from the hellbendersamples even with concentrating the neat samples up to fourtimes.
. . . . . . . . . . . . . . . . . . . . . . . . . . . . . . . . . . . . . . . . . . . . . . . . . . . . . . . . . . . . . . . . . . . . . . . . . . . . . . . . . . . . . . . . . . . . . . . . . . . . . . . . . . . . . . . . . . . . . . . . . . . . . . . . . . . . . . . . . . . . . . . . . . . . . . . . . . . . . .
4
. . . . . . . . . . . . . . . . . . . . . . . . . . . . . . . . . . . . . . . . . . . . . . . . . . . . . . . . . . . . . . . . . . . . . . . . . . . . . . . . . . . . . . . . . . . . . . . . . . . . . . . . . . . . . . . . . . . . . . . . . . . . . . . . . . . . . . . . . . . . . . . . . . . . . . . . . . . . . .Toolbox Conservation Physiology • Volume 6 2018

Acute ACTH challenge stress testFor the green treefrogs, pre-stress values were 426.7 and89.0 pg/ml for saline-injected and ACTH-injected individuals,respectively (Fig. 2A). For the saline-injected green treefrog, a2-fold increase in cutaneous cortisol levels (1056.4 pg/ml)occurred at immediately post-injection. The ACTH-injectedgreen treefrog had elevated cortisol levels (from 2.9- up to 66.4-fold increase) starting 15min (478.3 pg/ml) through 120min(341.8 pg/ml) with the peak of 66.4-fold increase (5905.1 pg/ml) at 90min post-injection. Subsequently, this individual wasfound dead the following day. Necropsy determined death wasnot directly attributed to the procedure and with no outwardlysigns of poor health, but may have been a complication of apre-existing condition. The green treefrog sex was determinedto be male during the necropsy. When comparing the foldchange in cortisol across the ACTH, saline and hand-restraint,the fold-increase post-ACTH (12.64 ± 0.14) was higher (H3 =14.02; P = 0.003) than the saline (1.09 ± 0.28) and two hand-restraint individuals (green treefrog 1, 1.56 ± 0.28; green tree-frog 2, 1.29 ± 0.35).
For the American toads, pre-stress cortisol values for thesaline-injected and ACTH-injected individual were 527.0 and111.4 pg/ml, respectively (Fig. 2B). The saline-injected Americantoad had no change in cortisol over the entire testing time; how-ever, the pre-stress sample was nearly five times the value of theACTH-injected individual. And cortisol values did drop from1.9 to 17.5-fold lower than the pre-stress value between 0 and
90min. It was back up to pre-stress value at 120min post-saline injection (Fig. 2B). The ACTH-injected American toadhad a 2.5-fold increase (279.9 pg/ml) at 0min and 4.9-foldincrease (549.4 pg/ml) at 15min. Cortisol values then returnedto pre-stress values at 30min, but became elevated again(2.8–8.1-fold increase) at 45min and remained elevatedthrough 120min post-ACTH injection. The change in cortisolwas lower (H3 = 12.99; P = 0.005) in the saline treatment(0.45 ± 0.14), than ACTH (4.3 ± 0.98) and two hand-restraintindividuals (American toad 1, 2.21 ± 0.72; American toad 2,2.50 ± 0.90).
For the aquatic red-spotted newt, pre-stress values were208.9 and 148.1 pg/ml for the saline- and ACTH-injectedindividuals, respectively (Fig. 2C). The saline-injected indi-vidual had a cortisol increase at least 1.9-fold or higher at 0,60 and 120min post-injection. The ACTH-injected individ-ual had a 3.5-fold increase at 30min, 1.9-fold increase at60min and 2.3-fold increase at 120min post-injection. Thechange in cortisol did not vary (F3,24 = 0.223; P = 0.879)across the three stress tests (1.34 ± 0.17).
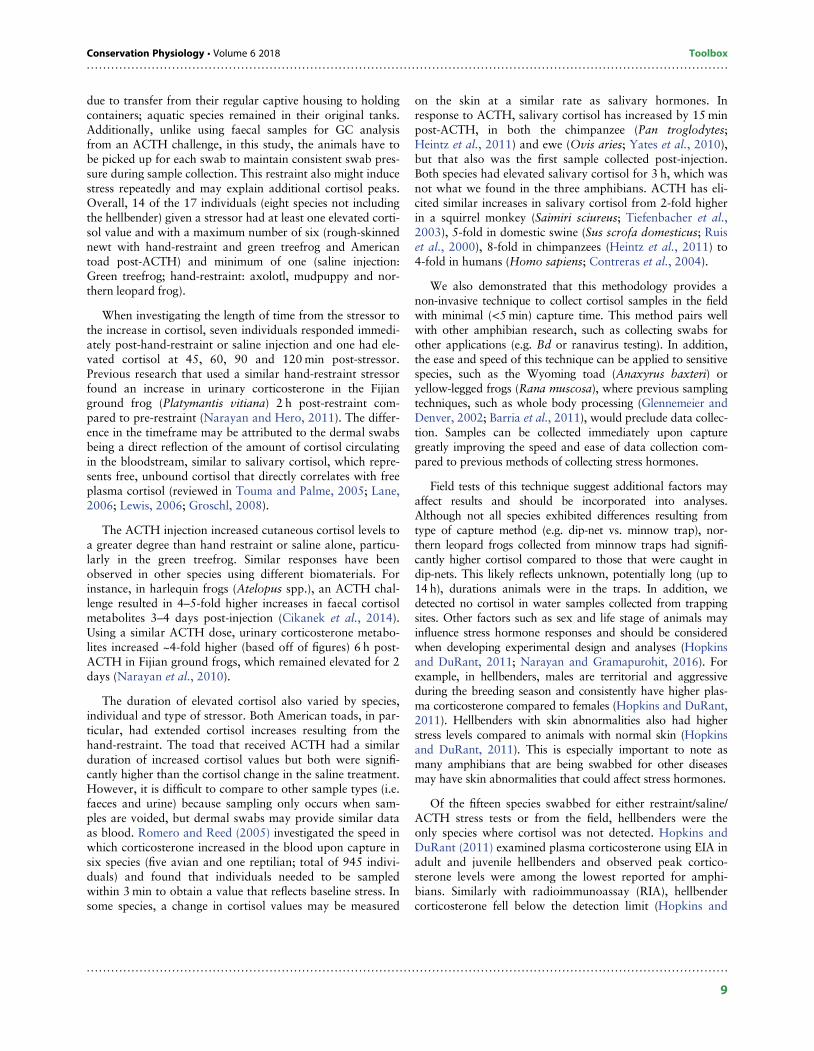
Detection of cutaneous cortisol in wildamphibiansWe successfully detected cortisol from all species collected inthe field (Table 2). However, because we collected data fromanimals that were trapped in minnow traps for an unknownbut possibly extended period of time, along with those that
Table 1: Biochemical validation for cortisol enzyme immunoassay for all species used for validation and field research
Habitat Species Study Location Parallelisma Percent recoveryb
Terrestrial Green treefrog Validation; field Captive; wild 0.996 y = 0.891x + 3.389; R2 = 0.997; P < 0.001
American toad Validation; field Captive; wild 0.988 y = 0.985x + 0.207; R2 = 0.990; P < 0.001
Semi-aquatic Northern leopard frog Validation; field Captive; wild 0.993 y = 0.887x + 0.113; R2 = 0.999; P < 0.001
Cricket frog Validation Wild 0.993 y = 1.180x + 0.798; R2 = 0.995; P < 0.001
Aquatic Axolotl Validation Captive 0.997 y = 0.833x + 6.262; R2 = 0.993; P < 0.001
Red-spotted newt Validation Captive 0.963 y = 0.887x + 0.113; R2 = 0.999; P < 0.001
Mudpuppy Validation Captive 0.992 y = 0.985x + 0.827; R2 = 0.999; P < 0.001
American Bullfrog Field Wild 0.991 y = 1.160x + 2.823; R2 = 0.999; P < 0.001
Green frog Field Wild 0.996 y = 0.891x + 3.389; R2 = 0.997; P < 0.001
Western chorus frog Field Wild 0.985 y = 0.834x + 0.903; R2 = 0.999; P < 0.001
Spring peeper Field Wild 0.995 y = 1.176x + 0.422; R2 = 0.999; P < 0.001
Tiger salamander Field Wild 0.993 y = 1.150x + 0.485; R2 = 0.998; P < 0.001
Rough-skinned newt Validation Captive 0.996 y = 0.834x + 0.903; R2 = 0.999; P < 0.001
Blue-spotted salamander Field Wild 0.997 y = 1.020x + 1.500; R2 = 0.999; P < 0.001
Hellbender Validation Captive 0.751 y = 1.005x + 0.641; R2 = 0.999; P < 0.001
aParallelism compares the relationship between cortisol standards and serially diluted swab samples (2× concentrated to 1:16) separately for all species calculatedusing Pearson’s Product Moment correlation.bPercent recovery calculated as a best fit line using a linear regression of observed over expected values when known amounts of cortisol standard is added to a sample.
. . . . . . . . . . . . . . . . . . . . . . . . . . . . . . . . . . . . . . . . . . . . . . . . . . . . . . . . . . . . . . . . . . . . . . . . . . . . . . . . . . . . . . . . . . . . . . . . . . . . . . . . . . . . . . . . . . . . . . . . . . . . . . . . . . . . . . . . . . . . . . . . . . . . . . . . . . . . . .
5
. . . . . . . . . . . . . . . . . . . . . . . . . . . . . . . . . . . . . . . . . . . . . . . . . . . . . . . . . . . . . . . . . . . . . . . . . . . . . . . . . . . . . . . . . . . . . . . . . . . . . . . . . . . . . . . . . . . . . . . . . . . . . . . . . . . . . . . . . . . . . . . . . . . . . . . . . . . . . .Conservation Physiology • Volume 6 2018 Toolbox

Figure 1: Cortisol (pg/ml swab) response after a 5 min of hand restraint in green treefrogs (A), American toads (B), Northern leopard frogs (C),cricket frogs (D), axolotls (E), red-spotted newts (F), rough-skinned newt (G) and mudpuppy (H). Pre-stress values (dashed lines) were takenprior to the stressor and 0min represent sample taken immediately after stressor concluded.
. . . . . . . . . . . . . . . . . . . . . . . . . . . . . . . . . . . . . . . . . . . . . . . . . . . . . . . . . . . . . . . . . . . . . . . . . . . . . . . . . . . . . . . . . . . . . . . . . . . . . . . . . . . . . . . . . . . . . . . . . . . . . . . . . . . . . . . . . . . . . . . . . . . . . . . . . . . . . .
6
. . . . . . . . . . . . . . . . . . . . . . . . . . . . . . . . . . . . . . . . . . . . . . . . . . . . . . . . . . . . . . . . . . . . . . . . . . . . . . . . . . . . . . . . . . . . . . . . . . . . . . . . . . . . . . . . . . . . . . . . . . . . . . . . . . . . . . . . . . . . . . . . . . . . . . . . . . . . . .Toolbox Conservation Physiology • Volume 6 2018

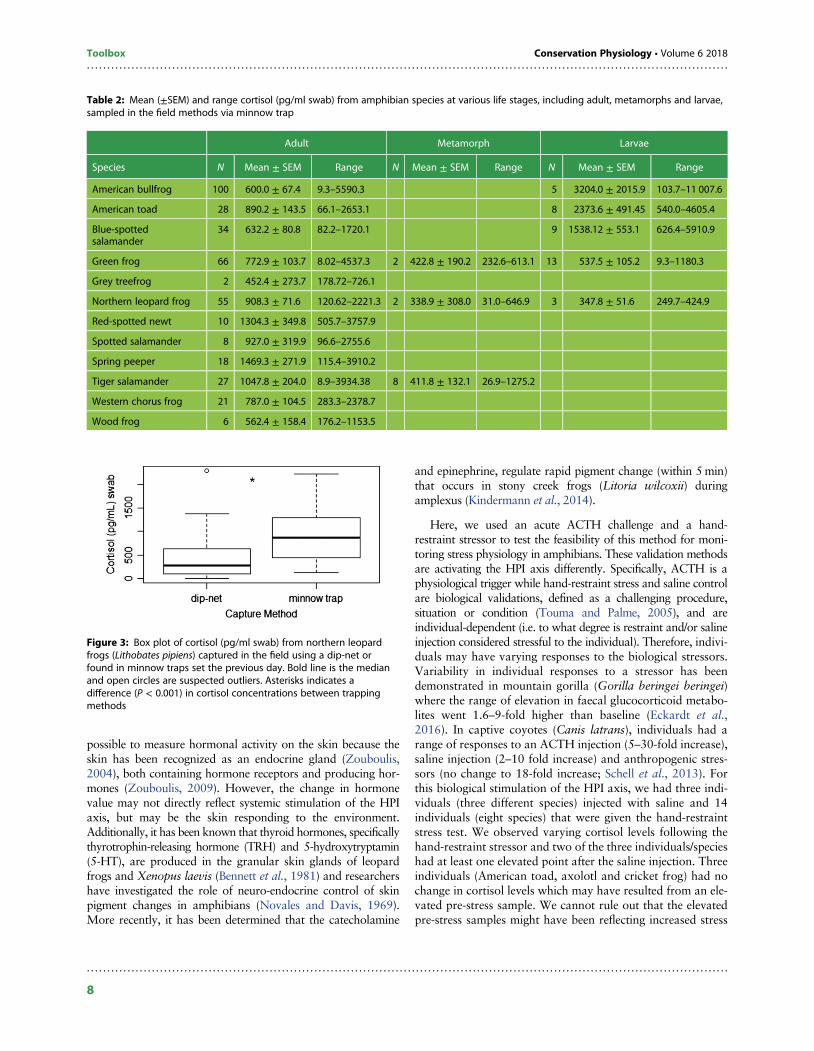
were swabbed immediately after being caught in a dip-net,we compared capture type using adults of our targeted spe-cies. We collected a total of 138 green frogs (72 dip-net, 66minnow trap), 131 American bullfrogs (31 dip-net, 100 min-now trap) and 99 northern leopard frogs (44 dip-net, 55minnow trap). We did not detect a difference in capturemethods for green frogs (H = 0.84; P = 0.36) or Americanbullfrogs (H = 0.87; P = 0.35). However, cortisol valuesfrom adult northern leopard frogs captured in minnow trapswere higher (H = 24.02, P < 0.001) than samples collectedby dip-nets (Fig. 3). We successfully extracted cortisol fromspecies in which metamorphs and larvae were captured(Table 2). No cortisol was detectable in the water samples.
DiscussionIn this study, we have taken the first steps in developing a novel,non-invasive method that uses dermal swabs to detect stresshormones in a variety of amphibians from terrestrial to fullyaquatic species. While previous methods utilize collection ofbiological samples in the form of blood, faeces, whole body,urine and aquatic media (Glennemeier and Denver, 2002; Barriaet al., 2011; Kindermann et al., 2012; Narayan et al., 2010,2013; Narayan and Hero, 2011; Gabor et al., 2013), this is thefirst time a dermal swab has been successfully used in detectingcutaneous cortisol from captive and wild amphibians. It may be
Figure 2: Cortisol (pg/ml swab) response after an ACTH or saline (as a control) injection in green treefrogs (A), American toads (B) and red-spotted newts (C). Pre-stress values (dashed lines) were taken prior to the injection and 0min represent sample taken immediately afterwards
. . . . . . . . . . . . . . . . . . . . . . . . . . . . . . . . . . . . . . . . . . . . . . . . . . . . . . . . . . . . . . . . . . . . . . . . . . . . . . . . . . . . . . . . . . . . . . . . . . . . . . . . . . . . . . . . . . . . . . . . . . . . . . . . . . . . . . . . . . . . . . . . . . . . . . . . . . . . . .
7
. . . . . . . . . . . . . . . . . . . . . . . . . . . . . . . . . . . . . . . . . . . . . . . . . . . . . . . . . . . . . . . . . . . . . . . . . . . . . . . . . . . . . . . . . . . . . . . . . . . . . . . . . . . . . . . . . . . . . . . . . . . . . . . . . . . . . . . . . . . . . . . . . . . . . . . . . . . . . .Conservation Physiology • Volume 6 2018 Toolbox
possible to measure hormonal activity on the skin because theskin has been recognized as an endocrine gland (Zouboulis,2004), both containing hormone receptors and producing hor-mones (Zouboulis, 2009). However, the change in hormonevalue may not directly reflect systemic stimulation of the HPIaxis, but may be the skin responding to the environment.Additionally, it has been known that thyroid hormones, specificallythyrotrophin-releasing hormone (TRH) and 5-hydroxytryptamin(5-HT), are produced in the granular skin glands of leopardfrogs and Xenopus laevis (Bennett et al., 1981) and researchershave investigated the role of neuro-endocrine control of skinpigment changes in amphibians (Novales and Davis, 1969).More recently, it has been determined that the catecholamine
and epinephrine, regulate rapid pigment change (within 5min)that occurs in stony creek frogs (Litoria wilcoxii) duringamplexus (Kindermann et al., 2014).
Here, we used an acute ACTH challenge and a hand-restraint stressor to test the feasibility of this method for moni-toring stress physiology in amphibians. These validation methodsare activating the HPI axis differently. Specifically, ACTH is aphysiological trigger while hand-restraint stress and saline controlare biological validations, defined as a challenging procedure,situation or condition (Touma and Palme, 2005), and areindividual-dependent (i.e. to what degree is restraint and/or salineinjection considered stressful to the individual). Therefore, indivi-duals may have varying responses to the biological stressors.Variability in individual responses to a stressor has beendemonstrated in mountain gorilla (Gorilla beringei beringei)where the range of elevation in faecal glucocorticoid metabo-lites went 1.6–9-fold higher than baseline (Eckardt et al.,2016). In captive coyotes (Canis latrans), individuals had arange of responses to an ACTH injection (5–30-fold increase),saline injection (2–10 fold increase) and anthropogenic stres-sors (no change to 18-fold increase; Schell et al., 2013). Forthis biological stimulation of the HPI axis, we had three indi-viduals (three different species) injected with saline and 14individuals (eight species) that were given the hand-restraintstress test. We observed varying cortisol levels following thehand-restraint stressor and two of the three individuals/specieshad at least one elevated point after the saline injection. Threeindividuals (American toad, axolotl and cricket frog) had nochange in cortisol levels which may have resulted from an ele-vated pre-stress sample. We cannot rule out that the elevatedpre-stress samples might have been reflecting increased stress
Table 2: Mean (±SEM) and range cortisol (pg/ml swab) from amphibian species at various life stages, including adult, metamorphs and larvae,sampled in the field methods via minnow trap
Adult Metamorph Larvae
Species N Mean ± SEM Range N Mean ± SEM Range N Mean ± SEM Range
American bullfrog 100 600.0 ± 67.4 9.3–5590.3 5 3204.0 ± 2015.9 103.7–11 007.6
American toad 28 890.2 ± 143.5 66.1–2653.1 8 2373.6 ± 491.45 540.0–4605.4
Blue-spottedsalamander
34 632.2 ± 80.8 82.2–1720.1 9 1538.12 ± 553.1 626.4–5910.9
Green frog 66 772.9 ± 103.7 8.02–4537.3 2 422.8 ± 190.2 232.6–613.1 13 537.5 ± 105.2 9.3–1180.3
Grey treefrog 2 452.4 ± 273.7 178.72–726.1
Northern leopard frog 55 908.3 ± 71.6 120.62–2221.3 2 338.9 ± 308.0 31.0–646.9 3 347.8 ± 51.6 249.7–424.9
Red-spotted newt 10 1304.3 ± 349.8 505.7–3757.9
Spotted salamander 8 927.0 ± 319.9 96.6–2755.6
Spring peeper 18 1469.3 ± 271.9 115.4–3910.2
Tiger salamander 27 1047.8 ± 204.0 8.9–3934.38 8 411.8 ± 132.1 26.9–1275.2
Western chorus frog 21 787.0 ± 104.5 283.3–2378.7
Wood frog 6 562.4 ± 158.4 176.2–1153.5
Figure 3: Box plot of cortisol (pg/ml swab) from northern leopardfrogs (Lithobates pipiens) captured in the field using a dip-net orfound in minnow traps set the previous day. Bold line is the medianand open circles are suspected outliers. Asterisks indicates adifference (P < 0.001) in cortisol concentrations between trappingmethods
. . . . . . . . . . . . . . . . . . . . . . . . . . . . . . . . . . . . . . . . . . . . . . . . . . . . . . . . . . . . . . . . . . . . . . . . . . . . . . . . . . . . . . . . . . . . . . . . . . . . . . . . . . . . . . . . . . . . . . . . . . . . . . . . . . . . . . . . . . . . . . . . . . . . . . . . . . . . . .
8
. . . . . . . . . . . . . . . . . . . . . . . . . . . . . . . . . . . . . . . . . . . . . . . . . . . . . . . . . . . . . . . . . . . . . . . . . . . . . . . . . . . . . . . . . . . . . . . . . . . . . . . . . . . . . . . . . . . . . . . . . . . . . . . . . . . . . . . . . . . . . . . . . . . . . . . . . . . . . .Toolbox Conservation Physiology • Volume 6 2018
due to transfer from their regular captive housing to holdingcontainers; aquatic species remained in their original tanks.Additionally, unlike using faecal samples for GC analysisfrom an ACTH challenge, in this study, the animals have tobe picked up for each swab to maintain consistent swab pres-sure during sample collection. This restraint also might inducestress repeatedly and may explain additional cortisol peaks.Overall, 14 of the 17 individuals (eight species not includingthe hellbender) given a stressor had at least one elevated corti-sol value and with a maximum number of six (rough-skinnednewt with hand-restraint and green treefrog and Americantoad post-ACTH) and minimum of one (saline injection:Green treefrog; hand-restraint: axolotl, mudpuppy and nor-thern leopard frog).
When investigating the length of time from the stressor tothe increase in cortisol, seven individuals responded immedi-ately post-hand-restraint or saline injection and one had ele-vated cortisol at 45, 60, 90 and 120min post-stressor.Previous research that used a similar hand-restraint stressorfound an increase in urinary corticosterone in the Fijianground frog (Platymantis vitiana) 2 h post-restraint com-pared to pre-restraint (Narayan and Hero, 2011). The differ-ence in the timeframe may be attributed to the dermal swabsbeing a direct reflection of the amount of cortisol circulatingin the bloodstream, similar to salivary cortisol, which repre-sents free, unbound cortisol that directly correlates with freeplasma cortisol (reviewed in Touma and Palme, 2005; Lane,2006; Lewis, 2006; Groschl, 2008).
The ACTH injection increased cutaneous cortisol levels toa greater degree than hand restraint or saline alone, particu-larly in the green treefrog. Similar responses have beenobserved in other species using different biomaterials. Forinstance, in harlequin frogs (Atelopus spp.), an ACTH chal-lenge resulted in 4–5-fold higher increases in faecal cortisolmetabolites 3–4 days post-injection (Cikanek et al., 2014).Using a similar ACTH dose, urinary corticosterone metabo-lites increased ~4-fold higher (based off of figures) 6 h post-ACTH in Fijian ground frogs, which remained elevated for 2days (Narayan et al., 2010).
The duration of elevated cortisol also varied by species,individual and type of stressor. Both American toads, in par-ticular, had extended cortisol increases resulting from thehand-restraint. The toad that received ACTH had a similarduration of increased cortisol values but both were signifi-cantly higher than the cortisol change in the saline treatment.However, it is difficult to compare to other sample types (i.e.faeces and urine) because sampling only occurs when sam-ples are voided, but dermal swabs may provide similar dataas blood. Romero and Reed (2005) investigated the speed inwhich corticosterone increased in the blood upon capture insix species (five avian and one reptilian; total of 945 indivi-duals) and found that individuals needed to be sampledwithin 3min to obtain a value that reflects baseline stress. Insome species, a change in cortisol values may be measured
on the skin at a similar rate as salivary hormones. Inresponse to ACTH, salivary cortisol has increased by 15minpost-ACTH, in both the chimpanzee (Pan troglodytes;Heintz et al., 2011) and ewe (Ovis aries; Yates et al., 2010),but that also was the first sample collected post-injection.Both species had elevated salivary cortisol for 3 h, which wasnot what we found in the three amphibians. ACTH has eli-cited similar increases in salivary cortisol from 2-fold higherin a squirrel monkey (Saimiri sciureus; Tiefenbacher et al.,2003), 5-fold in domestic swine (Sus scrofa domesticus; Ruiset al., 2000), 8-fold in chimpanzees (Heintz et al., 2011) to4-fold in humans (Homo sapiens; Contreras et al., 2004).
We also demonstrated that this methodology provides anon-invasive technique to collect cortisol samples in the fieldwith minimal (<5min) capture time. This method pairs wellwith other amphibian research, such as collecting swabs forother applications (e.g. Bd or ranavirus testing). In addition,the ease and speed of this technique can be applied to sensitivespecies, such as the Wyoming toad (Anaxyrus baxteri) oryellow-legged frogs (Rana muscosa), where previous samplingtechniques, such as whole body processing (Glennemeier andDenver, 2002; Barria et al., 2011), would preclude data collec-tion. Samples can be collected immediately upon capturegreatly improving the speed and ease of data collection com-pared to previous methods of collecting stress hormones.
Field tests of this technique suggest additional factors mayaffect results and should be incorporated into analyses.Although not all species exhibited differences resulting fromtype of capture method (e.g. dip-net vs. minnow trap), nor-thern leopard frogs collected from minnow traps had signifi-cantly higher cortisol compared to those that were caught indip-nets. This likely reflects unknown, potentially long (up to14 h), durations animals were in the traps. In addition, wedetected no cortisol in water samples collected from trappingsites. Other factors such as sex and life stage of animals mayinfluence stress hormone responses and should be consideredwhen developing experimental design and analyses (Hopkinsand DuRant, 2011; Narayan and Gramapurohit, 2016). Forexample, in hellbenders, males are territorial and aggressiveduring the breeding season and consistently have higher plas-ma corticosterone compared to females (Hopkins and DuRant,2011). Hellbenders with skin abnormalities also had higherstress levels compared to animals with normal skin (Hopkinsand DuRant, 2011). This is especially important to note asmany amphibians that are being swabbed for other diseasesmay have skin abnormalities that could affect stress hormones.
Of the fifteen species swabbed for either restraint/saline/ACTH stress tests or from the field, hellbenders were theonly species where cortisol was not detected. Hopkins andDuRant (2011) examined plasma corticosterone using EIA inadult and juvenile hellbenders and observed peak cortico-sterone levels were among the lowest reported for amphi-bians. Similarly with radioimmunoassay (RIA), hellbendercorticosterone fell below the detection limit (Hopkins and
. . . . . . . . . . . . . . . . . . . . . . . . . . . . . . . . . . . . . . . . . . . . . . . . . . . . . . . . . . . . . . . . . . . . . . . . . . . . . . . . . . . . . . . . . . . . . . . . . . . . . . . . . . . . . . . . . . . . . . . . . . . . . . . . . . . . . . . . . . . . . . . . . . . . . . . . . . . . . .
9
. . . . . . . . . . . . . . . . . . . . . . . . . . . . . . . . . . . . . . . . . . . . . . . . . . . . . . . . . . . . . . . . . . . . . . . . . . . . . . . . . . . . . . . . . . . . . . . . . . . . . . . . . . . . . . . . . . . . . . . . . . . . . . . . . . . . . . . . . . . . . . . . . . . . . . . . . . . . . .Conservation Physiology • Volume 6 2018 Toolbox

DuRant, 2011). This illustrates that species must be individu-ally evaluated for a variety of GCs and sampling techniques.
Non-invasive endocrine monitoring in amphibians hasvastly improved our understanding of amphibian health andwelfare, reproduction, and response to stressors (Narayan andHero, 2013). In this study, we present a novel and rapid sam-pling protocol for monitoring stress physiology in severalamphibian species. This is the first steps in validating this meth-od but further testing is needed. For example, we observedvariation in timing (from 0 to 120min post-stressor) when cor-tisol increased on the skin. This could be attributed to differ-ences in species as far as the habitat it lives in (e.g. arboreal vs.fully aquatic) and/or dermal anatomy and physiology. It alsocould be a reflection of the individual’s experience with humanhandling. We also observed various cortisol concentrationchanges from no change (three species; two hand-restraintstress and one saline injection) to a maximum of 66-foldincrease. Another consideration was that we only knew the sexof one individual (male green treefrog that died since sex wasdetermined at the necropsy) and it is known that males andfemales can respond to behavioural and physiological stressorsdifferently (reviewed in Touma and Palme, 2005; Fijianground frogs, Narayan et al., 2010). Unless species are sexuallydimorphic and/or in breeding condition, it may be difficultand/or too invasive to determine sex in the field, but may beimportant to consider for future studies. Next steps for furthervalidation would be to collect other samples, such as blood,urine or faeces that can support the dermal changes followingan ACTH or other acute stressor. Also, because corticosteroneis the predominant GC in amphibians (Leboulenger et al.,1986; Kloas and Hanke, 1990), future tests should comparethe results of both GCs. Additionally, because ACTH injec-tions have elicited increases in plasma (Jurani et al., 1973) andurine (Narayan et al., 2010) cortisol <1 h and 2 days, respect-ively, cutaneous sampling should be tested for a longer than2 h to confirm the lag time between a stressor and increases ofcutaneous cortisol. Most importantly, samples should be col-lected consistently, including how the swab is applied to theanimal, to ensure more or less cortisol is not picked up byswab. Additionally, circadian patterns of GCs should be con-sidered when taking samples from diurnal versus nocturnal spe-cies since most species have a daily pattern of GC (reviewed inTouma and Palme, 2005). Although we did not detect any‘background’ cortisol in the water, there is still a possible con-tamination issue particularly in a closed system like an aquar-ium; faeces collected in the water may be contaminated and theanimal’s skin has been in contact with the water and may bedamp. Future studies will have to take this into considerationand ensure pond water on frogs or salamanders is not contam-inating the swab. Finally, we suggest using plastic swabs insteadof wood to ensure no background levels of cortisol.
Even though this technique needs further validation, itdoes greatly increase the potential to integrate questionsregarding the health and stress of amphibians and improveour understanding of how environmental changes such as
noise pollution, contaminants, invasive species and habitatalterations impact amphibian health. It is also recognized thatlong-term stress can inhibit both reproduction and immunityleading to decreased reproductive fitness and increased suscep-tibility to diseases. The global threat of diseases such as rana-virus and Bd has led to massive field efforts. We suggest thatadding a quick stress swab alongside disease swabs will allowresearchers to explore additional factors ultimately leading tomortality and population declines. Such a non-invasive andrapid technique for measuring hormones is needed now morethan ever for global amphibian conservation. Finally this meth-od has application to more than amphibians and is currentlybeing used to monitor reproductive hormones in zoo-housedpygmy hippopotamuses (Choeropsis liberiensis) and is beingdeveloped for fish (Santymire pers. communication).
AcknowledgementsWe thank Michelle Gizowski, Lisa Raimondi and Pat Wolfffor their assistance in the field. Erin Kennison, Greg Lipps,Tyler Hoskins and Danielle Nelson provided additional fieldtest samples. All research was approved by the IllinoisDepartment of Natural Resources Permit and was conductedin accordance with Lincoln Park Zoo IACUC guidelines. Wethank collaborating agencies including McHenry CountyConservation District, Boone County Conservation District,Forest Preserve District of DuPage County, Forest PreserveDistrict of Kane County, Forest Preserve District of CookCounty and Illinois Nature Preserve Commission.
FundingThis work was supported by Grant Healthcare Foundation,The Davee Foundation, Christine Stevens Animal WelfareInstitute’s Wildlife grant and Lake County Forest PreserveDistrict.
ReferencesBarria MA, Telling GC, Gambetti P, Mastrianni JA, Soto C (2011)
Generation of a new form of human PrP(Sc) in vitro by interspeciestransmission from cervid prions. J Biol Chem 286: 7490–7495.
Bennett GW, Balls M, Clothier RH, Marsden CA, Robinson G, Wemyss-Holden GD (1981) Location and release of TRH and 5-HT fromamphibian skin. Cell Biol Int Rep 5(2): 151–8.
Blaustein AR, Han BA, Relyea RA, Johnson PTJ, Buck JC, Gervasi SS,Kats LB (2011) The complexity of amphibian population declines:understanding the role of cofactors in driving amphibian losses.Ann N Y Acad Sci 1223: 108–119.
Blaustein AR, Kiesecker JM (2002) Complexity in conservation: lessons fromthe global decline of amphibian populations. Ecol Lett 5: 597–608.
Boonstra R (2005) Equipped for life: the adaptive role of the stressaxis in male mammals. J Mammal 86: 236–247.
. . . . . . . . . . . . . . . . . . . . . . . . . . . . . . . . . . . . . . . . . . . . . . . . . . . . . . . . . . . . . . . . . . . . . . . . . . . . . . . . . . . . . . . . . . . . . . . . . . . . . . . . . . . . . . . . . . . . . . . . . . . . . . . . . . . . . . . . . . . . . . . . . . . . . . . . . . . . . .
10
. . . . . . . . . . . . . . . . . . . . . . . . . . . . . . . . . . . . . . . . . . . . . . . . . . . . . . . . . . . . . . . . . . . . . . . . . . . . . . . . . . . . . . . . . . . . . . . . . . . . . . . . . . . . . . . . . . . . . . . . . . . . . . . . . . . . . . . . . . . . . . . . . . . . . . . . . . . . . .Toolbox Conservation Physiology • Volume 6 2018

Cikanek SJ, Nockold S, Brown JL, Carpenter JW, Estrada A, Guerrel J, HopeK, Ibáñez R, Putman SB, Gratwicke B (2014) Evaluating group housingstrategies for the ex-situ conservation of harlequin frogs (Atelopusspp.) using behavioral and physiological indicators. PLoS One 9: 1–6.
Coddington EJ, Cree A (1995) Effect of acute captivity stress on plas-ma concentrations of corticosterone and sex steroids in femaleWhistling frogs, Litoria ewingi. Gen Comp Endocr 100: 33–38.
Contreras L, Arreger A, Persi G, Gonzalez N, Cardoso E (2004) A newless-invasive and more informative low-dose ACTH test: salivarysteroids in response to intramuscular corticotrophin. ClinEndocrinol 61: 675–682.
Eckardt W, Stoinski TS, Rosenbaum S, Umuhoza MR, Santymire R(2016) Validating faecal glucocorticoid metabolite analysis in theVirunga mountain gorilla using a natural biological stressor.Conserv Physiol 4(1): cow029. doi:10.1093/conphys/cow029.
Fisher MC, Garner TWJ, Walker SF (2009) Global emergence ofBatrachochytrium dendrobatidis and amphibian chytridiomycosis inspace, time, and host. Ann Rev Microbiol 63: 291–310.
Gabor CR, Fisher MC, Bosch J (2013) A non-invasive stress assay showsthat tadpole populations infected with Batrachochytrium dendro-batidis have elevated corticosterone levels. PLoS One 8: e56054.
Glennemeier K, Denver RJ (2002) Role for corticoids in mediating theresponse of Rana pipiens tadples to interspecfic condition. J ExpZool 292: 32–40.
Groschl M (2008) Current status of salivary hormone analysis. ClinChem 54: 1759–1769.
Harper J, Austad S (2000) Fecal glucocorticoids: a noninvasive methodof measuring adrenal activity in wild and captive rodents. PhysiolBiochem Zool 73: 12–22.
Hayes TB, Falso P, Gallipeau S, Stice M (2010) The cause of globalamphibian declines: a developmental endocrinologist’s perspec-tive. J Exp Zool 213: 921–933.
Heintz M, Santymire R, Parr L, Lonsdorf E. (2011) Validation of cortisolenzyme immunoassay and characterization of salivary cortisol cir-cadian rhythm in chimpanzees (Pan troglodytes). Am J Primatol 73:903–908.
Hopkins WA, DuRant SE (2011) Innate immunity and stress physiology ofeastern hellbenders (Cryptobranchus alleganiensis) from two streamreaches with differing habitat quality. Gen Comp Endocr 174: 107–115.
Jurani M, Murgas K, Mikulaj L, Babusiko F (1973) Effect of stress andenvironmental-temperature on adrenal function in Rana esculenta.J Endocrinol 57: 385–391.
Kindermann C, Narayan EJ, Hero J-M (2012) Urinary corticosteronemetabolites and chytridiomycosis disease prevalence in a free-living population of male Stony Creek frogs (Litoria wilcoxii). CompBiochem Phys A 162: 171–176.
Kindermann C, Narayan EJ, Hero JM (2014) The neuro-hormonal con-trol of rapid dynamic skin colour change in an amphibian duringamplexus. PloS One 9(12): e114120.
Kloas W., Hanke W. (1990) Neurohypophysial hormones and steroido-genesis in the interrenals of Xenopus laevis. Gen Comp Endocr 80(2): 321–330.
Lane J (2006) Can non-invasive glucocorticoid measures be used asreliable indicators of stress in animals? Anim Welfare 15: 331–342.
Leboulenger F, Lihrmann I, Netchitailo P, Delarue C, Perroteau I, LingN, Vaudry H (1986) In vitro study of frog (Rana ridibunda pallas)interrenal function by use of a simplified perifusion system VIII.Structure-activity relationship of synthetic ACTH fragments and γ-MSH. Gen Comp Endocr 61(2): 187–196.
Lewis J (2006) Steroid analysis in saliva: an overview. Clin Biochem Rev27: 139–146.
Loeding E, Bernier D, Thomas J, Santymire R (2011) Investigating theimpacts of a female to female introduction on hormone levels in thesable antelope (Hippotragus niger). J Appl Anim Welf Sci 14: 220–246.
Millsburgh JJ, Washburn BE (2004) Use of fecal glucocorticoid metab-olite measures in conservation biology research: considerations forapplication and interpretation. Gen Comp Endocr 138: 189–199.
Monfort SL (2003). Non-invasive endocrine measures of reproductionand stress in wild populations; pp. 147–165. Reproductive Scienceand Integrated Conservation.
Mostl E, Palme R (2002) Hormones as indicators of stress. DomestAnim Endocrin 23: 67–74.
Munro C, Stabenfeldt G (1984) Development of a microtitre plateenzyme immunoassay for the determination of progesterone.J Endocrinol 101: 41–49.
Narayan E, Molinia F, Christi K, Morley C, Cockrem J (2010) Urinary cor-ticosterone metabolite responses to capture, and annual patternsof urinary corticosterone in wild and captive endangered Fijianground frogs (Platymantis vitiana). Aust J Zool 58: 189–197.
Narayan EJ (2013) Non-invasive reproductive and stress endocrinologyin amphibian conservation physiology. Conserv Physiol 1(1):cot011. doi:10.1093/conphys/cot011.
Narayan EJ, Gramapurohit NP (2016) Sexual dimorphism in baselineurinary corticosterone metabolites and their association withbody-condition indices in a peri-urban population of the commonAsian toad (Duttaphrynus melanostictus). Comp Biochem Phys A191: 174–179.
Narayan EJ, Hero J-M (2011) Urinary corticosterone responses andhaematological stress indicators in the endangered Fijian groundfrog (Platymantis vitiana) during transportation and capacity. AustJ Zool 59: 79–85.
Narayan EJ, Hero J-M (2013) Repeatability of baseline corticosterone andacute stress responses to capture, and patterns of reproductive hor-mones in vitellogenic and non-vitellogenic female Fijian ground frog(Platymantis vitiana). J Exp Zool 319A: 471–481.
Novales RR, Davis WJ (1969) Cellular aspects of the control of physio-logical color changes in amphibians. Am Zool 9(2): 479–488.
. . . . . . . . . . . . . . . . . . . . . . . . . . . . . . . . . . . . . . . . . . . . . . . . . . . . . . . . . . . . . . . . . . . . . . . . . . . . . . . . . . . . . . . . . . . . . . . . . . . . . . . . . . . . . . . . . . . . . . . . . . . . . . . . . . . . . . . . . . . . . . . . . . . . . . . . . . . . . .
11
. . . . . . . . . . . . . . . . . . . . . . . . . . . . . . . . . . . . . . . . . . . . . . . . . . . . . . . . . . . . . . . . . . . . . . . . . . . . . . . . . . . . . . . . . . . . . . . . . . . . . . . . . . . . . . . . . . . . . . . . . . . . . . . . . . . . . . . . . . . . . . . . . . . . . . . . . . . . . .Conservation Physiology • Volume 6 2018 Toolbox

Olson DH, Aanensen DM, Ronnenberg KL, Powell CI, Walker SF, BielbyJ, Garner TWJ, Weaver G, The Bd mapping group, Fisher MC (2013)Mapping the global emergence of Batrachochytrium dendrobatidis,the amphibian chytrid fungus. PLoS One 8: e56802.
Reeder DM, Kramer KM (2005) Stress in free-ranging mammals: integrat-ing physiology, ecology, and natural history. J Mammal 86: 225–235.
Rollins-Smith LA (2017) Amphibian immunity-stress, disease, and cli-mate change. Dev Comp Immunol 66: 111–119. doi:10.1016/j.dci.2016.07.002.
Romero LM (2004) Physiological stress in ecology: lessons from bio-medical research. Trends Ecol Evol 19: 249–255.
Romero LM, Reed JM (2005) Collecting baseline corticosterone sam-ples in the field: is under 3 min good enough? Comp Biochem PhysA 140(1): 73–9.
Ruis M, Brake J, Van de Burgwal J, de Jong I, Blokhuis H, Koolhaas J(2000) Personalities in female domesticated pigs: behavioural andphysiological indications. Appl Anim Behav Sci 66: 31–47.
Santymire RM, Armstrong DM (2010) Development of a field-friendlytechnique for fecal steroid extraction and storage using theAfrican wild dog (Lycaon pictus). Zoo Biol 29: 289–302.
Sapolsky RM (1992) Stress, the Aging Brain, and the Mechanisms ofNeuron Death. MIT Press, Cambridge, MA.
Sapolsky RM, Romero LM, Munck AU (2000) How do glucocorticoidsinfluence stress responses? Integrating permissive, suppressive,stimulatory, and preparative actions. Endocr Rev 21: 55–89.
Schell CJ, Young JK, Lonsdorf EV, Santymire RM (2013) Anthropogenicand physiologically induced stress responses in captive coyotes.J Mammal 94(5): 1131–40.
Searle CL, Gervasi SS, Hua J, Hammond JI, Relyea RA, Olson DH, BlausteinAR (2011) Differential host susceptibility to Batrachochytrium dendro-batidis, an emerging amphibian pathogen. Conserv Biol 25: 965–974.
Tiefenbacher S, Lee B, Meyer J, Spealman R (2003) Noninvasive tech-nique for the repeated sampling of salivary free cortisol in awake,unrestrained squirrel monkeys. Am J Primatol 60: 69–75.
Touma C, Palme R (2005) Measuring fecal glucocorticoid metabolitesin mammals and birds: the importance of validation. In GoymannW., Jenni-Eiermann S., Bauchinger U., eds. Bird Hormones and BirdMigrations: Analyzing Hormones in Droppings and Egg Yolks andAssessing Adaptations. New York Academy of Sciences, New York,NY, pp 54–74.
Wingfield JC (2005) Modulation of the Adrenocortical Response to AcuteStress in Breeding Birds. Functional Avian Endocrinology. NarosaPublishing House, New Delhi, India, pp 225–240.
Wingfield JC, Romero LM (2000) Adrenocortical responses to stressand their modulation in free-living vertebrates. In McEwen, B.S.,ed. Handbook of Physiology, Section 7: The Endocrine System,Volume 4: Coping With The Environment: Neural and EndocrineMechanisms. Oxford University Press, Oxford, pp 211–236.
Woodhams DC, Ardipradja K, Alford RA, Marantelli G, Reinert LK,Rollins‐Smith LA (2007) Resistance to chytridiomycosis variesamong amphibian species and is correlated with skin peptidedefenses. Anim Conserv 10(4): 409–17.
Yates D, Ross T, Hallford D, Yates L, Wesley R (2010) Comparison ofsalivary and serum cortisol concentrations after adrenocorticotro-pic hormone challenge in ewes. J Anim Sci 88(2): 599.
Young K M, Walker SL, Lanthier C, Waddell W T, Monfort SL, Brown JL(2004) Noninvasive monitoring of adrenocortical activity in carni-vores by fecal glucocorticoid analyses. Gen Comp Endocr 137:148–165.
Zouboulis CC (2004) The human skin as a hormone target and anendocrine gland. Hormones 3: 9–26.
Zouboulis CC (2009) The skin as an endocrine organ. Dermato-endocrinology 1(5): 250–2.
. . . . . . . . . . . . . . . . . . . . . . . . . . . . . . . . . . . . . . . . . . . . . . . . . . . . . . . . . . . . . . . . . . . . . . . . . . . . . . . . . . . . . . . . . . . . . . . . . . . . . . . . . . . . . . . . . . . . . . . . . . . . . . . . . . . . . . . . . . . . . . . . . . . . . . . . . . . . . .
12
. . . . . . . . . . . . . . . . . . . . . . . . . . . . . . . . . . . . . . . . . . . . . . . . . . . . . . . . . . . . . . . . . . . . . . . . . . . . . . . . . . . . . . . . . . . . . . . . . . . . . . . . . . . . . . . . . . . . . . . . . . . . . . . . . . . . . . . . . . . . . . . . . . . . . . . . . . . . . .Toolbox Conservation Physiology • Volume 6 2018