a novel method for the codec performance analysis …
TRANSCRIPT

FACTA UNIVERSITATIS
Series: Electronics and Energetics Vol. 33, No 2, June 2020, pp. 243-259
https://doi.org/10.2298/FUEE2002243L
© 2020 by University of Niš, Serbia | Creative Commons License: CC BY-NC-ND
A NOVEL METHOD FOR THE CODECS’ PERFORMANCE
ANALYSIS IN MOBILE TELEPHONY SYSTEMS
Aleksandar Lebl, Dragan Mitić, Vladimir Matić,
Mladen Mileusnić, Žarko Markov
IRITEL a.d., Belgrade, Serbia
Abstract. This paper presents a novel method of expressing the quality of service in a
mobile telecommunication system when its performance depends on several factors
including applied codecs’ characteristics (voice quality and data flow rate) and
telecommunications traffic service possibilities. The influence of these factors is unified
in one variable - quality of service measure. The proposed method is especially applicable
in the cases when two-dimensional systems are analyzed – for example when two codecs
with different flow rate and different achievable connection quality are used in a system.
As an example, we also studied system with full-rate or mixed full-rate and half-rate codec
implementation depending on the offered traffic. The system performances – mean data-
flow and mean connection quality as a function of offered traffic are presented
graphically and also expressed quantitatively by the novel quality of service measure.
The systems with different number of available traffic channels may be compared on
the base of this novel evaluation value such that the system with the highest value is the
most suitable one for the concrete situation. In this way mobile system design is
simplified to the great extent. The developed model is applicable generally for mobile
telephony systems defining, but in this paper we studied its implementation for Global
System for Mobile communications.
Key words: Quality of service measure, full-rate codec, half-rate codec, E-model
1. INTRODUCTION
Mobile telephony systems are characterized by a number of parameters. These
parameters include, but are not limited to base station emission power, offered and served
traffic, and achieved data-flow rate. Different codec types are applied to satisfy traffic
demands, each one with its specific voice quality level. When these characteristics are
analyzed, usually one of them is calculated or simulated. The behaviour of the others is
then only qualitatively estimated without putting it in relation to the analyzed one.
Received June 19, 2019; received in revised form August 19, 2019
Corresponding author: Aleksandar Lebl
IRITEL a.d., Belgrade, Batajnički put 23, 11000 Belgrade, Serbia
E-mail: [email protected]

244 A. LEBL, D. MITIĆ, V. MATIĆ, M. MILEUSNIĆ, Ţ. MARKOV
That is why it is then difficult to estimate whether the improvement of one
characteristic is overcome by the degradation in some other parameter.
There is not a significant number of contributions, which emphasizes the aggregate
influence of two or more factors on some system characteristic by some unified measure
(unit). One such an estimation may be found in [1], where classical equipment impairment
factor Ie of the coder, defined in [2], is modified according to the influence of necessary
codec bandwidth and processing time, forming the unified estimation called modified
impairment factor Ib. Instead of analyzing common influence of several elements important
for connection quality, the majority of contributions are directed towards improving original
voice quality model [3], [4], or comparing of practically obtained characteristics for single
Voice over Internet Protocol (VoIP) and mobile telephony codecs to theoretical
characteristics [5]. The various testing approaches when considering only one voice
connection quality are emphasized in [6]. The analysis may be performed on a per voice
sample basis or on a per call basis when it is important to include the effect of recency and
the effect of a speech sample with the worst signal quality. The statistical tests
implementable for voice quality determination are also analysed in [6]. In some cases it is
important to spread the analysis results of voice and data transmission in such a sense that
they are representative for different networks (Global System for Mobile communications
(GSM), Universal Mobile Telecommunication Systems (UMTS), Code Division Multiple
Access (CDMA)) or application classes (emergency, business and personal). The
methodology, which includes aggregate collected data on the base of user area distribution
simulated by drive test and the obtained results are shown in [7]. The methodology may be
also applied to compare various network providers in some area on the base of criteria how
they satisfy a set of analyzed Key Performance Indicators (KPI) [8]. Very often used
approach for presenting influence of two factors on the third variable is over three-
dimensional (3D) graphics. Again, when considering voice coders implementation, an
example may be found in [9]. But, such graphics, although are illustrative, suffer from the
lack that they are often less clear for values determination than in the case of two-dimensional
(2D) graphics and that it is impossible to present the influence of more than two factors on
the analyzed variable. The unified numerical measure according to the results from [1], or
from this paper is simple for the estimation whether the analyzed characteristic has the
satisfactory value.
When projecting a telephony system such as mobile telephony system, there are
several elements for the consideration to determine its quality of service (QoS). The first
element is the offered traffic, which may be served with the pre-defined loss probability.
The second element is the achieved mean voice connection quality, as well the quality of
each, separate realized connection. The third element is necessary bandwidth to serve the
offered traffic. The available frequency spectrum is very limited in mobile telephony
comparing to the necessary channel capacity. That is why a number of low bit-rate
codecs are developed for the implementation in mobile telephony. However, these codecs
have lower voice connection quality then higher bit-rate codecs (in mobile telephony
with applied GSM technology full-rate (FR – GSM 06.10) is one of them). The service
principle is to use higher bit-rate codecs in all connections at lower traffic loads (usually
FR in systems of the second generation (2G) or GSM). If the offered traffic overcomes
the predefined level and if it is possible that requested traffic loss is not achieved, it is
necessary to start the implementation of lower bit-rate codecs (usually half-rate (HR -

A Novel Method for the Codecs' Performance Analysis in Mobile Telephony Systems 245
GSM 06.20) codec in GSM systems) in all or in a part of realized connections. Besides the
limitation in available frequency spectrum, the second element of restriction is the number
of dedicated traffic channels, i.e. the system hardware performance. In mobile telephony,
there is possibility to even two times increase system channel capacity by the
implementation of HR codec. In this case, each traffic channel may contain two connections
coded by half-rate codec. A system with emphasized characteristics is analyzed in [10].
There is a variety of different parameters which may be analysed together to obtain
different types of system performance estimations. The reference [11] is a comprehensive
survey of elements characterizing each fifth-generation (5G) mobile system. Various
among these elements besides those specific for the quality of applied codecs may be
combined to obtain a number of different evaluations and [11] gives just an idea about
the set of combinational factors. The most important elements which may be combined
are energy consumption, transmission delay, data throughput and the applied frequency
spectrum bandwidth. Generally speaking, the 5G wireless technology is based upon
modified fourth generation (4G), which at present is facing many problems to meet its
performance goals. The 5G wireless technology helps to solve the problems of poor
coverage, bad interconnectivity, poor quality of service and flexibility [12]. 5G systems
bring significantly increased data transfer speed, spectrum bandwidth, spectral efficiency
and so on, comparing to 4G systems [13].
This paper describes a novel method for comprehensive analysis of different codecs
applied in mobile telephony systems. It unifies different codecs’ characteristics (such as
their achievable voice quality, data throughput and possibilities for traffic serving) into
one variable, which may be compared for various codecs. The main goal of the research
is to simplify mobile system designing (selection of the number of traffic channels) to
achieve the best system performance while considering several KPIs. In the paper, the
analysis is, first of all, limited to codecs implemented in GSM systems. The number of
traffic channels for which the results are presented is specific for GSM systems with 1, 2,
3 or 4 frequency carriers. Such analysis, unifying different mobile telephony codecs’
characteristics into one variable are rarely implemented and they, if applied, unify
together lower number of codecs’ characteristics.
The section 2 in the paper describes E-model, which we implemented for voice
quality estimation as the first element included in our unified variable. The values of
data-flow rate as the second element of this evaluation are also cited at the end of this
section. The traffic model corresponding to the GSM mobile telephony system with two
different applied codecs is developed in the section 3 as the third element in the analysis.
Section 4 describes how the value of our novel estimation is determined and presents the
obtained results. Section 5 is a brief survey how the model could be implemented in
mobile systems of the third generation (3G) and the fourth generation (4G). At the end,
section 6 is the conclusion of the paper.
2. VOICE CONNECTION QUALITY ESTIMATION
There are several subjective and objective models intended to express the voice
connection quality. Analysis in this paper is based on E-model implementation. E-model
is the computational, objective model. It joins the influence of various factors into one

246 A. LEBL, D. MITIĆ, V. MATIĆ, M. MILEUSNIĆ, Ţ. MARKOV
unique quality measure – rating factor R [2]. The value of R is connected with Mean
Opinion Score (MOS), which is between 1 and 5. The values of MOS and R are connected
by formula and corresponding Fig. B.2 from [2].
The main purpose of E-model is to express voice connection quality in a number of
different kinds of voice connections systems. Among them implementation in Internet
packet connections quality estimation is, probably, the most often one. According to [14],
MOS is used as the measure of voice quality in mobile telephone connections. Taking into
account that MOS and R are mutually dependent variables, E-model may be implemented as
a measure for the estimation of the quality of mobile telephony connection.
According to E-model, connection-rating factor is [2]:
94 e effR I (1)
where R0=94 is the maximum practically possible connection-rating factor. Effective
equipment impairment factor Ie-eff includes impairments caused by the codec implementation
and influence of random signal loss. In (1) we do not consider influence of factors which
appear in original equation from [2]: combination of impairments which occur
simultaneously with voice signal (Is), influence of delay (Id) and influence of advantage
factor (A), because these factors are not related to the implemented codec.
The value of Ie-eff is calculated from the equation [2]:
(95 )pl
e eff e epl
pl
PI I I
PB
BurstR
(2)
where it is:
Ie – equipment impairment factor when there is no packet loss;
Ppl – transmitted signal loss probability (in percent);
BurstR – burst ratio: the quotient of the average lengths of the lost signal parts in
real transmitted signal and when signal parts are randomly lost;
Bpl – robustness factor, which is specific for each coder type.
In this paper, we are limited to cases when there is no signal loss (Ppl=0). Such a
situation has not the significant probability in mobile telephony systems, but the obtained
results do not suffer from the loss of generality. It means that it is Ie-eff=Ie from (2), i.e.
R=94-Ie from (1) in our analysis. According to the available literature, we have chosen
the values IeFR=20 for FR codec and IeHR=23 for HR codec [15]. However, also the
worse, pessimistic value IeFR=26 may be found in some references [16], [17]. The reason
is that the value of R should be higher for FR codec than for HR codec, because data-
flow is greater in the case of FR codec. Besides, it is explained in [5] that, according to
measurements, even the value IeHR=23 is pessimistic for HR codec.
Data-flow rate for FR and HR is also important in our analysis. It is DFFR=13kbit/s
for FR codec and DFHR=5.6kbit/s for HR codec. Besides this, in GSM systems enhanced
full-rate codec (EFR) may be also applied. Its data-flow is DFEFR=12.2kbit/s.

A Novel Method for the Codecs' Performance Analysis in Mobile Telephony Systems 247
3. IMPLEMENTED TRAFFIC MODEL
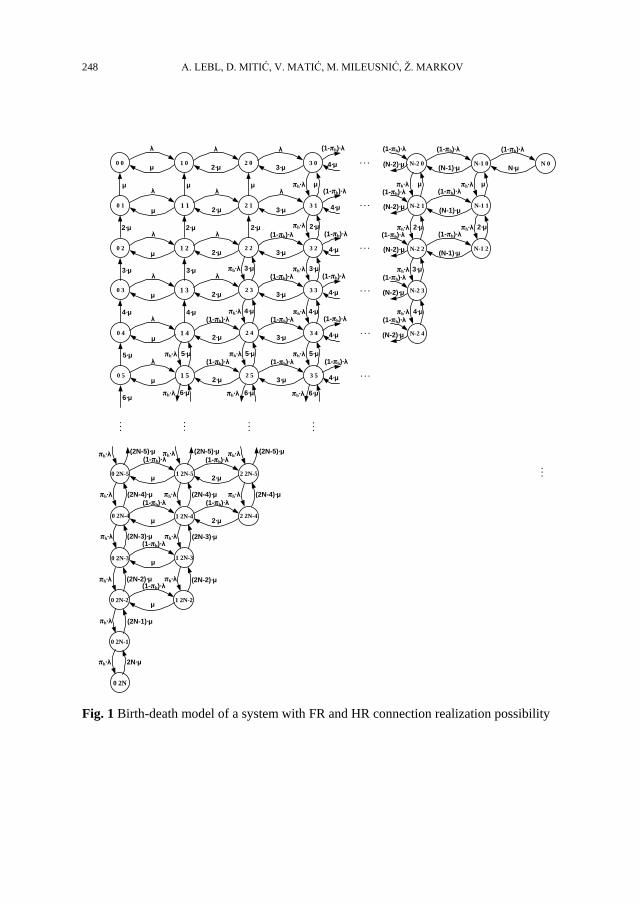
Traffic model of the analyzed system is presented in Fig. 1. The total number of traffic
channels is N and each channel, if busy, may contain one FR or one or two HR connections.
Each system state is modelled by two-dimensional variable {nf,nh}, where nf and nh are the
numbers of instantaneously realized FR (i.e. HR) connections, respectively. The threshold
number of channels when HR connections begin to be established is K (≤N). As a
consequence, the total number of available traffic channels is equal
2 ( )cN K N K (3)
The value of K is chosen on the base of the request that traffic loss is lower than some
limiting value, in our analysis it is Ploss=1% or Ploss=2%. The intensity of new requests
generation is λ and the probability that the user, who generates the request, may establish
half-rate connection, is πh. In up-to-date technology it may be supposed that the majority
of mobile stations have the possibility to realize a HR connection. So we suppose that the
value of πh is in the range between 0.8 and 1. Call duration of both connection types is
random variable with exponential distribution and mean duration tp=1/μ. In the period
when both kinds of requests are generated, the intensity of full-rate requests generation is
λ·(1-πh), while the intensity of half-rate requests generation is λ·πh. In the state {nf,nh}
full-rate connection is finished with the intensity nf··μ and half-rate connection with the
intensity nh·μ. If during traffic process realization happens that two one-half time slots
appear (i.e. two channels with only one half-rate call per channel), these two calls are
gathered in one completely busy channel, while the other channel becomes completely
idle (complete re-packing, [18]).
Figure 1 presents the model of a system with HR connections realization possibility. The
number of traffic channels is N and the threshold when HR connections realization starts is
K=3. The value of πh is 0<πh<1. This is a two-dimensional Markov birth-death traffic
model. The solution may not be obtained in the closed form, because Kolmogorov’s
criterion for system reversibility is not satisfied [19]. Kolmogorov’s criterion is satisfied in
the special case of high traffic load when it is necessary to have K=0 to achieve satisfactory
traffic loss. The system remains two-dimensional and it is possible to realize circular flow
between any set of four system states in both clockwise and counter clockwise direction.
For a system in Fig. 1 such condition is not satisfied for states where there are less than 3
FR calls because there is no circular flow in counter clockwise direction.
There are two more special cases when the system is simplified for the analysis
comparing to the system from Fig. 1. The first one is for a low traffic load when there is no
need to implement HR connections, but only FR. In this case, we obtain one-dimensional
traffic model with N+1 system states (the states are {0,0}, {1,0}, ..., {N,0}, i.e. it is always
nh=0). The second special case is for the higher traffic load where it is K=0, while in the
same time it is πh=1. Under these conditions we also obtain one-dimensional traffic model
with 2·N+1 system states where only HR connections are realized (the states are {0,0},
{0,1}, ..., {0,2·N }, i.e. it is always nf=0).
248 A. LEBL, D. MITIĆ, V. MATIĆ, M. MILEUSNIĆ, Ţ. MARKOV
λ
μ
μ
0 02·μ
μ
1 0
μ
2 0 . . .
μ
2·μ
0 12·μ
2·μ
1 1
2·μ
2 1 . . .
μ
3·μ
0 22·μ
3·μ
1 2 2 2 . . .
. . .
. . .
. . .
. . .
0 2N
λ
λ λ
λ λ
0 2N-1
(1-πh)·λ
μ0 2N-2
(1-πh)·λ
μ0 2N-3
1 2N-2
1 2N-3
πh·λ
πh·λ
μ 2·μ
μ 2·μ
(1-πh)·λ (1-πh)·λ
(1-πh)·λ (1-πh)·λ
0 2N-4
0 2N-5
1 2N-4
1 2N-5
2 2N-4
2 2N-5
3·μ3 0
3·μ3 1
3·μ3 2
. . .
λ
λ
(1-πh)·λ
μπh·λ
2·μπh·λ
μ
4·μ
0 32·μ
4·μ
1 3 2 3
λ λ
3·μ3 3
(1-πh)·λ3·μπh·λ3·μπh·λ
μ
5·μ
0 42·μ
1 4 2 4
λ (1-πh)·λ
3·μ3 4
(1-πh)·λ
μ
6·μ
0 52·μ
1 5 2 5
λ (1-πh)·λ
3·μ3 5
(1-πh)·λ
4·μπh·λ
5·μπh·λ
4·μπh·λ
5·μπh·λ5·μπh·λ
6·μπh·λ6·μπh·λ6·μπh·λ
(N-1)·μN-1 0
(N-1)·μ
(N-1)·μ
(1-πh)·λ
(1-πh)·λ
(1-πh)·λ
N·μN 0
(1-πh)·λ
N-1 1
N-1 2
N-2 0
N-2 1
N-2 2
N-2 3
N-2 4
μπh·λμπh·λ
2·μπh·λ2·μπh·λ
3·μπh·λ
4·μπh·λ
(N-2)·μ
(N-2)·μ
(N-2)·μ
(1-πh)·λ
(N-2)·μ
(N-2)·μ
(1-πh)·λ
(1-πh)·λ
(1-πh)·λ
(1-πh)·λ
πh·λπh·λπh·λ
πh·λ
πh·λπh·λ
πh·λ
4·μ
4·μ
4·μ
(1-πh)·λ
(1-πh)·λ
(1-πh)·λ
4·μ
4·μ
4·μ
(1-πh)·λ
(1-πh)·λ
(1-πh)·λ
. . .
. . .
. . .
πh·λπh·λ(2N-5)·μπh·λ(2N-5)·μ (2N-5)·μ
(2N-4)·μ (2N-4)·μ (2N-4)·μ
(2N-3)·μ (2N-3)·μ
(2N-2)·μ (2N-2)·μ
(2N-1)·μ
2N·μ
Fig. 1 Birth-death model of a system with FR and HR connection realization possibility

A Novel Method for the Codecs' Performance Analysis in Mobile Telephony Systems 249
In the general case presented in Fig. 1 the solution is obtained by solving the system
of equations [10]. The equations in stationary case are obtained by equating the transition
intensity from some system state {nf,nh} with the total transition intensity into the same
state. This is expressed by the equation
1 1 1 1
1 1 1 1
( , ) ( ( , ) ( , )) ( , ) ( , ) ( , ) ( , )
( , ) ( , ) ( , ) ( , )f h f h f h f h f h f h f h
f h f h f h f h
P n n n n n n P n n n n P n n n n
P n n n n P n n n n
(4)
where P(x,y) is the probability of state {x,y}, λ(x,y) is the intensity of new call generation
in the state {x,y} and μ(x,y) is the intensity of call termination in the same state {x,y}. In
order to successfully solve the system of equations, it is necessary to insert also the
condition
2·
,
0 0
1
f h
f h
f h
n + n =N
n n
n n
P (5)
instead of one of the equations expressed by (4).
Besides of solving the system of equations, the system from Fig. 1 may be also
analyzed by simulation program. Such a program is our original development realized in
C programming language and it is executed on commercial personal computer. The
program is the improved version of the simulation program, which is described and
verified in [10] by comparing the values of state probabilities to the values obtained by
solving the system of equations for a system with relatively low number of channels.
4. METHOD OF ANALYSIS AND THE RESULTS
The main condition to perform the analysis presented in this paper is to define the
connection scenario which allows optimum relation among three variables: 1. offered
traffic; 2. traffic loss and 3. implementation as low as possible percent of HR connections
(i.e. connection quality).
The first step in the analysis is to determine components of served traffic (total traffic
As, traffic of FR connections (Asf), traffic of HR connections (Ash), as well as the loss
probability of these three traffic components (Ploss, Plossf, Plossh) for each value of
predefined traffic, while changing the threshold number of channels K from 0 to N. These
values of served traffic and traffic loss are obtained in the simulation process. In our
analysis we predefined the probability πh=0.8. At the end of simulation the components
of offered traffic (total offered traffic - Ao, offered traffic of FR connections - Aof and
offered traffic of HR connections - Aoh) are calculated as:
1s
oloss
AA
P
(6)
1
sf
oflossf
AA
P
(7)
1sh
ohlossh
AA
P
(8)

250 A. LEBL, D. MITIĆ, V. MATIĆ, M. MILEUSNIĆ, Ţ. MARKOV
The goal of this analysis is to determine the maximum values As, Asf and Ash for which
is Ploss lower than the predefined value (1% or 2% in our simulation) and the
corresponding value of K.
The second step in the analysis is calculation of mean rating factor R value for Asf and
Ash determined in step 1. This value is
(94 ) (94 )eFR sf eHR sh
meansf sh
I A I AR
A A
(9)
The third step is the calculation of mean data-flow value for the same values of Asf
and Ash as in step 2. The implemented formula is
FR sf HR sh
meansf sh
DF A DF ADF
A A
(10)
And finally the fourth step is calculation of our novel quality of service measure
(QoSM). Its value is
100o mean
mean
A RQoSM
DF N
(11)
Such an expression is formed, because a system has better characteristics when it
may serve higher traffic with higher achieved voice quality, but with lower data flow.
The division by the number of traffic channels is introduced in order to be able to
compare performances of the systems with different number of traffic channels, meaning
that the unit of this variable is expressed per one channel. This novel variable contains
two factors related to the performances of applied codec (data flow rate and connection-
rating factor). The third component is related to more general element, which is specified
for each telecommunication system independent of the implemented codec type –
offered, i.e. served traffic. In this way the defined variable is not just related to codec
properties, but is more comprehensive, describing service in a system.
Table 1 presents the value of threshold number of traffic channels (K) when the
implementation of HR codec starts. The value K is determined as a function of the value
of offered traffic (Ao), which is defined at the beginning of simulation for the systems
with 6, 14, 22 and 30 traffic channels (N). These values of N are characteristic for the
systems with 1, 2, 3 and 4 frequency carriers, respectively. The values of K are presented
for offered traffic loss Ploss=1% and Ploss=2%. The designations Ploss>1% and Ploss>2% in
the Table 1 mean that the predefined value of offered traffic loss may not be achieved
regardless of K.
As an example, let us consider the system with Ao=17E and desired Ploss=2%.
According to Table 1, it is not possible to achieve Ploss=2% by systems with 6 and 14
traffic channels. When there are 22 traffic channels, it is necessary to have mixed FR and
HR connections and the threshold number of channels when HR connections are started
to be realized is K=20. In the systems with N=30 traffic channels all connections may be
FR (K=30).

A Novel Method for the Codecs' Performance Analysis in Mobile Telephony Systems 251
Table 1 The threshold number of channels (K) as a function of predefined offered traffic
(A) and total number of channels (N)
Ao(E)
Ploss = 1% Ploss = 2%
N N
6 14 22 30 6 14 22 30
K K
1.5 6 14 22 30 6 14 22 30 2 5 14 22 30 6 14 22 30
2.5 4 14 22 30 5 14 22 30 3 3 14 22 30 4 14 22 30
3.5 2 14 22 30 4 14 22 30 4 1 14 22 30 3 14 22 30
4.5
Ploss>1%
14 22 30 2 14 22 30
5 14 22 30
Ploss>2%
14 22 30
6 14 22 30 14 22 30
7 14 22 30 14 22 30
8 13 22 30 14 22 30
9 12 22 30 13 22 30
10 11 22 30 12 22 30
11 10 22 30 11 22 30
12 9 22 30 11 22 30
13 8 22 30 10 22 30
14 6 21 30 9 22 30
15
Ploss>1%
20 30 7 21 30
16 20 30
Ploss>2%
21 30
17 19 30 20 30
18 19 30 20 30
19 18 30 19 30
20 18 30 19 30
21 17 29 18 30
22 16 28 18 29
23 15 28 17 29
24 14 27 16 28
25 12 27 16 28
26
Ploss>1%
26 15 27
27 26 13 27
28 25
Ploss>2%
27
29 25 26
30 25 26
31 24 26
32 24 25
33 23 25
34 22 24
35 21 24
36 20 23
37 17 23
38 Ploss>1%
22
39 20

252 A. LEBL, D. MITIĆ, V. MATIĆ, M. MILEUSNIĆ, Ţ. MARKOV
Figure 2 presents relation between Ao, DFmean and Rmean for a system with 6 traffic
channels when traffic loss is limited to 2%. The threshold number of channels is
determined according to data in Table 1. The values of DFmean and Rmean are determined
on the base of expressions (10) and (9), respectively, based on Asf and Ash obtained in
simulation process. After that, the values of QoSM are presented in Fig. 3 according to
(11) for the same values of Ao, DFmean and Rmean as the ones used for the graphic in Fig. 2.
The results are presented both for traffic loss less than 1% and less than 2%.
1313
12,5811,55
11,12
9,5
8,02
1,5
2
2,5
3
3,5
4
4,5
707172737475
Rmean
DFmean(kbit/s)
Ao(E)
70-71 71-72 72-73 73-74 74-75
1313
12,5811,55
11,12
9,5
8,02
1,5
2
2,5
3
3,5
4
4,5
707172737475
Rmean
DFmean(kbit/s)
Ao(E)
70-71 71-72 72-73 73-74 74-75
Fig. 2 Mean connection-rating factor Rmean as a function of offered traffic Ao and mean data-
flow DFmean for a system with 6 traffic channels and probability of traffic loss
Ploss<2%
0
0,1
0,2
0,3
0,4
0,5
0,6
0,7
1,5 2,5 3,5 4,5
Ao (E)
Qo
SM
(E
∙s/b
it∙c
ha
nn
el)
Ploss=2% Ploss=1%
Fig. 3 QoSM as a function of offered traffic Ao for a system with 6 traffic channels
A Novel Method for the Codecs' Performance Analysis in Mobile Telephony Systems 253
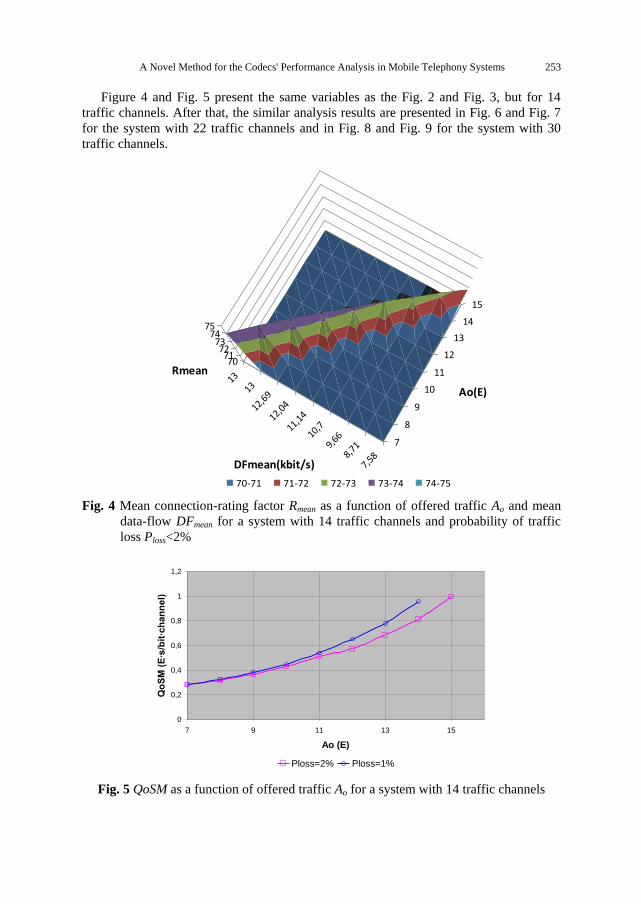
Figure 4 and Fig. 5 present the same variables as the Fig. 2 and Fig. 3, but for 14
traffic channels. After that, the similar analysis results are presented in Fig. 6 and Fig. 7
for the system with 22 traffic channels and in Fig. 8 and Fig. 9 for the system with 30
traffic channels.
13
13
12,69
12,04
11,14
10,7
9,66
8,71
7,58
7
8
9
10
11
12
13
14
15
707172737475
Rmean
DFmean(kbit/s)
Ao(E)
70-71 71-72 72-73 73-74 74-75
13
13
12,69
12,04
11,14
10,7
9,66
8,71
7,58
7
8
9
10
11
12
13
14
15
707172737475
Rmean
DFmean(kbit/s)
Ao(E)
70-71 71-72 72-73 73-74 74-75
Fig. 4 Mean connection-rating factor Rmean as a function of offered traffic Ao and mean
data-flow DFmean for a system with 14 traffic channels and probability of traffic
loss Ploss<2%
0
0,2
0,4
0,6
0,8
1
1,2
7 9 11 13 15
Ao (E)
Qo
SM
(E
∙s/b
it∙c
han
nel)
Ploss=2% Ploss=1%
Fig. 5 QoSM as a function of offered traffic Ao for a system with 14 traffic channels

254 A. LEBL, D. MITIĆ, V. MATIĆ, M. MILEUSNIĆ, Ţ. MARKOV
13
13
12,82
12,73
12,29
12,08
11,42
11,14
10,41
10,11
9,41
8,76
8,54
8,02
7,42
13
15
17
19
21
23
25
27
70717273
7475
Rmean
DFmean (kbit/s)
Ao (E)
70-71 71-72 72-73 73-74 74-75
1313
12,82
12,73
12,29
12,08
11,42
11,14
10,41
10,11
9,41
8,76
8,54
8,02
7,42
13
15
17
19
21
23
25
27
70717273
7475
Rmean
DFmean (kbit/s)
Ao (E)
70-71 71-72 72-73 73-74 74-75
Fig. 6 Mean connection-rating factor Rmean as a function of offered traffic Ao and mean
data-flow DFmean for a system with 22 traffic channels and probability of traffic
loss Ploss<2%
0,2
0,4
0,6
0,8
1
1,2
13 15 17 19 21 23 25 27
Ao(E)
Qo
SM
(E∙s
/bit
∙ch
an
ne
l)
Ploss=1% Ploss=2%
Fig. 7 QoSM as a function of offered traffic Ao for a system with 22 traffic channels

A Novel Method for the Codecs' Performance Analysis in Mobile Telephony Systems 255
13
12,83
12,44
11,81
11,4
10,59
9,79
9,06
8,42
7,9
20
22
24
26
28
30
32
34
36
38
70717273
7475
Rmean
DFmean (kbit/s)
Ao (E)
70-71 71-72 72-73 73-74 74-75
13
12,83
12,44
11,81
11,4
10,59
9,79
9,06
8,42
7,9
20
22
24
26
28
30
32
34
36
38
70717273
7475
Rmean
DFmean (kbit/s)
Ao (E)
70-71 71-72 72-73 73-74 74-75
Fig. 8 Mean connection-rating factor Rmean as a function of offered traffic Ao and mean
data-flow DFmean for a system with 30 traffic channels and probability of traffic
loss Ploss<2%
0
0,2
0,4
0,6
0,8
1
1,2
1,4
20 24 28 32 36 40
Ao (E)
Qo
SM
(E
∙s/b
it∙c
ha
nn
el)
Ploss=2% Ploss=1%
Fig. 9 QoSM as a function of offered traffic Ao for a system with 30 traffic channels

256 A. LEBL, D. MITIĆ, V. MATIĆ, M. MILEUSNIĆ, Ţ. MARKOV
0
0,2
0,4
0,6
0,8
1
1,2
0 5 10 15 20 25 30 35 40
Ao (E)
Qo
SM
(E
∙s/b
it∙c
ha
nn
el)
6 channels 14 channels 22 channels 30 channels
Fig. 10 QoSM as a function of offered traffic Ao for systems with 6, 14, 22 and 30 traffic
channels and probability of traffic loss Ploss<2% supposing that QoSM=0 if
Ploss=2% may not be achieved
Figure 10 illustrates the comparative results of QoSM for systems with 6, 14, 22 and
30 channels when it is Ploss<2%. The situation when it is Ploss>2% is treated as that
specified characteristics are not satisfied and that’s why in that case the value of QoSM
suddenly drops to 0. The system dimension (i.e. the number of traffic channels) is
selected to achieve the highest value of QoSM. For example, if it is Ao=6E, we have to
choose system with 10 channels, because it has higher QoSM than other 3 systems.
5. MODEL IMPLEMENTATION IN 3G AND 4G SYSTEMS
The model, which is developed in this paper, is also applicable for the analysis of 3G
and 4G systems. The calculation procedure is here presented for the GSM (2G) systems
and its FR and HR codec. In order to discuss model applicability in 3G and 4G systems,
it is necessary first to perform a brief survey of codecs, which are implemented in 3G and
4G systems.
Adaptive multirate (AMR) codec is usually applied in 3G and 4G systems when
standard telephony frequency bandwidth 300Hz-3400Hz is applied [20]. Here we are
focused on AMR codec, as it is comparable to FR and HR codec, which we considered in
previous sections. At this moment we do not include AMR WB (adaptive multi-rate
wideband), EVRC (enhanced variable rate codec) and other codec types intended for
wideband signal coding (till 7kHz or more), as well as other narrow-band signal codecs,
which are used less than AMR (for example, iLBC (internet low bit-rate codec).
AMR codec is based on the implementation of FR and HR codec, but with adaptable
voice bit-rate (codec mode) according to signal transmission conditions [20]. There are 8
different codec modes and their bit-rates are between 4.75kbit/s and 12.2kbit/s. After
selecting corresponding codec mode, the coded signal is transmitted in FR or HR channel
(channel mode). It may be said that in 3G systems voice signal is transmitted “traditionally”,
A Novel Method for the Codecs' Performance Analysis in Mobile Telephony Systems 257
as also in GSM systems. When codec bit-rate is decreased, more bits are spared for error
protection. On the base of this consideration, it is possible to conclude that equation (10)
remains valid also when AMR codec in 3G systems is considered with the same values of
data-flow, as FR and HR channels are steel implemented. Equation (9) is also valid, but the
concrete values of Ie are changed and they depend on the voice bit-rate. These values are
between 19 when voice bit-rate is 4.75kb/s and 3 when voice bit-rate is 12.2kb/s [21], as
calculated on the base of the presented connection-rating factor. They are improved
comparing to already emphasized values for implementation in GSM systems. The values
of Ie for AMR codec are not always explicitly defined. For example, in [22] these values are
different in various performed tests and the best results are approaching the values from
[21]. The values of Ie in [22] may be calculated on the base of the presented values of Mean
Opinion Score (MOS).
The part of our analysis related to traffic demands in model structure does not depend
on codec modifications. There are still two channels’ types and equations (6)-(8) are
valid. The value of πh additionally depends on signal transmission conditions, as these
conditions have influence on the choice of corresponding voice bit-rate. At the end, the
main equation (11) may be also applied for QoSM factor calculation.
The technology of signal transmission is a bit different in the case of 4G systems. The
applied codecs are dominantly the same as in 3G systems [23], meaning that for our
analysis AMR codec is important. However, the applied frame structures are different, as
they are based on VoIP technology [24]. More precisely, it is voice over long term
evolution (VoLTE) [25]. As a consequence, we may say that the part of our model related
to voice quality, i.e. equation (9), remains as for 3G systems. The considerations dealing
with data-flow rate (equation (10)) overcome the scope of this paper and will be studied
in the future. Overall, the detailed analysis of presented model in 3G and 4G systems will be
the subject of our future development. Besides analysis for AMR codec, this analysis should
also incorporate adaptive multirate wideband (AMR WB) codec, as it is emphasized in [25]
that its implementation is mandatory in VoLTE systems.
6. CONCLUSION
In this paper, we analyzed the performances of systems with mixed traffic realization
where two different traffic components are defined by the implementation of two codec
types. The components of traffic (i.e. two applied codecs) differ in the connection
quality. Until the traffic threshold, which is determined according to the allowed traffic
loss, only better quality codec is implemented for connection realization. After that for
the higher traffic two codec types are applied. A primer of such a system in mobile
telephony, which is analyzed in this paper, is a system where full rate (FR) codec has a
better quality and half rate codec (HR) has a lower quality. The three main quality
elements of such a system: offered traffic (Ao), mean connection quality (Rmean) and mean
data-flow (DFmean) are mutually dependent and their relation is demonstrated by 3D
graph. After this, first contribution, the second more important contribution is the definition
of a novel QoSM, which allows us to express cumulative influence of three previously cited
system performances by one value. This is a novel approach, which may be also
implemented in the other situations when it is necessary to analyze common influence of

258 A. LEBL, D. MITIĆ, V. MATIĆ, M. MILEUSNIĆ, Ţ. MARKOV
several factors. The scope of the analysis is to facilitate mobile systems design and
mutual comparison.
The variable QoSM is defined in such a way that a number of necessary traffic
channels is selected easily on the base of highest QoSM value from the graph. According
to definition and in real physical sense, QoSM is increased when Ao and Rmean are
increased, but also when DFmean is decreased. On the base of graphs from this paper, the
benefits expressed by better system utilization when the offered and served traffic are
increased while in the same time necessary data-flow is decreased significantly overcome
effects of simultaneous connection quality degradation.
There are two directions of our future activities. The first one is connected with already
performed development. The model presented in this paper is universal for the
implementation in mobile telephony. In our analysis we are limited to GSM systems. We
proved by a brief survey the method applicability for the implementation in 3G and 4G
systems. Model adaptation for such an application will be the subject of future development.
The second direction of our activities is directed towards model further improvement by
involving new elements in the model. According to the considerations in the introductory
section of this paper, the important elements may include energy consumption, transmission
delay and the applied frequency spectrum bandwidth.
Acknowledgement: The paper is realized in the framework of the projects TR32051 and TR32007,
which are cofinanced by Ministry of Education, Science and Technological Development of the
Republic of Serbia.
REFERENCES
[1] I. Vidaković and T. Šuh, “Proposition of New Criteria for Estimation of Voice Coders”, Tehnika, vol. 58,
no. 6, pp. 1–5, 2009, in Serbian.
[2] ITU-T, Recommendation G.107, “The E-model, a Computational Model for Use in Transmission
Planing”, Series G: transmission systems and media, digital systems and networks, 2015.
[3] H. Assem, “Assessing and Improving the VVoIP Call Quality”, Master of Science Thesis, Hamilton
Institute, National University of Ireland Maynooth, 2013.
[4] T. Daengsi and P. Wuttidittachotti, “QoE Modeling: A Simplified E-model Enhancement Using
Subjective MOS Estimation Model“, In Proceedings of the Conference ICUFN2015, At Sapporo, Japan,
2015.
[5] S. Möller, “Assessment and Prediction of Speech Quality in Telecommunications“, Springer-Science +
Business Media, B. V., ISBN 978-1-4419-4989-9, 2000.
[6] O. Nipp, M. Kuhn, A. Wittneben and T. Schweinhuber, “Speech Quality Evaluation and Benchmarking
in Cellular Mobile Networks”, In Proceedings of the IEEE 2007 Mobile and Wireless Communications
Summit, Budapest, Hungary, 1-5 July 2007, pp. 1–5.
[7] C. E. Otero, I. Kostanic, L. D. Otero, S. L. Meredith, “Characterization of User-Perceived Quality of
Service (QoS) in Mobile Devices Using Network Pairwise Comparisons”, International Journal of
Wireless & Mobile Networks (IJWMN), vol. 2, no.3, pp. 141–153, 2010.
[8] R. Kadioğlu, Y. Dalveren, A. Kara, “Quality of service assessment: a case study on performance
benchmarking of cellular network operators in Turkey”, Turkish Journal of Electrical Engineering &
Computer Science, vol. 23, pp. 548–559, 2015.
[9] A. Lebl, D. Mitić, P. Petrović, V. Matić, M. Mileusnić and Ţ. Markov, “The Application of Equal Quality
Characteristics „Delay-Echo-Packet Loss“ to Internet Voice Connection Planning”, In Proceedings of the
15th International Symposium INFOTEH Jahorina 2016, 16-18.III 2016, pp. 284–289.

A Novel Method for the Codecs' Performance Analysis in Mobile Telephony Systems 259
[10] D. Mitić, A. Lebl, M. Mileusnić, B. Trenkić and Ţ. Markov, “Traffic simulation of GSM cells with half-
rate connection realization possibility“, Journal of Electrical Engineering, vol. 67, no. 2, pp. 95–102,
2016.
[11] M. A. Habibi, W. Nasimi, B. Han and H. D. Schotten, “A Comprehensive Survey of RAN Architecture
Toward 5G Mobile Communication System”, IEEE Access, vol. 7, pp. 70371–70421, 2019.
[12] B. G. Gopal , P. G. Kuppusamy, “A Comparative Study on 4G and 5G Technology for Wireless
Applications”, IOSR Journal of Electronics and Communication Engineering (IOSR-JECE), vol.10, issue
6, pp. 67–72, 2015.
[13] R. A. Aljiznawi, N. H. Alkhazaali, S. Qasim Jabbar and D. J. Kadhim, “Quality of Service (QoS) for 5G
Networks”, International Journal of Future Computer and Communication, vol. 6, no. 1, pp. 27–30,
2017.
[14] Agilent Technologies, „Optimizing your GSM network today and tomorrow, using drive testing to
estimate downlink speech quality”, Application Note 1325, July 2001.
[15] ITU-T Recommendation G.113, “Series G: Transmission systems and media, digital systems and
networks: Transmission impairments due to speech processing”, November 2007.
[16] ITU-T, SG12 – D.106, „Estimates of Ie and Bpl parameters for a range of CODEC types”, Telchemy
Incorporated, January 2003.
[17] A. Kovac, M. Halas, M. Orgon and M. Voznak, “E- model MOS Estimate Improvement through Jitter
Buffer Packet Loss Modelling”, Advances in Electrical and Electronic Engineering, vol. 9, no. 5, pp.
233–242, Special Issue, 2011.
[18] E. M. M. Winands, J. Wieland and B. Sanders, “Dynamic Half-rate Connections in GSM”, AEÜ -
International Journal of Electronics and Communications, vol. 60, no. 7, pp. 504–512, July 2006.
[19] W. B. Iversen, “Teletraffic Engineering and Network Planning”, Technical University of Denmark, DTU
Course 34340, 2015.4.
[20] T. Koistinen, “Voice Coding in 3G Networks”, IP Telephony protocols, architectures and issues,
Helsinki University of Technology Networking Laboratory, Report 2/2001, pp. 39–46.
[21] Voice codecs, https://www.gl.com/voice-codecs.html.
[22] A. Rämö and H. Toukomaa, “On Comparing speech quality of various narrow- and wideband speech
codecs”, In Proceedings of the Eighth International Symposium on Signal Processing and Its
Applications, 28-31. August 2005, Sidney, Australia, pp. 603–606.
[23] J. Abichandani, J. Baenke, M. S. Irizarry, N. Saxena, P. Vyas, S. Prasad, S. Mada and Y. Z. Tafesse, „A
Comparative Study of Voice Quality and Coverage for Voice over Long Term Evolution Calls Using
Different Codec Mode-sets”, IEEE Access, vol. 5, June 2017, pp. 10315–10322.
[24] S. Malisuwan, D. Milindavanij and W. Kaewphanuekrungsi, “Quality of Service (QoS) and Quality of
Experience (QoE) of the 4G LTE perspective”, International Journal of Future Computer and
Communication, vol 5, no. 3, June 2016, pp. 158–162.
[25] D. H. Nguyen, “Enhancing and improving voice transmission quality over LTE network: Challenges and
Solutions”, Doctorat en co-accreditation Télécom Sudparis – Institut Mines- Télécom et L’Université
Pierre et Marie Curie – Paris 6, 24. February 2017.