a novel electrochemical method for olive oil acidity determination · 2020-04-16 · moreover, a...
TRANSCRIPT

A Novel Electrochemical Method for Olive Oil Acidity Determination
M. Grossia,*
, G. Di Lecceb, T. Gallina Toschi
c, B. Riccò
a
* Corresponding author : [email protected] , Tel. 0039-0512093082 , Fax 0039-0512093785
a Department of Electrical, Electronic and Information Engineering “Guglielmo Marconi” (DEI),
University of Bologna, Bologna, Italy
b Department of Food Chemistry, Eurofins Chemical Control, Cuneo, Italy
c Department of Agricultural and Food Sciences – DISTAL, University of Bologna, Cesena, Italy
Abstract
Olive oil is a very important product due to its nutritional value, sensory and antioxidant properties.
National and international regulations define basic quality parameters (such as acidity and peroxide
index) to discriminate high quality oils (extra virgin olive oil) from those of lower quality.
The standard procedures to measure acidity and peroxide index feature manual titration requiring
laboratory environment and trained personnel.
In this paper a novel technique, based on electrical impedance spectroscopy, is presented and
implemented as a low-cost, mobile instrument to be used everywhere and by anybody, with
substantial improvements of the current quality control of olive oil producers of any dimension.
The presented method is validated on 39 olive oil samples with different levels of acidity, peroxide
index and total phenolic content.
The results show that the conductance of an emulsion of olive oil with a hydro-alcoholic solution is
correlated with the oil acidity. Furthermore, since, for the same oil, the emulsion conductance varies
with the oil storage conditions (because of increases in the peroxide index), the presented technique
could also be used to evaluate product ageing.
Keywords: olive oil; free acidity; quality test; impedance technique; embedded sensor system.

1. Introduction
In the Mediterranean diet, olive oil is a major source of mono-unsaturated fatty acids, and is highly
appreciated as for numerous benefic biological effects [1].
Currently, about 95% of the world olive oil production is due to countries in the Mediterranean
area, with Italy being the second largest olive oil producer after Spain [2].
Olive oil quality is affected by different factors, such as: seasonal weather, the olives ripening stage,
extraction process and last but not the least the storage conditions (light and temperature) [3].
The most important parameters that define the olive oil quality are acidity and peroxide index. The
former, defined as the amount of fatty acids no longer linked to their parent triglyceride molecules,
is measured as percent of oleic acid in 100 grams of oil. The latter, instead, is an indicator of the oil
primary oxidation and is expressed as milliequivalent of active oxygen per kilogram of oil (meq
O2/kg oil). If storage conditions are not adequate (essentially due to lack of protection against heat
and light), oil oxidation takes place and degrades the product quality.
The European Commission Regulation No. 2568/91 and subsequent amendments impose a
maximum acidity of 0.8 g oleic acid/100 g oil and a maximum peroxide index of 20 meq O2/kg oil,
for extra-virgin olive oil [4].
The standard techniques to measure acidity and peroxide index in olive oil are titrations that can be
carried out only by skilled personnel in a laboratory environment. However, since cheap, fast and
in-situ determination of quality parameters would be useful during oil production, innovative
procedures are currently investigated and several techniques have been proposed.
One of the most promising approach to the problem is based on Near-Infrared (NIR) spectroscopy,
allowing to estimate acidity and peroxide index by optical spectroscopy analysis of the transmission
spectra in the wavenumber range 4541 to 11726 cm-1
[5]. NIR technique has also been used to
detect adulteration of extra-virgin olive oil with lower quality products [6]. Furthermore, a recently
proposed method, called spectral nephelometry, combining absorption spectroscopy and

nephelometry, has been used to obtain oil “fingerprints” allowing to distinguish products of
different geographical origins [7].
All the techniques based on light interaction with the sample are very promising since they allow
fast, non destructive measurements with minimal preparation of the sample. However, the
instrumentation needed is expensive and the procedures must be separately calibrated for different
types of oil (produced from olives of different varieties, different geographical origin, etc).
A different approach, microwave dielectric spectroscopy [8][9], is based on dielectric
measurements allowing fast discrimination of different acidity levels. However, to achieve good
accuracy test signals of high frequencies (hundreds of MHz) are necessary, and these, in turn,
require expensive instrumentation (time domain reflectometry).
A pH-metric technique for acidity determination (by extraction of free fatty acids into a solvent
phase) has also been proposed that does not require titration [10]. While such a technique provides
fast response (within a minute), the pH- meter with an aqueous reference electrode is expensive and
the reagents (0.20 M triethanolamine in a 1:1 solution of water and isopropanol) must be properly
disposed of after use.
In such a context, this paper presents a novel technique to measure olive oil acidity, based on
Electrical Impedance Spectroscopy (EIS), that is suitable for the realization of a simple, low-cost,
mobile instrument to be used everywhere and by anybody, with substantial improvements in the
current situation of oil producers of any dimension.
With EIS the sample under test (SUT) is stimulated with a sinusoidal test signal in a broad range of
frequencies and its electrical response (|Z| and Arg(Z)) is measured [11]. In recent years, this
technique has been used for the characterization of different characteristics of various products,
such as, in particular: water and lipid content in meat [12], dilution factor in apple puree [13],
ripening stage of different types of fruits [14][15], bacterial concentration in ice-cream [16][17],
raw milk [18], beer [19] and water [20].

In in this work, EIS features a SUT consisting of an emulsion of olive oil with a hydro-alcoholic
(i.e. aqueous) solution, tested with signal frequencies ranging from 20 Hz to 2 MHz. The results
show that the method is capable of discriminating olive oils of different acidity levels and peroxide
indexes, in particular in order to distinguish extra virgin olive oil from products of lower quality.
Moreover, a portable instrument (i.e. an embedded sensor system) based on such a technique has
been realized that allows in-situ acidity measurements with a short time response (40 seconds), thus
opening the road to distributed control procedures, affordable also by small oil producers, with
obvious benefits in terms of product quality.
2. Materials and Methods
A set of 39 olive oil samples (taken from local markets as well as coming from Italian mills) have
been tested to investigate the correlation between their quality parameters (acidity and peroxide
index) and the electrical conductivity of emulsions of such products with a suitable solution of safe
and easily disposable components.
2.1. Electrochemical sensor
Virgin olive oil contains a limited amount (1-2%) of chemicals known as “minor polar components”
(normally indicated as CMP and including free fatty acids, monoacylglycerols, diacylglycerols,
aliphatic alcohols di-and triterpene, sterols and hydrophilic antioxidants [21]), that are soluble in a
hydrophilic solution. For this reason, an emulsion of olive oil with a hydro-alcoholic solution made
of ethanol (60%) and distilled water (40%) has been used in the experiments made. Ethanol has
been chosen to adjust the polarity of the solution and preferred to methanol because it is not toxic.
The “measurement head” of the sensor hosting the emulsion is a 50 ml tube modified to include a
couple of cap-shaped stainless steel electrodes (6 mm in diameter, spaced by 12 mm one from the
other) required for the electrical characterization. Different ratios oil/aqueous solution have been
tested and the results are reported in Section III. The oil sample and the solution are mixed and

stirred to create the emulsion. The electrical measurements are performed with the sensor in a
thermal incubator at 20 °C.
2.2. Measurement setup
The measurement set-up of Fig. 1 a, making use of benchtop instruments is used to: a) validate the
characterization procedure introduced in this work; b) determine the essential features of the low-
cost, portable, embedded system representing the final goal of this work.
The thermal incubator Binder APT KB 53 is set to 20 °C to guarantee that all samples are tested at
the same temperature. The Agilent E4980A LCR meter, controlled by a laptop through a USB
interface, applies to the sensor electrodes a sinusoidal voltage of 100 mV and measures the sample
electrical parameters |Z| and Arg(Z) over the frequency range 20 Hz – 2 MHz . The laptop acquires
the data from the LCR meter and stores them on the hard disk. All the programs for instrumentation
control have been developed with LabVIEW (National Instruments, USA).
2.3. Equivalent circuit model
Both the hydro-alcoholic solution and the emulsion have been characterized with the measurement
set-up presented in the previous Subsection. A typical Nyquist diagram, i.e. Im(Z) vs Re(Z) for the
entire frequency range, is shown in Fig. 1 (b). As can be seen, in both cases the plot is a semi-circle
with the center on the x-axis, while Re(Z) as well as Im(Z) tend to 0 as ω → +∞, indicating that the
sensor-sample system is well described by an equivalent circuit formed by a conductance in parallel
with a capacitance. Thus:
mm CjGZ
Y ω+== 1 , (1)
( )22
mm
mm
CG
CjGZ
ω
ω
+
−=
, (2)
where Gm and Cm account for the sample conductivity and dielectric properties, respectively.

The electrical parameters have been calculated by fitting the equivalent circuit formed by a
conductance Gm in parallel with a capacitance Cm using Multiple Electrochemical Impedance
Spectra Parametrization (MEISP) v3.0 by Kumho Chemical Laboratories. The hydro-alcoholic
solution is characterized by values of Gm 0.711 ± 0.038 µS and Cm 7.396 ± 0.188 pF.
As such a solution is mixed with the oil and the emulsion is created, Gm exhibits a strong increase
while Cm decreases. The increase of Gm is essentially due to the dissociation of the free fatty
molecule RCOOH (where R is the monovalent functional group ( ) ( )72723 CHCHCHCHCH = ) as well
as of other polar compounds present in the oil.
Measurements on all available olive oil samples have shown that Cm is almost always the same, as
expected since the dielectric properties of vegetable oils at low frequencies (< 10 MHz) are known
not to vary significantly from one case to the other.
On the contrary, Gm varies significantly with different oil samples and turns out to be well suited
for acidity determination.
The data obtained with measurements using the full spectrum range 20Hz-2MHz have shown that,
as expected from equation (1), Re(Y) is (almost) constant throughout this whole frequency range.
Fig. 1 (c) shows plots of |Y| and Re(Y) vs frequency for emulsions with oils featuring different
values of acidity. As can be seen, |Y| is almost constant (at a value that correlates with the sample
acidity) for frequencies lower than 10 kHz, while for f > 200 kHz it has (approximately) the same
value for all the samples.
In practice, |Y| is dominated by the emulsion conductance Gm at low frequencies, while the
emulsion capacitance Cm dominates at high frequencies. As for Re(Y) the measured value is almost
constant on the whole spectrum with very stable values for frequencies lower than 100 kHz.
Thus Gm can be calculated from data taken at a single frequency with an error < 0.5% compared to
the value obtained using the full frequency spectrum 20Hz-2MHz, and this largely simplifies the
design of the embedded system presented in Section 4.
2.4. Reference methods

All tested samples have been analyzed using the reference methods (i.e. manual titration) defined by
the European Commission Regulation No. 2568/91 [4].
In the case of acidity determination, the titrant is sodium hydroxide NaOH 0.1 M, while the titrand
is a solution composed of an alcohol-diethyl ether mix, phenolphthalein (as indicator) and the oil
sample.
Instead, for the determination of peroxide index, the titrant is sodium thiosulphate Na2S2O3 and the
titrand a mix of acetic acid, chloroform, saturated solution of potassium iodide KI, starch (as
indicator) and the oil sample.
3. Results and discussion
First, measurement for acidity determination has been optimized finding the best oil to hydro-
alcoholic solution ratio. Successively, the effect of storage conditions has been considered. Finally,
a set of 39 olive oils (purchased from markets as well as taken from Italian olive oil mills) have
been used to validate the resulting techniques.
3.1. Choice of the oil/hydro-alcoholic solution ratio
Three different oil vs. hydro-alcoholic ratios have been investigated to achieve the best accuracy in
acidity determination, namely: (a) 15 ml oil and 15 ml solution, (b) 5 ml oil and 15 ml solution, (c)
1 ml oil and 15 ml solution.
To this purpose, an olive oil sample has been artificially modified with the addition of different
concentration of oleic acid to obtain samples differing only for their acidity, while presenting the
same remaining composition (peroxide index, polyphenol content, fatty acid profile etc.). Four
different test samples were created, featuring acidity of : 0.35%, 0.75%, 1.25% and 2.25%. All
measurements have been carried out in triplicate and both mean value and standard deviation have
been calculated.
The measured values of Gm plotted vs the sample acidity are shown in Fig. 2. As can be seen, in all
cases Gm increases with the sample acidity, while the best results are obtained with emulsions

featuring 1 ml of oil and 15 ml of hydro-alcoholic solution (case c). In such a case, in fact, as also
indicated in Table 1, the sensitivity (variation of Gm in µS for 1% variation of the sample acidity) is
almost two and six time larger than that of case (b) and case (a), respectively.
The same holds for the error in acidity estimation, with case (c) achieving a very low value
(0.0756%), more than 15 times lower than case (a).
As for linearity, the results of case (b) and (c) are comparable and much better than (a).
Thus, in our subsequent work only emulsions of 1 ml of olive oil with 15 ml of hydro-alcoholic
solution have been used.
3.2. Effects of the storage conditions
To investigate if Gm measurements can be used to investigate, and possibly monitor, the effects of
olive oil storage conditions the following stress test has been performed. Three different extra-
virgin olive oil samples initially in good storage conditions (i.e. peroxide index between 7 and 10
meq O2 / kg oil) have been irradiated with UV for different amount of time and the conductance of
the emulsion described above has been measured before the exposition to UV as well as after 2.6,
4.8 and 7.6 days, respectively. As shown in Fig. 3, the results indicate a strong increase in Gm (due
to both primary and secondary oxidation products [21]) with the duration of the UV exposure.
Linear regression lines have been determined for all the three samples and the calculated slope (i.e.
Gm variation for day of UV exposure) ranges from 0.326 to 0.392 µS/day.
3.3. Technique validation
A set of 39 olive oils, substantially different from each other for olive cultivar, acidity, peroxide
index and total phenolic content, have been used to validate the optimized technique described in
the previous Sections. These products, characterized by means of the standard procedures [4],
feature acidity values from 0.1% to 2.25%, peroxide index from 4 to 75 meq O2/kg oil and phenolic
content from 30 to 700 ppm.
Fig. 4 (a) clearly shows that Gm increases with oil acidity value for samples in good storage
conditions (i.e. peroxide index < 20). The measured conductance is linearly related to oil acidity for
values < than 1%, while for higher values the sensitivity tends to decrease. In particular, the
calculated linear regression line equation for acidity < 1% is Gm = 3.15·acidity + 0.8 and the
determination factor is R2 = 0.74. Thus, from the measured data, extra-vergin oils can be easily
identified by setting a conductance threshold Gm < 2.75 µS (corresponding to acidity < 0.8%.)
Similarly, all samples featuring Gm > 3.25 µS are characterized by acidity > 0.8%, while in the
conductance range 2.75-3.25 µS the samples acidity is close to 0.8% (0.68% to 0.85%).
In Fig. 4 (b), showing the results obtained with the full set of tested oils, each sample is represented
by a dot as a function of acidity and peroxide index (determined by the standard procedures). All
samples inside the dashed area are extra-virgin olive oils (acidity < 0.8% and peroxide index < 20).
As already mentioned, samples with high acidity feature high values of Gm . However, also samples
with low acidity but high peroxide index exhibit high values of Gm.
The correlation between measured Gm , oil acidity and peroxide index has been tested using a
Pearson correlation test with a significance of 0.05. In both cases (the observed value is 0.752 for
acidity and 0.599 for peroxide index with a bilateral p-value always lower than 0.0001) the test
confirmed the presence of correlation.
A multiple linear regression analysis has been carried out to express Gm as function of both acidity
and peroxide index. The resulted equation is Gm = 2.11·acidity + 0.0478·peroxide +0.663 with a
determination factor R2 = 0.825.
Clustering the samples according to measured Gm, all extra virgin olive oil samples are correctly
distinguished from those of lower quality, except in one case where an oil is classified as extra-
virgin in spite of its peroxide index > 20.
4. A low-cost mobile sensor
The measurements carried out using bench-top instrumentation described so far have indicated that
the proposed technique can be reliably used to estimate the acidity (as well as quality loss due to
oxidation) for olive oil samples.

To this purpose, an embedded portable electronic system, in practice a complete sensor, has been
realized that allows data to be collected directly at the olive oil mills, thus eliminating the need to
ship samples to (often distant) laboratories for analysis, with significant advantages in terms of both
time and costs.
The system is shown in Fig. 5 (a) and its schematic is illustrated in Fig. 5 (b). The “measurement
head” is the same as that used with bench-top instrumentations, i.e. a 50ml tube with a couple of
cap-shaped stainless steel electrodes. The electrical parameters of the SUT are measured by means
of an electronic board designed ad-hoc and the data are transferred to a portable PC for visualization
and backup.
Differently from the experiments with laboratory set-up, where the emulsion conductance Gm has
been measured over the whole impedance spectrum from 20 Hz to 2 MHz, the portable system
operates at a single frequency (200 Hz) and estimates Gm with Re(Y) as explained in Section 2.3.
Since the measured conductance is small (few uS) the input sine-wave used in the portable system
features an amplitude of 1 V (ten times larger than the one used with the laboratory set-up) to
achieve higher signal-to-noise ratio. To this purpose, it has been verified that the increased
amplitude of the test signal does not produce a significant difference in the measured conductance.
The schematic of the electronic board used to measure the emulsion conductance Gm is presented in
Fig. 5 (c). The sine-wave test signal is generated with an AD9833 function generator (600mV
amplitude, 345mV DC offset and 200Hz frequency). The generated signal (Va) is fed to a
differential amplifier to remove the DC offset (Vb) and for further amplification (Vin) to obtain a
200Hz, 2VPP sine-wave signal. The test signal Vin(t) is applied to the sensor electrodes only during
the measurement (by means of two OMRONG6J-2FS-Y relais) and the current Iin(t) is measured
with a current to voltage (I/V) converter whose output Vout(t) is linearly related to Iin(t):
sensorF
sensor
F
in
outYR
Z
R
V
V−=−=~
~
, (3)

where Ṽout and Ṽin are Steinmetz transforms of the time domain signals Vout(t) and Vin(t). The
feedback resistance RF is a programmable resistance (0-100kOhm, 255 steps) whose value is set at
the beginning of the measurements: the device has been initially calibrated and a look-at table has
been set-up to associate the device digital input with the corresponding resistance value.
The signals Vin(t) and Vout(t) are then amplified and fed to 12-bits analog to digital converters
(ADCs) providing a digital signal successively processed by the DSPIC33ep512 microcontroller
(filtering out line and high frequency noise). The amplification gains of the Vc and Vd branches
have been experimentally measured during board testing and the differences with the nominal
values have been compensated via software.
Indicating with VdM and VcM the amplitude of the sinusoidal signals Vd(t) and Vc(t), respectively
and with φ the phase difference it is:
in
out
cM
j
dM
c
d
V
V
V
eV
V
V~
~
~
~
==
ϕ
. (4)
Thus from Eq (1), (3) and (4):
( ) ( ) ( )mmFsensorF
cM
dM
cM
dM CjGRYRsenV
Vj
V
Vωϕϕ +−=−=+cos
(5)
and the emulsion conductance Gm can be estimated as:
( )ϕcos1
cM
dM
F
mV
V
RG −=
(6)
The parameters VcM, VdM and φ are estimated using the algorithm discussed in [22] based on the
minimization of least square errors.
A user-friendly interface for the system has been created using the software LabVIEW (National
Instruments, USA). The main panel of such an interface is shown in Fig. 6 (a). At the beginning of
the measurement the user fills the sensor with 15ml of the hydro-alcoholic solution and performs a
test (solvent test) to check whether or not the solution electrical properties are adequate, i.e. it is not
too conductive. Then, 1ml of the olive oil to be tested is added and all is stirred to create the
emulsion, whose Gm is then measured to estimate the oil acidity.

The measured value is represented on a slide graph providing immediate information about the oil
quality ranking (extra-virgin olive oil, virgin olive oil or lampante olive oil).
A limited number of olive oil samples have been tested using the embedded system described above
and the results are shown in Fig. 6 (b). As can be seen, the measured electrical conductance is
correlated with oil acidity. Low acidity extra-virgin olive oils (featuring acidity < 0.4%) all feature
Gm values lower than 2.75µS, samples with acidity close to 0.8% are characterized by Gm value
between 2.75 and 3.25 µS, while virgin and lampante oil samples exhibit much larger conductance.
The calculated linear regression line is Gm = 3.34·acidity + 0.95 and the determination coefficient
R2 = 0.98.
Future implementations of our portable system will feature a wireless communication system to
allow rapid collection (and storing) of data for real-time, quick quality control.
4. Conclusions
A novel technique to measure acidity as a principal quality parameter of olive oil has been
presented. The method is based on Electrical Impedance Spectroscopy, namely measurements of the
electrical characteristics of an emulsion between the oil and a suitable hydro-alcoholic solution.
The results obtained with a significant lot of oil samples of different origin show that the electrical
conductance Gm of the emulsion can be used as a parameter to determine oil acidity. Furthermore,
for samples with comparable values of acidity, Gm increases because of stressing storage conditions
(resulting in higher peroxide index).
In practice, then, the measured values of Gm can be used to discriminate extra virgin olive oils
(acidity < 0.8%, peroxide index < 20) from product of lower quality.
The technique has been implemented in the form of a low-cost portable electronic system suitable
for rapid, in-situ quality checks even in small mills, as well as for distributed and on-line quality
control by larger producers.

Acknowledgment
This work has been financially supported by the CESAR Project, RIDIIT program, funded by the
Ministry of Economic Development (Italy).
References
[1] S. Tulipani, M. Martinez Huelamo, M. Rotches Ribalta, R. Estruch, E. Escribano Ferrer, C.
Andres-Lacueva, M. Illan, R.M. Lamuela-Raventós, Oil matrix effects on plasma exposure and
urinary excretion of phenolic compounds from tomato sauces: Evidence from a human pilot study,
Food Chem., 130 (2012) 581-590.
[2] F. Carbonari, T. Sarnari, Il mercato internazionale e nazionale dell’olio di oliva, ISMEA, 2013,
pp. 1-13.
[3] R. Sacchi, L. Mannina, P. Fiordiponti, P. Barone, L. Paolillo, M. Patumi, Characterization of
italian extra virgin olive oils using 1H-NMR spectroscopy, J. Agr. Food Chem., 46 10 (1998) 3947-
3951.
[4] EC 1991 Commission Regulation (EEC) 2568/91 of July 11th
1991 on characteristics of olive oil
and on the relevant methods of analysis. Official EC Journal, L248 (1991) 0001–0083.
[5] S. Armenta, S. Garrigues, M. de la Guardia, Determination of edible oil parameters by near
infrared spectrometry, Anal. Chim. Acta, 596 (2007) 330-337.
[6] D. Ozdemir, B. Ozturk, Near infrared spectroscopic determination of olive oil adulteration with
sunflower and corn oil, J. Food Drug Anal., 15 1 (2007) 40-47.
[7] A. G. Mignani, P. R. Smith, L. Ciaccheri, A. Cimato, G. Sani, Spectral nephelometry for
making extravirgin olive oil fingerprints, Sensor Actuat. B-Chem., 90 (2003) 157-162.
[8] A. Cataldo, E. Piuzzi, G. Cannazza, E. De Benedetto, Dielectric spectroscopy of liquids through
a combined approach: evaluation of the metrological performance and feasibility study on vegetable
oils, IEEE Sensor J., 9 10 (2009) 1226-1233.

[9] A. Cataldo, E. Piuzzi, G. Cannazza, E. De Benedetto, L. Tarricone, Quality and anti-adulteration
control of vegetable oils through microwave dielectric spectroscopy, Measurement, 43 (2010) 1031-
1039.
[10] Ya.I. Tur’yan, O.Yu. Berezin, I. Kuselman, A. Shenhar, pH-metric determination of acid
values in vegetable oils without titration, J. Am. Oil Chem. Soc., 73 3 (1996) 295-301.
[11] B.-Y. Chang, S.-M. Park, Electrochemical impedance spectroscopy, Annu. Rev. Anal. Chem.,
3 (2010) 207-229.
[12] M. Chanet, C. Riviere, P. Eynard, Electric impedance spectrometry for the control of
manufacturing process of comminuted meat products, J. Food Eng., 42 (1999) 153-159.
[13] R. Zywica, G. Pierzynowska-Korniak, J. Wojcik, Application of food products electrical model
parameters for evaluation of apple puree dilution, J. Food Eng., 67 (2005) 413-418.
[14] F.R. Harker, J.H. Maindonald, Ripening of nectarine fruit: changes in the cell wall, vacuole
and membranes detected using electrical impedance measurement, Plant Physiol., 106 (1994) 165-
171.
[15] F.R. Harker, S.H. Forbes, Ripening and development of chilling injury in persimmon fruit: an
electrical impedance study, New Zeal. J. Crop Hort., 25 (1997) 149-157.
[16] M. Grossi, M. Lanzoni, A. Pompei, R. Lazzarini, D. Matteuzzi, B. Riccò, Detection of
microbial concentration in ice-cream using the impedance technique, Biosens. Bioelectron., 23
(2008) 1616-1623.
[17] M. Grossi, A. Pompei, M. Lanzoni, R. Lazzarini, D. Matteuzzi, B. Riccò, Total bacterial count
in soft-frozen dairy products by impedance biosensor system, IEEE Sensor J., 9 10 (2009) 1270-
1276.
[18] M. Grossi, M. Lanzoni, A. Pompei, R. Lazzarini, D. Matteuzzi, B. Riccò, A portable biosensor
system for bacterial concentration measurements in cow’s raw milk, P. 4th
IEEE Int. Wksp. Adv.
Sensor Interfac. (IWASI), Savelletri di Fasano, Italy, (2011) 132-137.

[19] A. Pompei, M. Grossi, M. Lanzoni, G. Perretti, R. Lazzarini, B. Riccò, D. Matteuzzi,
Feasibility of lactobacilli concentration detection in beer by automated impedance technique,
MBAA Tec. Q., 49 1 (2012) 11-18.
[20] M. Grossi, R. Lazzarini, M. Lanzoni, A. Pompei, D. Matteuzzi, B. Riccò, A portable sensor
with disposable electrodes for water bacterial quality assessment, IEEE Sensor J., 13 5 (2013) 1775-
1782.
[21] E. Boselli, G. Di Lecce, M. Minardi, D. Pacetti, N.G. Frega, La spettrometria di massa
nell’analisi di componenti minori polari dell’olio vergine di oliva, Riv. Ital. Sostanze Gr., 84 (2008)
3-14.
[22] M. Grossi, M. Lanzoni, R. Lazzarini, B. Riccò, Linear non iterative sinusoidal fitting algorithm
for microbial impedance biosensor, Sensor Transducer J., 137 2 (2012) 235-244.

Fig. 1 The experimental set-up used to develop, optimize and validate the technique of this work
(a). The Nyquist plot for both the hydro-alcoholic solution and the emulsion (b). |Y| and Re(Y)
plotted vs. frequency for emulsions with oils featuring different values of acidity (c).
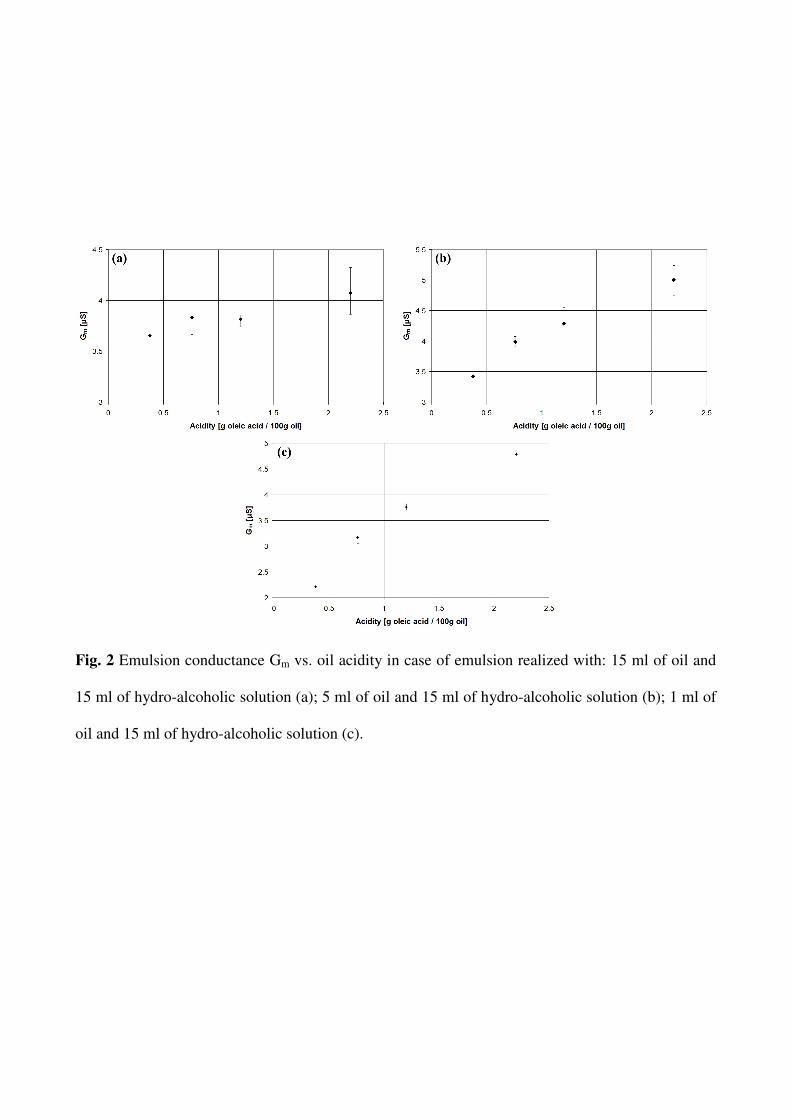
Fig. 2 Emulsion conductance Gm vs. oil acidity in case of emulsion realized with: 15 ml of oil and
15 ml of hydro-alcoholic solution (a); 5 ml of oil and 15 ml of hydro-alcoholic solution (b); 1 ml of
oil and 15 ml of hydro-alcoholic solution (c).

Fig. 3 Emulsion conductance Gm vs. UV exposure time for three different extra-virgin olive oil
samples.

Fig. 4 Emulsion conductance Gm vs. oil acidity for a subset of olive oils featuring peroxide index <
20 (a). A scatter plot of the full set of tested oils plotted as a function of acidity and peroxide index.
The samples inside the dashed area are extra-virgin olive oils (b).

Fig. 5 Picture (a) and schematic (b) of the portable embedded system for olive oil acidity
determination. Electrical schematic (c) of the system electronic board.

Fig. 6 Front panel of the software used to control the embedded system (a). Electrical conductance
measured with the embedded system plotted vs. oil acidity for different olive oil samples (b).

Sensor performance Oil to aqueous solution ratio
Sensitivity (µS/%) Error in acidity estimation (%) Non linearity (%)
15 ml : 15 ml 0.21 1.528 16.26
5 ml : 15 ml 0.82 0.424 7.98
1 ml : 15 ml 1.34 0.0756 9.87
Table 1 Sensor performance as function of the oil / aqueous solution ratio.