a novel computation technique for single and …jestec.taylors.edu.my/vol 7 issue 5 october...
TRANSCRIPT
Journal of Engineering Science and Technology Vol. 7, No. 5 (2012) 601 - 613 © School of Engineering, Taylor’s University
601
A NOVEL COMPUTATION TECHNIQUE FOR SINGLE AND MULTIFACE DETECTION USING EUCLIDEAN DISTANCE
AND PRINCIPAL COMPONENT ANALYSIS (PCA)
MAHMOUD A. M. ALBREEM*, SHAHREL A. SUANDI
Intelligent Biometric Group, School of Electrical and Electronic Engineering,
Universiti Sains Malaysia (USM), 14300 Nibong Tebal, Pulau Pinang, Malaysia
*Corresponding Author: [email protected]
Abstract
Face detection system attracts huge attention in recent years due to it may
improve security of surveillance systems. In developing a face detector system,
there are sub problems arise; one of these sub problems is the low accuracy.
Principal Component Analysis (PCA) is well known to be one of the methods
for face recognition and detection, in where a threshold value has to be fixed in
the Euclidean distance computation. Computing a fixed threshold for multi
environment is very difficult which consequently leads to performance
reduction. As such, this paper proposes a method which does not rely on
threshold value but instead, merely relies on Euclidean distance between two
subspaces. A standard database developed by Massachusetts Institute of
Technology (MIT) Centre for Biological and Computation Learning (CBCL) is
used to evaluate the proposed method. In the testing stage, real life images are
used as well. Comparison results between the proposed method and the original
method show that the proposed method can reduce the dimension until 60% and
has a good competent accuracy (89.34%) for single and multiface detection
although performs slower than normal PCA.
Keywords: Face detection, Principal component analysis (PCA), Euclidean
distance, Eigenvalue, Eigenvector, Eigenface.
1. Introduction
Face detection is a computer technology that determines the locations and sizes of
human faces in arbitrary (digital) images. It detects faces and ignores anything
else, such as building, trees and bodies. After face detection is applied, the system
can be further developed to extract facial features. Generally, face detection plays

602 Mahmoud A. M. Albreem and Shahrel A. Suandi
Journal of Engineering Science and Technology October 2012, Vol. 7(5)
Nomenclatures
1-D One dimension
2-D Two dimensions
AAT Covariance matrix C = AA
T
C Covariance matrix
E1 Square norm between η and µ
E2 Euclidean distance between υ and ς
Ii Image’s name
I(x,y) Two dimensional image
M Number of images in training set
x Norm vector
Greek Symbols
𝜏 Proposed Eignefaces
𝜍 Projection of µ to another space
𝜃 Threshold value
𝛾 Eigen vectors
𝜂 Projection of the centred image vectors into facespace
Γ Column vector
Ψ Average image face vector
Φ Subtraction of the mean from each image
υ Centre the reshaped input image
µ Projection of the centred test image vectors into facespace
Abbreviations
CBCL Centre for Biological and Computation Learning
MIT Massachusetts Institute of Technology
PCA Principal Component Analysis
an important role in many applications, such as the security [1-3]. There are many
challenges in object detection problem and its accuracy, particularly in the problem of
face detection. These can be outlined as pose variation, lighting and texture variation,
background variation and shape variation [4]. Numerous algorithms have been
proposed for face detection. Mahmoud et al. [5 ] investigated the most efficient
and effective training methods for use in image compression and its subsequent
applications. They examined the performance of Multilayer Feed Forward
Artificial Neural Network performance in image compression using different
learning algorithms. The obtained results show that the Q uasi-Newton based
algorithm has better performance as compared to the other two algorithms.
Among other algorithms for high detection rate is Principal Component Analysis
(PCA) [3 , 6 ]. We will concentrate on PCA in this paper. When measuring only
two variables, such as height and weight in a dozen of patients, it is easy to plot
this data and visually assess the correlation between these two factors.
However, in typical experiments, the expression of thousands of variables is
measured across many conditions. Therefore, it becomes impossible to visually
inspect the relationships between variables. One way to make sense of this data is
to reduce its dimensionality and extract only relevant information from this high

A Novel Computation Technique for Single and Multiface Detection…. 603
Journal of Engineering Science and Technology October 2012, Vol. 7(5)
dimensionality data. The main idea of using PCA for face recognition/detection is
to express the large 1-D vector of pixels constructed from 2-D facial image into
the compact principal components of the feature space; this can be called
eigenface projection. Eigenface is calculated by identifying the eigenvectors of
the covariance matrix derived from a set of facial images (vectors) [7, 8]. Our
principal method does not rely on threshold value but instead introduces a method
which relies on Euclidean distance between two newly introduced subspaces.
The reminder of this paper is organized as follows: Section 2 introduces the
proposed method in details, Section 3 describes the experiment, Section 4 explains
the experiment results and discussion, and finally Section 5 concludes the paper.
2. Proposed Method
In the language of information theory, we are interested in extracting the relevant
information in a face image, encode it as efficiently as possible, and compare one
encoded face with a database of models encoded similarly. In mathematical terms,
we wish to find the principal components of the distribution of faces, or the
eigenvectors of the covariance matrix of the set of face images. These
eigenvectors can be thought of as a set of features which together characterize
contributes more or less to each eigenvector, that can display the eigenvector as a
sort of ghostly face which we call an eigenface [4, 9]. In normal PCA, a threshold
value is fixed as the value to decide a valid answer or not. Threshold value has
been avoided in the proposed method, in where the decision in the proposed
method depends on the comparison between Euclidean distances in different
spaces. All of these distances are normalized to the same reference.
Let an image I(x,y) be two dimensional N×N array of intensity values. Each
image is converted to a vector of dimension N2 as shown in Fig. 1. The following
steps describe the implementation of proposed method.
N * N
Image(N * N) *1
Vector
Fig. 1. Converting Image of N×N to a Vector of Dimensions N
2.
Step 1: Let the training set contain images I1, I2, I3, …… IN. Step 2: Each image Ii is converted to a column vector i.
Step 3: All values are combined so that each column contains a face vector as shown in Fig. 2.
Step 4: Compute the average image face vector.
(1)
Step 5: Mean face vector (average face vector) is subtracted from each training
image to get a new set of vectors.

604 Mahmoud A. M. Albreem and Shahrel A. Suandi
Journal of Engineering Science and Technology October 2012, Vol. 7(5)
(2)
Step 6: Calculate the covariance matrix, .
where (3)
Fig. 2. Combining of All Reshaped Images.
Step 7: Computing the eigenvectors of AAT is not feasible computationally. We can
determine the eigenvectors by first solving the much smaller M×M matrix problem and
taking linear combination of the resulting vectors AAT.These vectors are subjected to
principle component analysis which finds a set of orthogonal and their eigenvalues
to describe the distribution of data [10]. So, we get M eigenvectors and eigenvalues.
Step 8: Keep only these eigenvectors γ, which are the best describe the image, as explained before. Since eigenvectors are equal in number to the training images,
these eigenvectors are taken as the eigenfaces.
Step 9: Generate a new matrix which is called a “proposed eigenfaces ”, which
is determined using Eq. (4) (4)
Step 10: Project centered image vectors into facespace using Eq. (5)
(5)
Step 11: Input the train image to the system for testing.
Step 12: Reshape the input image as in Fig. 2 and centre it. This image is labelled as υ. (6)
Step 13: Project centered test image vectors into facespace using equation (7)
(7)
Step 14: Calculate the square norm of as shown in equation (8) 2
1)]([ normE (8)
Note that the norm of is captured by the formula
Step 15: Project to another space by multiplying it by ,
(9)
Step 16: Calculate the Euclidean distance, between and .
A Novel Computation Technique for Single and Multiface Detection…. 605
Journal of Engineering Science and Technology October 2012, Vol. 7(5)
(10)
Step 17: and should be normalized before the classification. We want to
divide the and over one reference. This reference is .
Step 18: Compare E1 to E2, if (E1 > E2), the input image is face, otherwise is non-face.
3. Experiments
The proposed method has two main parts; the training part and the testing part. In
the training part, CBCL database is used. In CBCL database, there are 2429
training images and 471 testing images. Each image size is 19×19. In the testing
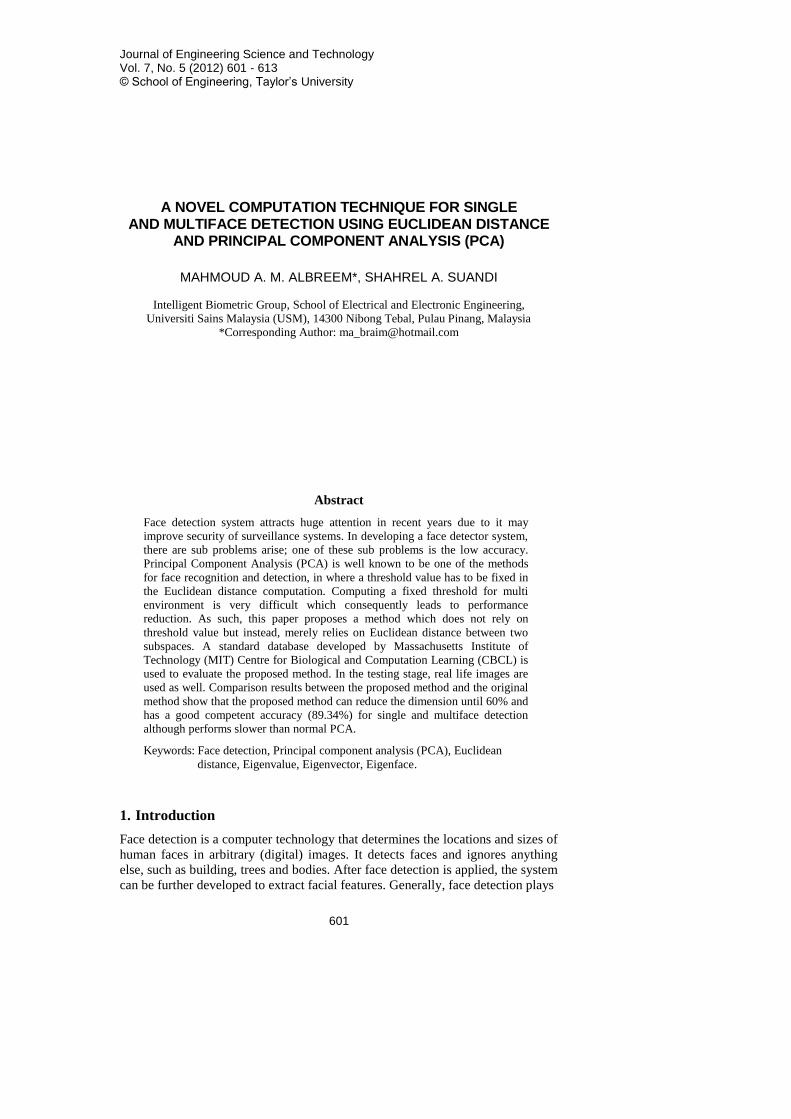
part, real life images were used in addition to this CBCL database. Figure 3 shows
examples of the CBCL training images.
Fig. 3. Examples of CBCL Training Images.
3.1. Training stage
In the training stage, the goal is evaluate how the proposed method performs in
terms of dimension reduction or in other words, to decide how many eigenfaces
should be used. The number of eigenfaces should equal to the number of images
in the training set, so the system has 2429 eigenfaces. Figure 4 shows the block
diagram of proposed method while Fig. 5 shows the detection rate by selecting a
specific number of “proposed eigenfaces”.
Figure 6 shows that the time is increased as the number of principal
component increased. The detection rate goes to stability at 929 eigenface (39%
of all eigenfaces) and there is a huge time difference between 929 eigenfaces and
all eigenfaces. This is because only 39% of eigenfaces is selected to be used for
face detection system. Table 1 shows the comparison between the original and
proposed method in the training stage while Table 2 shows the mathematical
comparison between the original and proposed method.

606 Mahmoud A. M. Albreem and Shahrel A. Suandi
Journal of Engineering Science and Technology October 2012, Vol. 7(5)
Face Detection
(Single/ Multiface)
Selected 40% (or above) of
Eigenfaces as the Principal
Components
Number of
Eigenfaces equal to
the number of
images in the
training set
Generate
Eigenfaces
Select the
Principal
Components
Results
Fig. 4. Block Diagram of the Proposed Method.
Fig. 5. Principal Components (PCs) vs.
Detection Rate Using Proposed Method.
Fig. 6. Time (s) vs. Number of PCs.
Table 1. Comparison in Terms of Detection Rate and Processing Time
between the Original and Proposed Methods in Training Stage.
Criteria
Original method Proposed method
# of eigenfaces
All 60% 40% All 60% 40%
Detection rate (%) 91.29 89.17 88.74 93.20 91.93 90.23
Processing time (s) 189.34 55.54 24.73 420.0 239.30 137.80
A Novel Computation Technique for Single and Multiface Detection…. 607
Journal of Engineering Science and Technology October 2012, Vol. 7(5)
Table 2. Mathematical Comparison
between the Original and Proposed Methods.
3.2. Testing stage
After determining the eigenfaces in the training stage, we further test the proposed
method using the real life image. Examples are shown in Fig. 7. Note that, each
image has a different size. Firstly, the mask size of 19×19 was used to scan the
image that is of the same image size the training set. The pseudo code of the
proposed method is shown in Fig. 8.
Fig. 7. Examples of Test Images Used in Testing.
Criteria Original method Proposed method
Creation of training set Training set contains I1,..IM Training set contains I1,..IM
Reshaping of each image Each image I is converted to a
column vector i
Each image I is converted to a
column vector i
Images after reshaping All reshaped image are combined in
one matrix
All reshaped image are combined in
one matrix
Average image face vector
M
i
iM 1
1
M
i
iM 1
1
Subtraction of the mean from each
image ii
ii
Computing the covariance matrix T
n
M
nn
AAM
C
)(1 '
1
T
n
M
nn
AAM
C
)(1 '
1
Compute the eigenvalues and
eigenvectors
select the eigenvectors related to
higher eigenvalues, called
eigenfaces
select the eigenvectors related to
higher eigenvalues, called
eigenfaces
Proposed eigenfaces is created -NA-
i
Projection of centered images into
facespace i
T i
T
Enter the tested image Input the tested image Input the tested image
Reshaping Reshape the input image υ Reshape the input image υ.
Project centered test image into
facespace
)( T
kkw
]....,.........,[21 k
t
i
T
-NA-
Euclidean distance calculations -NA-
2
1)]([ normE
.*222
2E
Normalization -NA-
E’2= E2 / & E’1= E1/
Decision kk
E’2 > E’1
(a) (b) (c) (d) (e)
(f) (g) (h) (i) (j)

608 Mahmoud A. M. Albreem and Shahrel A. Suandi
Journal of Engineering Science and Technology October 2012, Vol. 7(5)
Fig. 8. Pseudo Code of the Proposed Method.
Images are scanned by shifting 5 pixels of the mask. Obviously, some faces
are larger than 19×19, therefore, a mask which is larger than 19×19 is created. A
scale of 1.5 is used to compute the size in each testing. We tried to find the result
at 60% and 40% of eigenfaces, because previous study [1] proved that 60% of
eigenfaces had achieved good result. Based on the proposed method’s result, we
can say that 40% of eigenfaces have an acceptable average accuracy, which
consequently confirms that 60% can be removed for better result. In the current
work, false positive is defined as when an image region is declared to be a face
but it is not. In contrast to this, false negative is defined as when an image region
that is a face is not detected as face [10-12].
4. Results and Discussion
The performance of proposed method is tested using single and multiface detection.
Real life images are picked randomly and used as inputs to the system. Figure 7
shows male and female combined images which have been used in the experiments.
Tables 3 and 4 are the results summaries obtained by multiface of five different
images (Figs. 7(a), (b), (c), (d) and (e)) with 40% and 60% eigenfaces respectively.
Table 3. Summary of Multiface Analysis Image
Using Proposed Method with 40% Eigenfaces.
Size (pixel)
Imag
es
Qu
an
tity
faces
Nu
mb
er o
f
co
rrec
t
dete
cti
on
Fa
lse
po
siti
ve
an
swer
Fa
lse
nega
tiv
e
an
swer
Accu
racy
(%)
Process
ing
tim
e (
s)
368×496 a 12 10 0 2 83.33 10440
288×464 b 14 13 1 1 92.86 9396
304×336 c 14 13 1 1 92.86 8640
448×656 d 15 15 1 0 100 12600
752×1136 e 18 13 2 5 72.22 13464
Total (5 images) 73 64 5 9 87.67 54540
Begin:
(Reshape) all images in the training set,
(Combine) all images in one matrix,
(Find) the covariance matrix,
(Find) the eigenvectors and eigenvalues then select the eigenvectors which are related to the highest
eigenvalues, called it “eigenface”
) Create( a neweigenface which is eigenface multiplied by the combined images matrix,
)Project( the combined images matrix into another space by multiplying it by neweigenface,
(Enter( the tested image, reshaped it, and project it to another sub eigenface,
)Find( the Euclidean distance between the “project test image” and the projection of the combined training
set images,
)Project( the “project test image” again,
(Find) the Euclidean distance between the reshaped test image and the second projection of the test image,
If (the “Euclidean distance between the reshaped test image and the second projection of the test image” is
bigger than the “Euclidean distance between the “project test image” and the projection of the combined training
set images”)
Then The tested image is a face
Else
The tested image is non face
End
End

A Novel Computation Technique for Single and Multiface Detection…. 609
Journal of Engineering Science and Technology October 2012, Vol. 7(5)
Table 4. Summary of Multiface Analysis Image
Using Proposed Method from Real Life with 40% Eigenfaces.
Size (pixel)
Imag
es
Qu
an
tity
faces
Nu
mb
er
of
corr
ect
dete
cti
on
Fa
lse
po
siti
ve
an
swer
Fa
lse
nega
tiv
e
an
swer
Accu
racy
(%)
Process
in
g t
ime (
s)
368×496 a 12 11 0 1 91.67 11484
288×464 b 14 13 1 1 92.86 10148
304×336 c 14 13 1 1 92.86 9678
448×656 d 15 14 1 1 93.33 13847
752×1136 e 18 14 2 4 77.77 14877
Total (5 images) 73 65 4 8 89.7 60034
Tables 5 and 6 are the summaries of results obtained by five single face images
(Figs. 7(f), (g), (h), (i) and (j)) using the proposed method. Tables 7 and 8 are the
summaries of results obtained by five multi faces images (Figs. 7 (a), (b), (c), (d) and
(e)) using the original method. Tables 9 and 10 are the summaries of results obtained
by five single face images (Figs. 7(f), (g), (h), (i) and (j)) using the original method.
Tables 5-10 are carried out to analyze the performance of original principal
component analysis method and the proposed method. The comparison is done
via two important points, the first one is the accuracy and the last one is the
processing time and the number of positive/negative answers.
Table 5. Summary of Single Face Image Analysis
Using Proposed Method with 40% Eignefaces.
Size (pixel)
Imag
es
Qu
an
tity
faces
Nu
mb
er o
f
co
rrec
t
dete
cti
on
Fa
lse
po
siti
ve
an
swer
Fa
lse
nega
tiv
e
an
swer
Accu
racy
(%)
Process
ing
tim
e (
s)
2048×1536 f 1 1 0 0 100 20536
2048×1536 g 1 1 0 0 100 21121
2048×1536 h 1 0 0 1 0 20481
1280×1024 i 1 1 0 0 100 16390
480×640 j 1 1 0 0 100 10564
Total (5 images) 5 4 0 1 80 89092
Table 6. Summary of Single Face Image Analysis
Using Proposed Method with 60% Eignefaces.
Size (pixel)
Imag
es
Qu
an
tity
faces
Nu
mb
er o
f
co
rrec
t
dete
cti
on
Fa
lse
po
siti
ve
an
swer
Fa
lse
nega
tiv
e
an
swer
Accu
racy
(%)
Process
ing
tim
e (
s)
2048×1536 f 1 1 0 0 100 20400
2048×1536 g 1 1 0 0 100 21493
2048×1536 h 1 1 0 0 100 20370
1280×1024 i 1 1 0 0 100 16425
480×640 j 1 1 0 0 100 10553
Total (5 images) 5 5 0 0 100 89241

610 Mahmoud A. M. Albreem and Shahrel A. Suandi
Journal of Engineering Science and Technology October 2012, Vol. 7(5)
Table 7. Summary of Multiface Analysis Image
Using Original Method with 40% Eigenfaces.
Size (pixel)
Imag
es
Qu
an
tity
faces
Nu
mb
er o
f
co
rrec
t
dete
cti
on
Fa
lse
po
siti
ve
an
swer
Fa
lse
nega
tiv
e
an
swer
Accu
racy
(%)
Process
ing
tim
e (
s)
368×496 a 12 9 1 3 75 6840
288×464 b 14 10 1 4 71.42 5400
304×336 c 14 12 0 2 85.71 4680
448×656 d 15 9 0 6 60.00 9720
752×1136 e 18 11 1 7 61.11 10800
Total (5 images) 73 57 3 16 69.86 37440
Table 8. Summary of Multiface Analysis Image
Using Original Method with 60% Eigenfaces.
Size (pixel)
Imag
es
Qu
an
tity
faces
Nu
mb
er o
f
co
rrec
t
dete
cti
on
Fa
lse
po
siti
ve
an
swer
Fa
lse
nega
tiv
e
an
swer
Accu
racy
(%)
Process
ing
tim
e (
s)
368×496 a 12 10 1 2 83.33 7668
288×464 b 14 12 1 2 85.71 5976
304×336 c 14 12 0 2 85.71 5389
448×656 d 15 10 0 5 66.67 10476
752×1136 e 18 15 0 3 83.33 11088
Total (5 images) 73 59 2 14 80.82 40597
Table 9. Summary of Single Face Analysis Image
Using Original Method with 40% Eigenefaces.
Size
(pixel) Imag
es
Qu
an
tity
faces
Nu
mb
er o
f
co
rrec
t
dete
cti
on
Fa
lse
po
siti
ve
an
swer
Fa
lse
nega
tiv
e
an
swer
Accu
racy
(%)
Process
ing
tim
e (
s)
2048×1536 f 1 1 0 0 100 19036
2048×1536 g 1 1 0 0 100 19809
2048×1536 h 1 0 0 1 0 19073
1280×1024 i 1 1 0 0 100 15174
480×640 j 1 0 0 1 0 9073
Total (5 images) 5 3 0 2 60 82165
Table 10. Summary of Single Face Analysis Image
Using Original Method with 60% Eignefaces.
Size (pixel)
Imag
es
Qu
an
tity
faces
Nu
mb
er o
f
co
rrec
t
dete
cti
on
Fa
lse
po
siti
ve
an
swer
Fa
lse
nega
tiv
e
an
swer
Accu
racy
(%)
Process
ing
tim
e (
s)
2048×1536 f 1 1 0 0 100 19051
2048×1536 g 1 1 0 0 100 20088
2048×1536 h 1 0 0 1 0 18990
1280×1024 i 1 1 0 0 100 14908
480×640 j 1 1 0 0 100 9304
Total (5 images) 5 4 0 1 80 82341

A Novel Computation Technique for Single and Multiface Detection…. 611
Journal of Engineering Science and Technology October 2012, Vol. 7(5)
Tables 11 and 12 show the comparison between the two methods using
multiface images and single face images, respectively. As may be observed in
Tables 11 and 12, the proposed method has higher average accuracy compared with
the original one. However, from the processing time aspect, we can conclude that the
original method is faster than the proposed method. From false positive answers point
of view, the original method performed better for multiface images but same results
have been observed for single face images.
As shown in Table 12, in single face image comparison, we can see that the
same accuracy is obtained when 40% and 60% of eigenfaces is used within
proposed method and original method, respectively. Based on this observation,
we may conclude that the proposed method performs better than original method
in terms of accuracy. In contrary, it suffers in processing time due to the
additional matrix projections.
Further analyzing the results, proposed method achieved 87.67% accuracy
compared to original method which only achieved 69.86% accuracy. This is after
60% of dimension reduction. Figure 9 shows some positive results using proposed
method while Fig. 10 shows some false detection results.
Table 11. Comparison Results between
Original and Proposed Methods in Multiface Images.
Criteria
Original method Proposed method
60% of
Eigenface
40% of
Eigenface
60% of
Eigenface
40% of
Eigenface
Accuracy 80.82% 69.86% 89.7% 87.67%
Processing Time (s) 40597 37440 60034 54540
False-positive answer 2 3 4 5
False-negative answer 14 16 8 9
Table 12. Comparison Results between Original
and Proposed Methods in a Single Face Images.
Fig. 9. Examples of Output Images Using the Proposed Method.
Fig. 10. False Detection which has been Considered
as “False Positive Answer” from Images Shown in Fig. 9.
Criteria
Original method Proposed method
60% of
Eigenface
40% of
Eigenface
60% of
Eigenface
40% of
Eigenface
Accuracy 80% 60% 100% 80%
Processing Time (s) 82341 82165 89241 89092
False-positive answer 0 0 0 0
False-negative answer 1 2 0 1
612 Mahmoud A. M. Albreem and Shahrel A. Suandi
Journal of Engineering Science and Technology October 2012, Vol. 7(5)
5. Conclusions
A novel computation method for single and multiface detection using Euclidean
distance within principal component analysis framework has been proposed in
this work.
Unlike original PCA, the proposed method does not rely on threshold value
but instead, consider the Euclidean distances between two different subspaces,
i.e., the normal and re-projected face subspace, to detect the face. The proposed
method achieves a higher detection accuracy rate compared to the original PCA
method and manages to reduce 60% of the original dimension. However, due to
re-projecting subspace requires high computational time, the proposed method
suffers in the processing time. The system also fails to detect some of the faces
which are categorized as “false negative answer”. The main reason for this is the
existing of object like “Glass”, e.g., Fig. 7(h). The system sometimes detects
some non faces as a face, which is caused by the lighting of that image. Examples
of false positive answers are shown in Fig. 9. As shown earlier in the training
stage, the increasing of eigenfaces will increase the average accuracy and makes
the system better.
Nonetheless, we have also observed the same result in the experiments. In the
near future, multiface detection system will be developed by incorporating the
proposed technique in combination with several classifiers like kernel principal
component analysis, support vector machine and neural network. Also, effort to
improve the processing time has to be taken into account during the development.
Additionally, the system needs to deal with non-frontal faces as well. For some
other applications, the proposed method may be utilized to detect other objects
such as cars, lorry; etc.
Acknowledgement
This work has been partially supported by Fundamental Research Grant Scheme
(FRGS) from Malaysia Ministry of Higher Education (MOHE)
(203/PELECT/6071142) and Universiti Sains Malaysia (USM) Short Term Research
Grant (304/PELECT/6035270). This work also funded by USM fellowship.
References
1. Anuyouthapong, P.; Luckboonjuang, O.; Nawaeamwilai, S.; and Dailey,
M.N. (2006). Face detection for improved security at parking lot checkpoints.
Technical Report. Sirindhorn International Institute of Technology,
Thammasat University, Thailand.
2. Hiramatsu, R.; Kofuji, J.; Kofuji, S. and Mattes, L. (2008). FaceID:
Benchmarks for face detection algorithms using cell processor. Technical
Poster. Laboratory of Integrated Systems (LSI), High Performance Group
Av. Prof. Luciano Gualberto, Cidade Universitária. São Paulo - CEP: Brazil.
3. Kim, K.I.; Jung, K.; and Kim, H.J. (2002). Face recognition using kernel
principal component analysis. IEEE Signal Processing Letters, 9(2), 40-42.
4. Rowley, H.A. (1999). Neural network-based face detection. PhD. Thesis,
School of Computer Science, Carnegie Mellon University.

A Novel Computation Technique for Single and Multiface Detection…. 613
Journal of Engineering Science and Technology October 2012, Vol. 7(5)
5. Mahmoud, O; Anwar, F.; and Salami, M.J.E. (2007). Learning algorithm
effect on multilayer feed forward artificial neural network performance in
image coding. Journal of Engineering Science and Technology (JESTEC),
2(2), 188-199.
6. Turk, M.A.; Pentland, A.P. (1991). Face recognition using eigenfaces.
Proceedings CVPR’91, IEEE Computer Society Conference on Computer
Vision and Pattern Recognition, 586-591.
7. Khan, A.S.; Alizai, L.K. (2006). Introduction to face detection using
eigenfaces. Proceedings of the 2nd
International Conference on Emerging Technologies, ICET’06, 128-132.
8. Lin, S.-H. (2000). An introduction to face recognition technology. Informing
Science Special Issue on Multimedia Informing Technologies – Part 2, 3(1), 1-7.
9. Lorente, L.; and Torres, L. (1999). Face recognition of video sequences in a
MPEG-7 context using a global Eigen approach. International Conference on
Image Processing, 4, 187-191.
10. Kim, K. (2007). Face recognition using principle component analysis. Technical
Paper, Department of Computer Science University of Maryland, 1-7.
11. Zakaria, Z. (2008). Development of multiface detection system using skin
colour and neural networks. MSc. thesis, School of Electrical and Electronic,
Universiti Sains Malaysia.
12. Yi, O.G. (2009). Multi-face detection in colour image using adaboost.
B.Eng. Degree work, Universiti Sains Malaysia.
13. Zakaria, Z.; Isa, N.A.M.; and Suandi, S.A. (2009). Combining skin colour and
neural network for multiface detection in static images. Symposium on Progress
in Information and Communication Technology (SPICT’09), 147-154.