a novel axial flux resolver - iran university of science...
TRANSCRIPT

Abstract- Resolvers are widely used in electric driven systems especially in high precision servomechanisms. Both encapsulated and pancake resolvers suffer from a major drawback: static eccentricity (SE). This drawback causes a significant increase in resolver output position error (RPE) which could not be corrected electronically. To reduce RPE, this paper proposes a novel structure with axial flux. Proposed topology, design guidelines, optimization procedure and several key features to improve the sensitivity of axial flux resolver (AFR) against SE are studied. Furthermore, to minimize RPE an optimized design is attained. The machines are investigated in detail by using d-q model and 3D time stepping finite-element analysis. The results of theses two methods are compared and both prototype machines (proposed and optimized) are built. In order to evaluate proposed topologies, an experimental test setup is devised. Finally, the experimental results of the prototype machines verified the analysis results.
Key words- Resolver, Static eccentricity, axial flux, Optimization, Time-Stepping 3D-Finite Element Analysis (3D-FEA), d-q model
I. INTRODUCTION
High performance servomechanism and inverter driven permanent magnet synchronous motors (PMSM) prefer to use absolute rotor position information which are produced by electromagnetic and optical [1]. In conventional servomechanism optical encoders are the best choice. But, in high precision process resolvers are preferred because of their thermal stability, Resistant to environmental pollution, small size, easy installation and integration with rotating shafts (particularly in pancake resolvers) [1].Primary traditional resolvers had brush. But, the disadvantages of brushes such as noise generation and need to maintenance, has forced them to be designed brushless by using rotary transformer [2]. Brushless resolvers are designed in two types [3]: a) wounded rotor, which is
named conventional resolver (CR), b) solid rotor, which is named variable reluctance resolver (VR).CRs and VRs can be manufactured capsulated (framed) or pancake (frameless) [4-6]. All type of resolvers either has bearings or installed on a rotating shaft that, has bearings. All types of bearings (ball-bearings, roll-bearings, mechanical seals and etc.) have intrinsic radial backlash which causes static eccentricity (SE) [7]. As it is shown in fig. 1, in the case of SE, the rotor rotates around its own geometric axis, which is not the geometric axis of the stator (the difference is proportional to the magnitude of OsOr vector).
Os
αs
Or & Oω
Or : Rotor Symmetry CenterOs : Stator Symmetry CenterOω : Rotation Center
Fig. 1: The static eccentricity error
The reasons that lead to SE may involve many different factors. It can be caused by [7, 8]: a) Bearing weakness, b) Unbalanced load, c) Bent rotor shaft, d) Mechanical resonance at critical load and e) manufacture and assembly tolerance. Of course, An inherent level of SE exists even in newly manufactured machines due to the build-up of tolerances during manufacturing and assembly procedure. According to ISO492 or ABEC standards there are at least 1.5 micro meters intrinsic backlashes in the most accurate bearings which are used in the military and the spatial servomechanisms. This means even the accurate bearings
Novel Axial Flux Brushless Resolver Analysis and Optimization
Using 3D Finite Element and d-q Model Method
F. Tootoonchian1, K. Abbaszadeh 2 and M. Ardebili 3 1Ph.D. Candidate of Electrical and Computer Engineering, K. N. Toosi University of Technology, Tehran, Iran,
[email protected] of Electrical and Computer Engineering, K. N. Toosi University of Technology, Tehran, Iran,
[email protected] 3Faculty of Electrical and Computer Engineering, K. N. Toosi University of Technology, Tehran, Iran,

have intrinsic SE. These standards show that the intrinsic SE of the bearing which used in electrical machines is up to 35 micro meters. If the eccentricity fault is occurred, it will be added with the intrinsic SE of the bearings. The eccentricity will disturb the flux distribution in the air gap [9]. And, it will distort the output signals of the resolver [10]. In this condition, the position error of the resolver can be increased up to 500 Arc Minutes (more than eight degrees) [7]. It is mentioned in [11] that, these large position errors occur with the less than 60 micro meters eccentricity level. Therefore, It can be concluded that, conventional resolvers with radial flux structure always suffer from a major drawback which is named SE [7].Previous researches tried to show the effect of SE on the accuracy of different type resolvers [7, 9, 11-13]. In [7] different kind of errors which are resulted from wrong installation process is classified. Also, [7] has used experimental tests to show that, the SE may increase the resolver output position error up to 500 Arc Minutes (more than 8 degrees). In [9] the effect of skewed rotor and eccentricity error on the accuracy of a brushless resolver is studied using 2D finite element analysis. But, the authors of [9] have expressed that there is significant difference between measured and calculated results. Finally, they have justified that their model is not accurate enough. In [11] the effect of eccentricity error and air gap length on the accuracy of the detected angular position of a VR resolver is investigated using 2D FEM. In this research a relation between the harmonics of the detected position waveforms, air gap length and eccentricity error is determined using non-linear regression method. 3D FEM is used in [12] to evaluate the influence of the iron sheet permeability dispersion and rotor eccentricity on the angular position accuracy of the VR resolver. This paper presents that 100μm SE increases position error upto 90 Arcmin. Finally, [13] regards the nonlinearity characteristics of eccentricity on the angular position error of a VR resolver.Almost all literatures have studied just the effect of eccentricity on the resolver's position error and they have not suggested any solution to decrease the eccentricity error. In order to reduce the effect of SE two novel structures are proposed in this paper. The first one has an axial flux geometry which can reduce the eccentricity error. This structure is optimized to the second one who can minimize this error. The performances of both topologies are calculated using time stepping 3D FEM and frequency analysis of output signals. Then, they are constructed and their test setup is devised. Practical testes carried out by applying assignable eccentricities and investigating the sensitivity of proposed structures to these variations. The following points are resulted from this study: a) the SE has the minimum effect on the accuracy of proposed structures, b) there is acceptable accordance between time stepping 3D FE results and experimental ones, c) using time stepping 3D FEM to study this sensor was very time consuming process (witch will be resolved in an up coming paper).
II. PROPOSED STRUCTURE
Resolver, as an angular position sensor, acts like a synchronous generator with two phases. The field winding of this generator is excited with high frequency alternative current (up to 20 kHz, Eq. 1) [14]. Obviously, supplying the field winding with AC produces two amplitude modulated (AM) output voltages instead of sine and cosine voltages. Neglecting the coil resistance and motional e.m.f. terms, the output voltages can be expressed by Eqs. (2-3) and are shown in fig. 2 [12, 14]. The ratio of the output voltages gives the rotor rotation angle θm [11-12, 14].V ex=V i sin ωt (1)
V sin=KV ex sin( p2
θm) (2)
V cos=KV ex cos( p2
θm) (3)
θe=P2
θm=Arc tan(V sin
V cos) (4)
Where K is transformer ratio, p is pole number and θe is an electrical angle.
0 0.001 0.002 0.003 0.004 0.005 0.006 0.007 0.008 0.009 0.01-1
-0.5
0
0.5
1
Time [Sec]O
utpu
t Vol
tage
0 0.001 0.002 0.003 0.004 0.005 0.006 0.007 0.008 0.009 0.01-1
-0.5
0
0.5
1
Time [Sec]
Exci
tatio
n Vo
ltage
(a)
0 0.001 0.002 0.003 0.004 0.005 0.006 0.007 0.008 0.009 0.01-1
-0.5
0
0.5
1
Time [Sec]
Out
put V
olta
ge
0 0.001 0.002 0.003 0.004 0.005 0.006 0.007 0.008 0.009 0.01-1
-0.5
0
0.5
1
Time [Sec]
Exci
tatio
n Vo
ltage
(b)Fig. 2: Resolver signals (a) Exciting voltage (b) Output voltages
In the conventional resolvers with radial flux the static eccentricity even in the range of some micro-meters causes the strong variation in the linkage and leakage inductances of rotor and stator windings [9].These inductance variations are the main factor witch increase the resolver detected position error [9, 11-12]. Using magnetic circuit concepts, the inductance of one phase of the resolver can be written as [15]:L(θ )=K .P(θ )
P(θ )=μ0∫ dAz
(5)
Where, K: is a constant which depends on the physical parameters involved (e.g. the number of turns per phase, the number of teeth per stator pole, etc.), P(θ) is the permeance between one stator and rotor tooth as a function of position, μ0: is permeability of air, dA: is differential crosssectional

area between the rotor and stator teeth and z: is length of the flux path between the rotor and stator.According to Eq. (5), in proposed structure the inductances must have the minimum sensitivity from the SE. This requires a uniform air gap length and a constant effective iron surface between stator and rotor.The unique structure whose air gap length and effective iron surface are not changed with the SE is axial flux topology (as shown in Fig. 3). This paper proposes and studies this topology as a novel resolver structure which is robust against SE. Proposed resolvers with axial flux structures have distinct advantages over radial flux ones. Some of these advantages are their planar and adjustable air gap, compact construction, better ventilation and cooling. Furthermore, their rotors are integrated easily with the rotating parts. On the other hand, this type of resolvers, because of their short axial length, can easily be adopted into the construction of various devices and has advantages in terms of size, appearance, and function. Finally, in mass production, according to Polard’s theoretical considerations the AF machine needs 12-13 percent less copper and 21.5-32.5 percent less iron than similar traditional one [16-17].
Rotary Transformer Rotor CoreResolver Rotor Yoke
Resolver Stator Tooth
Rotary Transformer Stator CoreResolver Stator Slot
Resolver RotorSlot
ResolverStator Yoke
Resolver Rotor Tooth
Fig. 3: Proposed axial flux resolver structure
III. Resolver ModelIn this study two methods are proposed to model the AFR. The first model is based on d-q axis theory and in the later one time stepping finite element analysis is used to predict the performance of the resolver.
A. D-Q ModelThis proposed model is based on d-q axis theory. The following assumptions are considered in the analysis [14]:a) Stator has two-layer distributed lap windings.b) Rotor has a winding with sinusoidal supply.c) The inductances of AFR in d-q axis are unequal.
Fig. 4 shows the model of resolver windings. Each stator winding flux consists of leakage flux and main flux, the latter flux links the rotor [2].
Fig. 4 Axial flux resolver windings model
A.1. Dynamic ModelThe voltage equations in machine variables can be expressed as following:
V r=r r ir+ Lrr
dir
dt+ωr Lsr cos θr ias+Lsr sin θr
dias
dt
+ωLsr sin θ r ibs−Lsr cosθr
dibs
dt
(6)
V as=−rs ias+2 ωr Lms sin2θr ias+Lms sin 2 θr
dibs
dt
−2 ωr Lms cos2θr ibs −Lsr sin θr
dir
dt
+ωr Lsr cosθr ir+( Lℓs+L0−Lms cos2 θr⏞L s
)dias
dt
(7)
V bs=−rs ibs−2ωr Lms cos2θr ias−Lmssin 2θr
dias
dt−2 ωr Lmssin 2 θr ibs+ωr Lsr sin θr ir
+( Lℓs+L0+Lms cos2θr⏞Ls
'
)dibs
dt−Lsr cosθ r
dir
dt
(8)
In the above equations the s and r subscripts denote variables and parameters associated with the stator and rotor circuits, respectively. Vas, Vbs are the stator voltages, Vr is the excitation signal of the resolver (V r= vr
' cos(ωf t +ψ )), ias, ibs are the stator currents, ir is the rotor current, rs is the resistance of stator circuit, Lℓs, Lms are the leakage and magnetizing inductances of the stator winding, respectively, rr, Lrr are the resistance and self inductance of rotor circuit, Lsr is the mutual inductance between the rotor and stator circuits, ωr is the rotor angular velocity and θr is electrical angular displacement. The inductances of AFR can be calculated as [18-19]:
Lℓs=1
2 PqN s
2( R0−R i)( λs+ λo+λd+ λz )×10−5(9)

Lℓr=1
2 PqNr
2 ( R0−Ri )( λs+λo+λd+λz )×10−5 (10)
Lms=μ0 π ( Ro
2−Ri2 )N s
2
8 P2 g(11)
Lrr=μ0 π ( Ro
2−R i2) N r
2
8 P2 g+Lℓr
(12)
Lsr=μ0 π ( Ro
2−Ri2 )N s N r
8 P2 g(13)
Where P is the pole pair number, q is the number of slots per pole per phase, Ro and Ri are outer and inner radius of core, λs is specific slot leakage permeance, λo is specific overhang leakage permeance, λd is specific differential leakage permeance, λz is specific zig-zag leakage permeance, g is effective air-gap length between the surface of stator and rotor, Ns and Nr are the number of stator and rotor turns, respectively in each phase.The stator variables are transferred to the rotor reference frame which eliminates the time-varying inductances in the voltage equations. Park’s equations are obtained by setting the speed of the stator frame equal to the rotor speed.The expressions for the flux linkages are:
λq=(Lℓs+L0−Lms ) iq=(Lℓs+Lmq ) iq
λd=(Lℓs+L0+Lms ) id+Lmd ir=(Lℓs+Lmd ) id+Lmd ir
λr=Lmd id+(Lℓr+ Lmd ) ir
(14)
And
ψ=ωb λx=ωb L (15)
Then
ψq=( X ℓs+Xmq ) iq=X ℓs iq+ψmq
ψd=( X ℓs+ Xmd) id+X md ir=X ℓs id+ψmd
ψr=Xmd id+(X ℓr+Xmd ) ir=X ℓrir+ψmd
(16)
By referring rotor variables to the stator windings, voltage equations can be written as:
V q=−rs iqs+1ωb
dψq
dt+
ωr
ωbψd
V d=−rs ids+1ωb
dψd
dt −ωr
ωbψq
V r' =r r
' ir' +1
ωb
d ψr'
dt
(17)
In order to obtain the equivalent circuits, equation (17) should be replaced by equation (16). Thus, the voltage-current equations are as following:
[V q ¿ ] [V d ¿ ]¿¿
¿¿ (18)
Where:
X q=Xℓs+X mq , Xmq=X 0−XmsX d=X ℓs+ Xmd , Xmd=X0+ Xms
(19)
And p is d/dt [2].The electrical equivalent circuits of the resolver are presented in Fig. 5.The electromagnetic torque developed in the resolver is given by:
T em= P2 ωb
(ψd iq−ψq id ) (20)
And the mechanical equation of resolver in per unit can be written as:
T mech ( pu )−T em ( pu )−Tdamp ( pu )=2 H
d (ωr
ωb)dt
(21)
Where H is inertia constant expressed in second, Tmech is load torque and Tdamp is frictional torque.
Fig. 5 Dynamic electrical equivalent circuits of the AFR in d-q axis
A.2. Steady State ModelIn steady state, the electrical angular velocity of the rotor is constant and equal to ωe. In this mode of operation the rotor windings do not experience any change of flux linkages [20]. Thus, with ωr equal to ωe and the time rate of change
of all flux linkages neglected, the steady state versions of (14) and (15) become:
V qe=V q=−rs I q−
ωe
ωbxd I d+
ωe
ωbxmd I r
'
V de =V d=−r s I d+
ωe
ωbxq I q
V r¿=V r
' =−rr' I r
'
(22)
Here the ωe to ωb ratio is again included to accommodate analysis when the operation frequency is other than rated. In the synchronously rotating reference frame and using uppercase letters to denote the constant steady state variables [20]:
√2~Fas=Fqse − jFds
e(23)
Where F is each electrical variable (voltage, current, flux linkage),
~Fas is a phasor which represents a sinusoidal quantity, Fqs
e and Fds
eare real quantities representing the
constant steady state variables of the synchronously rotating reference frame. Hence:
√2~V as=V qe− jVd
e(24)
Substituting (22) into (24) yields:
√2~V as=−[r s+ωe
ωbXq ]~I d
+1√2 [−ωe
ωb( Xd−Xq ) I d+
ωe
ωbXmd I r
' ] (25)
For symmetrical resolver, Xd = Xq and ωe= ωb. So (25) can be rewritten as:
~V as=−(rs+ jX s)~I as+
~Ea
~Ea=1√2
Xm I r' (26)
Where:
X s=Xℓs+X m (27)
Considering above equations, the steady state equivalent circuit of resolver is shown in fig. 6.
Fig. 6 Steady state equivalent circuit of the AFR
A.3. D-Q model SimulationThe state equations on the rotating d-q reference frame are introduced. MATLAB/Simulink software is used for simulation.Input, output, and state variables are:
StateVariables=[ψ qs , ψds ,ψr' ]
InputVector=[ V r' , ΔT mech ]
OutputVector=[ Δθr ]t
In generalized theory of electrical machines, it is more convenient to use flux linkages as the state variables [20-21]. By this way, the differential operators change to integral operators. Using Equation (16) and (18), the flux-linkages equations could be obtained as follow:
ψq=ωb∫(V q+r s
X ℓs(−ψmq +ψq)−
ωr
ωbψd )dt (28)
ψd=ωb∫(V d+rs
Xℓs(−ψmd+ψd )+
ωr
ωbψq)dt (29)
ψr' =ωb∫ (V r
' +rr
'
Xℓr' (ψmd−ψr
' ))dt (30)
Where:
ψmd=( 1Xmd
+ 1Xℓr
' + 1Xℓs )
−1 ( ψd
Xℓs+
ψr'
X ℓr' ) (31)
ψmq=( 1X mq
+ 1X ℓs )
−1 ψq
X ℓs(32)
And angular position, stator, and rotor currents can be calculated as:
θ ( t )=δ (t )=θr (t )−θe ( t )
=∫0
t
( ωr−ωe )dt +θr (0 )−θe (0 ) (33)
iq=ψq−ψmq
xℓs(34)
id=ψd−ψmd
xℓs(35)
ir' =
ψr' −ψmd
x ℓr' (36)
sr sjx
mx
r'r2r'jX2
asV~
DCV
rV
Ia 2/Ir

Because of the ability of proposed model to assume different values for Ld and Lq, it can consider the effect of eccentricity in AFR which is investigated in our outcoming paper. Fig. 7 shows a block diagram which is used in simulation.
Fig. 7: Block diagram of AFR simulation.
(a)
(b)Fig. 8: AFR stator and rotor (a) Before winding (b) After winding
Fig. 8-(a) shows the stator and rotor of fabricated AFR before and after winding. This prototype has single stator and single rotor structure.The specifications of this AFR are presented in Table 1 and the parameters of its equivalent circuit are given in Table 2. These parameters are obtained using DC-Pulse method [2]. In this method stator winding is charged with its nominal DC current. The current signal is shown in Fig. 9 (with 1 mm air gap length).
Fig. 9: charge current of stator winding
Table 1: The Specifications of Tested Axial Flux ResolverParameter Value UnitFrequency 4000 Hz
Peak to Peak input voltage 10 VMaximum position error 10 Arcmin
Pole number 2 -Maximum speed 8000-12000 rpmAir gap length 1 mm
Core outer /inner diameters 72/52 mmCore length, stator/rotor 10/10 mm
Duty cycle S1 -Number of turns, Stator/Rotor 1200/600 -
Table 2: The Equivalent Circuit Parameters of Tested AFRParameter Value Unit
rs 290 Ωr'f 17 ΩLm 3.41×10⁻³ HL'lf 0.11×10⁻³ HLls 0.11×10⁻³ HJ 9.13×10⁻⁴ kg.m2
B. 3D time stepping finite element AnalysisThe second method to evaluate the performance of the proposed axial flux structure is 3D time stepping finite element analysis. To increase the accuracy of the FE model, the effect of eddy current and saturation are considered simultaneously. Although, this analysis is very complex and time consuming, it is very accurate. So, it is a good choice to verify the results of proposed topology. Furthermore, to reduce computation time, rotor angular position is evaluated from the ratio of the out put signals which is formulated in Eq. (4).
Table 3: the geometrical dimensions of proposed AFR
Item. Value (unit)
Outer/Inner diameter of stator 72.0/52 mmOuter/Inner diameter of rotor 72.0/52 mm
Stator and rotor cores thickness 10 mmStator/rotor number of slots 24/12
Air gap length 1 mmPower source Sinusoidal, Vp = 5 V, 4 kHz
Winding method 2 layer sinusoidal distribution on slots
The maximum magnetic flux density of 0.08 T confirms that the resolver’s core was not saturated. As shown in Fig. 8 the B-H curve of resolver core, which is used in FEA, is
Eqs.(28), (32) and (34)
Eqs.(29)-(31)
and(34)-(35)
Eqs.(20)-(21)and (33) Generation
rr cos,sin
î
î
î
î
dV
qV
db
r
qb
r
fV
rsin
rcos
mechT
di
qi
q
d
rb
r
tcosv ff
tcosv ff

investigated experimentally using modified Epstein test [22] at 4 kHz.
0 0.5 1 1.5 2 2.5 3 3.5 4 4.5x 10⁵
0
0.5
1
1.5
2
2.5
Amper-Turn [A]
Flux
Den
sity
[T]
...
(a) (b)Fig. 10: (a) Modified Epstein circuit (b) Obtained B-H curve
In this paper, calculating 400 3D FE models for one rotor revolution gives one period of resolver output signals (which wastes the main time of this study). Although, 3D FEM is an accurate method, the most reliable results are experimental ones. In this study, an experimental AFR with specification listed in Table 3 was made and tested (Fig. 8). Test results are obtained by using a special setup. This test setup is able to change the amount of SE and of air gap length. In addition, this rotary test bed had a precision rotary tycope was placed on it. So, different rotary positions are produced by this tycope in [0, 2π] radian. The structure devised test setup is shown in Fig.11. By using this setup, AFR output signals and simulation results (including d-q model and 3D-FEM) are compared in each of these angular positions (The resolver output is obtained from arctangent of output voltages ratio).
Fig. 11: Devised test setup of AFR
IV. ResultsA. AFR without EccentricityPrevious researches, usually have discussed just about position error distribution. But, in this paper, not only the position signal (Arctangent of the ratio of d-q voltages) but also d-q voltages are reported, too. In practice, resolver output signals are fed to the resolver to digital converter (RDC). The RDC input resistance is very high. Therefore, the current in the stator coils of AFR, which apply to the RDC, is in the order of micro ampere [23]. Accordingly, Fig. 12 shows the d-q, FEM and measured voltages of AFR excited with extra pure synthesized sinusoidal source (table
3). Figure 13 shows the comparison of simulated and experimental output voltages. Results show good agreement between test and simulated (d-q model and FEM) voltages. Because of the maximum air gap flux density less than 0.08 T (calculated by 3D-FEM) AFR works at linear part of its B-H curve. Therefore, it is expected that the amplitude of output simulated and measured signals are similar.
2 4 6 8 10 12x 10-3
-6
-4
-2
0
2
4
6
Time [Sec]
Out
put V
olta
ge [V
]
2 4 6 8 10 12x 10-3
-6
-4
-2
0
2
4
6
Time [Sec]
Out
put V
olta
ge [V
]
(a) (b)
(c)Fig. 12: Studied AFR output signals without eccentricity (a) Resulted from d-q- model (b) Calculated by 3D FEM (c) Measured on oscilloscope
a) (b)
Fig 13: Comparison of calculated and measured signals (a) Amplitude of AFR cosine output voltage envelope (b) Relative error between calculated and measured signals
Generally, the resolver output signals are converted to position information by tracking resolver to digital converters. To do this, tracking RDCs use the envelope of the output signals. Therefore, in this study harmonic contents of an envelope of an output signal are taken into account, too. Figure 14 shows the normalized harmonic component of the cosine phase output current envelope. Almost all odd and even harmonics exist in this FFT plot. The importance of FFT plot is revealed when it compared with eccentric AFR's FFT plot. This comparison will be done in next section. In this research, position error is the difference between the real rotor position (which is obtained by means of test setup) and the determined rotor position of AFR (resulted from d-q model and 3D-FEM). Figure 15 shows the comparison of simulated and measured output position of AFR and their difference. This figure shows the maximum position errors difference between measured and simulated results are 6 and 7 Arcmin at 245 and 45 degrees for d-q model and 3D FEM respectively. But, the maximum position error of
Mea
sure
d
3D F
EM
d-q
Mod
el
Pike
Out
put V
olta
ge [v
]
3D F
EM
d-q
Mod
el
Rel
ativ
e er
ror
[%]

simulated AFR versus ideal position are about 9, 7 and 5 Arcmin (FEM and d-q model) at 300 ْ , 312ْ respectively. The ideal position (θideal) can be calculated by home set of
rotor position (θ0rotor ) (against stator position), pole number
(p) and rotor speed (f, revolution per second) that is:
θideal=θ0rotor+2 π . f
p2
. t(37)
Finally, Fig. 15-(a) shows that the AFR maximum position error is 0.15 Arcdeg (about 9 Arcmin).
Fig. 14: Harmonic components of output current envelope.
0 50 100 150 200 250 300 350 400-0.2
-0.15
-0.1
-0.05
0
0.05
0.1
0.15Position Error
Ideal Position [Deg]
Posi
tion
Erro
r [D
eg]
FEM Resultsd-q ModelMeasured
0 50 100 150 200 250 300 350 400-0.15
-0.1
-0.05
0
0.05
0.1(Measured - Calculated) Position Error
Ideal Position [Deg]
Erro
r Diff
eren
ce [D
eg]
(Measured) - (FEM Results)(Measured) - (d-q Model Results)
(a)
0 50 100 150 200 250 300 350 400-0.2
-0.15
-0.1
-0.05
0
0.05
0.1
0.15Position Error
Ideal Position [Deg]
Posi
tion
Erro
r [De
g]
FEM Resultsd-q ModelMeasured
0 50 100 150 200 250 300 350 400-0.15
-0.1
-0.05
0
0.05
0.1(Measured - Calculated) Position Error
Ideal Position [Deg]
Erro
r Diff
eren
ce [D
eg]
(Measured) - (FEM Results)(Measured) - (d-q Model Results)
(b)Fig. 15: AFR position error (a) 3D-FEM, d-q model and measured data against
ideal position (b) Error difference between measured and calculated data
B. AFR with EccentricityIn proposed d-q model, d-q axis inductances are different parametric variables. Therefore, by using unequal values for Ld and Lq the effect of SE can be modeled. In this method the system differential equations which express its dynamic performance (17-21) should be linear. The methods of linearization are divided into two categories: 1) analytic perturbing methods, and 2) software based methods. In the former, the nonlinear differential equations are perturbed around the operating point and in the latter, some functions of SIMULIK/MATLAB software are employed [21]. In software based method, the simulation block diagram of AFR is plotted in Simulink. Then, the “LINMOD” function of Matlab is used to obtain systems linear models of ordinary differential equations (Odes). Finally, “TRIM”
function is employed to find steady state parameters for the Simulink system.
Both linearization methods were used. Comparison between their results indicated that both of them had an acceptable accuracy. Finally, the method of linearization used in this research leads to the following linear time-invariant system of equations:
X¿
= A X+B UY=C X+D U
)38(
Equation (38) can be rewritten as below (using small perturbation around operating point):
ΔX¿
= A ΔX + B ΔUΔY =C ΔX + D ΔU
)39(
Where:
ΔX=[ Δψ qs , Δψds , Δ ψr' ,
Δωr
ωb, Δθr ]
t
ΔU=[ ΔV qs , ΔV ds , ΔT mech ]t
ΔY =[ Δθr ]t
)40(
The numerical coefficients of (38) can be calculated by using average DC pulse response of stator current [14 of Dyn]. Identified parameters confirmed that Ld ≈ Lq. To investigate the performance of AFR with static eccentricity, the parameters of the eccentric AFR were identified again. This time, identified parameters indicate that Ld is unequal with Lq (Ld ≠ Lq). Finally, replacing these parameters in proposed d-q model AFR output signals were simulated. Figure 16-(a) shows normalized output voltages of eccentric axial flux resolver. Also, normalized time stepping 3D-FEM results is reported in Fig. 16-(b). The magnetic flux density of eccentric model increases 1.8 times in comparison with healthy model and is not symmetry in the core. For these reasons, the waveforms of SIN and COS are distorted in terms of amplitude and phase difference as shown in Fig. 16-(a,b) and compared in Fig. 16-(c). In FE analysis used in this study, a winding assumed as a solid copper which its induced voltage is multiplied by winding turns. Therefore, the predicted winding resistances will not be accurate enough and this is the main reason that predicted phase shift by 3D-FEM in Fig. 16-(d) is not correct. In d-q model, winding resistances are determined by DC pulse response [2] which is an accurate method. For accurate comparison, the output position signals of symmetric and eccentric AFR are shown in Fig. 17. In this figure AFR detected position is calculated considering arctangent of output voltages ratio. On this basis, Fig. 17-(a) shows that the 10 μm rotor SE causes maximum 2.8 and 3.1 Arcdeg error in AFR detected angular position by FEM and d-q model respectively. In this figure although d-q predicted error shape is not similar to FEM one but the amount of maximum calculated position error is in acceptable range. It seems that inaccurate predicted winding resistance affects on position error shape. When a 47 Ω resistance is added in 3D-FEM model the q-d and FEM position error curve will

be similar. Therefore, if the winding resistance is corrected in FE model we can use 3D-FEM instead of d-q model when the difficulty of the DC pulse response measurement is taken into account. So, the rest of this study uses just 3D-FEM modified by a series resistance. Also, Fig. 17-(b) shows that the position error decreases from 2.8 to 0.5 Arcdeg when the eccentricity increases from 10 to 70 μm with a 1 mm air gap length. Furthermore, it is almost fixed while the eccentricity is more than 70 μm.
(a)
(b)
(c) (d)Fig. 16: Output voltages AFR with 10μm SE (a) d-q model (b) 3D-FEM (c) Amount of amplitude unbalance (d) Output signal phase shift than exciting signal
(a)
0 20 40 60 80 100 1200
0.5
1
1.5
2
2.5
3
3.5
Eccentricity Level [m]
Posi
tion
Erro
r [D
eg]
FEM Result (Gap Length = 1 mm)d-q Model (Gap Length = 1 mm)
(b)Fig. 17: Comparison of d-q model and 3D-FEM results on AFR position error (a) AFR position error in 1 mm gap length and 10 μm SE (b) AFR position error in 1 mm gap length and different SE level
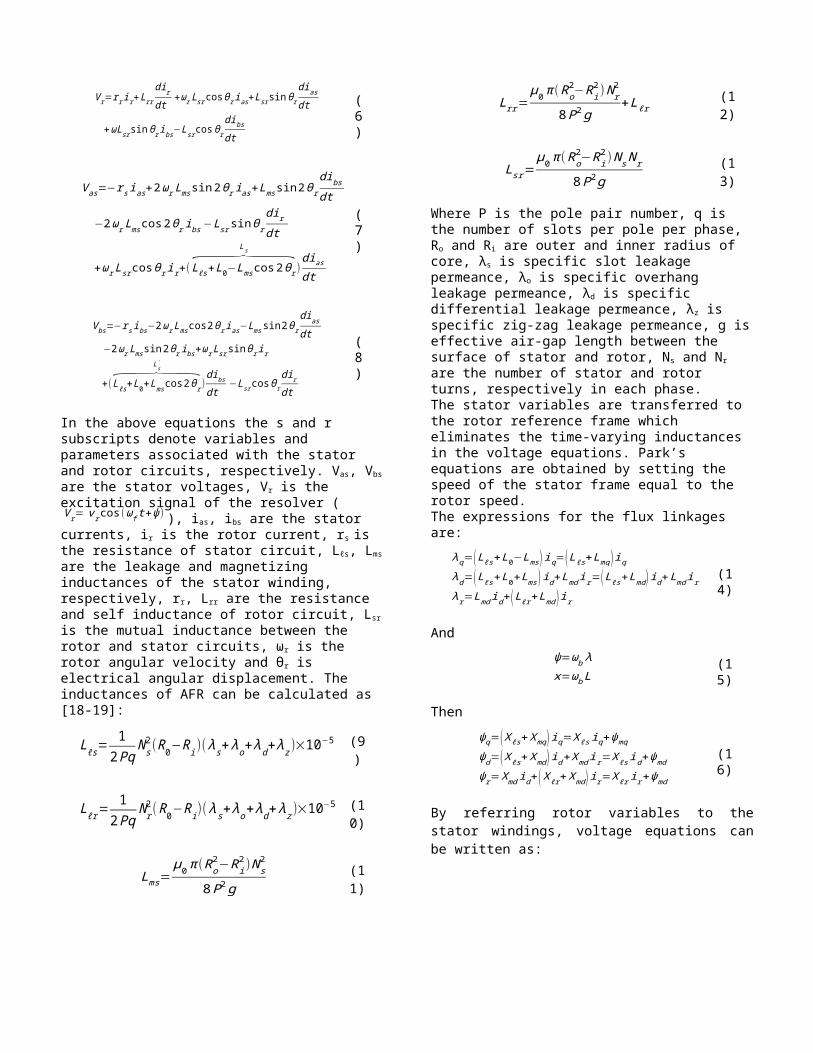
Another effects of SE on AFR output signals was indicated when output signals envelope's harmonic components are
studied. Fig. 18-(a) shows an example of harmonic content in an envelope of cosine current. Amplitude differences of harmonic components compared with those of a resolver without eccentricity are shown in Fig. 18-(b).Harmonic components of envelopes show a significant variation depending on the rotor eccentricity and the air gap length. For example, Fig. 19 shows normalized amplitude difference of harmonic components in the model at the gap length of 1 mm and different SE level. This figure shows in static eccentricity shorter than 80 μm, amplitude differences vary in the range of -0.05% to +0.12%, but they vary in a narrower range in other models. In eccentricity longer than 80 μm, the amplitude variations of harmonic components, except 3rd, 7th and 9th component, show a tendency to remain stable. The harmonic components of 3rd, 7th and 9th also vary in a wide range in other gap length models.
(a)
0 200 400 600 800 1000-0.02
0
0.01
0.02
Frequency [Hz]
Diffe
renc
e of
A
mpl
itude
Rat
io [%
]
1st 2nd3rd 4th 5th 6th 7th
-0.01
(b)Fig. 18: Normalized harmonic components of an envelope of AFR output cosine current at 1 mm air-gap length and 10 μm SE level (a) Normalized amplitude ratios (b) Differences of amplitude ratio of harmonic components of the AFR compared with those of a resolver without eccentricity
0 50 100 150 200 250 300-0.05
0
0.05
0.1
0.15
Static Eccentricity [m]Am
plitu
de D
iffer
ence
of H
arm
onic
Com
pone
nt [%
]
2nd3rd4th5th6th7th8th9th
Am
plitu
de D
iffer
ence
of
Har
mon
ic C
ompo
nent
[%]
Static Eccentricity [μm]Fig. 19. Normalized amplitude difference of harmonic components in the model at the gap length of 1 mm
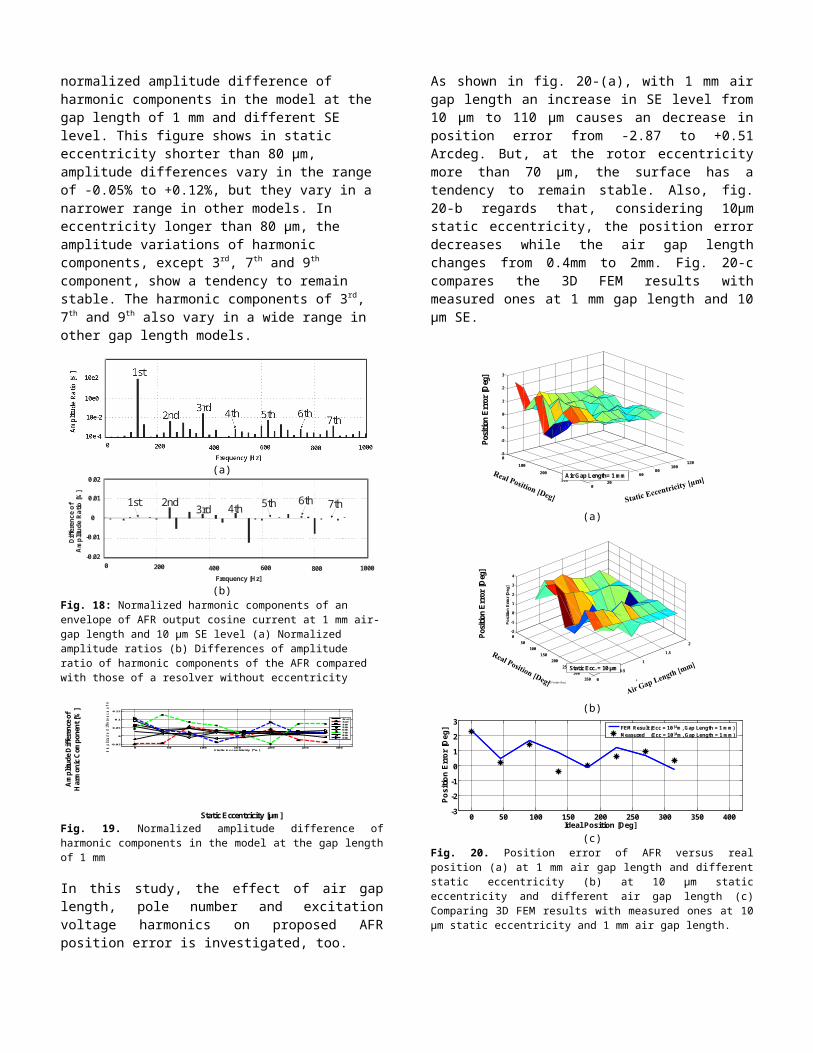
In this study, the effect of air gap length, pole number and excitation voltage harmonics on proposed AFR position error is investigated, too. As shown in fig. 20-(a), with 1 mm air gap length an increase in SE level from 10 μm to 110 μm causes an decrease in position error from -2.87 to +0.51 Arcdeg. But, at the rotor eccentricity more than 70 μm, the surface has a tendency to remain stable. Also, fig. 20-b regards that, considering 10μm static eccentricity, the position error decreases while the air gap length changes from 0.4mm to
0 0.001 0.002 0.003 0.004 0.005 0.006 0.007 0.008 0.009 0.01-1.5
-1
-0.5
0
0.5
1
1.5
Time [Sec]
Out
put V
olta
ge [p
u]
SineCosine
CosineSine
Amplitude Difference
Phase Difference
2 3 4 5 6 7 8 9 10 11 12x 10-3
-1.5
-1
-0.5
0
0.5
1
1.5
Time [Sec]
Out
put V
olta
ge [p
u]
2 4 6 8 10 12 14x 10
-3
-2
-1.5
-1
-0.5
0
0.5
1
1.5
2
Time [Sec]
Roto
r Pos
ition
[Deg
]
SineCosine
CosineSine
Amplitude Difference
Phase Difference
Out
put S
igna
ls [p
u]
Time [Sec]
Out
put S
igna
ls [p
u]
Time [Sec]
0 0.001 0.002 0.003 0.004 0.005 0.006 0.007 0.008 0.009 0.01-1.5
-1
-0.5
0
0.5
1
1.5
Time [Sec]
Out
put V
olta
ge [p
u]
SineCosine
CosineSine
Amplitude Difference
Phase Difference
2 3 4 5 6 7 8 9 10 11 12x 10
-3
-1.5
-1
-0.5
0
0.5
1
1.5
Time [Sec]
Out
put V
olta
ge [p
u]
2 4 6 8 10 12 14x 10
-3
-2
-1.5
-1
-0.5
0
0.5
1
1.5
2
Time [Sec]
Rot
or P
ositi
on [D
eg]
SineCosine
CosineSine
Amplitude Difference
Phase Difference
Out
put S
igna
ls [p
u]
Time [Sec]
Out
put S
igna
ls [p
u]
Time [Sec]
0
0.02
0.04
0.06
0.08
3D F
EM
d-q
Mod
el
Rel
ativ
e Er
ror [
%]
8
6
4
2
0
[%]
0
10
20
30
40
50
3D F
EM d-q
Mod
el
Rel
ativ
e Er
ror [
%]
50403020
10
0
[%]
Phas
e Sh
ift [D
eg.]
2 2.5 3 3.5 4 4.5 5 5.5 6 6.5x 10⁻³
-100
-50
0
50
100
Roto
r Pos
ition
[Deg
]
Time [Sec]2 2.5 3 3.5 4 4.5 5 5.5 6 6.5
x 10-3
-3
-1.5
0
1.5
3.5
Posi
tion
Erro
r [De
g]
2 2.5 3 3.5 4 4.5 5 5.5 6 6.5x 10⁻³
-3
-1.5
0
1.5
3.5
Posi
tion
Erro
r [De
g]
d-q Model
3D-FEM
Time [ms]
Rot
or P
ositi
on [D
eg.]
Posi
tion
Erro
r [D
eg.]

2mm. Fig. 20-c compares the 3D FEM results with measured ones at 1 mm gap length and 10 µm SE.
Posi
tion
Err
or [D
eg]
Air Gap Length= 1 mm
0
100
200
3000
2040
6080
100120
-3
-2
-1
0
1
2
3
Air Gap Length= 1 mm
(a)
050
100150
200250
300350 0
0.5
1
1.5
2
-2
-1
0
1
2
3
4
Air Gap Length [mm]Real Position [Deg]
Posi
tion
Erro
r [D
eg]
Posi
tion
Err
or [D
eg]
Static Ecc. = 10 μm
(b)
0 50 100 150 200 250 300 350 400-6
-4
-2
0
2
4
6
8
Real Position (Rotary Tycope) [Deg]
Posi
tion
Erro
r [D
eg]
Ecc=110e-6 mEcc=100e-6 mEcc=90e-6 mEcc=80e-6 mEcc=70e-6 mEcc=60e-6 mEcc=50e-6 mEcc=40e-6 mEcc=30e-6 mEcc=20e-6 mEcc=10e-6 m
0 50 100 150 200 250 300 350 400-3
-2
-1
0
1
2
3
Ideal Position [Deg]
Posi
tion
Erro
r [D
eg] FEM Result (Ecc = 10 m, Gap Length = 1 mm)
Measured (Ecc = 10 m, Gap Length = 1 mm)
(c)Fig. 20. Position error of AFR versus real position (a) at 1 mm air gap length and different static eccentricity (b) at 10 µm static eccentricity and different air gap length (c) Comparing 3D FEM results with measured ones at 10 μm static eccentricity and 1 mm air gap length.
Next, the effect of pole number in the proposed AFR position error has been studied. In this study the air gap length and rotor eccentricity are 1 mm and 10 μm respectively. Fig. 21 predicts that the AFR position error is decreased while the pole number is increased. The position error reduction can be attributed to the decrease in overhang leakage flux of stator winding due to reduction of overhang length caused by increase in pole number [24]. Therefore, the position error is decreased while the pole number is increased.Finally, the effect of excitation voltage harmonics on the position error of AFR with 10 μm gap eccentricity and 1 mm air gap length is perused in Fig. 22. In all of the preceding analysis it was assumed that the resolver excitation signal was an extra pure synthesized sinusoidal source and contained no additional harmonics. In general, the excitation signal contains harmonics and thus the AFR output signals are simplified as:
{V s=Sinθ ∑n=1
∞V sn Cos(nωt ) ¿ ¿¿¿
¿¿)41(
As presented in (41) and Fig. 22, AFR position error increases when, its exciting current harmonic contents (part A in (41)) increase. For example, when exciting current harmonic contents increase upto 50%, AFR position error increases even upto 4.6 Arcdeg.
050
100150
200250
300350
12
34
56
-2
-1
0
1
2
3
Air Gap Length [mm]Real Position [Deg]
Posi
tion
Erro
r [De
g]
Posi
tion
Err
or [D
eg]
Ecc = 10 μmAir Gap Length = 1 mm
Fig. 21. AFR position error versus real position in 10% gap eccentricity and different pole numbers
050
100150
200250
300350 0
1020
3040
5060
-2
0
2
4
6
Hamonic Content [%]Real Position [Deg]
Posi
tion
Erro
r [D
eg]
Posi
tion
Err
or [D
eg]
Fig. 22. The effect of excitation voltage harmonics on the position error of AFR with 10 µm static eccentricity and 1 mm air gap length
C. AFR in Comparison with RFRTo determine the capabilities of the proposed AFR (without any optimization) table 4 compares two axial and radial flux resolver with the same design specifications. This comparison shows that, the axial flux structure is more robust than radial flux one, against static eccentricity. Table 4 emphasize that the capabilities of the AFR is related to its air gap length. In gap length less than 0.5 mm radial flux resolver is as precise as axial one. But, in typical gap length (1 mm) axial structure is at least three times more accurate than radial ones. Also, increasing the pole number in order to decrease the position error is more effective on AFR than RFR.

However, although the axial flux structure performance is better than the radial structure but, when the eccentricity occurs, the position error of AFR increases upto 3.62 ْ. In this study, the proposed axial flux structure is optimized to minimize the AFR sensitivity against static eccentricity.
Table 4: Finite element analysis of Axial Flux Resolver (AFR) in comparison with Radial Flux Resolver (RFR)
Item. Value (unit)RFR AFR
Outer/Inner diameter of stator 72.0/52.0 mm 72.0/52.0 mm
Outer/Inner diameter of rotor 50.0/12.0 mm 72.0/52.0 mm
Stator and rotor core thickness 10 mm 10 mm
Stator/rotor number of slots 24/12 24/12
Air gap length 1 mm 1 mm
Power sourcesinusoidal,Vp = 5 V,
4 kHz
sinusoidal,Vp = 5 V,
4 kHz
Winding method
2 layer sinusoidal
distribution on slots
2 layer sinusoidal
distribution on slots
Pole Number 2 2Harmonic orders which has not any tendency to
remain constant (Fig. 19)3, 4 3, 7, 9
Max. Position Error in 10 μm Static Eccentricity
and 1 mm gap length8.1ْ 2.87ْ
Max. Position Error in 10 μm Static Eccentricity
and 0.4 mm gap length3.71 ْ 3.62 ْ
Max. Position Error in 10 μm Static Eccentricity,
1 mm gap length and 6 poles
2.2 ْ 0.43 ْ
V. Optimization of AFR StructureThe accuracy of the rotor position reported by an R/D converter is limited by the quality of the resolver signals processed by the RDC. According to ISO492 or ABEC standards and Fig. 20-(a), one of the most significant source of position error which must be minimized through resolver design is the error incurred due to the intrinsic SE. Although, in axial flux structure when SE occurs the air gap length does not change but the common effective iron surface between rotor and stator will change (Fig. 23(a)). The teeth shape or common effective iron surface between rotor and stator can be calculated by solving the inverse electromagnetic field problem [1]. Generally speaking, the process of solving such an inverse electromagnetic field problem will be, firstly, to assume one geometry shape and the corresponding stimuli distribution in the field area, then to calculate the field by using the finite-element method (FEM), then to optimize the geometry by employing certain optimization methods [1].
A. Rotor Shaping by Solving the Inverse Problem
Tooth schematic of the stator and rotor of the studied AFR are shown in Fig. 23(a). Figure 23(b) shows, when static eccentricity occurs in proposed AFR the common effective iron surface between rotor and stator will change. Therefore, the permeance, inductance and output voltage will change respectively. In the 3D FE analysis used to determine the optimal tooth parameters, it was found that no benefit was gained by allowing the tooth slopes to be distinct. For that reason, the tooth slopes were set equal to each other in all the analysis conducted. Correlations between items of the AFR, such as the position error, the yoke length, the rotor eccentricity and so on, are evaluated by means of the multiple regression analysis [25]. The correlation between the error difference and the rotor eccentricity is not found in the linear regression analysis. Therefore, the non-linear regression analysis is applied to evaluate two independent variables (eccentricity and the yoke length) which relate to the position error. Non-linear analysis shows that the position error correlates with the cube of the rotor eccentricity and the square of yoke length. So, this problem is inherently a multidimensional optimization one, and nonlinearity exists. Therefore, traditional optimization methods such as grads method are not suitable for this problem. One way is to use the trial and error method, that is, to manually revise the shape after each trial. Certainly, this will consume long calculating times with only approximate results reached. Another way is to adopt global optimization methods like the Genetic Algorithm (GA). A typical GA is tried in this case and the objective function is defined as below [26]:
ξ (ε , yrot )=θreal−Arc tan (V Sin( ε , yrot )
V Cos (ε , y rot )) (42)
Where ξ is error function which should be minimized, θreal is the real position of rotor, VSin and VCos are AFR output voltages which are related to eccentricity (ε) and rotor yoke length (yrot). The real position (θreal) can be calculated by
home set of rotor position (θ0rotor ) (against stator position),
pole number (p) and rotor speed (f, revolution per second) that is:
θreal=θ0rotor+ 2 π . f
p2
.t(43)
According to (42, 43), the following values of genetic operators were used in the algorithm.1) Initial population: N = 302) Probability of reproduction: pr = 0.253) Probability of mutation: pm = 0.054) Probability of crossover: pc = 0.05After a certain number of successions, some results were obtained. One tooth of calculated rotor shape is shown in Fig. 23(c). This figure shows in optimized rotor shape (Fig. 23(c)) rotor yoke length is reduced. It can be concluded that, the latter case (optimized rotor shape) will be able to minimize the Variations of the common effective iron surface between rotor and stator. Because, in modified structure the iron surface of stator is

bigger than that of rotor (Fig. 23(c)). So, if the static eccentricity occurs (Fig. 23(d)), it is expected that, the variation of the permeance, inductance and output voltage either be minimized or even be eliminated. Optimized rotor was made and has been shown in Fig. 24. The main design parameters of the optimized AFR are shown in Table 5.
When Static Eccentricity
Occurs
Stator Teeth
Rotor Teeth
Static Eccentricity
AFR without Static EccentricityAFR with Static Eccentricity
(b) (a)
When Static Eccentricity
Occurs
Stator Teeth
Rotor Teeth
Optimized AFR without Static Eccentricity(a=b)
Optimized AFR with Static Eccentricity(a≠b)
Static Eccentricity
a b
(d) (c)Fig. 23: Tooth geometry with and without static eccentricity (a,b) Proposed structure (c,d) Optimized topology
(a)
Proposed Stator Proposed Rotor Optimized Rotor
(b)Fig. 24: Optimized AFR (a) 3D-FEM schematic (b) Manufactured
Table 5: Geometrical dimensions of optimized AFR
Item. Value (unit)
Outer/Inner Diameter of Stator 72.0/52.0 mmOuter/Inner Diameter of Rotor 68.0/56.0 mm
Stator/Rotor Core thickness 10/6 mmnumber of stator/rotor slots 24/12
Air gap length 1 mm
B. The Effect of Eccentricity on Optimized AFRIn order to evaluate optimized rotor of AFR it was made and replaced with initial rotor. Figure 25 shows the testing results of the AFR with optimized rotor including the oscilloscope graphs, normalized output signals, and angular position in eccentric optimized AFR compared with those of an AFR without static eccentricity.
(a)
2 2.5 3 3.5 4 4.5 5 5.5 6 6.5x 10⁻³
-1
-0.5
0
0.5
1
Time [Sec]
Out
put S
igna
ls [p
u]
2 2.5 3 3.5 4 4.5 5 5.5 6 6.5x 10⁻³
-2
-1
0
1
2
Time [Sec]
Roto
r Pos
ition
[Deg
]
Concentric AFRAFR with Static Eccentricity
SineCosine
Cosine
Sine
AmplitudeDifference
Phase Difference
(b)
2 2.5 3 3.5 4 4.5 5 5.5 6 6.5x 10⁻³
-100
-50
0
50
100
Roto
r Pos
ition
[Deg
]
Time [Sec]2 2.5 3 3.5 4 4.5 5 5.5 6 6.5
x 10-3
-1
-0.5
0
0.5
1
Posi
tion
Erro
r [De
g]
Concentric AFRAFR with Static Eccentricity
(c) Fig. 25: Testing results of AFR with optimized rotor. (a) Oscilloscope graph measured (Ch1: Exciting Voltage; Ch2, 3: Output signals). (b) Normalized output signals of eccentric AFR versus time with 4000 Hz excitation. (c) Comparison of angular position in eccentric and symmetric optimized AFR
For accurate comparison, the output position signals of symmetric and eccentric optimized AFR are shown in fig. 25(c). In this figure AFR detected position is calculated considering arctangent of output signals ratio. On this basis, Fig. 25(c) regards that the rotor eccentricity of 10 μm causes maximum 0.8 Arcdeg error in detected angular position. In comparison with initial (non optimized) AFR the position error decreases 71.4%. Although, the position error is reduced substantially against SE but 0.8 Arcdeg position error is a significant error in comparison with initial AFR
without eccentricity with maximum 0.1 Arcdeg position error. It seems that the overhang leakage flux may be results this error. Because, when rotor is displaced by means of a mechanical force the overhang leakage flux affects one side of stator more than others. Therefore, the 3D FE analysis repeated with current sheets insisted of windings. In this case, as shown in fig. 26 the position error of optimized AFR decreases to 0.16 Arcdeg.
2 2.5 3 3.5 4 4.5 5 5.5 6 6.5x 10⁻³
-100
-50
0
50
100
Rot
or P
ositi
on [D
eg]
Time [Sec]2 2.5 3 3.5 4 4.5 5 5.5 6 6.5
x 10-3
-0.2
-0.1
0
0.1
0.2
Posi
tion
Erro
r [D
eg]
Concentric AFRAFR with Static Eccentricity
Fig. 26: Comparison of angular position in eccentric and symmetric optimized AFR with current sheet replaced with rotor windings
Although, replacing current sheet instead of rotor windings is not practical. But, it is suggested that to reduce the effect of the overhang leakage flux, it is better to increase radial length of rotor coils. When, radial length of rotor coils increases as 10% of outer diameter of optimized rotor the maximum position error of optimized AFR decreases to 0.18 Arcdeg (fig. 27).2 2.5 3 3.5 4 4.5 5 5.5 6 6.5
x 10-3
-100
-50
0
50
100
Rot
or P
ositi
on [D
eg]
Time [Sec]2 2.5 3 3.5 4 4.5 5 5.5 6 6.5
x 10-3
-0.2
-0.1
0
0.1
0.2
Posi
tion
Erro
r [D
eg]
Concentric AFRAFR with Static Eccentricity
2 2.5 3 3.5 4 4.5 5 5.5 6 6.5x 10⁻³
-0.2
-0.15
-0.1
-0.05
0
0.05
0.1
0.15
Time [Sec]
3D FEMMeasured
Fig. 27: Comparison of optimized AFR position error with current sheet (in 3D-FE analysis) and increased radial length of rotor coils (in practical test)
VI. Increasing the accuracy of proposed structureAs discussed above, overhang leakage flux was the main factor in which, AFR sensitivity against SE was affected. So, the following methods are proposed to improve the sensitivity of the AFR. Detailed analysis and experiments will be presented in an upcoming paper.However, by using time stepping 3D FE analysis with equal tooth slopes, the yoke widths which minimize the maximum AFR error are shown in Figure 20 for the air gap lengths g = 0.5, 0.1, 1.5 and 2 mm.The information in Fig. 26-28 illustrates several key features to improve the sensitivity of the AFR against SE. They are: (a) Minimizing the AFR sensitivity against SE is proportional to radial length of rotor coils; i.e. longer radial length of rotor coils leads to smaller SE sensitivity, (b) Increasing pole umber decreases overhang length of coils, overhang leakage flux and then SE sensitivity (c) the optimum yoke widths for a particular air gap length are not equal. Therefore, traditional optimization methods such as
grads method are not suitable for this problem, (d) AFR position error caused by SE is inversely proportional to air gap length, therefore the larger the air gap length is the smaller the AFR error (caused by SE) is, and (e) The optimum yoke widths vary relatively little with air gap length variations.
Posi
tion
Err
or [D
eg]
67
89
100.5
1
1.5
2
0
0.5
1
1.5
2
2.5
3
Air Gap Length [mm]Yuke Length [mm]
AFR
Posi
tion
Erro
r [D
eg]
Static Ecc. = 10 μm
Fig. 18: Testing results of AFR with optimized rotor.
VII. ConclusionIn this work the design and optimization of a novel axial flux resolver (AFR) structure which can be robust against static eccentricity (SE) has been considered. Basic resolver operation was reviewed and static eccentricity is identified as a critical resolver (or resolver mounted shaft) bearing characteristics which determine resolver inherent position error. Using d-q model, time stepping 3D-FEM and practical tests showed that with same design parameters (such as air gap length, stator and rotor slot number, …) and SE level, AFRs are 2.79 times aureate than conventional radial flux resolvers. However, when SE occurs, AFR's position error increases too and needs to be decreased further. Although, such a precision is sufficient for most motor commutation applications, but AFR structure optimized for precise applications with genetic algorithm (GA) by solving the inverse electromagnetic field problem using a time stepping 3D FEM approach. Optimization process determined the rotor yoke parameters which minimize the AFR sensitivity against SE. In addition, it can be concluded that the position errors of optimized rotor mainly come from the overhang leakage flux. To reduce the effect of this flux, it is suggested that the radial length of rotor windings should increase about 10%. Finally, several improvement methods are proposed, including increasing the number of stator poles, decreasing rotor yoke length (changing to the optimal one), increasing the air gap length, and adopting a sinusoidal distributed winding pattern. Further results will be presented in an upcoming paper.
References[1] L. Sun, "Analysis and Improvement on the Structure of Variable Reluctance Resolvers", IEEE Trans. Magn., vol. 44, no. 8, pp. 2002-2008, Aug. 2008.

[2] Khaburi D. A., Tootoonchian F., Nasiri-Gheidari Z. (Jan. 2007), Parameter Identification of a Brushless Resolver Using Charge Response of Stator Current, Iranian Journal of Electrical & Electronic Engineering, Pap. 3(1&2), 42-52.[3] L. Sun, Y. Lu, "Rotor-Position Sensing System Based on One Type of Variable-Reluctance Resolver", 32nd Annual IEEE Industrial Electronics (IECON2006) Conf. Proc. Paris, France, 2006, pp. 1162-1165.[4] General Katalog of Tamagawa Company, "Singlsyns (Superior Flat Absolute Angle Sensor)", http://tamagawa-seiki.com/pdfj/1579n3e.pdf, received at 1389/2/5. [5] General Katalog of Tamagawa Company, "Smartsyn-08", http://www.encoder-technology.com, received at 2011/2/5. [6] Technical note from Encoder Technology LTD, "Smartsyn FA-Solver", http://www.encoder-technology.com, received at 2010/10/1.[7] Technical note from Encoder Technology LTD, "Instruction Book for Resolvers (Smartsyn and Signalsyn)", http://www.encoder-technology.com, received at 1389/2/5. [8] X. Li, Q. Wu, and S. Nandi, “Performance Analysis of a Three-Phase Induction Machine with Inclined Static Eccentricity”, IEEE Transactions on Industry Applications, vol. 43, no. 2, pp. 531-541, March/April 2007.[9] K. Masaki, K. Kitazawa, H. Mimura, M. Nirei , K. Tsuchimichi , H. Wakiwaka, H. Yamada, “Magnetic Field Analysis of A Resolver with A Skewed and Eccentric Rotor”, Elsevier Trans. Sensors and Actuators, pp. 297-300, 2000.[10] D. M. Burke and A. G. Jack, "Magnetic Flux Distribution in the End Regions of High Precision Slab Resolvers and Synchros", 5th International Electrical Machines and Drives Conf. Proc., London, UK, 1991, pp. 165-169.[11] M. Nireia, Y. Yamamotoa, K. Kitazawab, Y. Kikuchib, A. Kamiyac, H. Wakiwakac, "Angular Error Analysis of An 8X-VR Rresolver with An Eccentric Rotor", Journal of Magnetism and Magnetic Materials, vol. 242-245, no. 2, pp. 1202–1205, April 2002. [12] M. Crivii, M. Jufer, W. Wyss, E. Favre, "Variable Reluctance Resolver Modelisation and Angular Position Error Detection", 29th Annual Symposium on Incremental Motion Control Systems and Devices (IMCSD) Proc., Berkeley, Canada, July 2000, pp. 139-144. [13] K. Kim, S. Hwang, K. Sung, Y. Kim, "A study on the fault diagnosis analysis of variable reluctance resolver for electric vehicle", 9th IEEE Sensors Conf. Proc, Kona HI, USA, 1-4 Nov. 2010, pp. 290 – 295.[14] D. A. Khaburi, F. Tootoonchian and Z. Nasiri-Gheidari, “Dynamic Performance Prediction of Brushless Resolver”, Iranian Journal of Electrical & Electronic Engineering, vol. 4, no. 3, pp. 94-103, July 2008.[15] D. C. Hanselman, R. E. Thibodeau, D. J. Smith, "Variable-Reluctance Resolver Design Guidelines", IECON, IEEE Industrial Electronics (IECON'89) Conf. Proc., New York, USA, 1989, pp. 203-208.[16] J. S. Varga, “Magnetic and Dimensional Properties of Axial Induction Motors”, IEEE Transactions on Energy Conversion, vol. EC-1, no. 2, pp. 137-144, June 1986.[17] S. Kubzdela and B. Weglinski, “Magnetodielectrics in Induction Motors with Disk Rotor”, IEEE Trans. on Magn., vol. 24, no. 1, pp. 635-638, January 1988.[18] C.C. Chan, “Axial-Field Electrical Machines Design and Applications”, IEEE Tran. on Energy Conversion, vol. EC-2, no. 2, pp. 294-300, June 1987.[19] C. ZHANGE, K.J. TSENG AND T.D. NGUYEN, “Analysis and Comparison of Axial Flux PM Synchronous Motor and Induction Motor”, 9th IEEE International Power & Energy Conf. (IPEC 2010) Proc., Suntec, Singapore, 27 - 29 Oct. 2010, vol. 1, pp. 572-577.[20] P.C. Krause, “Analysis of Electrical Machinery”, McGraw-Hill series in electrical engineering, Power & energy, 1986.[21] C.M. Ong, “Dynamic Simulation of Electric Machinery Using Matlab/Simulink”, Prentice Hall PTR. Upper Saddle River, New Jersey, 1998.[22] Z. Zhao, F. Liu, Z. Cheng, W. Yan, L. Liu, J. Zhang, and Y. Fan, "Measurements and Calculation of Core- Based B-H Curve and Magnetizing Current in DC-Biased Transformers", IEEE Trans. on Applied Superconductivity, vol. 20, no. 3, pp. 1131-1134, June 2010.[23] Analog Device Company, “RDC Datasheets”, presented at http://www.analog.com, received at 10 Nov. 2010.[24] J. Pyrh¨onen, T. Jokinen, V. Hrabovcov´a, H. Niemel¨a, "Design of Rotating Electrical Machines", John Wiley and Sons Ltd., ISBN: 978-0-470-69516-6 (H/B), 2008.
[25] M. Nirei, Y. Yamainoto, K. Kohayashi and T. Maruyama, "Torque Form Design of Laser Scanning Actuator Based on Statistical Method", IEEE Trans. on Magn., vol. 33, no. 5, Sept. 1997.[26] L. Sun, G. Zhang, and Y. Ping Lu, "Application of genetic algorithms to design motor pole shapes", J. Harbin Inst. Technol., no. 1, pp. 71–74, 2000.