a novel 3-d power doppler ultrasound approach to the quantification of achilles tendon...
TRANSCRIPT
Ultrasound in Med. & Biol., Vol. 37, No. 7, pp. 1046–1055, 2011Copyright � 2011 World Federation for Ultrasound in Medicine & Biology
Printed in the USA. All rights reserved0301-5629/$ - see front matter
asmedbio.2011.04.008
doi:10.1016/j.ultrd Original Contribution
A NOVEL 3-D POWER DOPPLER ULTRASOUND APPROACH TO THEQUANTIFICATION OFACHILLES TENDON NEOVASCULARITY
XIN YANG,* DECLAN P. COLEMAN,y NEIL D. PUGH,y and LEN D. M. NOKES**Institute of Medical Engineering and Medical Physics, School of Engineering, Cardiff University, Cardiff, United Kingdom;
and yDepartment of Medical Physics and Clinical Engineering, University Hospital of Wales, Cardiff, United Kingdom
(Received 23 December 2010; revised 18 March 2011; in final form 17 April 2011)
AEngineUniver
Abstract—To investigate the amount of neovascularization in the symptomatic Achilles tendon, we developeda novel three-dimensional (3-D) power Doppler ultrasound scanning system to prospectively examine 10 patientswith 12 symptomatic Achilles tendons, as well as 20 asymptomatic Achilles tendons as a control group. The meanvolume of neovascularity (VON) in the whole Achilles tendon was calculated during the phase of the cardiac cycledisplayingmaximum vascularity and also during the phase of the cardiac cycle displaying theminimum. ThemeanVONs in the control group were found to be 0.41 mm3 (maximum) and 0.02 mm3 (minimum), respectively. Themean VONs in patients with painful Achilles tendon were 380 mm3 (maximum) and 70.3 mm3 (minimum), respec-tively. The initial results showed that the 3-D power Doppler ultrasound system could be used to measure the meanVON in controls and in patients with symptomatic Achilles tendinopathy. The results demonstrated a significantlygreater VON in the maximum phase compared with the minimum phase as well as in the patient group comparedwith that in the control group. The systemwas therefore capable of defining the degree of vascularity in the Achillestendon. (E-mail: [email protected]) � 2011 World Federation for Ultrasound in Medicine & Biology.
Key Words: Achilles tendon, Tendinopathy, Neovascularization, Power Doppler ultrasound, 3-D.
INTRODUCTION
Chronic Achilles tendinopathy is a frequent overuseinjury in athletes and elderly people. They are known tobe difficult to treat and can result in reduced mobility(Jarvinenet al. 2005). Many studies indicate that Achillestendinopathy is accompanied by neovascularization orhypervascularity on both colour Doppler (CDUS) andpower Doppler ultrasonography (PDUS) (Peers et al.2003; Reiter et al. 2004; Zanetti et al. 2003). PDUS isrecommended because it is relatively independent ofthe angle of incident beam, does not cause aliasing andreduces the background noise, hence, improvingsensitivity (Rubin et al. 1994). Our previous study(Yang et al. 2010) found the settings of pulse repetitionfrequency (PRF), colour gain (CG) and Dopplerfrequency during the PDUS diagnosis could affect themeasurement of neovascularization. Therefore, Achillestendon examination protocols including the optimized
ddress correspondence to: Xin Yang, Institute of Medicalering and Medical Physics, School of Engineering, Cardiffsity, Cardiff, UK. E-mail: [email protected]
1046
parameters on ultrasound machine were previouslyrecommended.
Previous studies have graded neovascularization inAchilles tendons according to a semiquantitative gradingsystem (Boesen, Boesen et al. 2006; Boesen, Torp-Pedersen et al. 2006), in which the amount ofintratendinous Doppler signal inside a region-of-interest(ROI) was split into five levels (0–4). The amount of neo-vascularization that can be detected will depend on thephase of the cardiac cycle in which the image is formed(Yuan et al. 1994). Therefore, any assessment of vascu-larity depends on the phase of the cardiac cycle in whichthe image was acquired. Previous studies (de Vos et al.2007; Peers et al. 2003) have not indicated duringwhich phase of the cardiac cycle the data werecollected and whether that phase was consistentbetween different data sets. This might introducea great scope for error in classification of Achillesneovascularization. Additionally, conventional two-dimensional (2-D) Doppler imaging only analyses oneimage, usually the image including the maximumvascularity. Clearly, this is very subjective and conse-quently, many studies have used three-dimensional(3-D) ultrasound imaging to assess vascularity in other
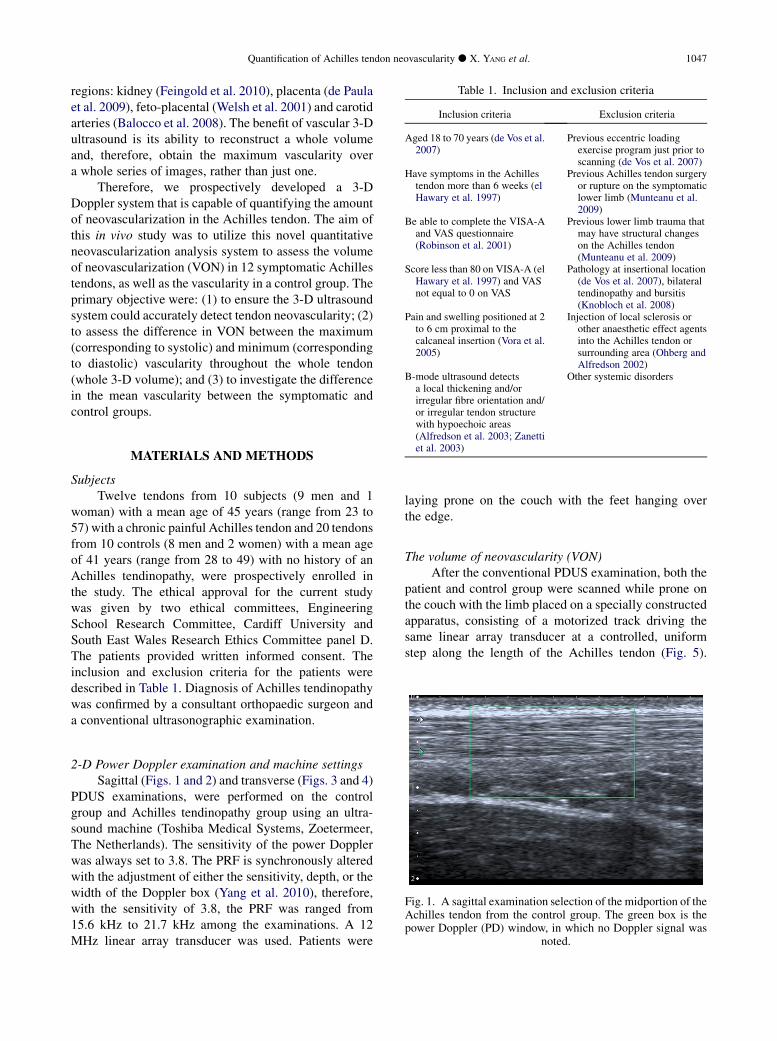
Table 1. Inclusion and exclusion criteria
Inclusion criteria Exclusion criteria
Aged 18 to 70 years (de Vos et al.2007)
Previous eccentric loadingexercise program just prior toscanning (de Vos et al. 2007)
Have symptoms in the Achillestendon more than 6 weeks (elHawary et al. 1997)
Previous Achilles tendon surgeryor rupture on the symptomaticlower limb (Munteanu et al.2009)
Be able to complete the VISA-Aand VAS questionnaire(Robinson et al. 2001)
Previous lower limb trauma thatmay have structural changeson the Achilles tendon(Munteanu et al. 2009)
Score less than 80 on VISA-A (elHawary et al. 1997) and VASnot equal to 0 on VAS
Pathology at insertional location(de Vos et al. 2007), bilateraltendinopathy and bursitis(Knobloch et al. 2008)
Pain and swelling positioned at 2to 6 cm proximal to thecalcaneal insertion (Vora et al.2005)
Injection of local sclerosis orother anaesthetic effect agentsinto the Achilles tendon orsurrounding area (Ohberg andAlfredson 2002)
B-mode ultrasound detectsa local thickening and/orirregular fibre orientation and/or irregular tendon structure
Other systemic disorders
Quantification of Achilles tendon neovascularity d X. YANG et al. 1047
regions: kidney (Feingold et al. 2010), placenta (de Paulaet al. 2009), feto-placental (Welsh et al. 2001) and carotidarteries (Balocco et al. 2008). The benefit of vascular 3-Dultrasound is its ability to reconstruct a whole volumeand, therefore, obtain the maximum vascularity overa whole series of images, rather than just one.
Therefore, we prospectively developed a 3-DDoppler system that is capable of quantifying the amountof neovascularization in the Achilles tendon. The aim ofthis in vivo study was to utilize this novel quantitativeneovascularization analysis system to assess the volumeof neovascularization (VON) in 12 symptomatic Achillestendons, as well as the vascularity in a control group. Theprimary objective were: (1) to ensure the 3-D ultrasoundsystem could accurately detect tendon neovascularity; (2)to assess the difference in VON between the maximum(corresponding to systolic) and minimum (correspondingto diastolic) vascularity throughout the whole tendon(whole 3-D volume); and (3) to investigate the differencein the mean vascularity between the symptomatic andcontrol groups.
with hypoechoic areas(Alfredson et al. 2003; Zanettiet al. 2003)
MATERIALS AND METHODS
SubjectsTwelve tendons from 10 subjects (9 men and 1
woman) with a mean age of 45 years (range from 23 to57) with a chronic painful Achilles tendon and 20 tendonsfrom 10 controls (8 men and 2 women) with a mean ageof 41 years (range from 28 to 49) with no history of anAchilles tendinopathy, were prospectively enrolled inthe study. The ethical approval for the current studywas given by two ethical committees, EngineeringSchool Research Committee, Cardiff University andSouth East Wales Research Ethics Committee panel D.The patients provided written informed consent. Theinclusion and exclusion criteria for the patients weredescribed in Table 1. Diagnosis of Achilles tendinopathywas confirmed by a consultant orthopaedic surgeon anda conventional ultrasonographic examination.
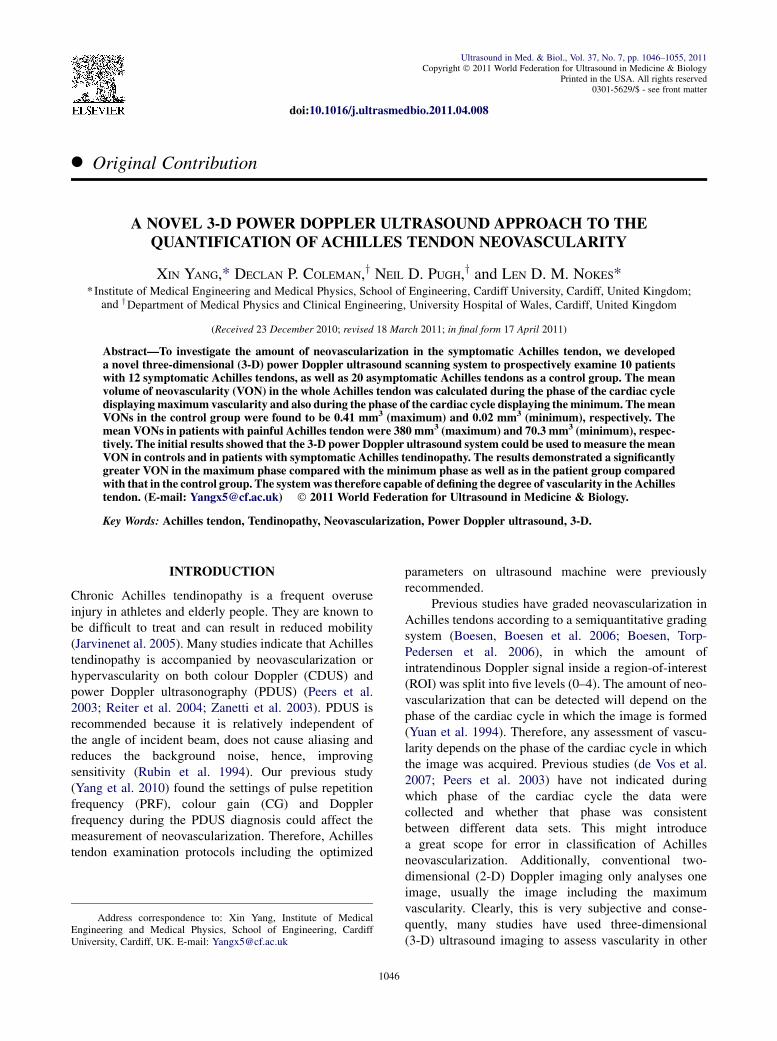
Fig. 1. A sagittal examination selection of the midportion of theAchilles tendon from the control group. The green box is thepower Doppler (PD) window, in which no Doppler signal was
noted.
2-D Power Doppler examination and machine settingsSagittal (Figs. 1 and 2) and transverse (Figs. 3 and 4)
PDUS examinations, were performed on the controlgroup and Achilles tendinopathy group using an ultra-sound machine (Toshiba Medical Systems, Zoetermeer,The Netherlands). The sensitivity of the power Dopplerwas always set to 3.8. The PRF is synchronously alteredwith the adjustment of either the sensitivity, depth, or thewidth of the Doppler box (Yang et al. 2010), therefore,with the sensitivity of 3.8, the PRF was ranged from15.6 kHz to 21.7 kHz among the examinations. A 12MHz linear array transducer was used. Patients were
laying prone on the couch with the feet hanging overthe edge.
The volume of neovascularity (VON)After the conventional PDUS examination, both the
patient and control group were scanned while prone onthe couch with the limb placed on a specially constructedapparatus, consisting of a motorized track driving thesame linear array transducer at a controlled, uniformstep along the length of the Achilles tendon (Fig. 5).
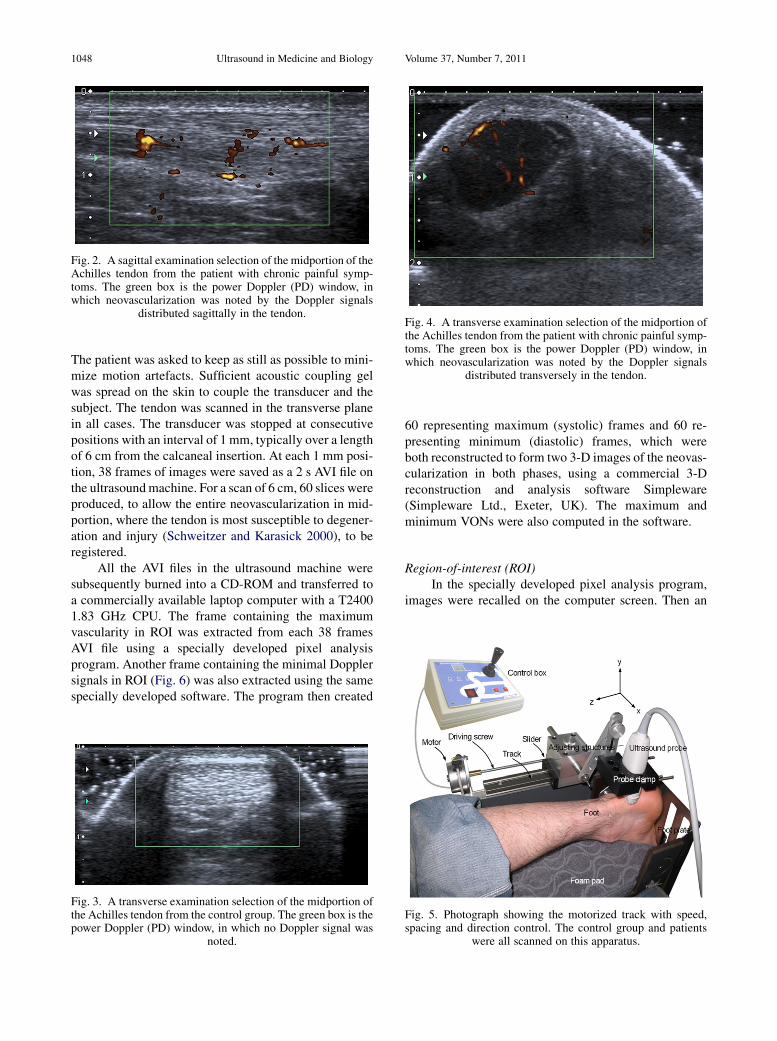
Fig. 2. A sagittal examination selection of the midportion of theAchilles tendon from the patient with chronic painful symp-toms. The green box is the power Doppler (PD) window, inwhich neovascularization was noted by the Doppler signals
distributed sagittally in the tendon.Fig. 4. A transverse examination selection of the midportion ofthe Achilles tendon from the patient with chronic painful symp-toms. The green box is the power Doppler (PD) window, inwhich neovascularization was noted by the Doppler signals
distributed transversely in the tendon.
1048 Ultrasound in Medicine and Biology Volume 37, Number 7, 2011
The patient was asked to keep as still as possible to mini-mize motion artefacts. Sufficient acoustic coupling gelwas spread on the skin to couple the transducer and thesubject. The tendon was scanned in the transverse planein all cases. The transducer was stopped at consecutivepositions with an interval of 1 mm, typically over a lengthof 6 cm from the calcaneal insertion. At each 1 mm posi-tion, 38 frames of images were saved as a 2 s AVI file onthe ultrasoundmachine. For a scan of 6 cm, 60 slices wereproduced, to allow the entire neovascularization in mid-portion, where the tendon is most susceptible to degener-ation and injury (Schweitzer and Karasick 2000), to beregistered.
All the AVI files in the ultrasound machine weresubsequently burned into a CD-ROM and transferred toa commercially available laptop computer with a T24001.83 GHz CPU. The frame containing the maximumvascularity in ROI was extracted from each 38 framesAVI file using a specially developed pixel analysisprogram. Another frame containing the minimal Dopplersignals in ROI (Fig. 6) was also extracted using the samespecially developed software. The program then created
Fig. 3. A transverse examination selection of the midportion ofthe Achilles tendon from the control group. The green box is thepower Doppler (PD) window, in which no Doppler signal was
noted.
60 representing maximum (systolic) frames and 60 re-presenting minimum (diastolic) frames, which wereboth reconstructed to form two 3-D images of the neovas-cularization in both phases, using a commercial 3-Dreconstruction and analysis software Simpleware(Simpleware Ltd., Exeter, UK). The maximum andminimum VONs were also computed in the software.
Region-of-interest (ROI)In the specially developed pixel analysis program,
images were recalled on the computer screen. Then an
Fig. 5. Photograph showing the motorized track with speed,spacing and direction control. The control group and patients
were all scanned on this apparatus.
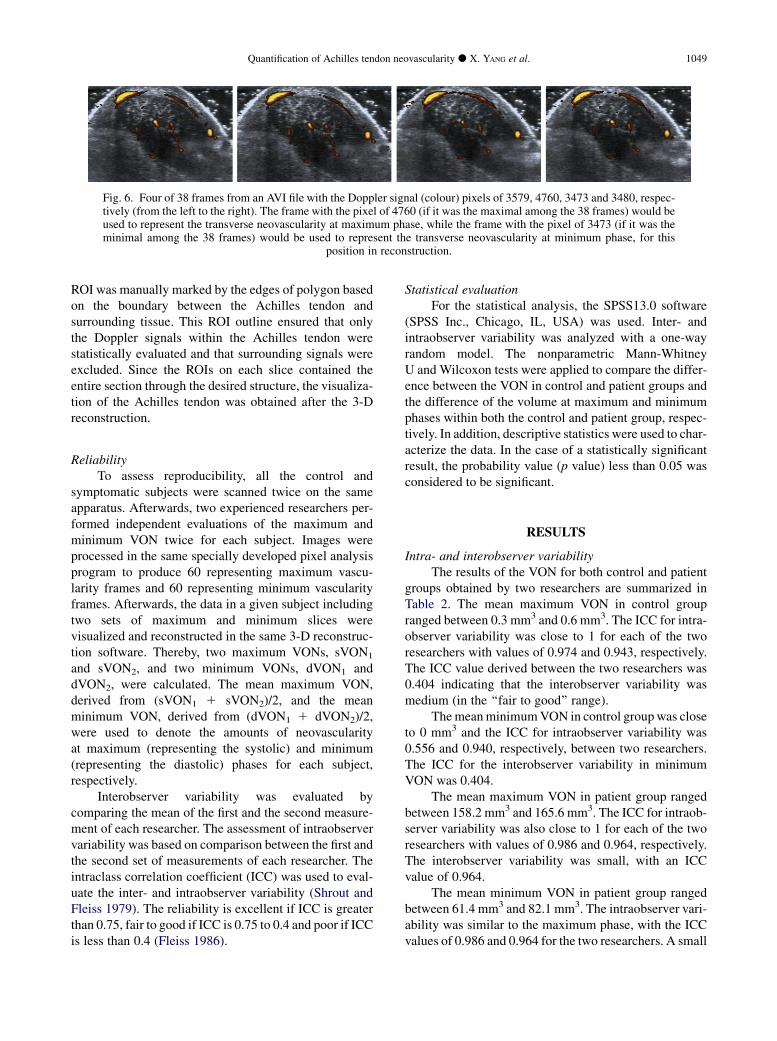
Fig. 6. Four of 38 frames from an AVI file with the Doppler signal (colour) pixels of 3579, 4760, 3473 and 3480, respec-tively (from the left to the right). The frame with the pixel of 4760 (if it was the maximal among the 38 frames) would beused to represent the transverse neovascularity at maximum phase, while the frame with the pixel of 3473 (if it was theminimal among the 38 frames) would be used to represent the transverse neovascularity at minimum phase, for this
position in reconstruction.
Quantification of Achilles tendon neovascularity d X. YANG et al. 1049
ROI was manually marked by the edges of polygon basedon the boundary between the Achilles tendon andsurrounding tissue. This ROI outline ensured that onlythe Doppler signals within the Achilles tendon werestatistically evaluated and that surrounding signals wereexcluded. Since the ROIs on each slice contained theentire section through the desired structure, the visualiza-tion of the Achilles tendon was obtained after the 3-Dreconstruction.
ReliabilityTo assess reproducibility, all the control and
symptomatic subjects were scanned twice on the sameapparatus. Afterwards, two experienced researchers per-formed independent evaluations of the maximum andminimum VON twice for each subject. Images wereprocessed in the same specially developed pixel analysisprogram to produce 60 representing maximum vascu-larity frames and 60 representing minimum vascularityframes. Afterwards, the data in a given subject includingtwo sets of maximum and minimum slices werevisualized and reconstructed in the same 3-D reconstruc-tion software. Thereby, two maximum VONs, sVON1
and sVON2, and two minimum VONs, dVON1 anddVON2, were calculated. The mean maximum VON,derived from (sVON1 1 sVON2)/2, and the meanminimum VON, derived from (dVON1 1 dVON2)/2,were used to denote the amounts of neovascularityat maximum (representing the systolic) and minimum(representing the diastolic) phases for each subject,respectively.
Interobserver variability was evaluated bycomparing the mean of the first and the second measure-ment of each researcher. The assessment of intraobservervariability was based on comparison between the first andthe second set of measurements of each researcher. Theintraclass correlation coefficient (ICC) was used to eval-uate the inter- and intraobserver variability (Shrout andFleiss 1979). The reliability is excellent if ICC is greaterthan 0.75, fair to good if ICC is 0.75 to 0.4 and poor if ICCis less than 0.4 (Fleiss 1986).
Statistical evaluationFor the statistical analysis, the SPSS13.0 software
(SPSS Inc., Chicago, IL, USA) was used. Inter- andintraobserver variability was analyzed with a one-wayrandom model. The nonparametric Mann-WhitneyU and Wilcoxon tests were applied to compare the differ-ence between the VON in control and patient groups andthe difference of the volume at maximum and minimumphases within both the control and patient group, respec-tively. In addition, descriptive statistics were used to char-acterize the data. In the case of a statistically significantresult, the probability value (p value) less than 0.05 wasconsidered to be significant.
RESULTS
Intra- and interobserver variabilityThe results of the VON for both control and patient
groups obtained by two researchers are summarized inTable 2. The mean maximum VON in control groupranged between 0.3 mm3 and 0.6 mm3. The ICC for intra-observer variability was close to 1 for each of the tworesearchers with values of 0.974 and 0.943, respectively.The ICC value derived between the two researchers was0.404 indicating that the interobserver variability wasmedium (in the ‘‘fair to good’’ range).
ThemeanminimumVON in control group was closeto 0 mm3 and the ICC for intraobserver variability was0.556 and 0.940, respectively, between two researchers.The ICC for the interobserver variability in minimumVON was 0.404.
The mean maximum VON in patient group rangedbetween 158.2 mm3 and 165.6 mm3. The ICC for intraob-server variability was also close to 1 for each of the tworesearchers with values of 0.986 and 0.964, respectively.The interobserver variability was small, with an ICCvalue of 0.964.
The mean minimum VON in patient group rangedbetween 61.4 mm3 and 82.1 mm3. The intraobserver vari-ability was similar to the maximum phase, with the ICCvalues of 0.986 and 0.964 for the two researchers. A small
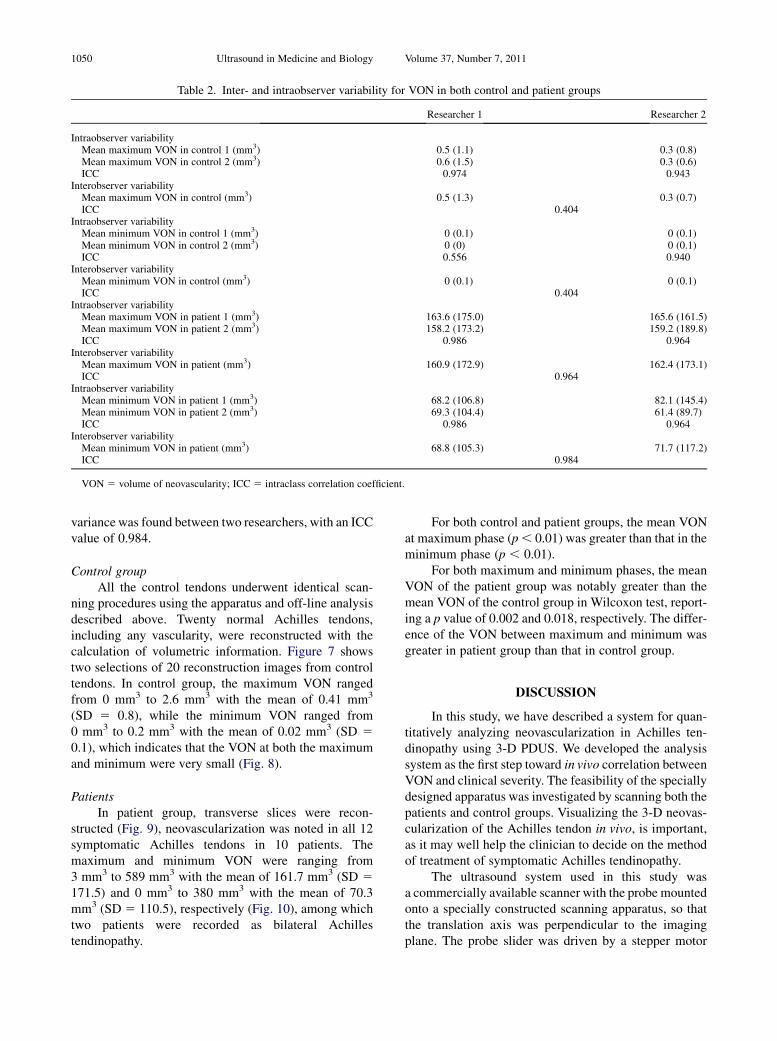
Table 2. Inter- and intraobserver variability for VON in both control and patient groups
Researcher 1 Researcher 2
Intraobserver variabilityMean maximum VON in control 1 (mm3) 0.5 (1.1) 0.3 (0.8)Mean maximum VON in control 2 (mm3) 0.6 (1.5) 0.3 (0.6)ICC 0.974 0.943
Interobserver variabilityMean maximum VON in control (mm3) 0.5 (1.3) 0.3 (0.7)ICC 0.404
Intraobserver variabilityMean minimum VON in control 1 (mm3) 0 (0.1) 0 (0.1)Mean minimum VON in control 2 (mm3) 0 (0) 0 (0.1)ICC 0.556 0.940
Interobserver variabilityMean minimum VON in control (mm3) 0 (0.1) 0 (0.1)ICC 0.404
Intraobserver variabilityMean maximum VON in patient 1 (mm3) 163.6 (175.0) 165.6 (161.5)Mean maximum VON in patient 2 (mm3) 158.2 (173.2) 159.2 (189.8)ICC 0.986 0.964
Interobserver variabilityMean maximum VON in patient (mm3) 160.9 (172.9) 162.4 (173.1)ICC 0.964
Intraobserver variabilityMean minimum VON in patient 1 (mm3) 68.2 (106.8) 82.1 (145.4)Mean minimum VON in patient 2 (mm3) 69.3 (104.4) 61.4 (89.7)ICC 0.986 0.964
Interobserver variabilityMean minimum VON in patient (mm3) 68.8 (105.3) 71.7 (117.2)ICC 0.984
VON 5 volume of neovascularity; ICC 5 intraclass correlation coefficient.
1050 Ultrasound in Medicine and Biology Volume 37, Number 7, 2011
variance was found between two researchers, with an ICCvalue of 0.984.
Control groupAll the control tendons underwent identical scan-
ning procedures using the apparatus and off-line analysisdescribed above. Twenty normal Achilles tendons,including any vascularity, were reconstructed with thecalculation of volumetric information. Figure 7 showstwo selections of 20 reconstruction images from controltendons. In control group, the maximum VON rangedfrom 0 mm3 to 2.6 mm3 with the mean of 0.41 mm3
(SD 5 0.8), while the minimum VON ranged from0 mm3 to 0.2 mm3 with the mean of 0.02 mm3 (SD 50.1), which indicates that the VON at both the maximumand minimum were very small (Fig. 8).
PatientsIn patient group, transverse slices were recon-
structed (Fig. 9), neovascularization was noted in all 12symptomatic Achilles tendons in 10 patients. Themaximum and minimum VON were ranging from3 mm3 to 589 mm3 with the mean of 161.7 mm3 (SD 5171.5) and 0 mm3 to 380 mm3 with the mean of 70.3mm3 (SD 5 110.5), respectively (Fig. 10), among whichtwo patients were recorded as bilateral Achillestendinopathy.
For both control and patient groups, the mean VONat maximum phase (p, 0.01) was greater than that in theminimum phase (p , 0.01).
For both maximum and minimum phases, the meanVON of the patient group was notably greater than themean VON of the control group in Wilcoxon test, report-ing a p value of 0.002 and 0.018, respectively. The differ-ence of the VON between maximum and minimum wasgreater in patient group than that in control group.
DISCUSSION
In this study, we have described a system for quan-titatively analyzing neovascularization in Achilles ten-dinopathy using 3-D PDUS. We developed the analysissystem as the first step toward in vivo correlation betweenVON and clinical severity. The feasibility of the speciallydesigned apparatus was investigated by scanning both thepatients and control groups. Visualizing the 3-D neovas-cularization of the Achilles tendon in vivo, is important,as it may well help the clinician to decide on the methodof treatment of symptomatic Achilles tendinopathy.
The ultrasound system used in this study wasa commercially available scanner with the probe mountedonto a specially constructed scanning apparatus, so thatthe translation axis was perpendicular to the imagingplane. The probe slider was driven by a stepper motor
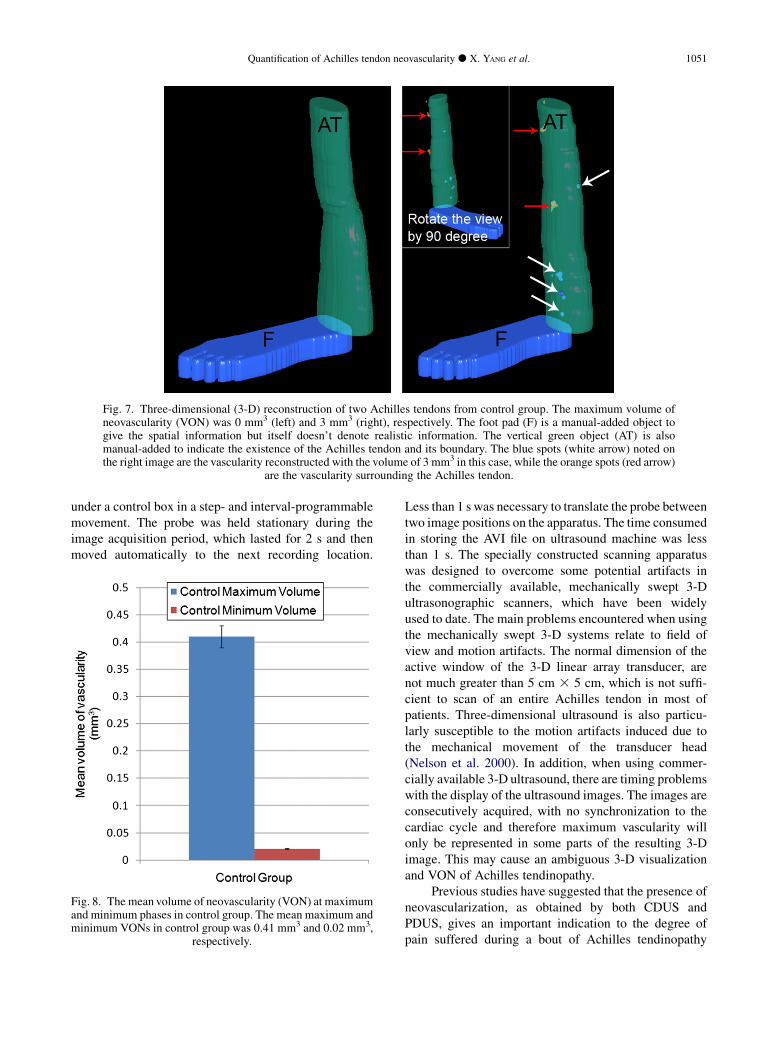
Fig. 7. Three-dimensional (3-D) reconstruction of two Achilles tendons from control group. The maximum volume ofneovascularity (VON) was 0 mm3 (left) and 3 mm3 (right), respectively. The foot pad (F) is a manual-added object togive the spatial information but itself doesn’t denote realistic information. The vertical green object (AT) is alsomanual-added to indicate the existence of the Achilles tendon and its boundary. The blue spots (white arrow) noted onthe right image are the vascularity reconstructed with the volume of 3 mm3 in this case, while the orange spots (red arrow)
are the vascularity surrounding the Achilles tendon.
Quantification of Achilles tendon neovascularity d X. YANG et al. 1051
under a control box in a step- and interval-programmablemovement. The probe was held stationary during theimage acquisition period, which lasted for 2 s and thenmoved automatically to the next recording location.
Fig. 8. The mean volume of neovascularity (VON) at maximumand minimum phases in control group. The mean maximum andminimum VONs in control group was 0.41 mm3 and 0.02 mm3,
respectively.
Less than 1 s was necessary to translate the probe betweentwo image positions on the apparatus. The time consumedin storing the AVI file on ultrasound machine was lessthan 1 s. The specially constructed scanning apparatuswas designed to overcome some potential artifacts inthe commercially available, mechanically swept 3-Dultrasonographic scanners, which have been widelyused to date. The main problems encountered when usingthe mechanically swept 3-D systems relate to field ofview and motion artifacts. The normal dimension of theactive window of the 3-D linear array transducer, arenot much greater than 5 cm 3 5 cm, which is not suffi-cient to scan of an entire Achilles tendon in most ofpatients. Three-dimensional ultrasound is also particu-larly susceptible to the motion artifacts induced due tothe mechanical movement of the transducer head(Nelson et al. 2000). In addition, when using commer-cially available 3-D ultrasound, there are timing problemswith the display of the ultrasound images. The images areconsecutively acquired, with no synchronization to thecardiac cycle and therefore maximum vascularity willonly be represented in some parts of the resulting 3-Dimage. This may cause an ambiguous 3-D visualizationand VON of Achilles tendinopathy.
Previous studies have suggested that the presence ofneovascularization, as obtained by both CDUS andPDUS, gives an important indication to the degree ofpain suffered during a bout of Achilles tendinopathy
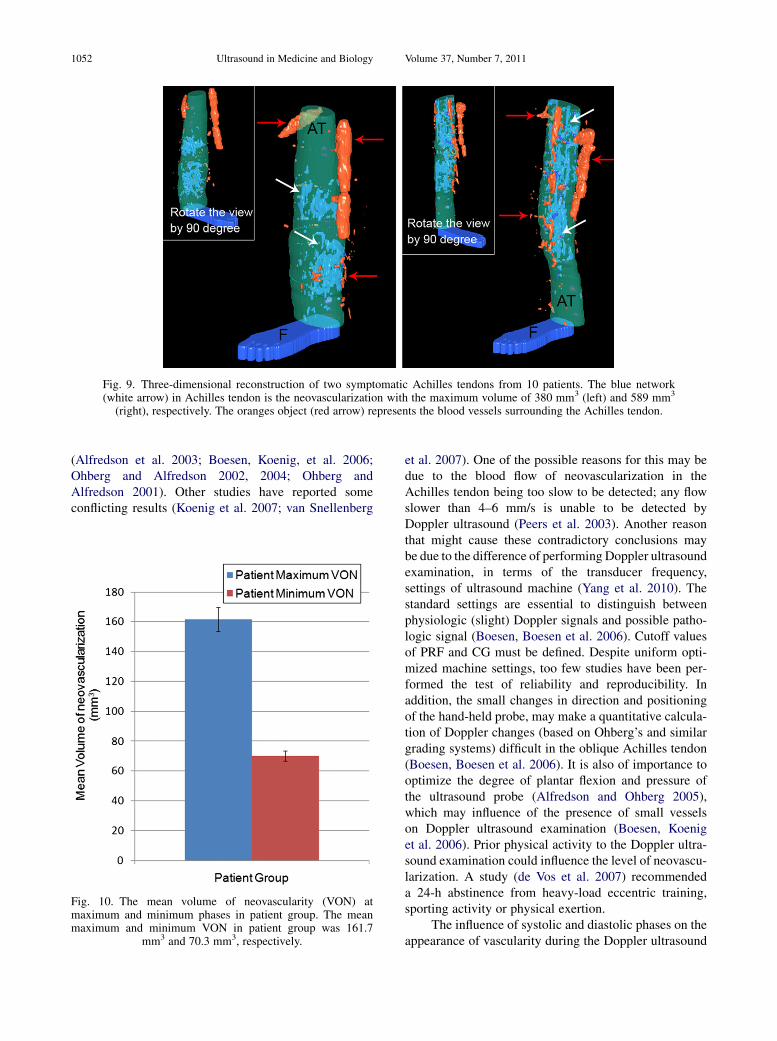
Fig. 9. Three-dimensional reconstruction of two symptomatic Achilles tendons from 10 patients. The blue network(white arrow) in Achilles tendon is the neovascularization with the maximum volume of 380 mm3 (left) and 589 mm3
(right), respectively. The oranges object (red arrow) represents the blood vessels surrounding the Achilles tendon.
1052 Ultrasound in Medicine and Biology Volume 37, Number 7, 2011
(Alfredson et al. 2003; Boesen, Koenig, et al. 2006;Ohberg and Alfredson 2002, 2004; Ohberg andAlfredson 2001). Other studies have reported someconflicting results (Koenig et al. 2007; van Snellenberg
Fig. 10. The mean volume of neovascularity (VON) atmaximum and minimum phases in patient group. The meanmaximum and minimum VON in patient group was 161.7
mm3 and 70.3 mm3, respectively.
et al. 2007). One of the possible reasons for this may bedue to the blood flow of neovascularization in theAchilles tendon being too slow to be detected; any flowslower than 4–6 mm/s is unable to be detected byDoppler ultrasound (Peers et al. 2003). Another reasonthat might cause these contradictory conclusions maybe due to the difference of performing Doppler ultrasoundexamination, in terms of the transducer frequency,settings of ultrasound machine (Yang et al. 2010). Thestandard settings are essential to distinguish betweenphysiologic (slight) Doppler signals and possible patho-logic signal (Boesen, Boesen et al. 2006). Cutoff valuesof PRF and CG must be defined. Despite uniform opti-mized machine settings, too few studies have been per-formed the test of reliability and reproducibility. Inaddition, the small changes in direction and positioningof the hand-held probe, may make a quantitative calcula-tion of Doppler changes (based on Ohberg’s and similargrading systems) difficult in the oblique Achilles tendon(Boesen, Boesen et al. 2006). It is also of importance tooptimize the degree of plantar flexion and pressure ofthe ultrasound probe (Alfredson and Ohberg 2005),which may influence of the presence of small vesselson Doppler ultrasound examination (Boesen, Koeniget al. 2006). Prior physical activity to the Doppler ultra-sound examination could influence the level of neovascu-larization. A study (de Vos et al. 2007) recommendeda 24-h abstinence from heavy-load eccentric training,sporting activity or physical exertion.
The influence of systolic and diastolic phases on theappearance of vascularity during the Doppler ultrasound
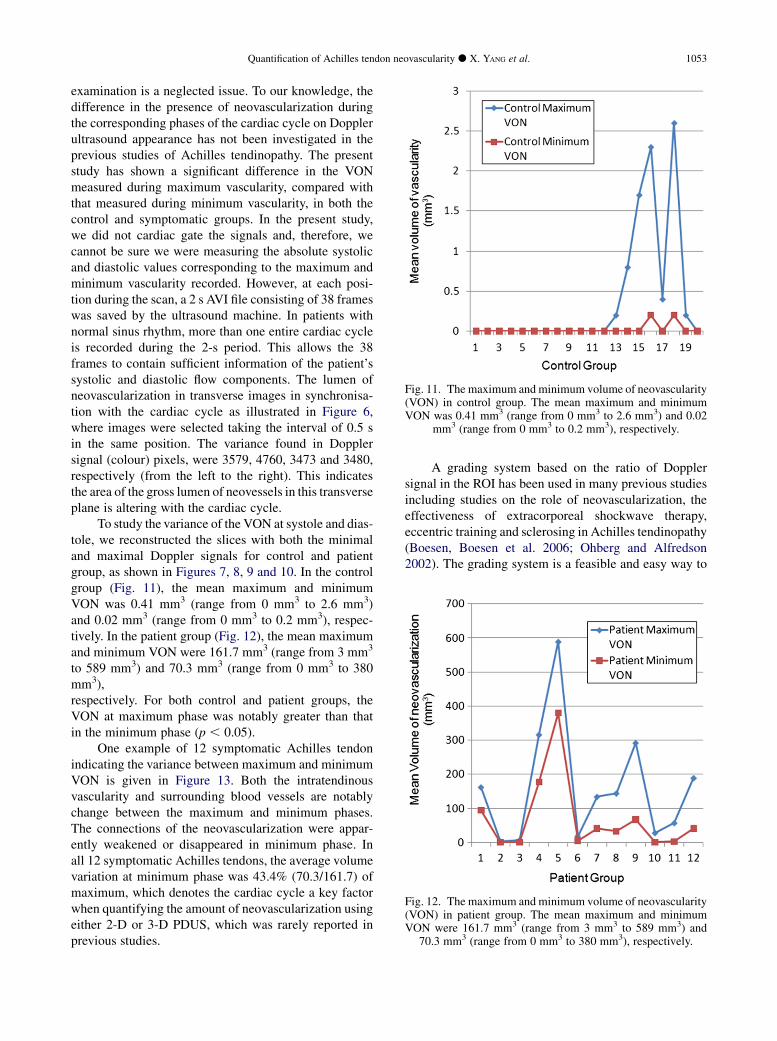
Fig. 11. The maximum and minimum volume of neovascularity(VON) in control group. The mean maximum and minimumVON was 0.41 mm3 (range from 0 mm3 to 2.6 mm3) and 0.02
mm3 (range from 0 mm3 to 0.2 mm3), respectively.
Fig. 12. The maximum and minimum volume of neovascularity(VON) in patient group. The mean maximum and minimumVON were 161.7 mm3 (range from 3 mm3 to 589 mm3) and
70.3 mm3 (range from 0 mm3 to 380 mm3), respectively.
Quantification of Achilles tendon neovascularity d X. YANG et al. 1053
examination is a neglected issue. To our knowledge, thedifference in the presence of neovascularization duringthe corresponding phases of the cardiac cycle on Dopplerultrasound appearance has not been investigated in theprevious studies of Achilles tendinopathy. The presentstudy has shown a significant difference in the VONmeasured during maximum vascularity, compared withthat measured during minimum vascularity, in both thecontrol and symptomatic groups. In the present study,we did not cardiac gate the signals and, therefore, wecannot be sure we were measuring the absolute systolicand diastolic values corresponding to the maximum andminimum vascularity recorded. However, at each posi-tion during the scan, a 2 s AVI file consisting of 38 frameswas saved by the ultrasound machine. In patients withnormal sinus rhythm, more than one entire cardiac cycleis recorded during the 2-s period. This allows the 38frames to contain sufficient information of the patient’ssystolic and diastolic flow components. The lumen ofneovascularization in transverse images in synchronisa-tion with the cardiac cycle as illustrated in Figure 6,where images were selected taking the interval of 0.5 sin the same position. The variance found in Dopplersignal (colour) pixels, were 3579, 4760, 3473 and 3480,respectively (from the left to the right). This indicatesthe area of the gross lumen of neovessels in this transverseplane is altering with the cardiac cycle.
To study the variance of the VON at systole and dias-tole, we reconstructed the slices with both the minimaland maximal Doppler signals for control and patientgroup, as shown in Figures 7, 8, 9 and 10. In the controlgroup (Fig. 11), the mean maximum and minimumVON was 0.41 mm3 (range from 0 mm3 to 2.6 mm3)and 0.02 mm3 (range from 0 mm3 to 0.2 mm3), respec-tively. In the patient group (Fig. 12), the mean maximumand minimum VON were 161.7 mm3 (range from 3 mm3
to 589 mm3) and 70.3 mm3 (range from 0 mm3 to 380mm3),respectively. For both control and patient groups, theVON at maximum phase was notably greater than thatin the minimum phase (p , 0.05).
One example of 12 symptomatic Achilles tendonindicating the variance between maximum and minimumVON is given in Figure 13. Both the intratendinousvascularity and surrounding blood vessels are notablychange between the maximum and minimum phases.The connections of the neovascularization were appar-ently weakened or disappeared in minimum phase. Inall 12 symptomatic Achilles tendons, the average volumevariation at minimum phase was 43.4% (70.3/161.7) ofmaximum, which denotes the cardiac cycle a key factorwhen quantifying the amount of neovascularization usingeither 2-D or 3-D PDUS, which was rarely reported inprevious studies.
A grading system based on the ratio of Dopplersignal in the ROI has been used in many previous studiesincluding studies on the role of neovascularization, theeffectiveness of extracorporeal shockwave therapy,eccentric training and sclerosing in Achilles tendinopathy(Boesen, Boesen et al. 2006; Ohberg and Alfredson2002). The grading system is a feasible and easy way to
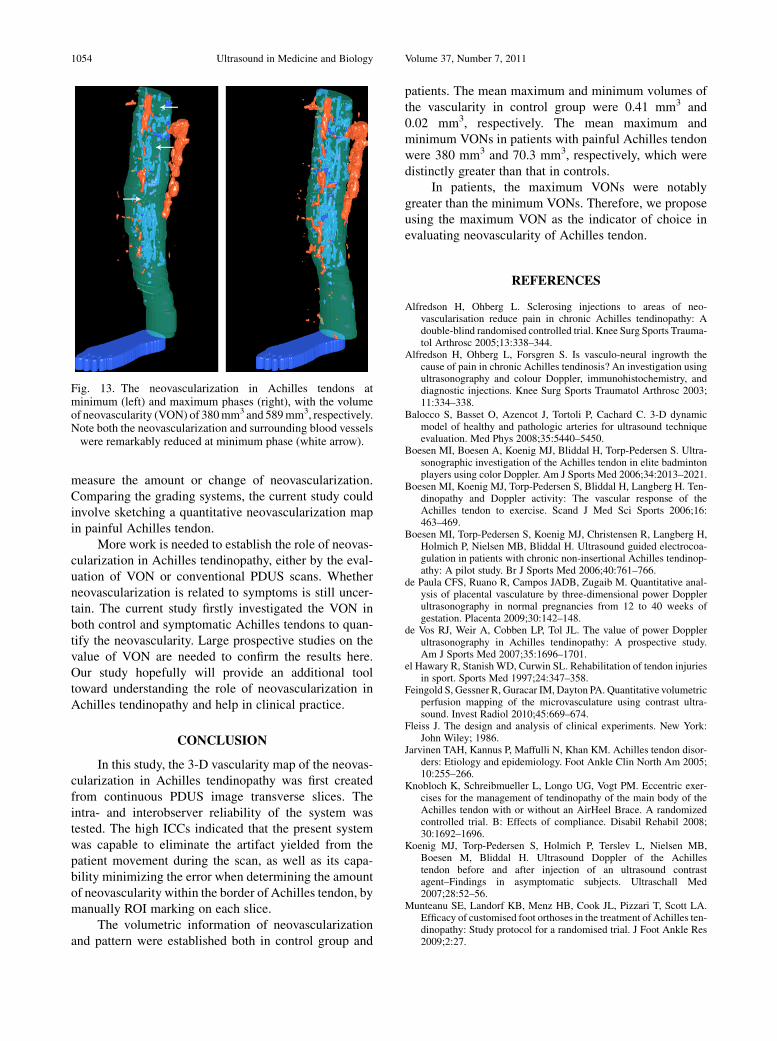
Fig. 13. The neovascularization in Achilles tendons atminimum (left) and maximum phases (right), with the volumeof neovascularity (VON) of 380mm3 and 589mm3, respectively.Note both the neovascularization and surrounding blood vesselswere remarkably reduced at minimum phase (white arrow).
1054 Ultrasound in Medicine and Biology Volume 37, Number 7, 2011
measure the amount or change of neovascularization.Comparing the grading systems, the current study couldinvolve sketching a quantitative neovascularization mapin painful Achilles tendon.
More work is needed to establish the role of neovas-cularization in Achilles tendinopathy, either by the eval-uation of VON or conventional PDUS scans. Whetherneovascularization is related to symptoms is still uncer-tain. The current study firstly investigated the VON inboth control and symptomatic Achilles tendons to quan-tify the neovascularity. Large prospective studies on thevalue of VON are needed to confirm the results here.Our study hopefully will provide an additional tooltoward understanding the role of neovascularization inAchilles tendinopathy and help in clinical practice.
CONCLUSION
In this study, the 3-D vascularity map of the neovas-cularization in Achilles tendinopathy was first createdfrom continuous PDUS image transverse slices. Theintra- and interobserver reliability of the system wastested. The high ICCs indicated that the present systemwas capable to eliminate the artifact yielded from thepatient movement during the scan, as well as its capa-bility minimizing the error when determining the amountof neovascularity within the border of Achilles tendon, bymanually ROI marking on each slice.
The volumetric information of neovascularizationand pattern were established both in control group and
patients. The mean maximum and minimum volumes ofthe vascularity in control group were 0.41 mm3 and0.02 mm3, respectively. The mean maximum andminimum VONs in patients with painful Achilles tendonwere 380 mm3 and 70.3 mm3, respectively, which weredistinctly greater than that in controls.
In patients, the maximum VONs were notablygreater than the minimum VONs. Therefore, we proposeusing the maximum VON as the indicator of choice inevaluating neovascularity of Achilles tendon.
REFERENCES
Alfredson H, Ohberg L. Sclerosing injections to areas of neo-vascularisation reduce pain in chronic Achilles tendinopathy: Adouble-blind randomised controlled trial. Knee Surg Sports Trauma-tol Arthrosc 2005;13:338–344.
Alfredson H, Ohberg L, Forsgren S. Is vasculo-neural ingrowth thecause of pain in chronic Achilles tendinosis? An investigation usingultrasonography and colour Doppler, immunohistochemistry, anddiagnostic injections. Knee Surg Sports Traumatol Arthrosc 2003;11:334–338.
Balocco S, Basset O, Azencot J, Tortoli P, Cachard C. 3-D dynamicmodel of healthy and pathologic arteries for ultrasound techniqueevaluation. Med Phys 2008;35:5440–5450.
Boesen MI, Boesen A, Koenig MJ, Bliddal H, Torp-Pedersen S. Ultra-sonographic investigation of the Achilles tendon in elite badmintonplayers using color Doppler. Am J Sports Med 2006;34:2013–2021.
Boesen MI, Koenig MJ, Torp-Pedersen S, Bliddal H, Langberg H. Ten-dinopathy and Doppler activity: The vascular response of theAchilles tendon to exercise. Scand J Med Sci Sports 2006;16:463–469.
Boesen MI, Torp-Pedersen S, Koenig MJ, Christensen R, Langberg H,Holmich P, Nielsen MB, Bliddal H. Ultrasound guided electrocoa-gulation in patients with chronic non-insertional Achilles tendinop-athy: A pilot study. Br J Sports Med 2006;40:761–766.
de Paula CFS, Ruano R, Campos JADB, Zugaib M. Quantitative anal-ysis of placental vasculature by three-dimensional power Dopplerultrasonography in normal pregnancies from 12 to 40 weeks ofgestation. Placenta 2009;30:142–148.
de Vos RJ, Weir A, Cobben LP, Tol JL. The value of power Dopplerultrasonography in Achilles tendinopathy: A prospective study.Am J Sports Med 2007;35:1696–1701.
el Hawary R, Stanish WD, Curwin SL. Rehabilitation of tendon injuriesin sport. Sports Med 1997;24:347–358.
Feingold S, Gessner R, Guracar IM, Dayton PA. Quantitative volumetricperfusion mapping of the microvasculature using contrast ultra-sound. Invest Radiol 2010;45:669–674.
Fleiss J. The design and analysis of clinical experiments. New York:John Wiley; 1986.
Jarvinen TAH, Kannus P, Maffulli N, Khan KM. Achilles tendon disor-ders: Etiology and epidemiology. Foot Ankle Clin North Am 2005;10:255–266.
Knobloch K, Schreibmueller L, Longo UG, Vogt PM. Eccentric exer-cises for the management of tendinopathy of the main body of theAchilles tendon with or without an AirHeel Brace. A randomizedcontrolled trial. B: Effects of compliance. Disabil Rehabil 2008;30:1692–1696.
Koenig MJ, Torp-Pedersen S, Holmich P, Terslev L, Nielsen MB,Boesen M, Bliddal H. Ultrasound Doppler of the Achillestendon before and after injection of an ultrasound contrastagent–Findings in asymptomatic subjects. Ultraschall Med2007;28:52–56.
Munteanu SE, Landorf KB, Menz HB, Cook JL, Pizzari T, Scott LA.Efficacy of customised foot orthoses in the treatment of Achilles ten-dinopathy: Study protocol for a randomised trial. J Foot Ankle Res2009;2:27.
Quantification of Achilles tendon neovascularity d X. YANG et al. 1055
Nelson TR, Pretorius DH, Hull A, RiccabonaM, SklanskyMS, James G.Sources and impact of artifacts on clinical three-dimensional ultra-sound imaging. Ultrasound Obstet Gynecol 2000;16:374–383.
Ohberg L, Alfredson H. Ultrasound guided sclerosis of neovessels inpainful chronic Achilles tendinosis: Pilot study of a new treatment.Br J Sports Med 2002;36:173–175, discussion 76–77.
Ohberg L, Alfredson H. Effects on neovascularisation behind the goodresults with eccentric training in chronic mid-portion Achilles tendi-nosis? Knee Surg Sports Traumatol Arthrosc 2004;12:465–470.
Ohberg L LR, Alfredson H. Neovascularisation in Achilles tendon withpainful tendinosis but not in normal tendons: An ultrasonographicinvestigation. Knee Surg Sports Traumatol Arthrosc 2001;9:233–238.
Peers KH, Brys PP, Lysens RJ. Correlation between power Dopplerultrasonography and clinical severity in Achilles tendinopathy. IntOrthop 2003;27:180–183.
Reiter M, Ulreich N, Dirisamer A, Tscholakoff D, Bucek RA. Colourand power Doppler sonography in symptomatic Achilles tendondisease. Int J Sports Med 2004;25:301–305.
Robinson JM, Cook JL, Purdam C, Visentini PJ, Ross J, Maffulli N,Taunton JE, Khan KM. Victorian Institute Of Sport Tendon Study G,The VISA-A questionnaire: A valid and reliable index of the clinicalseverity of Achilles tendinopathy. Br J Sports Med 2001;35:335–341.
Rubin JM, Bude RO, Carson PL, Bree RL, Adler RS. Power DopplerUS: A potentially useful alternative to mean frequency-based colorDoppler US. Radiology 1994;190:853–856.
Schweitzer ME, Karasick D. MR imaging of disorders of the Achillestendon. AJR Am J Roentgenol 2000;175:613–625.
Shrout PE, Fleiss JL. Intraclass correlations: Uses in assessing rater reli-ability. Psychol Bull 1979;86:420–428.
van Snellenberg W, Wiley JP, Brunet G. Achilles tendon pain intensityand level of neovascularization in athletes as determined by colorDoppler ultrasound. Scand J Med Sci Sports 2007;17:530–534.
Vora AM, Myerson MS, Oliva F, Maffulli N. Tendinopathy of the mainbody of the Achilles tendon. Foot Ankle Clin North Am 2005;10:293–308.
Welsh AW, Humphries K, Cosgrove DO, Taylor MJO, Fisk NM.Development of three-dimensional power Doppler ultrasoundimaging of fetoplacental vasculature. Ultrasound Med Biol 2001;27:1161–1170.
YangX, PughND, ColemanDP, Nokes LD. AreDoppler studies a usefulmethod of assessing neovascularization in humanAchilles tendinop-athy? A systematic review and suggestions for optimizing machinesettings. J Med Eng Technol 2010;35:365–372.
Yuan A, Chang DB, Yu CJ, Kuo SH, Luh KT, Yang PC. Color Dopplersonography of benign and malignant pulmonary masses. AJR AmJ Roentgenol 1994;163:545–549.
Zanetti M, Metzdorf A, Kundert HP, Zollinger H, Vienne P, Seifert B,Hodler J. Achilles tendons: Clinical relevance of neovasculari-zation diagnosed with power Doppler US. Radiology 2003;227:556–560.