a note on sources of co2supply for enhanced oil recovery
TRANSCRIPT

A Note on Sources of CO2Supply for
Enhanced Oil Recovery Operations
Phil DiPietro and Peter Balash, National Energy
Technology Laboratory
412.386.5853
December 2011
Summary
This paper presents compiled information on sources of carbon dioxide (CO2) for enhanced oil recovery
(EOR) operations in the lower 48 states.CO2supply in 2010 was 60 MMmtCO2. Production from natural
sources accounted for 84% of the 2010 CO2 supply, and reserve estimates are large enough to support
level or growing CO2 production rates for several decades. Natural gas processing accounted for 14% of
2010 supply and is dominated by two large facilities, Labarge in Wyoming and Century in Texas. Ten
hydrocarbon conversion facilities with CO2 capture are newly deployed, under construction, or in final
design and are expected to be online by 2015. They will provide an additional 25.5 MMmtCO2/yr of
supply.
Background
In 2010 CO2 EOR provided 280,000 barrels per day of crude oil or 5% of domestic supply (Moritis 2010;
EIA 2012). Sources of CO2 are organized into three categories.
1. Natural sources – naturally‐occurring underground accumulations where the produced gas is
primarily CO2(90% or higher).
2. Natural gas processing – naturally‐occurring underground accumulations where the produced
gas contains significant amounts of methane.
3. Hydrocarbon conversion – industrial processes in which a hydrocarbon feedstock (coal, crude
oil) is converted into a higher value product or slate of products and exhaust CO2 is captured.
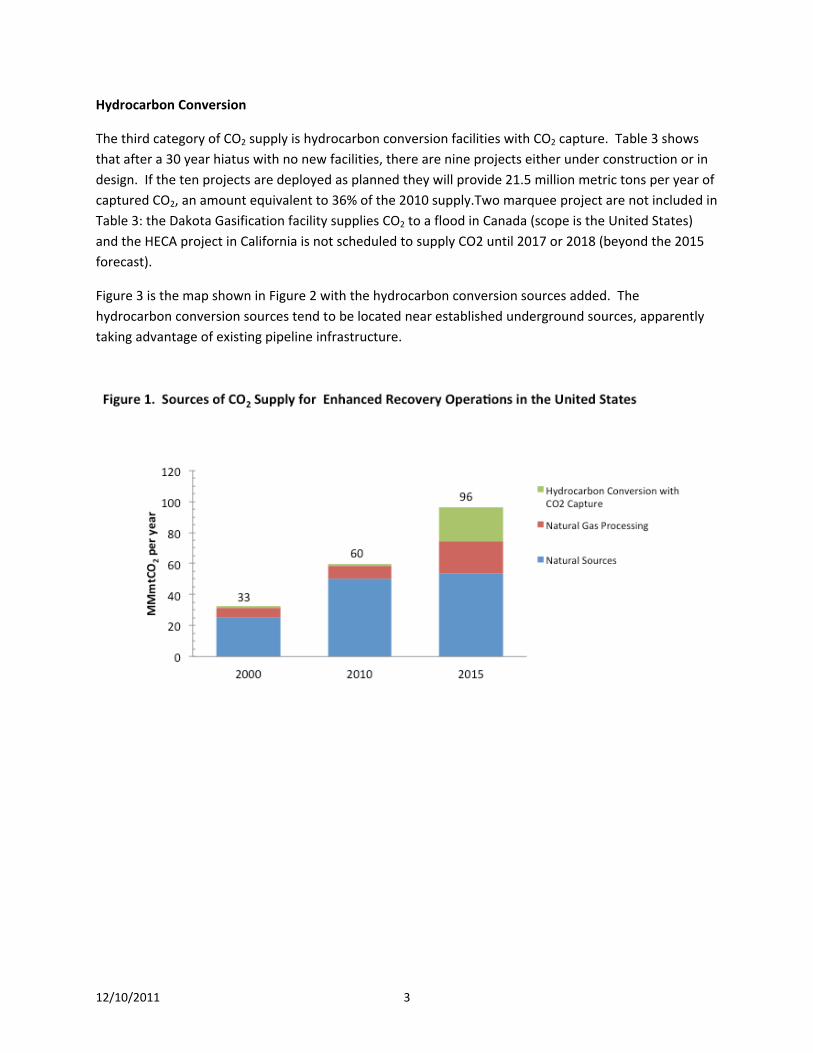
Figure 1 shows the supply from the three source types in 2000 and 2010. Figure 1 also presents a
projection for supply in 2015 based on known projects. Total CO2 supply nearly doubled between 2000
and 2010; most of the increase came from natural sources. CO2 supply will likely increase by another
70% over the next few years based on the Century and Riley Ridge natural gas processing plants and ten
12/10/2011 1

hydrocarbon conversion projects with CO2 capture that are newly deployed, under construction, or in
final design.
Natural Sources
Table 1 presents summary data on nine major CO2‐bearing source fields in the lower 48 states. It is an
update and expansion of an earlier, similar compilation of natural CO2 sources (Stevens et. al., 2001).
Four of the reservoirs are established and are supplying CO2 to EOR floods, and five are in the initial,
exploratory stages.
The production rate from Sheep Mountain and Bravo in 2010 islessthan it was in 2000, but production
from the other sources is steady or increasing. The rate of production from Jackson Dome increased
twenty fold between 2000 and 2010 and is now approaching McElmo.
The future level of supply from natural sources of CO2 is difficult to predict. The sum of the reserve
estimates for the nine reservoirs is 2.1 billion metric tons, equivalent to 39 years of supply at the current
rate of production. However, a third of the reserve estimates are from the five fields that are in the
initial stages of development. And four of the developmental fields, Kevin, St. John’s, Escalante, and
Gordon Creek will require pipeline infrastructure to access EOR targets. Two formations, Bravo and St.
John’s, are shallow and will tend to have lower well head pressure and higher plant gate production cost
than other natural sources. Counterbalancing these factors is the possibility of new discoveries or
upwardly revised reserve estimates at known reservoirs.
Natural Gas Processing
Table 2 shows sources of CO2 from natural gas processing and sets forth a forecast for CO2 production
rate in 2015. Production from natural gas processing in 2010 was 8.2 MMmtCO2 or 14% of total CO2
supply. The expanded capture facilityat Labarge supplied approximately 5.8 MMmtCO2 in 2010 and
draws from an enormous reserve of 2.9 Bmt CO2. Sandridge Energy and Occidenal Petroleum recently
deployed the Century Plant in Pecos County Texas (Occidental Petroleum 2011). When both trains at
the Century Plant are operational, it will provide 8.7 MMmt per year of captured CO2. Denbury
Resources is building a natural gas processing plant at Riley Ridge, just north of Labarge in Wyoming.
The Riley Ridge facility will add 2.5 MMmt CO2/yr of supply beginning in 2012 and may provide up to 12
MMmt CO2/yr when fully deployed. Thethree facilities, LaBarge, Century, and Riley Ridge, account for
88% of the CO2 supply estimate for 2015 from this category of sources. All three facilities process a gas
stream that contains roughly 65% CO2.
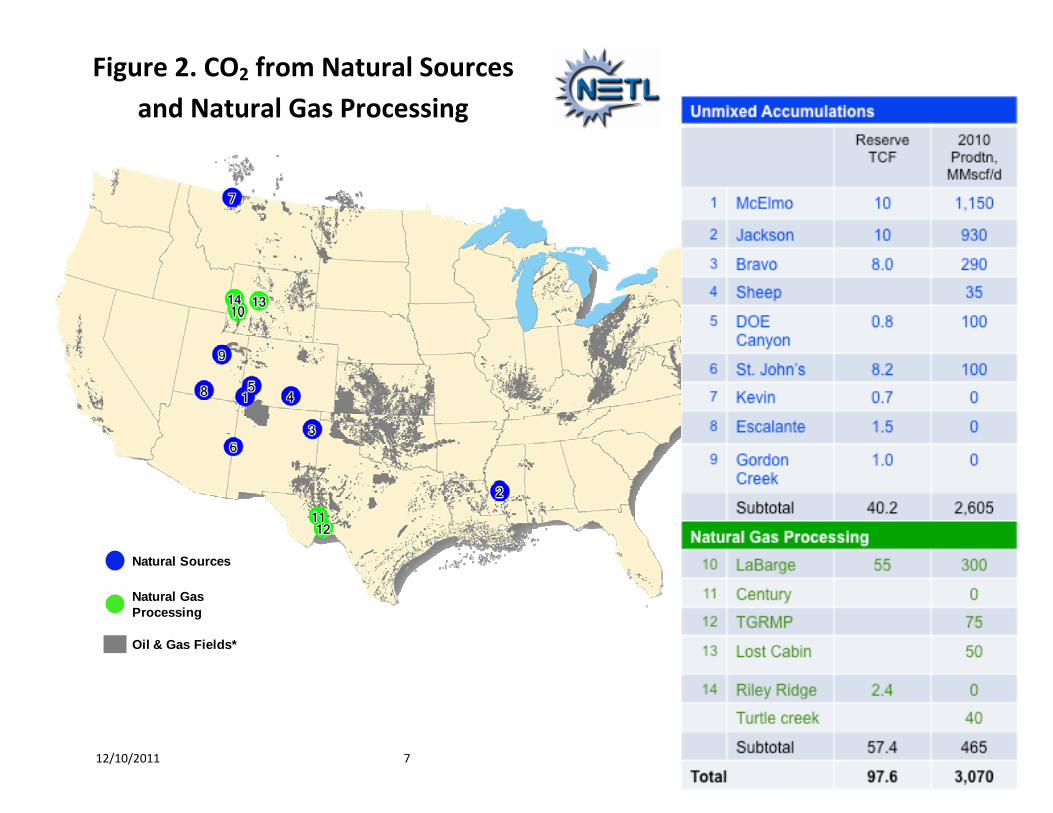
Figure 2 is a map of the CO2 sources contained in Tables 1 and 2. Two sources of recent growth in CO2
supply, the Jackson Dome (#2) and the Century natural gas processing plant (#10) are in ideal locations
relative to oil‐bearing formations. Doe Canyon (#5), St John’s (#6), and Escalante (#8) are in the same
general region as Sheep Mountain and Bravo and could plausibly make up for decline in production
rates from those two fields. The LaBarge expansion and the Riley Ridge deployment indicate growth in
CO2 EOR production from the Rocky Mountain region.
12/10/2011 2
Hydrocarbon Conversion
The third category of CO2 supply is hydrocarbon conversion facilities with CO2 capture. Table 3 shows
that after a 30 year hiatus with no new facilities, there are nine projects either under construction or in
design. If the ten projects are deployed as planned they will provide 21.5 million metric tons per year of
captured CO2, an amount equivalent to 36% of the 2010 supply.Two marquee project are not included in
Table 3: the Dakota Gasification facility supplies CO2 to a flood in Canada (scope is the United States)
and the HECA project in California is not scheduled to supply CO2 until 2017 or 2018 (beyond the 2015
forecast).
Figure 3 is the map shown in Figure 2 with the hydrocarbon conversion sources added. The
hydrocarbon conversion sources tend to be located near established underground sources, apparently
taking advantage of existing pipeline infrastructure.
12/10/2011 3
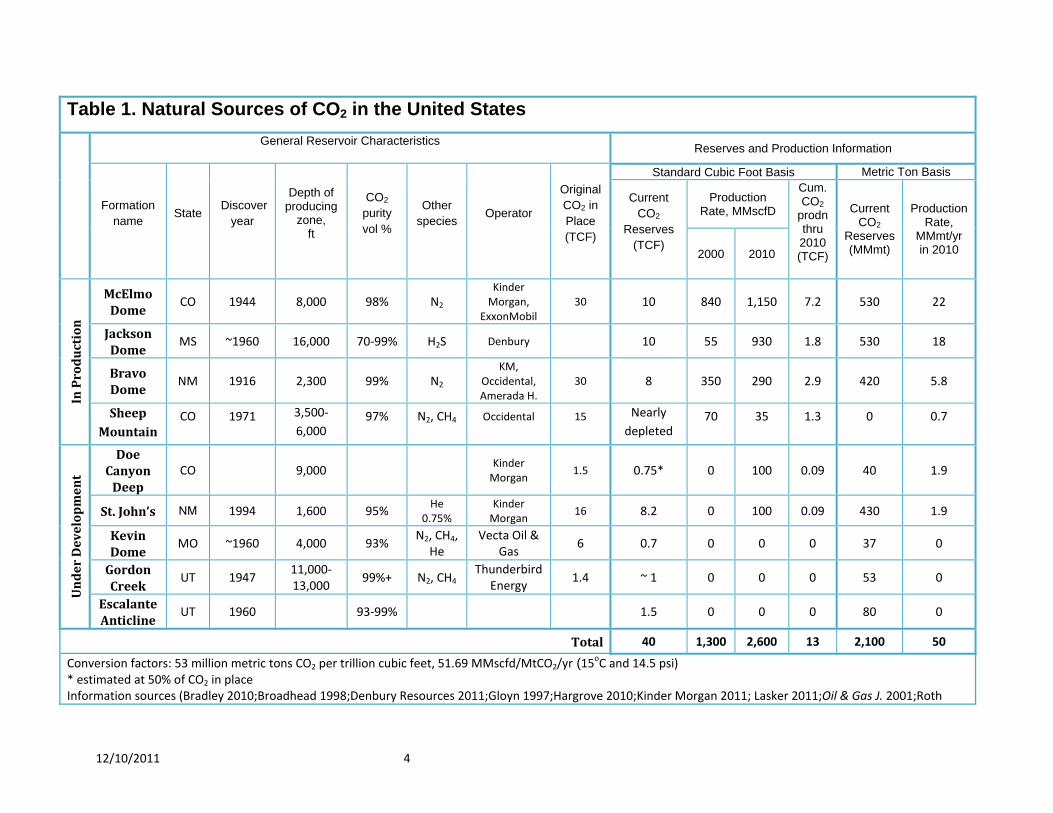
Table 1. Natural Sources of CO2 in the United States General Reservoir Characteristics
Reserves and Production Information
Standard Cubic Foot Basis Metric Ton Basis
Production Rate, MMscfD
Formation name
State Discover
year
Depth of producing
zone, ft
CO2 purity vol %
Other species
Operator
Original CO2 in Place (TCF)
Current CO2
Reserves (TCF)
2000 2010
Cum. CO2
prodn thru 2010 (TCF)
Current CO2
Reserves (MMmt)
Production Rate,
MMmt/yr in 2010
McElmo Dome
CO 1944 8,000 98% N2 Kinder Morgan,
ExxonMobil 30 10 840 1,150 7.2 530 22
Jackson Dome
MS ~1960 16,000 70‐99% H2S Denbury 10 55 930 1.8 530 18
Bravo Dome
NM 1916 2,300 99% N2 KM,
Occidental, Amerada H.
30 8 350 290 2.9 420 5.8
In Production
Sheep
Mountain CO 1971 3,500‐
6,000 97% N2, CH4 Occidental 15 Nearly
depleted 70 35 1.3 0 0.7
Doe Canyon Deep
CO 9,000Kinder Morgan
1.5 0.75* 0 100 0.09 40 1.9
St. John’s NM 1994 1,600 95% He
0.75% Kinder Morgan
16 8.2 0 100 0.09 430 1.9
Kevin Dome
MO ~1960 4,000 93% N2, CH4,
He Vecta Oil &
Gas 6 0.7 0 0 0 37 0
Gordon Creek
UT 1947 11,000‐13,000
99%+ N2, CH4 Thunderbird
Energy 1.4 ~ 1 0 0 0 53 0
Under Development
Escalante Anticline
UT 1960
93‐99% 1.5 0 0 0 80 0
Total 40 1,300 2,600 13 2,100 50
Conversion factors: 53 million metric tons CO2 per trillion cubic feet, 51.69 MMscfd/MtCO2/yr (15oC and 14.5 psi)
* estimated at 50% of CO2 in place Information sources (Bradley 2010;Broadhead 1998;Denbury Resources 2011;Gloyn 1997;Hargrove 2010;Kinder Morgan 2011; Lasker 2011;Oil & Gas J. 2001;Roth
12/10/2011 4

1983;Schwochow 1983;Thunderbird Energy 2011, Vecta Energy Corporation 2011;and Zimmerman 1979
Table 2. Natural Gas Processing Facilities with CO2 Capture General Facility Information CO2 Production Rates
Standard Cubic Feet Basis Metric Ton Basis
Production Rate (MMscf/d) Facility name
(owner) Owner
Capture
Location
Year
online
CO2
conc. in
source
gas
CO2
reserve
estimate,
TCF 2000 2010 2015
CO2 reserve estimate, MMmtCO2
Production rate in 2015, MtCO2/yr
LaBarge Exxon Mobil
WY 1963 65% 55 233 300* 360 2,900 7.0
Century Plant
Oxy/ Sandridge
Pecos County, TX
2011 65% 0 0 450 8.7
Terrell, Grey Ranch,
Mitchell, and Puckett
Sandridge Energy
Inc.
Terrell and Pecos
Counties, TX 1998 75 75 75 1.5
Turtle Creek Ostego, MI 40 40 0.4
Lost Cabin Conoco Phillips
Fremont County, WY
50 50 1.0
Riley Ridge Denbury WY 2012 65% 2.4 0 0 130** 130 2.5
Total 57.4 308 465 1,105 3,030 21
Conversion factors: 53 million metric tons CO2 per trillion cubic feet, 51.69 MMscfd/MtCO2/yr (15oC and 14.5 psi)
*Expansion implemented during 2010, full capture capacity not realized **Full project plans for the Riley Ridge facility are for 580‐630 MMscf/d of CO2 production, not predicted to be completed by 2015.
12/10/2011 5

Information Sources (Blue Source 2011; Campbell 1978, Collings 2008; Denbury 2011, Dooley 2009; Melzer 2009; Moritis 2009; Occidental Petroleum 2011; Parker 2009; Sandridge E&P 2008)
12/10/2011 6
12/10/2011 7
Natural Sources
Natural Gas Processing
Figure 2. CO2 from Natural Sources
and Natural Gas Processing
Oil & Gas Fields*

Table 3. Hydrocarbon Conversion Facilities with CO2 Capture
Facility Characteristics CO2 Capture Rates
Standard Cubic Feet (MMscf/d)
Metric Tons (MMmtCO2/yr)
Primary
Product Owner Capture Location
DOE cost
share*
Year
online 2000 2010 2015 2015
Fertilizer Agrium, Inc. Borger, TX No 1980 26 26 26 0.5
Fertilizer Koch Nitrogen Enid, Oklahoma No 1982 35 35 35 0.68
Ethanol Bonanza Energy Garden City, KS No 2011 8 0.15
Fertilizer CVR Energy Coffeyville, KS No 2013 40 0.8
Hydrogen Air Products* Port Arthur, TX Yes 2013 52 1.0
Power Mississippi Power*
Kemper County, MS Yes 2014 141 2.7
Power /Urea
Summit Texas Clean Energy*
Ector County, TX Yes 2014 123 2.4**
Ammonia Green Rock Energy, L.L.C.
Donaldsville, LA (Faustina)
No 2014 208 4.0
Methanol Leucadia Energy* Lake Charles, LA Yes 2015 208 4.0
Power NRG* Thompson, TX Yes 2015 72 1.4
Liquid fuel DKRW Advanced
Fuels LLC Medicine Bow, WY No 2015 200 3.9
Total 61 61 1,112 21.5
Conversion factor: 51.69 MMscfd/MtCO2/yr (15oC and 14.5 psi)
* Projects receiving cost share financial assistance from the U.S .DOE ** Some portion of the captured CO2 is utilized to manufacture urea. Shown is the amount supplied to EOR. The power and urea project in Kern County, California is not included as the projected start up data, 2017/18 is beyond the 2015 forecast. The project is owned by SCS Energy / HECA and is designed to supply 2‐3 MMmtCO2/yr or CO2 EOR at the Elk Hills field.
Information Sources: (Ahmed 2010; Chaparral Energy, 2011; Global CCS Institute 2011; Mississippi Power 2011; NETL 2010a; NETL 2010b;
Oil & Gas J. 2008; RTT News 2011;
12/10/2011 8

12/10/2011 9
Figure 3. Sources of CO2 for Domestic EOR Floods
Natural Sources
Natural Gas Processing
Hydrocarbon Conversion
Oil & Gas Fields*
15. Koch Nitrogen
16. Agrium, Inc.
*17. Green Rock Energy
*18. Bonanza Energy
*19. ZEEP/Eastman
*20. CVR Energy
*21. Air Products
*22. Leucadia Energy
*23. Mississippi Power
*24. DKRW
*25. Summit Texas
*26. NRG
*27. HECA
1. McElmo
2. Jackson
3. Bravo
4. Sheep
5. Doe Canyon
6. St. John’s
*7. Kevin
*8. Escalante
9. Gordon Creek
10. LaBarge
*11. Century
12. TGRMP
13. Lost Cabin
14. Riley Ridge

Ahmad, S. 2010. Ethanol Plant to Sequester CO2 Emissions. The Garden City Telegram (13 March 2010)
Allis, R.,Chidsey T., Gwynn, W., Morgan, C., White, S., Adams, M., Moore, J., 2001. Natural CO2 Reservoirs on the Colorado Plateau and Southern Rocky Mountains: Candidates for CO2 Sequestration. Proc.First National Conference on Carbon Sequestration
Annual Energy Outlook 2011. 2011. Energy Information Administration, Table A11
Blue Source. 2011. http://www.ghgworks.com/4c‐valverde.html
Bradley, T. 2010. CO2. Oral presentation given at the KMP analyst conference, January 2010
Broadhead, R. 1998. Natural Accumulations of Carbon Dioxide in the New Mexico Region. Lite Geology, #20: 2‐7
Campbell, J.A. 1978. Carbon Dioxide Resources of Utah, Report of investigation No. 125, Utah Geological and Mineral Survey, Table 2
Chaparral Energy. 2011. http://www.chaparralenergy.com/index.php?page=chaparral‐energy‐agrees‐to‐a‐co2‐purchase‐and‐sale‐agreement‐with‐cvr‐energy‐for‐capture‐of‐co2‐for‐enhanced‐oil‐recovery
Collings, R.C. 2008. Verification of Blue Source’s Greenhouse Gas Emission Reductions for PetroSource’s Terrell, Mitchell and Grey Ranch Compressor Station Geologic Carbon Sequestration Project. Ruby Canyon Engineering, Grand Junction, Colorado (February 2008)
Denbury Resources. 2011. http://www.denbury.com/index.php?id=16
Dooley, J.J., Davidson, C.L., and Dahowski, R.T. 2009. An Assessment of the Commercial Availability of Carbon Dioxide Capture and Storage Technologies as of June 2009. Contract DE‐AC05‐76RL01830, US DOE, Washington DC (June 2009) page 12
Future of EOR & IOR: New companies, infrastructure, projects reshape landscape for CO2 EOR in USOil and Gas J. (14 May 2001)
Global CCS Institute. 2011. Resources and Projects, http://www.globalccsinstitute.com/resources/projects/enid‐fertilizer‐plant
Gloyn, R.W. and Allison, M.L. 1997. A Preliminary Assessment of Energy and Mineral Resources within the Grand Staircase ‐ Escalante National Monument.Utah Geological Survey, Circular 93
Hargrove, B., Melzer, and S.L., Whitman, L. 2010. A Status Report on North American CO2 EOR Production and CO2 Supply, presented at the 16
th Annual CO2 Flooding Conference, Midland, TX, 9‐10 December
Kinder Morgan Energy Partners. 2011. http://www.kindermorgan.com/business/co2/supply.cfm
Lasker, B. 2011. Enhanced Oil Resources Inc. Investor Presentation. Oral presentation given at the IPAA OGIC conference, Hollywood Florida, 3 February 2011
Lemons, G., 2010. Lost Cabin Gas Plant Can Continue Venting CO2. KDLY/KOVE Freemont Broadcasting(June 9, 2010)
McEwan, M. 2008. SandRidge, Oxy Team Up to Build CO2 Extraction Plant. Midland Reporter‐Telegram July 13, 2008
Melzer, S. L. 2009. A One‐day Seminar on CO2 Injection Methods and Operations: EOR and its Relevance to CO2 Sequestration. Lecture, Pittsburgh, Pennsylvania, USA (April 2, 2009)
12/10/2011 10
12/10/2011 11
Mississippi Power. 2011. Denbury Enters Into Two Industrial CO2 Purchase Contracts, http://www.mississippipower.com/kemper/news_denbury.asp
Moritis, G. 2009. Special Report: More CO2‐EOR projects likely as new CO2 supply sources become available Oil & Gas J., Dec 7, 2009.
Moritis, G. 2010. “Special Report: EOR/Heavy Oil Survey: CO2 miscible, steam dominate enhanced oil recovery process,” Oil&Gas J., April 19, 2010
National Energy Technology Laboratory. 2010a. DOE/NETL Carbon Dioxide Capture and Storage RD&D Roadmap,http://www.netl.doe.gov/technologies/carbon_seq/refshelf/CCSRoadmap.pdf, pages 14‐15
National Energy Technology Laboratory. 2010b. Project Fact Sheet, http://www.netl.doe.gov/publications/factsheets/project/FE0003311.pdf
Occidental Petroleum Corporation. 2011. http://www.oxy.com/OurBusinesses/OilAndGas/Technology/FieldDev/Pages/FacilitiesConstruction.aspx
Parker, M. E., Northrop, S., Valencia, J.A., Foglesong, R.E., and Duncan, W.T. 2009. CO2 Management at ExxonMobil’s Labarge Field, Wyoming, USA Proc.International Petroleum Technology Conference 13258
Roth, G. 1983. Sheep Mountain and Dike Mountain Fields, Huerfano County, Colorao; Source of CO2 for Enhanced Oil Recovery. Oil and Gas Fields of the Four Corners Areavolume III 740‐744
Gas Treating and CO2 Delivery Agreement by and between Sandridge Exploration and Production and Oxy USA. 2008 Securities and Exchange Commission, EDGAR filing with the Securities and Exchange Commission, August 7, 2008
Schwochow S.D., 1983. USGS Mineral Resources Data System, McElmo Creek Area, deposit # 10014208, USGS
Stevens, S.H., Perce, J.M., Rigg, A. A. J., 2001. Natural Analogs for Geologic Storage of CO2: An Integrated Research Program. Proc. First National Conference on Carbon Sequestration
Special Report: More US EOR projects start but EOR production continues decline. Oil & Gas J. (21 April 2008)
Vecta Energy Corporation. 2011. http://www.vectaenergy.ca/index.htm
Zero Emission Energy To Buy Eastman TX Energy Project In BeaumontRTT News (21 January 2011)
Zimmerman, F.W. 1979. Naturally Occurring Carbon Dioxide Sources in the United States – A Geologic Appraisal and Economic Sensitivity Study of Drilling and Producing Carbon Dioxide for Use in Enhanced Oil Recovery. Final Report, Contract No. EX‐76‐C‐01‐2025 US DOE, Washington DC (January 1979).