a new take on protecting cyclists in smart cities
TRANSCRIPT

3992 IEEE TRANSACTIONS ON INTELLIGENT TRANSPORTATION SYSTEMS, VOL. 19, NO. 12, DECEMBER 2018
A New Take on Protecting Cyclists in Smart CitiesAdam Herrmann , Mingming Liu , Francesco Pilla, and Robert Shorten
Abstract— Pollution in urban centers is becoming a majorsocietal problem. While pollution is a concern for all urbandwellers, cyclists are one of the most exposed groups due totheir proximity to vehicle tailpipes. Consequently, new solutionsare required to help protect citizens, especially cyclists, fromthe harmful effects of exhaust-gas emissions. In this context,hybrid vehicles (HVs) offer new actuation possibilities that can beexploited in this direction. More specifically, such vehicles, whenworking together as a group, have the ability to dynamicallylower the emissions in a given area, thus benefiting citizens,whilst still giving the vehicle owner the flexibility of usingan internal combustion engine. This paper aims to developan algorithm that can be deployed in such vehicles, wherebygeofences (virtual geographic boundaries) are used to specifyareas of low pollution around cyclists. The emissions level insidethe geofence is controlled via a coin-tossing algorithm to switchthe HV motor into, and out of, electric mode, in a manner thatis in some sense optimal. The optimality criterion is based onhow polluting vehicles inside the geofence are, and the expecteddensity of cyclists near each vehicle. The algorithm is triggeredonce a vehicle detects a cyclist. Implementations are presentedboth in simulation and in a real vehicle, and the system is testedusing a hardware-in-the-loop platform (video provided).
Index Terms— Emissions regulation, hybrid vehicles, cyclingsafety, smart cities.
I. INTRODUCTION
TRANSPORTATION in Ireland and Europe is currently ina state of flux. The last 10 years have seen significant
changes in transportation policies, reflecting a move awayfrom emission generating vehicles to more “greener” formsof transportation. These include schemes such as: Cycle-to-Work1; low-cost bike rental schemes2; encouragement of
Manuscript received April 19, 2017; revised July 30, 2017 andOctober 25, 2017; accepted January 4, 2018. Date of publication February 16,2018; date of current version November 27, 2018. This work was supportedin part by the Science Foundation Ireland under Grant 11/PI/1177, in partby the Improving Smart Control of Air Pollution in Europe Project underthe European Community’s H2020 Programme (H2020-SC5-04-2015) underAgreement 689954, in part by the Science Foundation Ireland under Grant13/RC/2094, and in part by the European Regional Development Fund throughthe Southern and Eastern Regional Operational Programme to Lero–The IrishSoftware Research Centre. The Associate Editor for this paper was Q. Zhang.(Corresponding author: Adam Herrmann.)
A. Herrmann and M. Liu are with the School of Electrical, Electronic andCommunications Engineering, University College Dublin, 4 Dublin, Ireland(e-mail: [email protected]; [email protected]).
F. Pilla is with the Department of Planning and Environmental Policy,University College Dublin, 4 Dublin, Ireland (e-mail: [email protected]).
R. Shorten is with the School of Electrical, Electronic and CommunicationsEngineering, University College Dublin, 4 Dublin, Ireland, also with IrishResearch Centres Lero, Limerick, Ireland, and also with I-FORM, 2 Dublin,Ireland (e-mail: [email protected]).
Color versions of one or more of the figures in this paper are availableonline at http://ieeexplore.ieee.org.
Digital Object Identifier 10.1109/TITS.2018.27942981http://www.citizensinformation.ie2http://www.dublinbikes.ie
hybrid/electric vehicle (HV/EV) ownership through the roll-out of public charging points3; and tax incentives.4 Cyclingschemes, in particular, have contributed to the recent increasein Ireland in the popularity of cycling as a means of dailytransportation (43% increase between 2011 and 2016). Suchtrends are also to be found, not only in Europe, but across thedeveloped world.
With regards to the health & safety of this increasing cyclingpopulation, much focus is naturally placed on the issue ofvehicle-cyclist collisions. However, there exists another dangerthat is often overlooked, and to which cyclists are particularlyexposed; namely, the harmful effects of tailpipe emissionsfrom Internal Combustion Engines (ICEs). Many studies existthat document these dangers. According to [1], in high trafficsituations, cyclists are most vulnerable as they are oftencycling very close to the exhausts of vehicles who they aresharing the road with. This is made worse by cyclists havinga respiratory rate of 2-5 times higher than pedentrians [2], [3].This increased exposure to pollutants contributes to adversehealth effects in cyclists populations [4], [5]. Pollution in ourcities has become such an issue that in December 2016 twomajor European cities, Paris and Athens, have pledged to banthe use of all diesel-powered cars and trucks in their citiesby 2025.5 Car manufacturers, such as Volvo and Volkswagen,have also recognised this problem and have committed tointroduce new hybrid and electric vehicles by 2019 and2020 respectively.6,7 However, to date, few, if any of thesemeasures are directed at solely cyclists. Our objective in thispaper is to address this by proposing simple strategies that canbe of immediate benefit to cyclists.
Roughly speaking, traffic emissions in our cities can beaddressed in 4 ways: 1) by building vehicles that don’t pollute;2) by informing people of dangerous pollution present in theirsurroundings so that they can make informed choices; 3) bypolicy interventions such as traffic restrictions (green zones,adaptive speed limits) in certain areas; and 4) by using smartdevices that adapt to their surroundings to protect humans,such as hybrid actuation in HVs. Our approach in this paperis to explore the latter. Due to increased incentives, HVsand EVs have been increasingly adopted by the market overthe last a few years. These vehicles have lower emissions
3https://www.esb.ie/our-businesses/ecars/charge-point-map4http://www.seai.ie/Grants5https://www.irishtimes.com/news/environment/four-world-capital-cities-to-
ban-diesel-vehicles-from-2025-1.28908646https://spectrum.ieee.org/cars-that-think/transportation/advanced-cars/will-
volvo-really-kill-the-gasoline-engine7https://www.bloomberg.com/news/articles/2015-09-14/vw-to-reinvent-
itself-as-a-maker-of-smartphones-on-wheels
1524-9050 © 2018 IEEE. Personal use is permitted, but republication/redistribution requires IEEE permission.See http://www.ieee.org/publications_standards/publications/rights/index.html for more information.

HERRMANN et al.: NEW TAKE ON PROTECTING CYCLISTS IN SMART CITIES 3993
(zero emissions in the case of EVs) compared to equivalentpure ICE propelled vehicles. Most HVs are also capable ofrunning on full electric mode without producing emissions,which introduces new “degrees of freedom in addressingpollution regulation” (see [6]) - especially when groups ofvehicles work in tandem. In particular, with these differentactuation possibilities, HVs can automatically adapt its drive-train propulsion system in a context-aware manner for thebenefit of others - especially cyclists [7]. Note that whileother strategies can be adopted to reduce emissions along aparticular route, for example by managing vehicle speed, or byre-routing vehicles, our approach is to use only the engineactuation mechanisms in hybrid vehicles to lower emissions.Our rationale for doing this is that the method: (i) is completelynon-invasive on the driver side; and (ii) does not affecttraffic patterns. Thus, it causes the least inconvenience to thedriver, especially when compared with informing the driverto lower their speed or to re-route; and avoids disturbancesto traffic patters due to re-routing of traffic or reduced flowrates. Note also that strategies to reduce emissions via speedadjustment, or by rerouting, is reported in our previous work;see [8] and the references therein.
In this paper, the actuation possibilities of HVs are usedto control the emissions in a virtual geographic boundary(geofence), whose coordinates are determined by the loca-tion of the vehicle that has detected a cyclist, using RadioFrequency IDentification (RFID) technology. The system pre-sented is one aspect of a larger body of our current workwhich aims to deal with multiple aspects of cycling safetyissues encompassing: 1) cyclist detection for a vehicle driveralerting system using RFID technology; 2) enhancing thesealerts with coarse localisation of the cyclist’s position relativeto the vehicle; 3) situational-aware pedal assisted e-bike toregulate the breathing rate of the cyclist in high pollutionareas [9]. The details of these systems will not be discussedas their implementations are outside the scope of this paper;however, several aspects are used to implement the solutionproposed. Further, we note that this paper is dealing solelywith pollution and the harmful effects caused to humans byhigh concentrations of pollutants in their environment. Thistopic is not related to greenhouse gas effects.
The remainder of this paper is organised as follows.Previous works are reviewed in Section II. Description of thesystem model and the suggested operation modes are given inSection III. Simulation set-up in Simulation of Urban MObil-ity (SUMO) and the details of Hardware-In-the-Loop (HIL)implementation are presented in Section IV. Simulation resultsare discussed in Section V. Finally, future work and ourconclusion are presented in Section VI and VII, respectively.
II. PREVIOUS WORK
Our RFID cyclist detection system builds on the workof [10] which introduced the design and successful imple-mentation of a system to detect and alert the driver of anearby cyclist using passive RFID tags on the cyclist andan RFID antenna located on the vehicle. This work enablesthe detection of the cyclist to trigger the pollution mitiga-tion system. Our work is also related to the wide body of
literature on engine management systems for hybrid electricvehicles. In [11] and [12], engine management systems (EMS)were developed to optimally control the energy usage ofa HV to minimise fuel consumption. In [13], a detailedoverview of both parallel and series HVs and their powermanagement strategies were presented. In [14], an EMS wasdeveloped to minimise air pollution caused by the HV bothdirectly and indirectly (whilst driving as well as vehicle/gridinteraction). Furthermore, in [6] [15] and [16] an emissiontrading framework was proposed whereby the problem ofsharing an emission budget between HVs is formulated as autility maximisation problem. The authors in [16] used thisframework to further implement a pollution mitigation systemin a real HV. This system works by using a GPS-enabledAndroid smartphone to automatically switch the HV into EVMode when inside fixed geofences around residential or schoolareas. In [7] an EMS was formulated which aims to lowerthe emission output of the vehicle in areas of high pedestriantraffic taking account of the uncertainty of routes the drivermay travel to. Our paper will extend the work of [16] byusing the RFID system to create the geofence dynamicallyand have it move with the cyclist rather than remain static.Our work will also use the ideas from [7] by incorporatingpopular cyclist routing data to lower emissions on roads inthe geofence which cyclists use often, thereby predicting theroute of the cyclist which has been detected in the geofence.
III. SYSTEM MODEL AND OPERATIONS
Our objective is to design a system to lower the pollutionin the area around cyclists to some level; in other words toattempt to create a bubble of clean air around a single or groupof cyclists. In particular, we shall discuss two modes of systemoperation; namely a single-vehicle mode, and a multi-vehiclemode, depending on the radius of the area around the cyclistthat is to be protected.
A. Basic Set-Up
The basic idea is very simple. This system uses the actuationabilities of HVs to dynamically switch the vehicle from a“polluting” mode to an emission free mode (i.e. full electricmode) when a cyclist is detected. This fully automated sys-tem requires no driver interaction as the transition betweenpolluting and electric modes are designed to be seamless.Specifically, a cyclist is detected by the RFID cyclist detectionsystem developed by [10]. The detection system uses a RFIDreader mounted on the rear of a real HV (Toyota Prius -Fig. 1). The reader can detect the presence of an RFID tagmounted on the cyclist’s helmet. A Java Server located in therear of the vehicle processes the information coming fromthe RFID readers and sends the relevant information to anAndroid application to inform the driver whether there is acyclist nearby and what status the system is in. Given this info,the Prius switches between electric and polluting modes auto-matically (without driver’s interaction) through a BluetoothActuator developed in [16]. We note that the cyclist detectionsystem could be replaced with image recognition using cam-eras or radar mounted on the vehicle, as discussed in [17].
3994 IEEE TRANSACTIONS ON INTELLIGENT TRANSPORTATION SYSTEMS, VOL. 19, NO. 12, DECEMBER 2018
Fig. 1. Toyota Prius with the RFID antennas mounted on the rear. A passiveRFID tag is mounted on the cyclist’s helmet.
Our preference for RFID is due to its passive nature (no bat-tery required) and low cost on the cyclist side, the reducedprivacy concerns when compared with cameras, and the lowcomputational cost of the technology on the vehicle side.
B. Single-Vehicle OperationThe single-vehicle operation mode is designed to simply
switch the HV to full electric mode when a cyclist is detectedby the vehicle, and for a period thereafter. This solution isdesigned to provide protection to a cyclist who is cyclingdirectly behind (or in proximity to) the vehicle by elimi-nating tailpipe emissions.8 While this system always reducesthe direct impact on the cyclist approaching to the vehicle,and protects the cyclist from emission spikes from tailpipes,it does not take into account many other factors that canaffect cyclists; for example, other polluting vehicles nearby;other sources of pollution; and the effects of route choicesthat a cyclist may make. For these reasons, we consider ageneralisation involving multiple vehicles in the followingsection.
C. Multi-Vehicle Operation (Geofences)In this section, we introduce a multi-vehicle operation mode
that can be deployed by vehicles inside the geofence to protectthe detected cyclist. The suggested system is operated as fol-lows. When a cyclist is detected, the vehicle which detects thecyclist will broadcast a signal to nearby vehicles (as specifiedby the geofence) to switch on the system. Vehicles receivingthe signal (vehicles inside the geofence) can proactively switchinto electric engine mode in a way that the aggregate emissionfrom the group inside the geofence are controlled at a givenlevel. Note that the total damage done to the cyclist (by thevehicles) is a function of his/her breathing rate, the averageaggregate emission level, and the exposure time. Switchingin and out of electric mode is done at regular intervals. Theswitching decision of each vehicle in the geofence is calculatedbased on the polluting level of the vehicle, and the likelihoodthe cyclist will encounter this vehicle as he/she travels. In thecurrent embodiment of the system, this likelihood is estimatedusing historical data. This is available from local authorities,fitness tracking apps, and other sources. We use data froma fitness application for the proof of concept in this paper.In what follows we make the following assumptions.
8A demo video for this test can be seen at https://youtu.be/8Qnoc5GD7kI
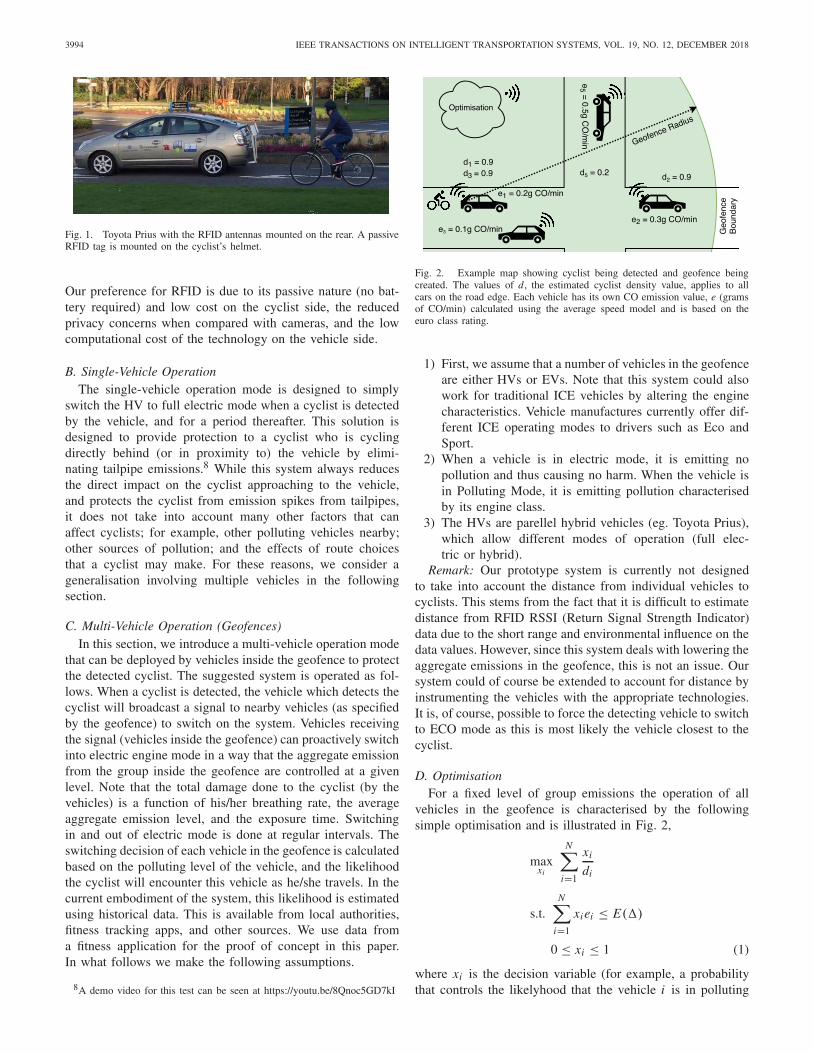
Fig. 2. Example map showing cyclist being detected and geofence beingcreated. The values of d, the estimated cyclist density value, applies to allcars on the road edge. Each vehicle has its own CO emission value, e (gramsof CO/min) calculated using the average speed model and is based on theeuro class rating.
1) First, we assume that a number of vehicles in the geofenceare either HVs or EVs. Note that this system could alsowork for traditional ICE vehicles by altering the enginecharacteristics. Vehicle manufactures currently offer dif-ferent ICE operating modes to drivers such as Eco andSport.
2) When a vehicle is in electric mode, it is emitting nopollution and thus causing no harm. When the vehicle isin Polluting Mode, it is emitting pollution characterisedby its engine class.
3) The HVs are parellel hybrid vehicles (eg. Toyota Prius),which allow different modes of operation (full elec-tric or hybrid).
Remark: Our prototype system is currently not designedto take into account the distance from individual vehicles tocyclists. This stems from the fact that it is difficult to estimatedistance from RFID RSSI (Return Signal Strength Indicator)data due to the short range and environmental influence on thedata values. However, since this system deals with lowering theaggregate emissions in the geofence, this is not an issue. Oursystem could of course be extended to account for distance byinstrumenting the vehicles with the appropriate technologies.It is, of course, possible to force the detecting vehicle to switchto ECO mode as this is most likely the vehicle closest to thecyclist.
D. OptimisationFor a fixed level of group emissions the operation of all
vehicles in the geofence is characterised by the followingsimple optimisation and is illustrated in Fig. 2,
maxxi
N∑
i=1
xi
di
s.t.N∑
i=1
xiei ≤ E(�)
0 ≤ xi ≤ 1 (1)
where xi is the decision variable (for example, a probabilitythat controls the likelyhood that the vehicle i is in polluting

HERRMANN et al.: NEW TAKE ON PROTECTING CYCLISTS IN SMART CITIES 3995
Fig. 3. Feedback strategy, background emissions and disturbance rejection.
mode at a given instant); di is the estimated cyclist densityvalue for the road segment where the i ’th vehicle is on; ei isthe estimated CO emission (gCO/min) of the i ’th vehicle;E(�) is an emission limit for the cars in the geofence(gCO/min) at the decision instant; � is a measure of thedifference between the measured pollution concentration anda safe level (see remark below); and N is the total number ofcars in the geofence. The optimisation step of the algorithmis repeated at an interval of τ seconds where E(�) may varyfrom one decision to the next (again see below). Note that inour embodiment of the system, xi ∈ [0, 1] can be chosen to beeither the fraction of time between decisions that a vehicle isin the polluting mode, or can be chosen to be a probability thatvehicle i remains in polluting mode for an interval of time.In our results section that follows, this latter interpretation isimplemented both for ease of execution and to be consistentwith our prior work [8]. It can be observed that the vehiclesthat are travelling on roads having lower di and ei are favoured(i.e. more likely to stay in the polluting mode).
Remark (Mode Switching): The interpretation of xi asprobabilities is sometimes preferable as it may achieve a mul-tiplexing effect and avoid pollution spikes inside the geofence.Here the idea is that every t seconds, each HV changes modeand switches into polluting mode with probability xi . Similarprobabilistic switching strategies are discussed in [6], [8],and [18].
Remark (Background Emissions)9: Before proceeding, it isworth noting that not all emissions are as a result of trans-portation effects. Background emissions are always presentand contribute to the measurable aggregate emissions. Theobjective of our strategy is to regulate the aggregate emissionsinside a geo-fence by managing the switching of a networkof hybrid vehicles into their polluting mode in an elasticmanner. One approach to do this is to embed our optimisationstrategy inside of a feedback loop as depicted in Fig. 3.Here, the feedback loop regulates the aggregate emissions bydetermining the rate limit E(�). This is done by compar-ing the measured aggregate with a fixed limit as specified,for example, by EC directive 2008/50/EC ,10,11 or a world
9The authors gratefully acknowledge the comments of the anonymousreviewer for pointing out ambiguities in the original manuscript.
10http://ec.europa.eu/environment/air/quality/standards.htm11http://eur-lex.europa.eu/legal-content/EN/TXT/?uri= celex%3A32008
L0050
health organisation (WHO) equivalent,12 as part of a feedbackstrategy. The role of the optimisation is then to manage theelastic component of the overall strategy; namely by adjustingthe overall local emissions of the group of hybrid vehicles.This approach is akin to treating the non-measurable part ofthe emission as a disturbance, and rejecting the disturbance byvarying E(�). A perhaps simpler alternative is to determineE(�) by referencing the allowable aggregate emissions to theurban background as defined as per EC Directive 2008/50/EC.The urban background pollution (CO, NOx, PM, etc) could beretrieved in real-time from official monitoring stations aroundthe city or using low cost sensing. In both cases, adjustingE(�) seems reasonable due to the emergence of low costpollution sensing13 in our cities [19]. It is also worth notingthat, typically, the background emissions will vary slowly,both spatially and temporally so that E(�) will not vary toomuch from one decision instant to the next. Notwithstandingthis comment, more dynamically varying background levelsof pollution can be incorporated into our framework bydecreasing the time between optimization decisions. Note alsothat in the case that E(�) ≤ 0 all cars switch to non-pollutingmode, and help the cyclist even when background pollutionlevels are high. Finally, note that the idea of embedding agroup of hybrid vehicles inside a feedback loop has beenimplemented in the context of our previous work [6], [8]and we refer the interested reader to these papers for moredetails.
Remark (Prioritisation of Cyclists): In some circumstances,the aforementioned strategy may have the effect of prioritisingcyclists over pedestrians and other citizens. The justificationfor this, in the present context, is that cyclists are typicallymore vulnerable than other road users due to their increasedrespiratory rate, and their proximity to vehicle tailpipes (withsome studies suggesting that they experience more than twicethe level of exposure than pedestrians). However, the readershould also note that additional constraints can also be intro-duced into the optimisation to account for other road usersand city dwellers; see [6]–[8].
E. Cyclist Density Data
Cyclist density data required for the optimisation (1) wasobtained from historical data provided by the cycling routemapping service Strava.14 The data used in this paper is shownin Fig. 4 where we assigned each road with a weight basedon the heatmap data from Strava. Note that more accurateand real time data can be obtained from sources such as localauthorities, mobile phone companies, and social networks.
F. Emission Data
For our simulations, and our hardware-in-the-loop emula-tion (see below), the pollution data for each car in the geofenceis estimated using the average speed model proposed in [6].The emission function (g/km) for the vehicle in question,where t , v, and p are the type of vehicle, average speed and
12http://www.euro.who.int/__data/assets/pdf_file/0005/74732/E71922.pdf13http://iscapeproject.eu/14http://labs.strava.com/heatmap/

3996 IEEE TRANSACTIONS ON INTELLIGENT TRANSPORTATION SYSTEMS, VOL. 19, NO. 12, DECEMBER 2018
Fig. 4. Heat-map showing previous routes of cyclists in the Palmerstown area.Brighter lines indicate more popular routes. The relative weights assigned foruse with the optimisation are also shown overlaid. If a road has no data it isassigned a value of 1.0 by default.
pollutant respectively, is repeated in (2):
f (t, p) = k
v(a + bv + cv3 + dv3 + ev4 + f v5 + gv6) (2)
where the parameters k, a, b, . . . , g are used to specifiy dif-ferent level of emissions by different classes of vehicles.The functions are converted to pollutants per minute and theaggregate is calculated by summing all vehicles in pollutingmode.
Remarks on the Average Speed Model: We make the fol-lowing comments concerning the use of the average speedmodel.
• The average speed model is used in this paper to illustratethe operation of the system, and to facilitate our SUMObased simulations and hardware-in-the-loop testing. It isNOT intended to be a realistic representation of vehicleemissions.
• In practice, measurement data from each vehicle type,and a Portable Emissions Management System (PEMS),would be used to construct a more accurate emissionsmodel15,16 [20]. Thus, in practice, a PEMS, could beused to calibrate the algorithms to model emissions fordifferent driving cycles over an inventory of vehicles.Alternatively, emissions could be measured in an activemanner using PEMS like devices.
• We note again, that control of emissions, via adjustmentof vehicle speed, is NOT the subject of this paper. We areinterested in non-invasive strategies (from the viewpointof the driver, and traffic disturbance). Consequently, con-trol of switching between polluting and non-pollutingmode in the HV, is our preferred actuation method.Finally, as we have already noted, pollution mitigationmeasures, such as speed control, or traffic rerouting,have been investigated in a series of our companionpapers [8].
15https://ec.europa.eu/jrc/en/vela/portable-emissions-measurement-systems16http://www.horiba.com/automotive-test-systems/products/emission-
measurement-systems/on-board-systems/
G. Implementation Aspects for Multiple VehicleSimulation and Emulation
Finally, we comment on implementation aspects of themulti-vehicle operation mode.
1) Vehicles begin in polluting mode. When a cyclist isdetected by the RFID system, an alert is sent to the driverand the central server, which creates the geofence with aunique ID corresponding to the ID of the RFID tag onthe cyclist’s helmet. The centre of the geofence will beassigned to the location of the vehicle that detected thecyclist.
2) All vehicles inside the geofence are asked for theiremission class (how polluting they are) and what roadthey are on. The cyclist density value for the road thevehicle is travelling on is obtained from cycling statisticsdata for the area, and updated periodically.
3) The central server solves the linear programming problem(1) and calculates the probability of staying in pollutingmode (not switching into electric mode) for each vehicle,based on how polluting the vehicle is and how likely itis that a cyclist will travel on the road the vehicle is on.
4) These probabilities are communicated to each vehiclewho act on this instruction by performing a weightedcoin toss on whether or not the vehicle will switch intoelectric mode.
5) Steps 2 to 4 are repeated every τ seconds until the cyclistis no longer detected by a vehicle in the geofence. If acyclist has not been detected for 20 seconds, the geofenceis removed and the vehicles inside the removed geofenceswitch back to polluting mode.
IV. SUMO AND HIL SIMULATION
In this section we evaluate our proposed method usingthe road-network and traffic simulator, SUMO, and in a realvehicle using the Hardware-In-the-Loop (HIL) platform. NoteSUMO [21] is an open source, microscopic road traffic sim-ulation package from the Institute of Transportation Systemsat the German Aerospace Centre (DLR).
A. SUMO Set-Up
A SUMO simulation was conducted using a map of thePalmerstown, Dublin 20, in Ireland obtained from Open StreetMap.17 The heatmap data from Strava shown in Fig. 4 appliesto the map shown in Fig. 6. The Palmerstown area was used forthe simulation as the heatmap from Strava has a diverse rangeof cyclist density values in a small area, which makes it idealfor testing the geofence algorithm. In the simulation, vehiclesare added at every time step with each vehicle being assingeda EURO emission class between 1 and 4.18 The vehicleswill be removed from the road network when they arrive attheir pre-defined destinations. In particular, we assume thata cyclist will be detected by vehicle 24 at a specific timestep, and a geofence centred at the vehicle 24 will be created
17https://www.openstreetmap.org18The EURO emission classes define limits for exhaust-gas emissions.
A higher emission class corresponds to stricter emission limits.

HERRMANN et al.: NEW TAKE ON PROTECTING CYCLISTS IN SMART CITIES 3997
Fig. 5. In-car implementation of the system. Solid lines indicate wiredethernet connection, dashed lines indicate WiFi connection and dotted linesindicate Bluetooth connection.
correspondingly.19 The optimisation algorithm is implementedat each time step for the vehicles inside the geofence and thevehicles act on this information as soon as the results of theoptimisation are received from the central server. Furthermore,the emission limit for all vehicles inside the geofence is setto 1.0gCO/min and the radius of the geofence is set to 100m.These limit values are chosen arbitrarily to demonstrate theproof of concept.
B. HIL Set-UpIn order to get a real-world feel for the system developed,
our algorithm was implemented and tested in a real car usingthe HIL platform. This platform allows a real vehicle to controlan avatar vehicle inside the SUMO simulation. This createsthe effect of having a fleet of connected vehicles while onlya single vehicle is needed in reality. A full description of theHIL platform can be seen in [21]; a brief overview follows.
The system architecture used for this work can be seenin Fig. 5. For logistical reasons, the UCD campus was usedfor testing rather than Palmerstown. However, the data fromStrava is not as diverse for the UCD campus as it is a very busycycling location as many students cycle to and from campus.
1) Vehicle: The vehicle and cyclist detection system usedfor the HIL test is similar in configuration to the one describedin Section III. The vehicle controls the avatar vehicle by send-ing the current speed of the vehicle to the SUMO Simulation.The speed is obtained from the OBD2 port of the vehicle viaa Bluetooth OBD2 Module connected to the Android applica-tion via the Torque Pro Libraries.20 The Android applicationhandles communication with the Bluetooth OBD2 module andrelays the speed information to the Python Server (running theSUMO Simulation) via WiFi.
2) On-Board Computer: A Macbook Pro (15" Mid 2009)runs the Java and Python servers for the RFID System andSUMO simulation respectively. These two servers act as twoindividual components of the system and do not communicateon the computer (to simulate the Python server running in thecloud, while the Java server runs on the vehicle). The twoservers communicate through the Android application.
19In the case of a real vehicle, a geofence will be created automaticallywhen the RFID system detects a cyclist around.
20https://torque-bhp.com
Fig. 6. Map in SUMO obtained from Open Street Map of Palmerstown,Dublin 20.
C. HIL Implementations
When a cyclist is detected by the RFID reader, the Pythonserver is instructed to create/update a geofence at the locationof the real vehicle in the simulation. The results of theoptimisation are then communicated with the vehicles in thegeofence, if the real vehicle is one of those vehicles, the resultas to whether to switch on electric mode is sent to theAndroid application which instructs the Bluetooth actuatorto turn on electric mode. Since we are dealing with a realvehicle, a couple of seconds are required to execute the“change to electric mode” command. As such the frequencythat the optimisation runs inside the geofence was changedfrom every second (as in the SUMO simulation), to everyfive seconds to allow for time for the vehicle act on thecommands.
V. RESULTS AND DISCUSSION
In this section we discuss our simulation results. In whatfollows we assume that the emission rate limit E(�) is con-stant; this is akin to assuming that the background emissionsare constant. A video of the SUMO simulation and the HILtest, illustrating the driver warning system and the automaticoperation of the pollution mitigation system can be seen athttps://youtu.be/wWU7kREc_2A
Fig. 7 shows the total emissions for the map as morevehicles are being added. Fig. 8 shows the results that thispollution mitigation technique has achieved. The maximumemission level of E(�) = 1.0gC O/min inside the geofencehas been achieved with only slight variations caused by theuncertainty of the nature of the probabilistic assignment ofwhether the vehicles will stay in polluting mode. Fig. 9shows the geofence in operation at a specific time step inSUMO with vehicles 10, 18, 20, and 24 operating in electricmode (green) and vehicles 17, 25, 27, and 34 operating inpolluting mode (grey). As expected, more vehicles are inelectric mode on the road that has a high cyclist density value.
Furthermore, Fig. 10 shows a detailed look at the data theoptimisation used and the results assigned to each vehicle.Vehicles 10, 17, 18, 20, and 24 are all on the main road whichhave a high estimated cyclist density value relative to vehicles25, 27, and 34 who are on neighbouring roads that are muchless likely for a cyclist to travel on, causing them to have

3998 IEEE TRANSACTIONS ON INTELLIGENT TRANSPORTATION SYSTEMS, VOL. 19, NO. 12, DECEMBER 2018
Fig. 7. As more vehicles get added to the SUMO Simulation the totalemissions increase.
Fig. 8. Total emissions inside the geofence before and after the algorithmis applied for each time step.
a high probability of remaining in polluting mode. Here theemission constraint has been satisfied by the vehicles on roadsof high estimated cyclist density switching to electric mode;however, vehicle 17 has been selected to remain in pollutingmode despite being on a road of high estimated cyclist density.This is due to: 1) The emission levels being safe enough toallow vehicle 17 to remain in polluting mode (the utility ofthe EVs limited battery capacity is being maximised); and2) Vehicle 17 not being as polluting compared to the othervehicles on the road and in the geofence, so if there is spare‘utility’, vehicle 17 is preferred. Therefore, this vehicle staysoperating in polluting mode as seen in Fig. 9. Finally, Fig. 11shows how fewer cars in the geofence effect the results. Sincethere are fewer cars in the geofence, a lower quantity of overallemissions are being generated, so the optimisation can allowmore vehicles to travel in polluting mode. Here vehicles 10,17, 20, and 24 are allowed to stay in polluting mode as thereis spare ‘utility’. Vehicle 18 is assigned a high probabilityof switching to electric mode as out of the three vehicles onthe road with high estimated cyclist density (vehicles 18, 20,and 24), it has the highest output of gCO/min.
Fig. 9. Geofence operating in SUMO. Green vehicles indicate vehiclescurrently in electric Mode, where Grey vehicles are in Polluting Mode. Thecyclist was detected by the vehicle in the centre of the geofence.
Fig. 10. A detailed look at the effect of the emission class of the vehicleand the estimated density of a cyclist taking the road the vehicle is on has onthe probability of remaining in polluting mode.
Fig. 11. The effect of fewer cars in the geofence.
VI. FUTURE WORK
Future work could involve further development of thegeofence algorithm to address issues not investigated in this

HERRMANN et al.: NEW TAKE ON PROTECTING CYCLISTS IN SMART CITIES 3999
paper such as: 1) allowing the operation and simulation ofmultiple overlapping geofences within an area and the impacton the emission sharing; and 2) incorporating the vehicle routeprediction ideas from [7] to better determine where pollutionhot spots are going to occur and stop them before they happen,rather than instantaneously.
VII. CONCLUSION
In this paper a novel pollution mitigation technique has beenintroduced with the focus to protecting cyclists from unsafequantities of tail-pipe emissions. The technique has been testedboth in simulation and in a real vehicle and shows its ability tooptimally regulate emissions inside of a dynamically generatedgeofence around a cyclist.
ACKNOWLEDGEMENTS
The authors gratefully acknowledge the comments ofEmanuele Crisostomi and Giovanni Russo.
REFERENCES
[1] M. Nyhan, A. McNabola, and B. Misstear, “Comparison of particulatematter dose and acute heart rate variability response in cyclists, pedes-trians, bus and train passengers,” Sci. Total Environ., vols. 468–469,pp. 821–831, Jan. 2014.
[2] A. Y. Bigazzi and M. A. Figliozzi, “Review of urban bicyclists’ intakeand uptake of traffic-related air pollution,” Transp. Rev., vol. 34, no. 2,pp. 221–245, 2014.
[3] M. Zuurbier, G. Hoek, P. van den Hazel, and B. Brunekreef, “Minuteventilation of cyclists, car and bus passengers: An experimental study,”Environ. Health, vol. 8, no. 1, p. 48, 2009.
[4] J. J. de Hartog, H. Boogaard, H. Nijland, and G. Hoek, “Do the healthbenefits of cycling outweigh the risks?” Environ. Health Perspect.,vol. 118, no. 8, pp. 1109–1116, 2010.
[5] L. I. Panis et al., “Exposure to particulate matter in traffic: A comparisonof cyclists and car passengers,” Atmos. Environ., vol. 44, no. 19,pp. 2263–2270, 2010.
[6] A. Schlote et al., “Cooperative regulation and trading of emissions usingplug-in hybrid vehicles,” IEEE Trans. Intell. Transp. Syst., vol. 14, no. 4,pp. 1572–1585, Dec. 2013.
[7] Y. Gu, M. Liu, J. Naoum-Sawaya, E. Crisostomi, G. Russo, andR. Shorten, “Pedestrian-aware engine management strategies for plug-in hybrid electric vehicles,” IEEE Trans. Intell. Transp. Syst., vol. 19,no. 1, pp. 92–101, Jan. 2018.
[8] E. Crisostomi, R. Shorten, S. Stüdli, and F. Wirth, Electric and Plug-inHybrid Vehicle Networks: Optimization and Control (Automation andControl Engineering). Boca Raton, FL, USA: CRC Press, 2017.
[9] S. Sweeney, R. Ordonez-Hurtado, F. Pilla, G. Russo, D. Timoney, andR. Shorten. (2017). “Cyberphysics, pollution mitigation, and pedelecs.”[Online]. Available: https://arxiv.org/abs/1706.00646
[10] C. O’Faolain, “A cyclist collision prevention system for in-car deploy-ment,” M.S. thesis, Dept. Electron. Elect. Eng., Univ. College Dublin,Dublin, Ireland, 2016.
[11] A. Sciarretta, M. Back, and L. Guzzella, “Optimal control of parallelhybrid electric vehicles,” IEEE Trans. Control Syst. Technol., vol. 12,no. 3, pp. 352–363, May 2004.
[12] S. Barsali, C. Miulli, and A. Possenti, “A control strategy to minimizefuel consumption of series hybrid electric vehicles,” IEEE Trans. EnergyConvers., vol. 19, no. 1, pp. 187–195, Mar. 2004.
[13] K. T. Chau and Y. S. Wong, “Overview of power management inhybrid electric vehicles,” Energy Convers. Manage., vol. 43, no. 15,pp. 1953–1968, 2002.
[14] S. Stockar, V. Marano, M. Canova, G. Rizzoni, and L. Guzzella,“Energy-optimal control of plug-in hybrid electric vehicles for real-world driving cycles,” IEEE Trans. Veh. Technol., vol. 60, no. 7,pp. 2949–2962, Sep. 2011.
[15] F. Häusler, M. Faizrahnemoon, E. Crisostomi, A. Schlote, I. Radusch,and R. Shorten, “A framework for real-time emissions trading in large-scale vehicle fleets,” IET Intell. Transp. Syst., vol. 9, no. 3, pp. 275–284,2015.
[16] A. Schlote, “New perspectives on modelling and control for nextgeneration intelligent transport systems,” Ph.D. dissertation, HamiltonInst., Nat. Univ. Ireland Maynooth, Maynooth, Ireland, 2014.
[17] X. Li et al., “A new benchmark for vision-based cyclist detection,” inProc. Intell. Vehicles Symp. (IV), 2016, pp. 1028–1033.
[18] Y. Gu, F. Häusler, W. Griggs, E. Crisostomi, and R. Shorten, “Smartprocurement of naturally generated energy (SPONGE) for PHEVs,” Int.J. Control, vol. 89, no. 7, pp. 1467–1480, 2016.
[19] A. C. Rai et al., “End-user perspective of low-cost sensors for out-door air pollution monitoring,” Sci. Total Environ., vols. 607–608,pp. 691–705, Dec. 2017.
[20] B. Giechaskiel et al., “Implementation of portable emissions measure-ment systems (PEMS) for the real-driving emissions (RDE) regulationin Europe,” J. Vis. Experim., no. 118, p. 54753, 2016.
[21] W. M. Griggs, R. H. Ordóñez-Hurtado, E. Crisostomi, F. Häusler,K. Massow, and R. N. Shorten, “A large-scale sumo-based emu-lation platform,” IEEE Trans. Intell. Transp. Syst., vol. 16, no. 6,pp. 3050–3059, Dec. 2015.
Adam Herrmann received the B.Sc. degree (Hons.)in engineering science and the M.E. degree in elec-tronic and computer engineering from UniversityCollege Dublin, in 2015 and 2017, respectively. Hisresearch interests include aeronautics, cyber security,and smart cities, with a focus on smart transportationsystems.
Mingming Liu received the B.E. degree (Hons.) inelectronic engineering from the National Universityof Ireland Maynooth in 2011 and the Ph.D. degreefrom the Hamilton Institute, Maynooth University,in 2015. He is currently a Post-Doctoral ResearchFellow with University College Dublin, with Prof.R. Shorten. His current research interests are nonlin-ear system dynamics, distributed control techniques,and modeling and optimization in the context ofsmart grid and smart transportation systems.
Francesco Pilla was with Trinity College at Dublinand MIT. He is currently with UCD. His area ofexpertise is geospatial analysis and modeling ofenvironmental dynamics, which involve the develop-ment of environmental pollution models (air, noise,and water) and decision support tools using a GISplatform, in order to facilitate the interoperabilityof input data and research outcomes between theclient/final user and the research team. His currentresearch interests include understanding complexenvironmental phenomena in order to preempt the
impacts resulting from interactions between the human population and theenvironment.
Robert Shorten led the Optimization andControl Team, IBM Research, at their SmartCities Research Lab in Dublin. He is currentlya Professor of control engineering and decisionscience at UCD, and retains a part-time appointmentwith IBM Research. He is a Co-Founder of theHamilton Institute, Maynooth University, and hasbeen a Visiting Professor with TU Berlin. He hasbeen a Research Visitor at Yale University andTechnion–Israel Institute of Technology. He is aCo-Author of the recently published books AIMD
Dynamics and Distributed Resource Allocation (SIAM 2016) and Electricand Plug-in Vehicle Networks: Optimization and Control (CRC Press, Taylor& Francis Group, 2017). His research interests include: smart mobilityand smart cities; control theory and dynamics; hybrid dynamical systems;networking; linear algebra; and collaborative consumption. He is an IrishMember of the European Union Control Association Assembly and amember of the IEEE Control Systems Society Technical Group on SmartCities, the IFAC Technical Committees for Automotive Control, and theIFAC Technical Committees for Discrete Event and Hybrid Systems.