a new narrative on mekong hydropower development dry, annual flood pulse ... 12% of vietnam’s...
TRANSCRIPT

A New Narrative on
Mekong Hydropower Development Wilson Center, April 14, 2016

Transboundary river, 6 states
Half length in China but Lower Mekong supplies 82% of water**
Monsoon climate: Extremes of wet and dry, annual flood pulse”
Source: Asia Maps
Mekong characteristics

China’s Upper Mekong Dams Number of Dams: 20 Already completed: 7 Under construction: 4 Final completion: 2035 Power generation: 31,460 MW Total cost: $17.3bn USD Relocated: >100,000 Total reservoir size: >50 km3
Xiaowan dam is 2nd highest in the world 270m; reservoir size ½ of all newly added reservoir
Map: International Rivers

The Lower Mekong 150+ dams under construction or planned Regional/Transboundary landscape Uneven development Laos: 28,000 MW Cambodia: 10,000 MW No coordination Ad-hoc “sales” approach Mekong River Commission UN Watercourse Convention Bilateral diplomacy Map: WLE Mekong

MEKONG DELTA
12% of Vietnam’s total area
Discharges 100 miles3 /year
Population: 22 million

DELTA FACTS
Population density: 7x
avg of Mekong basin
Canals: 60,000 miles
Dikes: 9,000 miles
Waterworks: 13,000 miles


DELTA PRODUCTIVITY
o 2.6 rice crops/year,
o 25 million tons of rice (53%)
o 70% of national fruit crop
o 74% of Vietnam’s aqua-products

Source: MRC Technical Paper #24, Sept. 2009

Tonle Sap Lake
Southeast Asia’s largest lake
Doubles size during monsoon
Nursery for >200 fish species
Birthplace of Khmer empire

Source: The Cambodia Herald

Source: Chiang Rai Bulletin, July 2013


Source: Suthep Kritsanavarin


Source: Intralawan, A., Wood D., Frankel R. “Economic, Environmental, and Social Impacts of Lower Mekong Hydropower Development.” Mae Fahluang Univeristy, 2015.
Revising the Costanza report: • Considers actual flow of income to host country (assumes 70% to operator, 30% to national government • Uses a 3% discount rate for natural resources • Uses new fish catch data from Laos and Cambodia (not available at time of Costanza report) • Values catch of wild fish at market prices
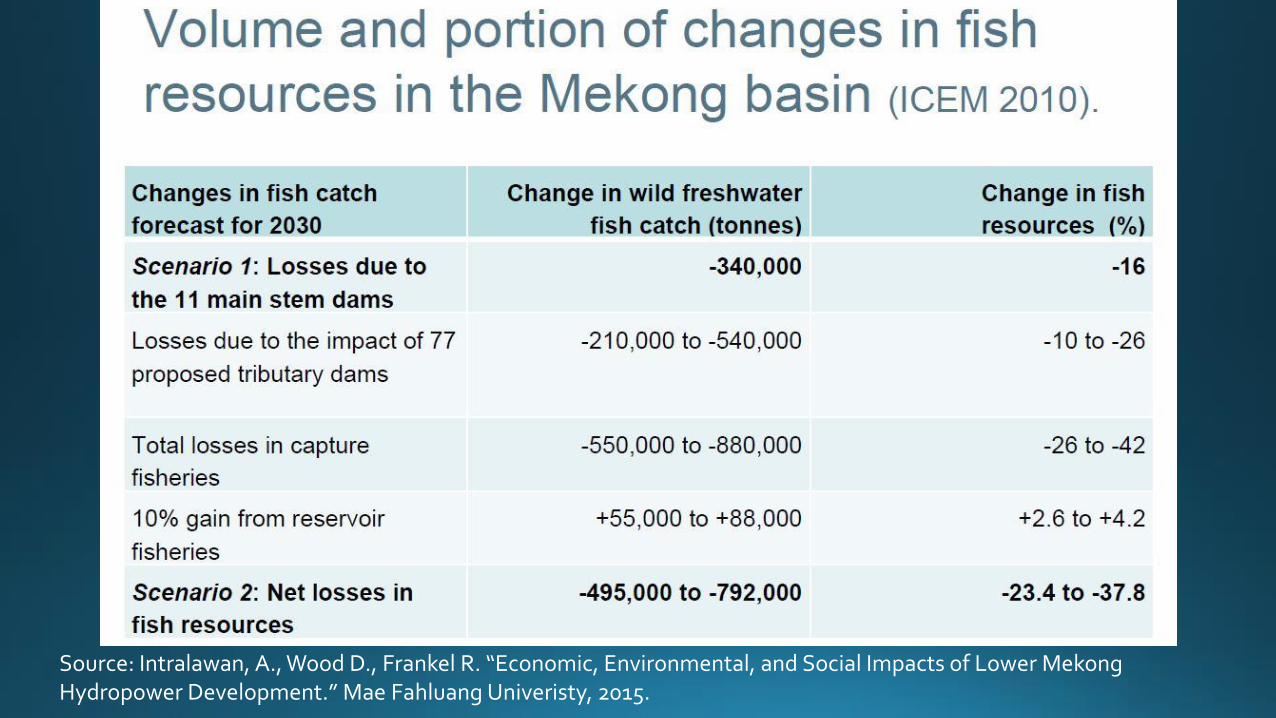
Source: Intralawan, A., Wood D., Frankel R. “Economic, Environmental, and Social Impacts of Lower Mekong Hydropower Development.” Mae Fahluang Univeristy, 2015.

Source: Pittock J., Orr S., Chapagain A, Dumaresq D. “Dams on the Mekong: Lost fish protein and the implications for land and water resources.” Australian National University, 2012. Hydropower Development.” Mae Fahluang Univeristy, 2015.
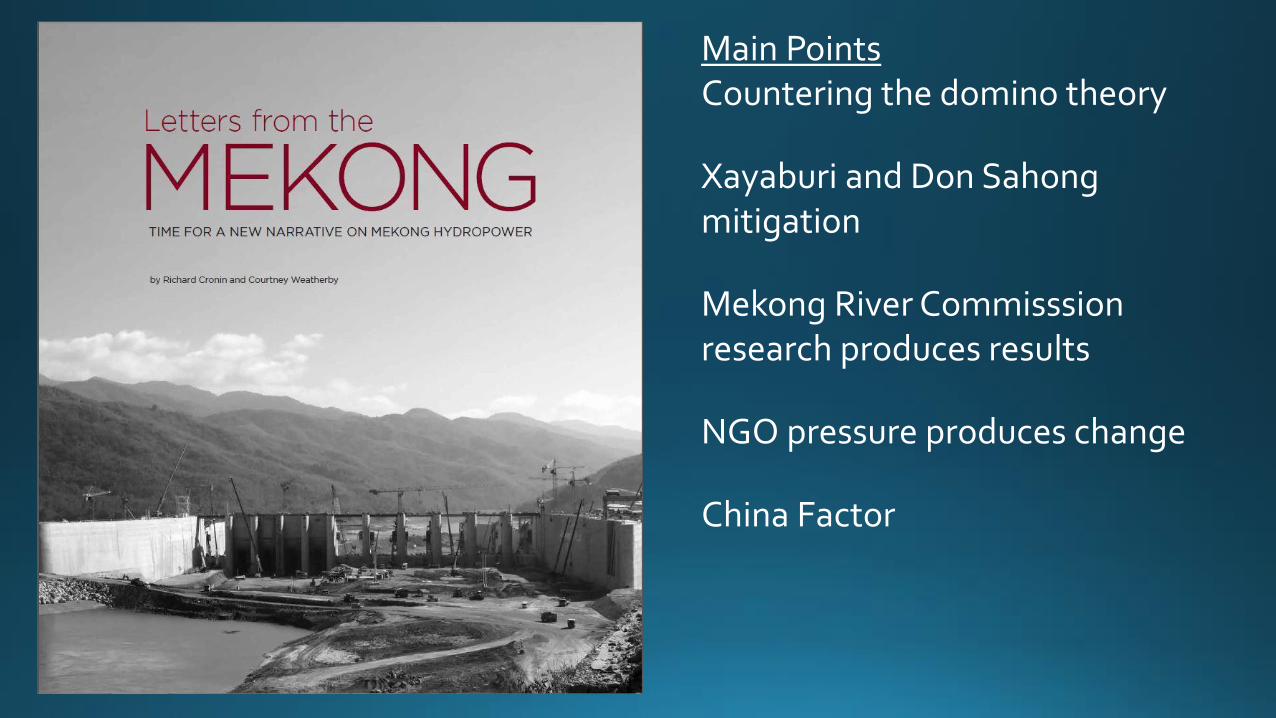
Main Points Countering the domino theory
Xayaburi and Don Sahong mitigation
Mekong River Commisssion research produces results
NGO pressure produces change
China Factor

√
Government
√ Developer
√ Site
√ Fuel
√ Buyer
√ Financing
?
√
?
???
???
???

Regional Off-takers China: Current power glut Myanmar: 5X potential Thailand: Flagging economy Cambodia: Energy security Vietnam: 12% YOY energy growth From 36GW->50GW->100GW PM Dung: “No new coal” Per capita energy use is 1/5 US Structural obstacles Energy subsidies Safeguard compliance


Impacts of Hydropower development with photo – explain nexus DISCUSSION
