a new method to check the angle precision of total stations · 2015-06-01 · a new method to check...
TRANSCRIPT

A New Method to Check the Angle Precision of Total Stations Stations (7514)
Evangelia Lambrou and Konstantinos Nikolitsas (Greece)
FIG Working Week 2015
From the Wisdom of the Ages to the Challenges of the Modern World
Sofia, Bulgaria, 17-21 May 2015
1/12
A New Method to Check the Angle Precision of Total Stations
Evangelia Lambrou, Konstantinos Nikolitsas, Greece
Keywords: Total Station, Metrological Check, Uncertainty Equation, Directions
Measurement, Monte Carlo Method, Scale of the Total Station
SUMMARY
This paper proposes a new method to check the directions’ (angles’) precision of a total
station (TS) against its manufacturer specification. It can be performed in less than half the
time of the existing ISO 17123-3 test. Additionally it is innovative as provides both the
random and the systematic errors that a TS may hold. The application of the method shows
that, it is reliable, advantageous and time-efficient. Only half an hour is required for a TS’s
check.
TS must be checked for systematic or random errors that contribute to the angles
measurements. In many countries, by law, an accreditation certification should accompany
every TS which is used at the modern infrastructure constructions. The high level of the
demanded accuracy leads to the imperative need to ensure the proper TSs operation.
The directions (angle) measurements are sensitive, because parameters like the nominal
precision of the TS, the observer, the target and the environmental conditions are involved.
More analytically the personal perception of the observer for the correct targeting, the type of
target, the quality of the telescope’s lenses, the quality of the reading sensors of the TS , the
sighting distance, the TS maintenance, the user treatment and the transportation conditions
make the direction measurements enough sensitive.
The proposed procedure requires readings of directions (horizontal and vertical) with the
inspected TS at a series of twenty targets which are established at an indoor laboratory hall.
These readings are being compared with their true values which had been acquired by a first
class (reference) TS. The number of the proper targets is resulted by a simulation of the
control field, by using the Monte Carlo method.
Both, the systematic and random errors of the inspected TS, are being calculated by using the
appropriate uncertainty equation by means of the least squares method. Moreover, the “scale”
of the TS is calculated as an equation coefficient. The scale presents the grade of the TS’s
identification with the prototype or even its regularity. Thus, not only the certification but
also the accreditation of TS could be achieved. Likewise, the suitability of TS for use is
confirmed, for every specific application. Also, a comparison of the proposed method with the
recommended tests for TSs by ISO (ISO17123, 2001) is given.

A New Method to Check the Angle Precision of Total Stations Stations (7514)
Evangelia Lambrou and Konstantinos Nikolitsas (Greece)
FIG Working Week 2015
From the Wisdom of the Ages to the Challenges of the Modern World
Sofia, Bulgaria, 17-21 May 2015
2/12
A New Method to Check the Angle Precision of Total Stations
Evangelia Lambrou, Konstantinos Nikolitsas, Greece
1. INTRODUCTION
The aim of this work is to present a method to check the angle precision of total station (TS)
at an indoor control field in order to determine its systematic and random errors.
The modern TSs consist of an extremely complicated system of electronic and mechanical
parts (hardware) which is combined with advanced software.The structure of TSs has at least
three components. The first pertains to simple checks such as centering and leveling, the
second is concerned with the distance measurement and the third deals with the horizontal and
vertical directions (angles) reading (Lambrou & Pantazis,2010).
These delicate parts make TSs more sensitive but ensure high measurement quality and
accuracy, under the consideration of its proper operation .The proper running of TS must be
checked periodically, especially today, that the nominal uncertainty of the direction reading is
increased and fluctuates from ±0.5 to ±9.
The fundamental idea for the majority of the metrological tests is the comparison of a
measured value with an instrument under test with the "true" value from a first order reference
instrument (Woschitz et al., 2002).
It is known that the "true" value of a measurement could never be known. Therefore, values
provided by reference devices or instruments include by default an uncertainty. Such
instruments are, therefore, fundamentally incapable to provide the "true" values. (Doeblin,
1995)
Practically, when a measurement is repeated so many times by using the standard instrument,
the measurement number is considered infinite. Then the average value of this measurement
will be considered as "true" and its standard deviation approaches the zero value (Leica
Geosystems, 2010b).
The standard values of the control fields are considered "true" or completely accurate (without
uncertainty). Usually these values are computed by many more measurements with higher
order instrumentation or by another system, which gives an order of magnitude (or more)
better accuracy than the instruments under check.
The accuracy of the standard instrument must be about 10 times better than the instrument
under inspection in order to ensure the credibility of the procedure (Doeblin,1995). This is a
fundamental rule, but practically often too strict, and not always applied.
In the specific case of the direction (angle) measurement the following procedure is proposed.
An indoor control field is being established. The standard measurements ("true" values) of
directions to specific targets are being acquired using a standard TS .These values are
compared with the corresponding direction measurements which were observed by TS under
examination.
The proper number of targets is calculated by using a Monte Carlo simulation .Also it is
constrained by the full coverage of the TS’s disk, the time efficiency of the measurements,
either by the standard and the checked TS and the satisfactory degrees of freedom for the
adjustment. An appropriate uncertainty equation is used for the measurements adjustment by
means of the least square method.
A New Method to Check the Angle Precision of Total Stations Stations (7514)
Evangelia Lambrou and Konstantinos Nikolitsas (Greece)
FIG Working Week 2015
From the Wisdom of the Ages to the Challenges of the Modern World
Sofia, Bulgaria, 17-21 May 2015
3/12
2. THE PARAMETERS OF THE CONTROL FIELD
In order to define the correct checking procedure it is indispensable to take in to consideration
or to eliminate the influence of some parameters such as the environmental conditions and the
observer, the TS features and the target to be used.
The environmental conditions such as temperature, humidity and fog are parameters that
influence both the sighting line and the observer. These parameters cannot be foreseen or
modeled. Also the sighting distance influences the distinctness of the target and its apparent
size. In the present work the influence of the environmental conditions are minimized as both
the reference and the test measurements were carried out at an indoor laboratory hall.
The observer is also a variable parameter as induces systematic and random errors. The
systematic part defined as the observer’s personal equation that depends on the site
perception, the target recognition and the eye’s distinction for the correct pointing of the
telescope’s crosshair on the target. The random part of the error depends on the observer’s
diligence ability, the fatigue and finally the experience. These issues are taken into
consideration for the target choice, in order to remove the main part of these errors.
Additionally, it is obvious that a skilled observer should carry out the check.
2.1 The number of sightings
TS provides errors according to its manufacture defects (perpendicularity of its axis). Also a
systematic error is due to the quality, the kind and the number of the electronic readers which
are mounted on measuring disks as well as the software used for the measurements
calculations. The modern TSs include up to 4 readers (Leica, 2009) in order to minimize this
error.
A random error owed to the levelling error at the TS position. The improper levelling is
corrected partially by the compensators (Leica 2010 c, Topcon 2010). The remaining error Ισ
depends on the compensator’s setting accuracy (S), which fluctuates from 0.3 to 1.5, upon
TS nominal accuracy (Leica Geosystems , 2010a) is equal to
S0.2σΙ (1)
Thus the error on the horizontal directions reading σL, which depends also on the zenith angle
z, is calculated according to the equation 2 (US Army, 2002).
/tanzσσ ΙL (2)
Also the quality of the lenses, the crosshairs’ width and the magnification (M) that is rendered
add a systematic error according to equation (3)
/M45σm (3)
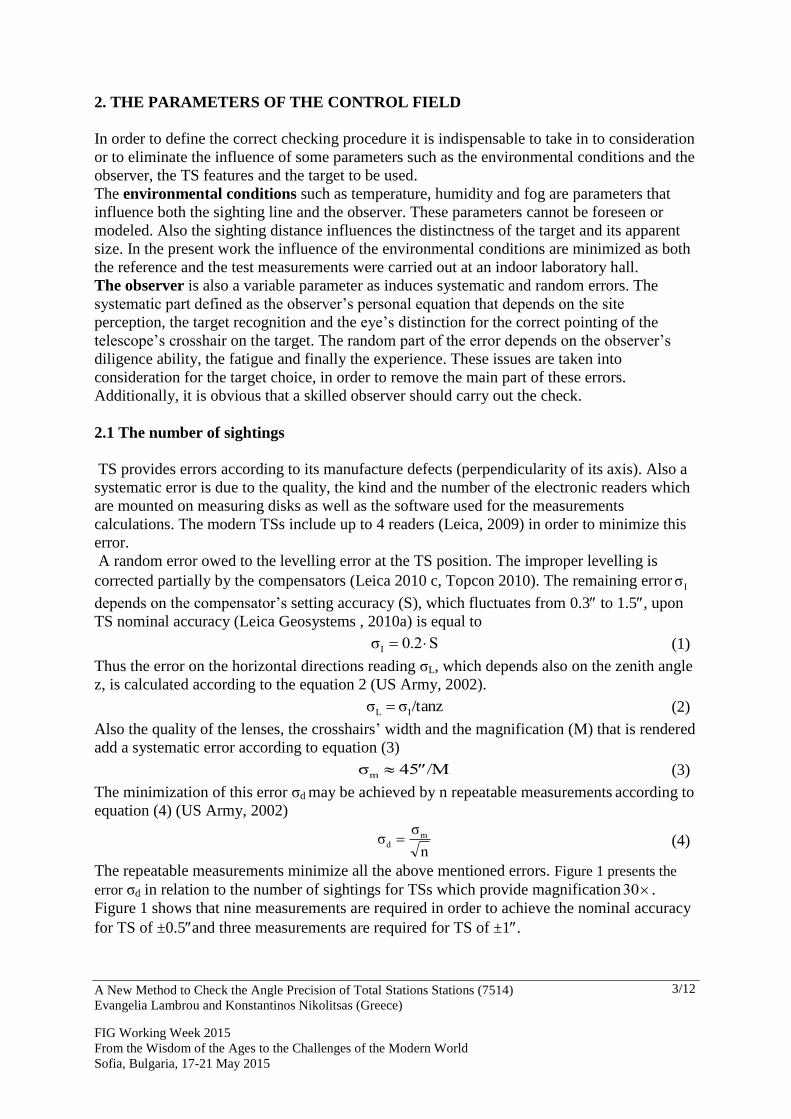
The minimization of this error σd may be achieved by n repeatable measurements according to
equation (4) (US Army, 2002)
n
σσ md (4)
The repeatable measurements minimize all the above mentioned errors. Figure 1 presents the
error σd in relation to the number of sightings for TSs which provide magnification 30 .
Figure 1 shows that nine measurements are required in order to achieve the nominal accuracy
for TS of ±0.5and three measurements are required for TS of ±1.
A New Method to Check the Angle Precision of Total Stations Stations (7514)
Evangelia Lambrou and Konstantinos Nikolitsas (Greece)
FIG Working Week 2015
From the Wisdom of the Ages to the Challenges of the Modern World
Sofia, Bulgaria, 17-21 May 2015
4/12
Figure 1. The error of direction reading in relation to the number
of measurements for TSs of magnification 30
2.2 The type of target
The type of the targets also influences the direction reading error. The target’s magnitude
(relative to the sighting distance), the color, the shape, the definition of its center, the width of
the incised crosshair lines are significant characteristics.
The apparent width of the lines that define its center should be greater or equal to the TS’s
crosshairs width. The apparent size of the target, at a distance D, is equal to its real size
multiplied by the factor k (eq.5) (US Army, 2002).
D
Lk tel (5)
where Ltel is the focal length of the telescope.
So if the crosshair’s width is 3μm and the Ltel =0.15cm , then a target of 1mm width may be
sighted at a maximum distance of 50m.Table 1 presents the apparent width of some targets at
different distances. Real target
Line width
D 1mm 5mm 10mm
10m 15μm 75μm 150μm
30m 5μm 25μm 50μm
50m 3μm 15μm 30μm
Table 1: The apparent width of the targets’ lines at different distances
Thus, a suitable type of target must be designed to ensure the minimization of the pointing
error, giving the observer a sense of uniqueness for the collimating point.
In an indoor location where the sight distances are of the order of 10m, such targets must be
used so that the apparent thickness of its lines exceeds the thickness of the telescope’s
crosshairs. After some experiments, the target illustrated in figure 2 was chosen. The
enlargement of its center is also illustrated in the same figure. The spacing of 0.6mm between
the target’s border lines at the distance of 10m displayed about 9μm so that it can be
adequately bisected by the crosshair’s lines.

A New Method to Check the Angle Precision of Total Stations Stations (7514)
Evangelia Lambrou and Konstantinos Nikolitsas (Greece)
FIG Working Week 2015
From the Wisdom of the Ages to the Challenges of the Modern World
Sofia, Bulgaria, 17-21 May 2015
5/12
Figure 2: The target used and the magnification of its center
2.3 The number of targets
To calculate the minimum required number of targets, for the control field establishment, the
used equation (10) was simulated 106
times by using the Monte Carlo method according to the
JCGM guidelines (BIMP, JCGM 101:2008., 2008, James, 1980).
Monte Carlo methods are a class of computational algorithms that rely on repeated random
sampling to compute their results. Monte Carlo methods are often used in simulating physical
and mathematical systems. Because of their dependence on repeated computation of random
or pseudo-random numbers, these methods are most suited to calculation by a computer and
tend to be used when it is unfeasible or impossible to compute an exact result with a
deterministic algorithm.
Monte Carlo simulation methods are especially useful in studying systems with a large
number of coupled degrees of freedom, such as fluids, disordered materials, strongly coupled
solids, and cellular structures. More broadly, Monte Carlo methods are useful for modeling
phenomena with significant uncertainty in inputs, such as the calculation of risk in business.
When Monte Carlo simulations have been applied in space exploration and oil exploration,
actual observations of failures, cost overruns and schedule overruns are routinely better
predicted by the simulations than by human intuition or alternative "soft" methods.
The term "Monte Carlo method" was coined in the 1940s by physicists working on nuclear
weapon projects in the Los Alamos National Laboratory. (Princeton, 2014).
The Monte Carlo technique is applied by following the next steps (Pantazis & Nikolitsas,
2011):
Using a set of generated samples the Probability Density Function (PDF, 2014) for the value
of the output quantity Y in equation (6) will be numerically approximated
(Alkhatib et al, 2009).
)Z(f)Z,...Z,Z(fY 21 n (6)
Step 1: A set of random samples z1, z2,…,zn, which have n parameters, is generated from the
PDF for each random input quantity Z1,Z2,…,Zn. The sampling procedure is repeated
M times for every input quantity.
Step 2: The output quantities y will be then calculated by:
)z(f)f,...,f,z(fy )i()i(
n
)i(
2
)i(
1
)i( (7)
Where M,...,1i are the generated samples of the random output quantity Y.
Step 3: Particularly relevant estimates of any statistical quantities can be calculated.
- the expectation of the output quantity
M
1i
)i( )z(fM
1)y(E))z(f(E
(8)
- the estimation of the variance of the output quantity
A New Method to Check the Angle Precision of Total Stations Stations (7514)
Evangelia Lambrou and Konstantinos Nikolitsas (Greece)
FIG Working Week 2015
From the Wisdom of the Ages to the Challenges of the Modern World
Sofia, Bulgaria, 17-21 May 2015
6/12
T)i(
M
1i
)i( ))z(f(E)z(f())z(f(E)z(f(M
1)y(D
(9)
Concerning as import simulation data, x which are the standard values of directions and y are
the modified standard values, according to the expected error of each measurement. The
Monte Carlo simulation was run. The expected error of each measurement is defined as the
sum of the nominal (manufacturer) uncertainty of the TS and the pointing error.
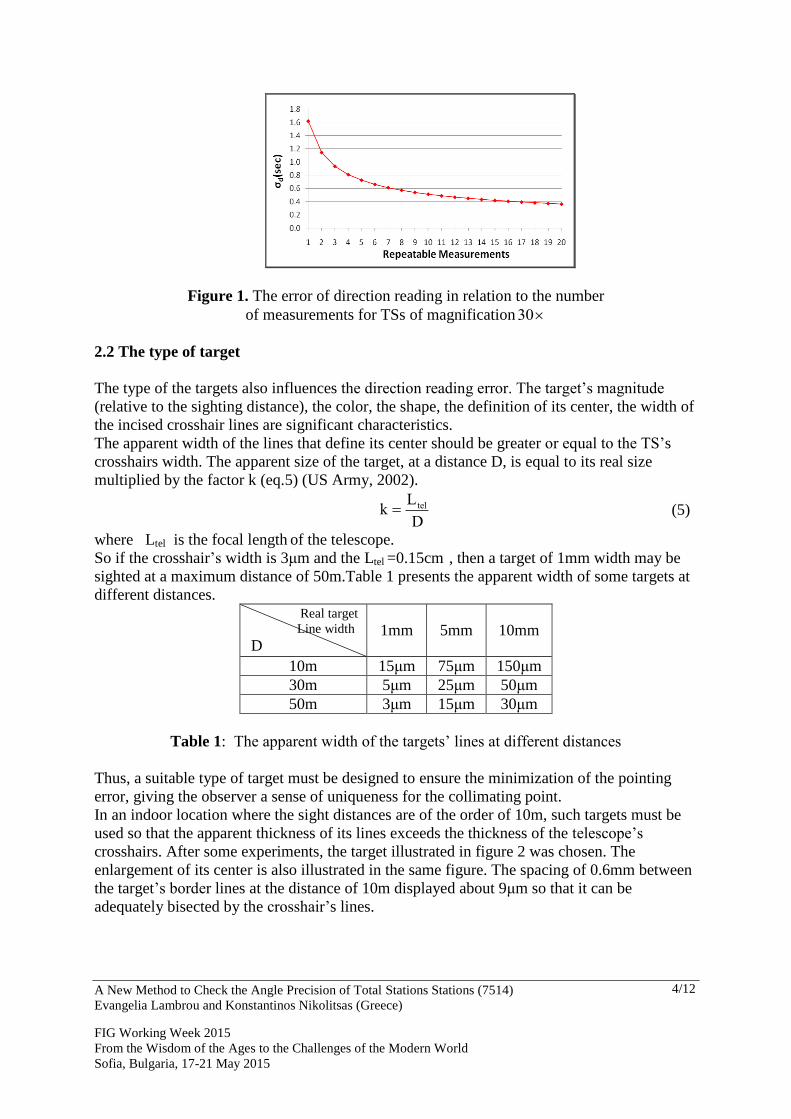
The results of the simulation illustrated in Figure 3. On the Y axis the uncertainty σ in the
standard deviation σο and on the X axis the number of the targets, for TSs of nominal
uncertainty ±3, ±5and ±7 are presented.
Figure 3. The number of targets.
It is obvious that, the first critical curvature change is shown at twenty targets while the next
change which occurs at forty targets provides a little improvement in the error about ±0.2.
So, the best option is to select the twenty targets, which also ensures the minimum
measurement time and satisfies the degrees of freedom for the adjustment.
3. THE UNCERTAINTY EQUATION
A first degree equation (10) could be used in order to certify the measurement accordance
between the TS under examination and the reference TS.
bxay (10) (10
where:
y: are the measurements from TS under test.
x: are the corresponding standard (true) measurements from the reference TS.
b: is the systematic error of TS under test.
a: is the scale of TS (mathematically expresses the slope of the adjustment line).
The number of the formed equations is equal to the number of the targets used at the control
field. Thus both unknowns a and b are determined by using a least squares adjustment (Math
works, 2014) .Moreover their uncertainties σa and σb are calculated .The standard deviation of
the measurements fitting is expressed by the standard error σο of the adjustment .
It is considered that random errors follow the same distribution at the entire range of the
control field.
In case that TS under examination fulfils its specifications, then σο should be less than the
given nominal accuracy. If the systematic error b or the random error σο of TS is greater than
the nominal TS’s accuracy, then this instrument is improper for use.

A New Method to Check the Angle Precision of Total Stations Stations (7514)
Evangelia Lambrou and Konstantinos Nikolitsas (Greece)
FIG Working Week 2015
From the Wisdom of the Ages to the Challenges of the Modern World
Sofia, Bulgaria, 17-21 May 2015
7/12
In the case that the uncertainty σb of the systematic error is close or greater than the value of
b, then b value is negligible so there is no systematic error.
Also TS may be used in applications when the demanded accuracy σε is greater than the total
error, which consists of the systematic and the random part, namely
22
0ε bσσ (11)
The scale a of TS, represents the uniformity of the error’s distribution all over the
measurements and should be 1 (by approximation 10-6
) and its standard deviation σa should
be also of the same order.
In case that there is a coarse error or failure in the total station’s proper operation then the
value of the scale is different of 1, while the standard deviation σa has values in the range of
±10-5
to ±10-4
. Accordingly, the σο of the adjustment is greater than the total station’s nominal
uncertainty.
4. EXPERIMENTAL APPLICATION
By using the above mentioned procedure four total stations were checked .The check was
carried out by a skilled observer in a laboratory hall where a control field with the
aforementioned presuppositions has been established. The environmental conditions were
stable. As the targeting distances fluctuate from 5m to 13m, therefore the special targets of
fig.2 are used to eliminate the targeting error. The check field consists of 20 targets all around
per 18° in order to cover the entire horizontal measuring circle. Correspondingly 20 targets
are put in the vertical direction all around per 15° for the vertical direction check, except the
area under the TS where sighting is not possible.
For the acquisition of the standard values of the directions, each target is measured nine
times, according to the diagram of Fig.1, by using the standard TS , Leica ΤΜ30, which
provides uncertainty ±0.5 for the directions measurements (Leica, 2009).
Four others TSs were checked, which have nominal accuracy ranging from ±3 to ±6. The
measurements were carried out in two periods within 30 min for each TS.
The result of the adjustment namely the scale a for each TS, the systematic error b, the
random error σο and their uncertainties σa and σb are presented in the table 2.
Total
Station
Nominal
Uncertainty a σa
b
(arcsec)
σb
(arcsec)
σο
(arcsec)
Horizontal directions
A ±5'' 1.0000008 ±1.5·10-6
0.4'' ±1.3'' ±2.5''
B ±5'' 0.9999823 ±3.6·10-5
64.5'' ±3.0'' ±6.3''
C ±3'' 1.0000251 ±8.2·10-5
-29.3'' ±7.1'' ±15.2''
D ±6'' 0.9999993 ±2.3·10-6
2.4'' ±2.0'' ±4.2''
Vertical directions
A ±5'' 1.0000001 ±6.1·10-6
1.5'' ±2.4'' ±3.9''
B ±5'' 1.0000298 ±3.8·10-5
18.3'' ±4.2'' ±7.2''
C ±3'' 1.0000373 ±5.0·10-5
4.9'' ±4.1'' ±8.9''
D ±6'' 1.0000009 ±4.2·10-6
2.1'' ±1.3'' ±3.6''
Table 2: The results of the TSs check
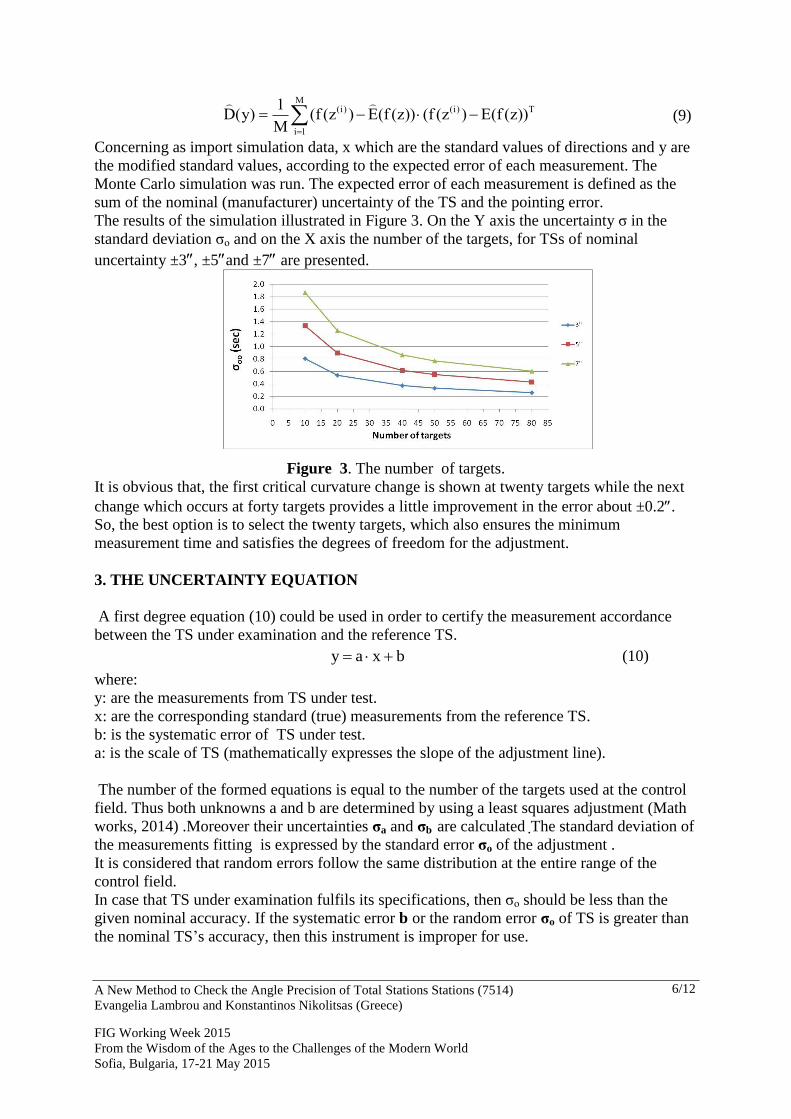
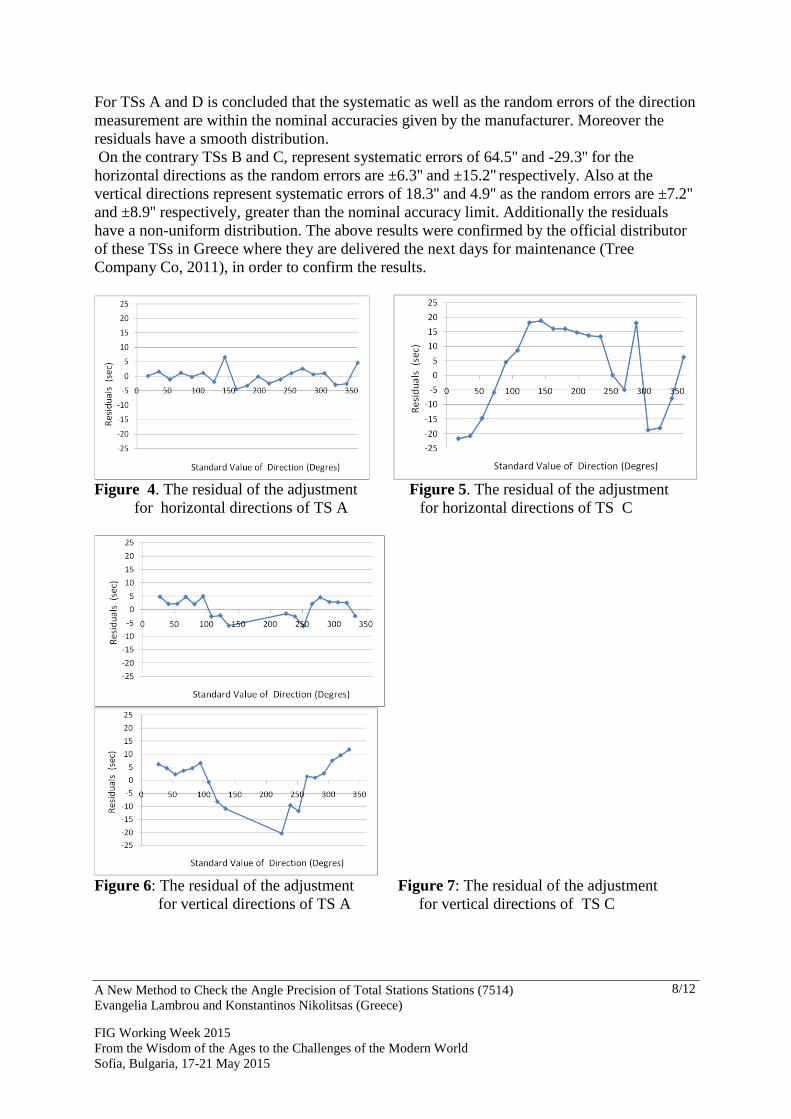
Figures 4, 5, 6 and 7 illustrate the residuals of the measurements’ adjustment for the
horizontal and vertical directions of TSs A and C.
A New Method to Check the Angle Precision of Total Stations Stations (7514)
Evangelia Lambrou and Konstantinos Nikolitsas (Greece)
FIG Working Week 2015
From the Wisdom of the Ages to the Challenges of the Modern World
Sofia, Bulgaria, 17-21 May 2015
8/12
For TSs A and D is concluded that the systematic as well as the random errors of the direction
measurement are within the nominal accuracies given by the manufacturer. Moreover the
residuals have a smooth distribution.
On the contrary TSs B and C, represent systematic errors of 64.5'' and -29.3'' for the
horizontal directions as the random errors are ±6.3'' and ±15.2'' respectively. Also at the
vertical directions represent systematic errors of 18.3'' and 4.9'' as the random errors are ±7.2''
and ±8.9'' respectively, greater than the nominal accuracy limit. Additionally the residuals
have a non-uniform distribution. The above results were confirmed by the official distributor
of these TSs in Greece where they are delivered the next days for maintenance (Tree
Company Co, 2011), in order to confirm the results.
Figure 4. The residual of the adjustment Figure 5. The residual of the adjustment
for horizontal directions of TS A for horizontal directions of TS C
Figure 6: The residual of the adjustment Figure 7: The residual of the adjustment
for vertical directions of TS A for vertical directions of TS C

A New Method to Check the Angle Precision of Total Stations Stations (7514)
Evangelia Lambrou and Konstantinos Nikolitsas (Greece)
FIG Working Week 2015
From the Wisdom of the Ages to the Challenges of the Modern World
Sofia, Bulgaria, 17-21 May 2015
9/12
5. CONCLUSIONS
By using the proposed method the achieved precision of the measured directions by the
TS is calculated .Moreover by this method any systematic error, which occurs due to a
damage of electronic measuring configuration, is detected by the uncertainty equation. Also
the scale of the direction measurements is calculated so that the normal operation of TS is
ensured. The control field installation is convenient, cost effective and quick organized.
The standard ("true") values which are indispensable for the procedure could be easily
acquired by several periodical measurements using a reference TS of ±0.5or a Laser
Tracker.The proposed method is convenient and time effective as it provides immediate and
reliable results.
Additionally the same simple first degree equation is used for the measurements’
elaboration of both horizontal and vertical directions. This is very practical and manageable.
As a comparison between the measurements acquired and the "true" values is applied,
the accreditation of TS is carried out.
The application indicates that TSs, A and D work within their nominal accuracies .On
the contrary TSs B and C are found out of their proper operation. This fact is confirmed by
the official distributor where they were delivered for maintenance (Tree Company Co, 2011)
A comparison of the suggested procedure with the recommended tests for TSs by ISO
(17123-3 and 17123-5) shows the following (ISO 17123, 2001).
The main advantage of the proposed method is that the ISO 17123-3 prescribes separate
measurements at different control fields and different separate mathematical procedures for
the horizontal and the vertical directions test respectively. The proposed method requires
simultaneous measurements at the same control field and the same method of measurements’
analysis by using the least squares method adjustment of the equation y=ax+b.
Both the present process and ISO 17123-3 use the original measurements of directions
to make the calculation as well as the statistical checks .On the contrary ISO 17123-5 uses the
sequence result, namely the coordinates. (Nikolitsas &Lambrou ,2010)
Moreover, both process use as norm the nominal accuracy which is given by the
manufacturer of TS, for all the statistical checks and the conclusions.
ISO 17123 tests underline that "these tests are intended to be field verifications of the
suitability of a particular instrument for the immediate task at hand and to satisfy the
requirements of other standards. They are not proposed as tests for acceptance or performance
evaluations that are more comprehensive in nature. " (ISO 17123 ,2001).
Thus ISO 17123-3 only certifies the internal precision of TS by using repeatable
measurements to targets without any comparison to standard values.
The field work needs about 1 hour for the measurements with the standard TS and about
half an hour for any TS under check, while the ISO procedure demands at least double or
triple this time. (Lambrou & Pantazis , 2004)
Consequently, it is proved that the proposed method could represent a new indoors
checking methodology for the metrology test of TSs by using appropriate targets and skilful
observers.
To ensure the quality of every geodetic application the appropriate choice of
instrumentation is critical. For this reason the accuracy provided by TS must be reliable. The
evolution of the technology in TS electronic machinery manufacturing has constrained the
majority of the apparent errors. Most of them are detected and corrected automatically.
Nevertheless TSs, due to their complicacy, are still sensitive to the influence of the external

A New Method to Check the Angle Precision of Total Stations Stations (7514)
Evangelia Lambrou and Konstantinos Nikolitsas (Greece)
FIG Working Week 2015
From the Wisdom of the Ages to the Challenges of the Modern World
Sofia, Bulgaria, 17-21 May 2015
10/12
parameters as the maintenance, the user treatment and the environmental conditions. Thus, the
imperative need of the detection, of gross systematic or random errors remains.
REFERENCES
Alkhatib, I. Neumann, H. Kutterer, (2009). "Uncertainty modeling of random and systematic
errors by means of Monte Carlo and fuzzy techniques", Journal of Applied geodesy 3 (2) 67-
79. BIMP, JCGM 101:2008., (2008) ." Evaluation of measurement data — supplement 1 to the "Guide to the expression of uncertainty in measurement" — Propagation of distributions using a Monte Carlo method"., 1st edition. http://www.bipm.org/en/publications/guides/gum.html ( Last accessed 20-12-2014) Doeblin E.O. (1995). "Engineering experimentation", McGraw Hill Publications. ISO 17123 (2001). Optics and optical instruments -- Field procedures for testing geodetic and surveying instruments -- Part 3: Theodolites., 1st edition 2001-12-01 http://www.iso.org/iso/home/store/catalogue_tc/catalogue_detail.htm?csnumber=30200 (Last accessed 20-12-2014) James F. (1980). "Monte Carlo theory and practice", Rep. Prog. Phys. 43 1145. Lambrou E.& Pantazis G., (2004). "Laboratorial tests of digital theodolites ", Proc. International FIG Symposium , "Modern technologies, education and professional practice in Geodesy and related fields", Sofia, Bulgaria, pp. 72 - 79. Lambrou Ε.& Pantazis G. (2010). "Applied Geodesy", Zitis publication ISBN 978-960-456-205-3, Athens. Leica Geosystems ,(2009). "White paper ΤΜ30, The Art of Achieving Highest Accuracy and Performance. " Printed in Switzerland 766425en – III.09 –INT –Copyright Leica Geosystems AG, Heerbrugg, Switzerland. Leica Geosystems ,(2010a). Technical Specifications TS15. Leica Geosystems ,(2010b)., "Accreditation - Producer Inspection Certificate M in accordance with DIN 55350-18-4.2.2", Switzerland. Leica Geosystems (2010c). Specification Data TPS series , TM30. Math works ,(2014). http://www.mathworks.com/help/curvefit/least-squares-fitting.html (Last accessed 20-12-2014) Nikolitsas K., Lambrou E., (2010) "Evaluation of the international standard ISO 17123 - 5", 3th National Conference of Metrology, Larnaca, Cyprus. Pantazis G. and Nikolitsas K.,(2011 ) ."Assessing the use of the light laser scanners and the Monte Carlo technique for the geometric surfaces documentation" FIG Working Week 2011,Bridging the Gap between Cultures Marrakech, Morocco. PDF ,(2014). http://www.britannica.com/EBchecked/topic/477530/probability-
theory/32785/Probability-density-functions Last accessed (30-12-2014) Princeton, (2014).

A New Method to Check the Angle Precision of Total Stations Stations (7514)
Evangelia Lambrou and Konstantinos Nikolitsas (Greece)
FIG Working Week 2015
From the Wisdom of the Ages to the Challenges of the Modern World
Sofia, Bulgaria, 17-21 May 2015
11/12
https://www.princeton.edu/~achaney/tmve/wiki100k/docs/Monte_Carlo_method.html Last accessed (30-12-2014) Topcon Corporation (2010). Specification Data for GTS series. Tree Company Co. (2011). "Metrological checking report for the total stations B and C", Athens.
US Army Corps of Engineers, (2002). "Structural Deformation Surveying", Engineer manual
1110-1009, Washington, 2002.
Woschitz H., Brunner K. F., Heister H., (2002). "Scale Determination of Digital Levelling
Systems using a Vertical Comparator. ", FIG XXII International Congress Washington, D.C.
USA.
BIOGRAPHICAL NOTES
Surname : LAMBROU First name : EVANGELIA Date of birth : 16 November 1965 Place of birth : Piraeus
1983 Graduated from the 2nd
high school of Piraeus. 1984 – 1990 Attended and graduated from the Rural & Surveying Engineering School
of the National Technical University in Athens. Mark 7.24 (max 10) 1992 Postgraduate scholar in the section of Topography of Rural & Surveying
Engineering School, National Technical University of Athens. 2003 Defended thesis Development of a methodology for astrogeodetic
determinations using Geodetic instruments, in the Rural & Surveying Engineering School, National Technical University of Athens.
2005 Lecturer at National Technical University of Athens 2010 Assistant Professor at National Technical University of Athens 2014 Associate Professor at National Technical University of Athens Research interests:
- Determining the geoid undulation N especially by using astrogeodetic leveling - GNSS - Geodetic metrology - Measure and monitoring deformations and displacements of structures and large
earth areas - Surveying and documenting monuments - Investigating the orientation of monuments - Determining the astronomical azimuth and coordinates Φ, Λ using digital geodetic
instruments. Publications and presentations: 50
Surname : NIKOLITSAS First name : KONSTANTINOS Date of birth : 16 February 1981
Place of birth : Athens
1998 Graduated from high school of Argos region – Argolida 1999 – 2004 Attended and graduated from the Rural & Surveying Engineering School
of the National Technical University in Athens. Mark 7.57(max 10)

A New Method to Check the Angle Precision of Total Stations Stations (7514)
Evangelia Lambrou and Konstantinos Nikolitsas (Greece)
FIG Working Week 2015
From the Wisdom of the Ages to the Challenges of the Modern World
Sofia, Bulgaria, 17-21 May 2015
12/12
2005 Postgraduate scholar in the section of Topography of Rural & Surveying Engineering School, National Technical University of Athens (P.h.d. Candidate)
Research interests: - Geodetic metrology - Measure and monitoring deformations and displacements of structures - Surveying and documenting monuments - Software programming
Publications and presentations: 10 Dr Evangelia Lambrou Associate Professor National Technical University of Athens School of Rural and Surveying Engineering Department of Topography, Laboratory of General Geodesy 9 Herron Polytechniou, Ζografos, 15780 Αthens GREECE Tel: 00302107722737 Fax : 00302107722728
Email : [email protected] Konstantinos Nikolitsas National Technical University of Athens School of Rural and Surveying Engineering Department of Topography, Laboratory of General Geodesy 9 Herron Polytechniou, Ζografos, 15780 Αthens GREECE Tel: 00302107722702 Fax : 00302107722728 Email:[email protected]