a new method for offline compensation of phase discrepancy
TRANSCRIPT

Rasekh, N., Wang, J., & Yuan, X. (2021). A New Method for OfflineCompensation of Phase Discrepancy in Measuring the Core LossWith Rectangular Voltage. IEEE Open Journal of the IndustrialElectronics Society, 2, 302 - 314. [9416837].https://doi.org/10.1109/OJIES.2021.3076137
Publisher's PDF, also known as Version of recordLicense (if available):CC BYLink to published version (if available):10.1109/OJIES.2021.3076137
Link to publication record in Explore Bristol ResearchPDF-document
This is the final published version of the article (version of record). It first appeared online via IEEE athttps://doi.org/10.1109/OJIES.2021.3076137 .Please refer to any applicable terms of use of the publisher.
University of Bristol - Explore Bristol ResearchGeneral rights
This document is made available in accordance with publisher policies. Please cite only thepublished version using the reference above. Full terms of use are available:http://www.bristol.ac.uk/red/research-policy/pure/user-guides/ebr-terms/

Received 8 March 2021; revised 15 April 2021; accepted 22 April 2021. Date of publication 27 April 2021;date of current version 19 May 2021. The review of this article was arranged by Associate Editor Oscar Lucia.
Digital Object Identifier 10.1109/OJIES.2021.3076137
A New Method for Offline Compensationof Phase Discrepancy in Measuring the Core
Loss With Rectangular VoltageNAVID RASEKH (Student Member, IEEE), JUN WANG (Member, IEEE),
AND XIBO YUAN (Senior Member, IEEE)Department of Electrical and Electronic Engineering, University of Bristol, Bristol BS8 1UB, U.K
CORRESPONDING AUTHOR: XIBO YUAN (e-mail: [email protected]).
This work was supported in part by the U.K. Royal Academy of Engineering.
ABSTRACT Nowadays accurate characterization of the magnetic component losses becomes increasinglyimportant in the design stage of power converters. As the main challenge in characterizing a magneticcomponent, the core loss is commonly measured through the two winding B-H loop measurement methodthat is susceptible to the phase discrepancy error, especially for low-permeability, low-loss cores. This paper,therefore, proposes a new offline method to compensate the phase discrepancy error in high-frequency coreloss measurement under rectangular voltage excitation. In the post-processing of measured waveforms, thephase discrepancy is compensated by shifting the measured current horizontally to align with a referencephase angle, which is found from an offline impedance sweep on the component-under-test and FFT analysis.As a result, the testing voltage and current waveforms can be measured without considering deskew at thetime of measuring. Additionally, this method is more accurate than calibration methods considering a fixedfrequency response (e.g., a deskew fixture), because it considers the frequency response across the wholespectrum. The proposed approach can be well applied for typical PWM converters with switching frequenciesup to hundreds of kilohertz, for which the effective voltage harmonics extend to a few megahertz range thatcan be well evaluated with an impedance analyzer. The presented method is experimentally verified againstthe existing partial cancellation method which is immune to phase discrepancy error.
INDEX TERMS B–H loop measurement, core loss, phase discrepancy error, magnetic losses, two-windingmethod.
I. INTRODUCTIONSubstantial advancement in high-speed, low-loss power semi-conductors enabled by the wide-bandgap material has beenpushing power converters to higher frequencies and higherpower densities in the past decade. Alongside the develop-ment of power semiconductors, magnetic components andtheir high-frequency losses, especially the core loss, have aconsiderable impact on the converter efficiency, power den-sity and temperature rises, which calls for accurate char-acterization and modelling. To characterize the core loss,there are mainly two ways, in general, to measure it em-pirically: the electrical method [1]–[4] and the calorimetric(thermal) method [1], [4], [5]. The principle of the calori-metric method is to enclose the component-under-test with a
near-adiabatic calorimetric container and measure the temper-ature rise between the inlet and outlet coolant to deduct thegenerated loss of the magnetic component. The calorimetricmethod is in general reliable and insensitive to the electricalnoises and parasitics in the measurement instruments, butits main drawback is the time-consuming process to reachthe thermal steady-state, which makes it difficult to measurethe high-frequency loss in a relatively short transition. Also,if the interest is the core loss alone, a complicated proce-dure needs to be applied to exclude the winding loss fromthe measured total loss of a magnetic component [1], [4],[5]. Therefore, the electrical techniques are still commonlyimplemented over the thermal methods due to the abovelimitations.
This work is licensed under a Creative Commons Attribution 4.0 License. For more information, see https://creativecommons.org/licenses/by/4.0/
302 VOLUME 2, 2021

FIGURE 1. Two-winding measurement method.
To characterize the high-frequency dynamic core losses, thetwo winding method as an electrical method is used exten-sively and considered as a universal process [2]. The coreloss measurement with two winding method is realized byintegrating the product of the open-circuit voltage drop vSec
across the secondary winding (sensing winding) of the mag-netic component under test (CUT) and the current iPri flowingthrough the primary winding as defined in (1)
PCore = N1
N2
1
T
∫ T
0iPri (t ) · vsec (t ) dt (1)
where T is the period of one cycle; N1 and N2 are the numbersof the primary and secondary winding turns, respectively.These signals are captured by the probes and digital oscillo-scope over time as shown in Fig. 1. The superiority of thetwo winding method is that it is simple to implement and ap-plicable for arbitrary wave excitation in both steady-state andtransient measurements, while it only measures the core lossand excludes the copper loss [3]. However, the two windingmethod is sensitive to the phase discrepancy as extensively re-ported in [3], [4], which is the difference between the true andmeasured phase shift between iPri and vSec. This phase erroris typically caused by the oscilloscope sampling resolution,trigger jitter, sensing resistor parasitic inductance, or probesdelay time, depending on the current sensing method, whichcan further deteriorate at higher frequencies. The presence ofthe phase discrepancy error is significant in the case of lowpermeability or gapped cores and low loss cores [4]. Hence,the phase discrepancy issue should be carefully addressed inhigh-frequency two-winding measurements.
Previous studies proposed several ways to compensate thephase discrepancy error for the two winding method. Onedirection is to apply the reactive voltage cancellation concept.Authors in [6] firstly proposed to use a capacitor to resonatecompletely with the magnetizing inductance of the CUT andtune out the reactive voltage to have an equivalent loss re-sistance to diminish the sensitivity of the phase discrepancy.However, this method suffers from the distortions in the caseof the high amplitude of excitation and the requirement of dif-ferent capacitors for each testing conditions [6]. [7] improvedthis approach by applying a series capacitor to precisely res-onate with the CUT at the fixed system frequency. However, itis complex for this method to exclude the winding loss to find
the exact core loss and challenging to find the core loss undera specific dc-biased current. Besides, this method is limitedto sinusoidal excitation, and it is an arduous task to changethe capacitor for every testing point with various resonantfrequencies.
Mu’s capacitive and inductive cancellation methods in [4],[8], [9] further improved the previous methods and combinedthem with the two winding method to exclude the windingloss. The concept is to remove the reactive voltage of theCUT by reducing θ from closely 90° to nearly 0°. Althoughthe capacitive method [4] is still only used for sinusoidalexcitation, by replacing the capacitor with an air-core or lowcore loss transformer, the inductive method can be utilizedfor any arbitrary excitation waveforms [8], [9]. However, asthe drawback of Mu’s approaches, the reference capacitor’scapacitance and the reference transformer’s magnetizing in-ductance are pivotal values, for which a small mismatch fromthe perfect cancellation will lead to a substantial error [10].Furthermore, it is a time-consuming process to delicately tunethe capacitor or transformer for various testing conditions.
Hou’s partial cancellation concept was brought up in [10]as an extension of Mu’s method. The fundamental concept ofthis method is to utilize the phase shift seen on the air-coretransformer to offset the phase shift seen in the measurementof the CUT loss. As demonstrated in [10], the requirement ofthe fine-tuned value of the cancellation component is mini-mized in this method. However, this method is only effectivefor systems with lower frequencies (e.g., < 5 MHz) comparedto Mu’s method, due to the considerable reference core losserrors [11], [12]. Furthermore, both Hou’s and Mu’s inductivecancellation methods are only applicable when the magnetiz-ing inductance of CUT is relatively low (e.g., < a few hun-dreds of nano-henries). If the magnetizing inductance of thematching air-core transformer needs to be high, its parasiticinductance and capacitance becomes significant, which canhave adverse effects on the waveforms and system accuracy[13].
A de-skew fixture is also available from the manufacturersof oscilloscopes and probes, e.g., Keysight U1880A, whichcan be used to calibrate the time delay between current andvoltage probes. The compensation is reflected in the deskewfunction of the oscilloscopes to shift the waveforms horizon-tally. Although the calibration is performed with rectangularwaveforms, this calibration is conducted with a fixed squarewave with fixed frequency and rising/falling slopes. As a con-sequence, there are still potential small errors and delay timesat other frequencies [14], [15]. In addition, the calibrationis typically conducted manually, which is subject to humanobjective error. Also, the de-skew tool board still has parasiticelements itself and may affect the calibration procedure [16].
Shimizu et al. proposed a technique in [17], [18] to com-pensate the phase discrepancy error in two-winding core lossmeasurement. In this method, a phase error of the measuringsystem is found with a reference low-inductance resistor. Thisphase error at each frequency of sinusoidal excitation is thephase difference between the phase angle measured by the
VOLUME 2, 2021 303

RASEKH ET AL.: NEW METHOD FOR OFFLINE COMPENSATION OF PHASE DISCREPANCY IN MEASURING THE CORE LOSS
B-H analyzer and the reference response of the resistor that isseparately evaluated by an impedance analyzer. This extractedphase error is then fitted to a function and saved in the B-H an-alyzer to correct the phase angle of measured current on eachfrequency harmonic through a Fourier function. The accuracyof this method is verified against a power meter. However, thereference noninductive resistor in this approach is consideredto have a linear impedance characteristic (constant parasiticinductance) while its capacitive component is ignored, whichmay introduce nonlinearity in the high-frequency range. Also,the impedance characterization is only conducted to 500 kHzin [17], [18].
To offer an alternative to compensate the phase discrepancyin core loss testing, a new offline method is proposed in thispaper as the contribution. The proposed approach is to findthe reference phase shift through an offline impedance fre-quency sweep on the magnetic-component-under-test usingan impedance analyzer, and harmonic analysis of the mea-sured testing voltage by fast Fourier transform (FFT). In short,the proposed method shifts the current waveform horizontallyin the offline post-processing utilizing a separately obtainedreference phase shift to align to the physical phase shift andreduce the phase discrepancy error. Compared with existingapproaches, the proposed method requires no additional can-celling components and can be conducted without consider-ing deskew at the time of measuring the waveforms. Thisapproach can accurately measure the magnetic componentlosses in a wide frequency range. The proposed approach canbe well applied for typical PWM converters with switchingfrequency up to hundreds of kilohertz, for which the effectiveharmonics extend to a few megahertz range that can be wellevaluated with an impedance analyzer.
Section II explains the phase discrepancy issues in the twowinding method. The proposed procedure is then discussed inSection III and experimentally verified in Section IV.
II. PHASE DISCREPANCY ISSUE IN TWO-WINDINGMEASUREMENTAs derived in [3], the relationship between the core lossmeasurement error in percentage with regards to the phasediscrepancy can be found by (2) for sinusoidal excitation:
E = PMeasured − PPhysical
PPhysical× 100%
= cos (θ + α) − cos (θ )
cos (θ )× 100% (2)
where E is the relative error in percentage of the measuredcore loss, θ is the actual phase shift in degrees between iPri andvSec, α is the phase error in the measurement of θ in degrees,and PMeasured and PPhysical are the measured core loss valueand the real core loss value, respectively. The relative error Eis sensitive to both θ and α. It can be seen in (2) that whenθ is near 90°, the relative core loss measurement error E canbecome significant even with a small α, mainly because the
FIGURE 2. CUT waveforms when the α is not zero.
denominator (the real core loss) is approaching zero. Equa-tions (3) to (5) demonstrate how the low permeability, lowloss cores influence the phase shift error [14], [15].
RCore ∝ 1
PCore(3)
XM = 2π f L = 2π fN2μ Ae
le(4)
θ = arctanRCore
XM∝ arctan
(1
μ PCore
)(5)
where RCore represents the core loss resistance, reactance XM
is the magnetizing impedance of the CUT, f is the operatingfrequency, L is the magnetizing inductance, Ae is the corecross-section area, le is the average magnetic length, μ isthe core permeability, and N is the number of winding turnsassuming N=N1=N2 for simplicity. Equation (5) shows thedependence of the θ on material properties, i.e., the corepermeability and core loss value, which shows θ and sub-sequently the phase discrepancy sensitivity will be enlargedwhen the CUT has lower values for μ and PCore.
These equations used in previous works are based on sinu-soidal waveforms, while power converters mostly operate un-der rectangular excitation voltages. Therefore, the phase errordistinctions between these two types of waveforms are alsoevaluated in this work. Fig. 2 shows the typical CUT voltageand current with a rectangular excitation voltage waveformand a slightly leading current (θ < 90°).
In power electronics applications, the CUT current cancontain a dc component. which can impact the dynamic coreloss and core permeability [19]. In (5), the core loss and corepermeability are correlated to the actual phase shift θ , whichwill subsequently correlate to the calculated relative error in(2). Note the dc-bias inherently does not affect the physicalphase shift of the measured waveforms. The dc-bias currentonly shifts the current in the vertical axis, and its impact onthe core loss is reflected as the dynamically changing perme-ability resulting in the more curvy shape of the current [20]rather than the change of phase angle.
The voltage is chosen as the reference of phase angles α
and θ . When α = 0° and θ = 90°, the rising/falling edge of
304 VOLUME 2, 2021

FIGURE 3. Loss measurement relative error in the variation of α for square(Sq) and sinusoidal (Sin) voltage excitations in the different values of θ.
the voltage is aligned to the trough/peak point of the currentand it can be expected that the measurement gives the realloss value, which is zero in this case. When α is negative,the measurement error becomes positive and the obtained lossis higher than the real loss. Vice versa, if α is positive, themeasurement error becomes negative, and the measured lossis lower than the actual core loss.
Fig. 3 illustrates the calculated relative error E when theα changes between zero to one degree for both sinusoidaland rectangular excitation and various θ . The first observationis that the phase shift error for square excitation shows littledifference to the sinusoidal case. As the second observation, itshould be highlighted that when θ is fixed, the relative error Eis linearly proportional to the phase discrepancy α. Althoughthe slopes in Fig. 3 seems steeper at a higher θ , this is dueto the denominator in (2) approaching zero as θ approaching90°. In other words, the sensitivity between the measured coreloss and the phase discrepancy α is a linear relationship forone measurement point, which is also reported in [21], [22].The analysis above for the square wave is conducted with theduty cycle of the excitation voltage of 50%. The sensitivity oftwo winding method as well as phase-shift error for other dutycycles can further increase as investigated in [13].
As introduced, the main cause of the phase discrepancyerror in measuring core loss with the two-winding methodis the current measuring instrument. In the next section, anovel approach will be presented to compensate this phasediscrepancy error.
III. PROPOSED OFFLINE COMPENSATION METHOD OFPHASE DISCREPANCYFor characterizing the core loss, existing methods experimen-tally measure it through either sinusoidal or rectangular exci-tation voltages [23]–[27]. Recently, the loss map approach in-troduced in [18], [20] advocates measuring the core loss withrectangular excitation voltage and dc-biased current, which isstate-of-the-art progress. For measuring the core loss as wellas creating a loss map with the two winding method, the phase
discrepancy as the major concern will be compensated with anovel method as follows.
A. CORE LOSS MEASUREMENTIn the two-winding method, the core loss is obtained by inte-grating the product of the secondary voltage and the primarycurrent of the CUT, which reflects the area of a closed B–Hloop. To excite the CUT, a half-bridge structure proposedin [28]–[30] is utilized in this work, which is shown withthe experiment setup in Appendix A. A discontinuous testprocedure called triple pulse test (TPT) is applied, which isproposed in [28], [29]. The concept of TPT is to test limitedcycles only and prevent unnecessary continuous operations.The temperature in TPT is easy to control because it does notintroduce any temperature rise in the testing due to the shorttesting transition.
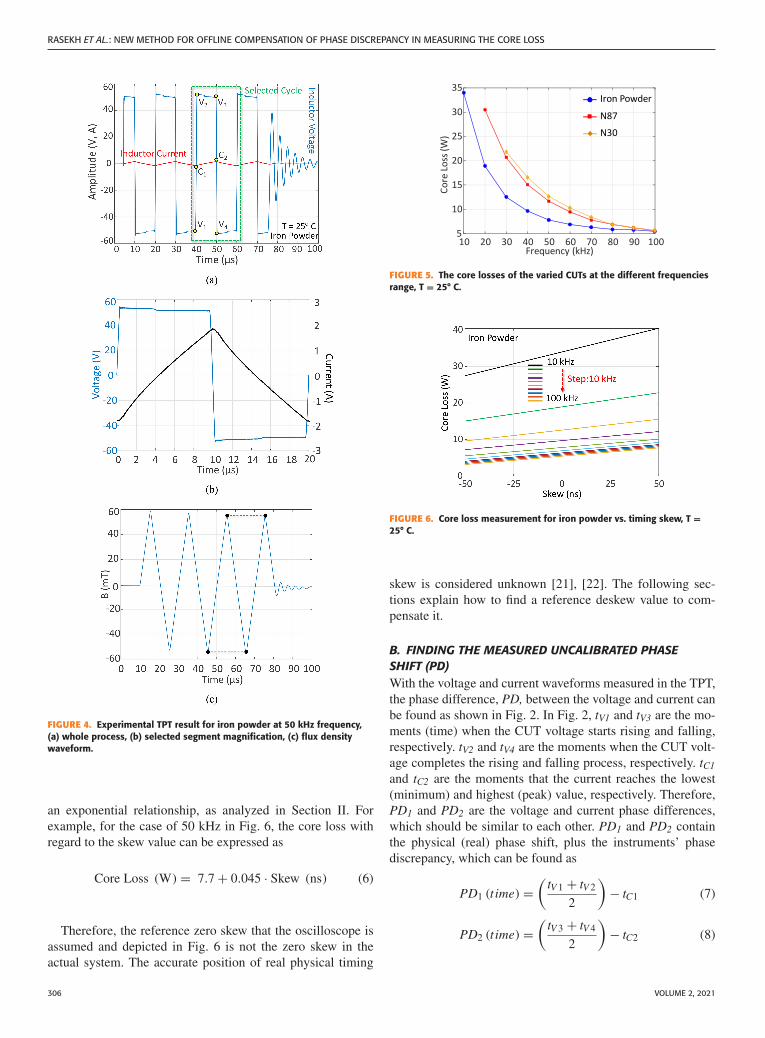
In this work, three types of popular core material are char-acterized through three sample inductors. Their rated induc-tances are selected at around 100 μH to have similar mag-netizing inductances in the frequency range between 10 to100 kHz. The waveforms are measured by high-bandwidthvoltage and current probes. The specifications of the instru-ments, inductors and other test rig components are shown inAppendix A. As discussed in [28], [29], the number of re-quired cycles for TPT may differ depending on the CUT. Thiswork used four pulses to stabilize the CUT to reach the steady-state. The core loss is measured with zero dc-biased currentsin this section for simplicity, because the dc-bias current itselfdoes not affect the phase shift of the probes and inductorwaveforms, and the peak value of the measured signal hasno impact on the phase discrepancy error [15]. The B-H loopis found from the measured signals, for which the detailedformulas can be found in Appendix A. Fig. 4(a) depicted theexperimental TPT result for the iron powder inductor with 50kHz frequency and ±50 V inductor voltage, for which theselected segment is magnified in Fig. 4(b). Fig. 4(c) illus-trates the corresponding flux density swing (�B) for the ironpowder core at 50 kHz, in which the alignment of the blackdots proves that the system reached the steady-state for theselected cycle. The measured core losses of the CUTs in thefrequency range of 10 to 100 kHz are shown in Fig. 5. Whilesurveying various frequencies, the applied inductor voltage iskept constant (e.g., 50 V) regardless of the frequency incre-ment, which leads to the reduction in flux density swing athigher frequencies. Hence, the core loss decreases with theincrease of the frequency in Fig. 5 due to smaller �B at higherfrequencies. Additionally, the N87 at 10 kHz and N30 at 10and 20 kHz are saturated due to the large value of their �B.Therefore, these results are omitted from Fig. 5.
However, the measured loss is not the real loss that thephysical circuit has, owing to the phase discrepancy error,and as a consequence, the value of the probe phase discrep-ancy α is not easy to recognize during the measurement. Byphase-shifting the current deliberately, Fig. 6 illustrates howthe core loss changes as α (skew) varies. This figure showsthe relation between the core loss and α is linear, rather than
VOLUME 2, 2021 305
RASEKH ET AL.: NEW METHOD FOR OFFLINE COMPENSATION OF PHASE DISCREPANCY IN MEASURING THE CORE LOSS
FIGURE 4. Experimental TPT result for iron powder at 50 kHz frequency,(a) whole process, (b) selected segment magnification, (c) flux densitywaveform.
an exponential relationship, as analyzed in Section II. Forexample, for the case of 50 kHz in Fig. 6, the core loss withregard to the skew value can be expressed as
Core Loss (W) = 7.7 + 0.045 · Skew (ns) (6)
Therefore, the reference zero skew that the oscilloscope isassumed and depicted in Fig. 6 is not the zero skew in theactual system. The accurate position of real physical timing
FIGURE 5. The core losses of the varied CUTs at the different frequenciesrange, T = 25° C.
FIGURE 6. Core loss measurement for iron powder vs. timing skew, T =25° C.
skew is considered unknown [21], [22]. The following sec-tions explain how to find a reference deskew value to com-pensate it.
B. FINDING THE MEASURED UNCALIBRATED PHASESHIFT (PD)With the voltage and current waveforms measured in the TPT,the phase difference, PD, between the voltage and current canbe found as shown in Fig. 2. In Fig. 2, tV1 and tV3 are the mo-ments (time) when the CUT voltage starts rising and falling,respectively. tV2 and tV4 are the moments when the CUT volt-age completes the rising and falling process, respectively. tC1
and tC2 are the moments that the current reaches the lowest(minimum) and highest (peak) value, respectively. Therefore,PD1 and PD2 are the voltage and current phase differences,which should be similar to each other. PD1 and PD2 containthe physical (real) phase shift, plus the instruments’ phasediscrepancy, which can be found as
PD1 (t ime) =(
tV 1 + tV 2
2
)− tC1 (7)
PD2 (t ime) =(
tV 3 + tV 4
2
)− tC2 (8)
306 VOLUME 2, 2021

FIGURE 7. Fourier analysis Vsec(n) of one selected rectangular voltagecycle shown in Fig. 4(b) of the 50 kHz rectangular voltage.
The reason for using the tV1 to tV4 instead of the voltagezero crossing moments is that the inductor voltage may havea dc offset. Besides, since the experimental voltage rising orfalling edges are not completely straight lines, by averagingbetween the tV1, tV2 or tV3, tV4; the voltage and current phasedifferences (PD1 and PD2) are captured more reliably. Finally,to minimize the probable errors, by averaging PD1 and PD2,the experimental uncalibrated phase shift (PD) is calculatedas
PD = 1
2(PD1 + PD2) (9)
To minimize the impact of random measurement errors,e.g., noises, the TPT result at each excitation frequency is themean of 16 repeated runs in this work. Based on experimentalobservation, 16 samples is sufficient to result in smooth wave-forms to accurately work out the core loss and uncalibratedphase shift PD. Increasing the number of samples any furtherdoes not significantly change the results anymore.
C. FINDING THE REFERENCE PHASE SHIFT (PS_REF)After finding the uncalibrated phase shift (PD), the nextstep is to find the reference phase shift (PS_Ref) so that thewaveforms can be manipulated to move towards the physicalphase shift (PS). Firstly, by performing fast Fourier transform(FFT), the amplitudes of each harmonic of the inductor volt-age shown in Fig. 4(b) can be found for one cycle. Fig. 7displays the FFT results in the frequency domain from theselected segment of voltage at 50 kHz. In this case, the FFT iscalculated up to the 51st harmonic, since the amplitude of thefurther harmonics converges to zero as shown in Fig. 7.
The next step is to perform an impedance frequency sweepthrough a precision impedance analyzer, e.g., Wayne Kerr6500B in this work. Fig. 8 shows the impedance of theiron powder inductor at each frequency (ZL(n)), when theimpedance analyzer assumes the components (resistance andinductance) are connected in parallel.
To protect the accuracy of impedance measurement at thefrequency level of a hundred MHz, it is ensured that nolarge metal objects are near the magnetic component during
FIGURE 8. Inductor impedance spectrum ZL(n) ploted in resistance andinductance.
FIGURE 9. Regenerated iron powder voltage and current waveforms at50 kHz frequency for the selected segment of TPT.
the measurement [31]. According to the impedance analyzerdatasheet, the measurement accuracy of impedance is ±0.05%with frequencies up to 120 MHz. As can be seen from Fig. 7,the effective harmonic component of the typical rectangularvoltage seen in PWM converters would typically reach severalMHz, which is mainly contributed by the rising/falling edgeof the PWM waveform. Therefore, a small discrepancy in thevery high-frequency region (e.g., 100 MHz) will not impactthe accuracy. Moreover, by virtue of TPT, both the experimentand impedance analyzer procedures are performed at roomtemperature (T = 25° C), which avoids the discrepancy causedby the temperature factor.
After finding the impedance spectrum and the experimen-tally applied voltage on CUT, a virtual current i’ on the induc-tor can be regenerated through (10) by adding up the currentresponses from each frequency/harmonic. An elaboration ofthe equation can be found in Appendix B.
i′ =n=∞∑n=1
V(n)
ZL(n)(10)
Fig. 9 depicted the regenerated iron powder voltage andcurrent waveforms at 50 kHz. By identifying the peak pointof the regenerated inductor current in Fig. 9, a reference phaseshift (PS_Ref) in nanoseconds can be found. Locating the peak
VOLUME 2, 2021 307

RASEKH ET AL.: NEW METHOD FOR OFFLINE COMPENSATION OF PHASE DISCREPANCY IN MEASURING THE CORE LOSS
point moment in this stage is easier compared to analyzing theexperimental waveform, which is implemented by detectingthe highest value of the regenerated current in the coding andrecording the corresponding time stamp.
The final step is to horizontally shift the experimentallymeasured current to the point where its phase shift with regardto the inductor voltage equals to the reference PS_Ref. Thisstep is performed in MATLAB by applying a horizontal offsetPS_Com (=PD – PS_Ref) on the current waveform. This stepis similar to the de-skew function on the oscilloscope, whichapplies a time offset (horizontal axis) on one channel of signalin relative to the reference. The current can be shifted likeFig. 6 for each frequency to find the core loss. Hence, bycalculating the equation of each line function and knowingthe PS_Com value, the new error-free core loss can be recal-culated similar to (6). For example, for the case in Fig. 6 at50 kHz, the uncalibrated phase shift is found as 93.05 ns andthe reference phase shift PS_ref is calculated as 69.90 ns. Inthis case, the PS_Com is 23.15 ns. After this manipulation,the compensated pair of inductor voltage and current can beconsidered to have a phase shift that is aligned to the physicalphase shift.
Note between Figs. 9 and 4(b), the shapes of the measuredand regenerated voltages show a slight difference, which iscaused by the Fast Fourier Transform (FFT). Firstly, FFT ide-ally requires an integer number of cycles and no discontinuityat the endpoints of the data record [32], [33], which may notbe perfectly satisfied in the studied segment. According to[34], there are also other possible sources of errors in FFT cal-culation such as (1) instability associated with factorization;(2) errors in the sine/cosine as twiddle factors; (3) roundofferrors. Secondly, the measured voltage waveform containsa wide range of harmonics, while the frequency range ofFFT calculation is limited, which can be another source oferror. Thirdly, the Gibbs phenomenon [35] in FFT is also apossible cause for this difference. The experimental voltagewaveform contains asymmetric ringings and overshoots nearthe discontinuity. Depending on the harmonic order calcu-lated, these ringings/overshoots are pushed to the disconti-nuity edge in the FFT process in a symmetric manner. Nev-ertheless, these FFT errors do not cause the relocation/shiftof the zero-crossing point of regenerated voltage, since thebefore/after zero-crossings still overlap as we evaluated. Inother words, although the shape of regenerated voltage showsa slight change, it does not affect the accuracy of the proposedapproach in finding the reference phase angle.
In principle, the proposed approach is not sensitive to thedynamic inductance changes during the online testing (e.g.,saturation at a high current level or dynamic permeabilitychange), because the turning point of the current and zero-crossing point of the falling/rising edge of the inductor voltageare not changed for obtaining the PD of the proposed methodin this case. Besides, this method is tied up to specific induc-tors (fixed core, winding, and inductance). For different in-ductor designs with different inductance, the impedance cali-bration needs to be redone. Additionally, the proposed method
TABLE 1. Summary of Phase Variables
FIGURE 10. The procedure of offline compensation of phase discrepancy.
should be redone when the core properties are changed suchas size and material, even if it leads to the same value ofinductance. Since changing the core specification can affectthe core and winding losses, these variations are reflected inthe waveforms and the quality factor of the inductor, whichleads to a different reference phase angle. There are manystandardized inductors supplied these days, which means onlyone or a few representative samples need to be tested in thisway to represent the property of a whole batch of inductorswith the same core and winding arrangements [30].
Table 1 summarizes the phase variables involved in theproposed offline compensation method.
D. RECALCULATE CORE LOSS WITH THE PHASEDISCREPANCY COMPENSATEDWith the phase shift of the current compensated, the coreloss can be recalculated with the phase discrepancy error sig-nificantly reduced. Fig. 10 shows a flowchart, summarizing
308 VOLUME 2, 2021

TABLE 2. Experimental Results of Tested Core Loss, Offline Compensated ResultsOver Uncompensated Results
the whole process of the proposed approach. In short, theproposed method shifts the current waveform horizontally inthe offline post-processing utilizing the reference phase shiftPS_Ref found from the measured ZL and V and the regener-ated i’, in order to align to the physical phase shift PS andreduce the phase discrepancy error. The “offline” feature ofthe proposed approach is referring to where the phase discrep-ancy calibration is performed, for which the proposed methodis performed in the post-processing stage after the measure-ment of the waveform has been completed with the mainmeasuring/excitation equipment turned off. In comparison,the deskew method (e.g., using a calibration resistor/tool) isperformed on the oscilloscope, which is perceived as an onlinedeskew value (e.g., 5 ns). This feature of the proposed methodmeans that the phase discrepancy problem does not need to beconsidered at the time of capturing the waveform, because itcan be later compensated after the high-power measurementand excitation system is turned off.
Note the proposed method can also be applied for mul-tilevel voltage waveforms, for which the calibration processwould not be fundamentally different. Because the fundamen-tal concept of the proposed approach is to align the voltagerising/ falling edge moments and the current turning pointmoments, for which the PD should be consistent for all theedges in multilevel voltage waveforms.
Table 2 illustrates the experimental comparison of offlinecompensated results against uncompensated results for threeinductors tested with ±50V square wave and various frequen-cies, which are calculated by (11) in percentage, similar to (2).
Difference = PUncompensated − PCompensated
PCompensated× 100% (11)
The results show that for inductor 1 with an iron powdercore, the difference is more significant than the other twoinductors with ferrite cores. The reason is that the microscopicair gaps distributed in the iron powder core material reduceits core permeability and increase the measurement sensitiv-ity to the skew of probes according to equation (2) and (5).In contrast, the ferrite cores’ permeability is higher than theiron powder core, which leads to less sensitivity to the probe
FIGURE 11. Experimentally measured B–H loops at 50 kHz for the Ironpowder for three different cases, T = 25° C.
skew in testing inductor 2 and 3. Similarly, the deviations ininductor 3 are better than inductor 2, because the permeabilityof N30 is higher than N87.
As the conventional approach, a deskew calibration can beperformed on the oscilloscope before the testing, e.g., througha deskew fixture, Keysight U1880A. This conventional ap-proach is compared with the proposed offline compensationmethod as shown in Fig. 11 depicting the B–H loops excitedat 50 kHz frequency for inductor 1 with three cases: (1) uncal-ibrated (blue trace) (2) calibrated with deskew fixture (blacktrace) (3) calibrated with proposed method (red trace).
In this case, the obtained PD for the deskew case is about0.035° (1.95 ns) leading from the PS_Ref, the value of themeasured loss in the case calibrated with deskew fixture islarger than the case with offline compensation. By calculatingthe equation similarly to (6) for this case, the loss is correctedfrom 8.9 to 8.8 watt and the difference is at about 1.1%.However, if the iron powder core is not calibrated by thedeskew tool, according to Table 2, the difference between un-compensated results and the offline compensated results at 50kHz reaches 11.9%. This observation shows that the deskewtool can decrease the phase discrepancy to a degree that is veryclose to the proposed offline compensation method.
Fig. 12 depicts the compensated phase shift PS_Com (ns) inthe tested cases with various excitation frequency for inductor1. The results show the difference between the three compen-sation cases: (1) uncompensated (blue trace) (2) compensatedwith deskew fixture (black trace) (3) compensated with theproposed method (red trace, the reference). The results showthat the proposed method and the deskew fixture methodshows close compensation values, but they show differentcompensation manner at various frequencies. The proposedmethod should be considered more accurate in this case be-cause it considers the frequency response across the spectrum.In contrast, the deskew fixture only performs the calibrationwith a fixed square wave featuring fixed rising/falling edge,amplitude and frequency.
[3] discussed that the phase response characteristics ofdifferent current probes (or current-sense resistors) vary at
VOLUME 2, 2021 309

RASEKH ET AL.: NEW METHOD FOR OFFLINE COMPENSATION OF PHASE DISCREPANCY IN MEASURING THE CORE LOSS
FIGURE 12. Compensated phase shift PS_Com (ns) obtained from theproposed method for inductor 1 in the different cases, T = 25° C.
various frequencies, which impacts the accuracy of the coreloss measurement. According to equation (5) for one spe-cific core, the core loss measurement is more sensitive tophase discrepancy error at low flux densities because of thepresence of permeability in this equation [15]. Hence, fora particular frequency, the phase discrepancy error is differ-ent for various flux density values. Consequently, both thecharacteristics of the current probe and variation of the fluxdensity affect the phase shift error in a nonlinear form acrossthe frequency spectrum. Conventionally, phase compensationshave been applied based on a linear error function with thefrequency, similar to the deskew tool’s case in Fig. 12. But,the phase error for each test has a nonlinear relationship withthe frequency as also reported in [17], [18], and [3]. In con-trast, the proposed method equivalently provides a non-linearcompensation against various frequency as shown in Fig. 12,given the responses at various frequencies are captured inthe impedance analyzer. The next section will validate theaccuracy of the proposed method.
IV. EXPERIMENTAL VERIFICATIONIn this section, with comparison to Hou’s partial cancella-tion method presented in [10], the accuracy of the proposedmethod is verified. As one of the reactive voltage cancellingapproaches introduced in section I, the fundamental conceptof Hou’s method is removing the reactive voltage of the CUTby using an air-core transformer, which reduces the phasedifference between the CUT voltage and current from closely90° to nearly 0°. Therefore, Hou’s method is nearly immuneto the phase discrepancy error, from which the results can beconsidered as the value that is closest to the physical loss.Hence, this work applies Hou’s partial cancellation methodto verify the proposed approach. Fig. 13 shows the equivalentcircuit of the partial inductive cancellation method, which isutilized in this section.
For square voltage excitation in Hou’s method, the core losswhich is not sensitive to the phase discrepancy can be attained
FIGURE 13. Equivalent circuit of the partial inductive cancellation.
TABLE 3. Parameters of the Inductor 4 and Air-Core Transformer
as follows (N1=N2)
PCore = 1
T
∫ T
0iPri (t ) .vSec (t ) dt − 1
k
1
T
∫ T
0iPri (t ) .vL (t ) dt
(12)
k = VLP
VSecP(13)
where k is the cancellation factor, which demonstrates theratio of cancelled reactive voltage to the total reactive voltage.VLP and VSecP are the peak-to-peak values of vL and vSec
shown in Fig. 13, respectively.To form the air-core transformer, the coils are wound on
a plastic tube or cardboard, etc. An iron powder inductor(inductor 4) with relatively smaller inductance is measuredby applying Hou’s method with an air-core transformer, forwhich the parameters are listed in Table 3. The reason for us-ing another inductor is due to the limitation of Hou’s methodthat the CUT’s magnetizing inductance must be small enoughconsidering the matching air-core transformer’s parasitic ele-ments, which is discussed previously in section I.
By repeating the TPT, the core loss in various frequenciescan be found at room temperature (T = 25° C) through thecircuit in Fig. 13, (12), and components/instruments listed inTable 6. Fig. 14 depicts the experimental waveforms for the
310 VOLUME 2, 2021

TABLE 4. Experimental Results of the Iron Powder Core and the Air-CoreTransformer in Proposed and Hou’s Methods
TABLE AI. Parameters of the Inductors
TABLE AII. Components and Instruments in the Test Rig
test at 100 kHz frequency, which shows the voltages of theinductor 4 (vSec), air-core transformer (VL), and the systemcurrent (iPri). Since the voltage probes are equivalent to eachother, the phase delay between the two voltage channels canbe ignored [2], [5].
Table 4 illustrates the results of the proposed method com-pared to Hou’s method. Very low differences between the twomethods are found below 0.3%, and the results at differentfrequencies show that the proposed method correctly follows
FIGURE 14. Experimental TPT waveforms for iron powder inductor andair-core transformer at 100 kHz frequency, T = 25° C.
Hou’s method. The cancellation factor, in this case, is around0.4 for each frequency, and as reported in [10], the maximumerror that k can reach is about 0.4%, which is insignificantand neglectable. Note comparing to the inductor 1 case inTable 2, the uncompensated phase shift error is reduced in theinductor 4 case, because the actual phase (θ ) of the inductor isdecreased as it becomes lossier.
To prove that the dc-bias current amplitude does not affectthe proposed method, the dc-bias current is changed to nearlyzero in separate testings, in contrast to the three cases shownin Table 4. In these additional testings, the obtained PS_Comat nearly zero dc-bias current has a difference of less than 0.5ns compared to the dc-biased case in Table 4 for the threetested frequencies. Also, the differences between the proposedmethod and Hou’s method with and without the dc-bias cur-rent are all below 0.3%. At zero dc bias current, the relativedifferences compared to Hou’s method are 0.25%, 0.24% and0.15% in the tested 100, 125, and 150 kHz cases, respectively,which also asserted the accuracy of the presented method at adc-biased case.
Overall, this comparison indicates that the proposedmethod can correctly compensate the phase discrepancy andyield an accurate core loss that is nearly identical to the resultsfrom Hou’s method (<0.3% difference). As introduced, Hou’smethod is insensitive to the phase discrepancy and henceits results are considered as the most accurate baseline toverify the proposed approach. Although, Hou’s method alsohas inherent errors such as the errors caused by the parasiticcapacitance of the air-core transformer interwinding capaci-tance, and a voltage probe input capacitance, as discussed in[10]–[12]. It should be highlighted that the tested iron powderinductor has low permeability, while the proposed method stillachieved small differences with respect to Hou’s method.
One advantage of the proposed method is that it can beused when the magnetizing inductance of the CUT has highervalues compared to Hou’s method. Hou’s method is limited tothe cases with magnetizing inductances at a few hundreds ofnano-henries, otherwise, the inductance would be too large for
VOLUME 2, 2021 311

RASEKH ET AL.: NEW METHOD FOR OFFLINE COMPENSATION OF PHASE DISCREPANCY IN MEASURING THE CORE LOSS
the air-core transformer to match considering the parasitics.Therefore, the proposed method has superiority compared tothe other reactive voltage cancellation methods for applica-tions with typically up to a few hundred kilohertz, since powerconverter applications have comparably higher magnetizinginductances values in this case [36] (e.g., 50 ∼ 1000 μH).If the switching frequency of the converter is higher than afew MHz, it is typical to use air-cored inductors with no coreloss to characterize. In applications with a high switchingfrequency (e.g., >10 MHz), the required inductance can beas small as 10 nH, such as the presented inductor in [37],which can be easily satisfied by coreless inductors. In thiscase, there is no core loss to measure, hence this contextis not the targeted application background of the proposedmethod. The proposed approach only relies on the originalcomponent-under-test, which is typically a cored componentwith insignificant winding capacitance. An air-core trans-former is avoided in the proposed approach in contrast toHou’s approach, while its parasitic elements can underminethe accuracy at the high-frequency range (e.g., >5 MHz).
Note the results in Table 4 covers harmonic componentsreaching the MHz range (similar to the case in Fig. 7), whilethe reactive cancellation method still highly agrees with theproposed approach. The main challenge in the MHz range forthe proposed method is the effective frequency bandwidth ofthe measurement instruments to accurately capture the high-frequency characteristics in both the measured waveforms andthe impedance sweep of the magnetic component. In theory,if the instruments are good enough, the proposed approachshould offer high-precision compensation in any frequencyrange. Even if the fundamental frequency (i.e., the mainswitching frequency) of the square wave reaches 4 MHz, thesignificant harmonics (e.g., up to 30th) can still be capturedby the 120 MHz impedance analyzer used in this work.
V. CONCLUSIONThis paper has proposed a new approach to address the phasediscrepancy issue in measuring the core loss with rectangu-lar voltage. The proposed approach enables the engineers toaccurately characterize the core loss with the two-windingmethod over a wide frequency range. A reference phase shift(PS_Ref) is found from an impedance frequency sweep on themagnetic-component-under-test to correct the horizontal po-sition of the current waveform in the offline post-processing.Additionally, since the two-winding method can also be uti-lized to measure the copper loss and total loss of a magneticcomponent, this method is also valid in these contexts todecrease phase discrepancy error.
The proposed method is experimentally verified againstthe partial inductive cancellation method with and withoutthe dc-bias condition, which shows consistent results. Themain challenge for the proposed approach in the higher fre-quencies range (e.g., tens of MHz) is the effective frequencybandwidth of the measurement instruments, i.e., the volt-age/current probes and the impedance analyzer. In summary,the proposed method features the following merits:
FIGURE AI. Simplified schematic of the power stage.
� Can be easily implemented to measure the error-free corelosses exposed in rectangular excitation voltages.
� Waveform measurements can be done without consider-ing the deskew at the time of measuring. The phase cor-rection is conducted later in the offline post-processingas long as the magnetic component is preserved.
� Dynamic compensation against a wide frequency range.� No need to build the cancelling component in the re-
active voltage cancellation methods, such as the refer-ence air-core transformer, low loss material transformeror compensation capacitors, which are associated withconcerns on their parasitic elements.
� Fewer signals to measure, and has no limitation on exci-tation values and dc-biased current.
APPENDIX A. CORE LOSS MEASUREMENT AND SYSTEMSPECIFICATIONSThe measured data of secondary winding voltage and primarywinding current are captured and post-processed by computersoftware, such as MATLAB, to found the core loss throughexpressions (A1)–(A3).
H (t ) = N1 . iPri (t )
le(A1)
B (t ) = 1
N2Ae
∫ T
0vSec (t ) dt (A2)
PCore = N1
N2
1
T
∫ T
0iPri (t ) .vSec (t ) dt = Aele
1
T
∫H dB
(A3)
To excite the CUT, a half-bridge structure is utilized anddepicted in Fig. A1 [28]–[30]. This structure enables the com-pensation of the asymmetric square voltage caused by thedevice voltage drops, just by adjusting the output voltages ofthe two dc power supplies (VDC1 and VDC2). The symmet-ric voltage excitation helps to form a closed B-H loop. Theexperiment setup is built and shown in Fig. A2, where the
312 VOLUME 2, 2021
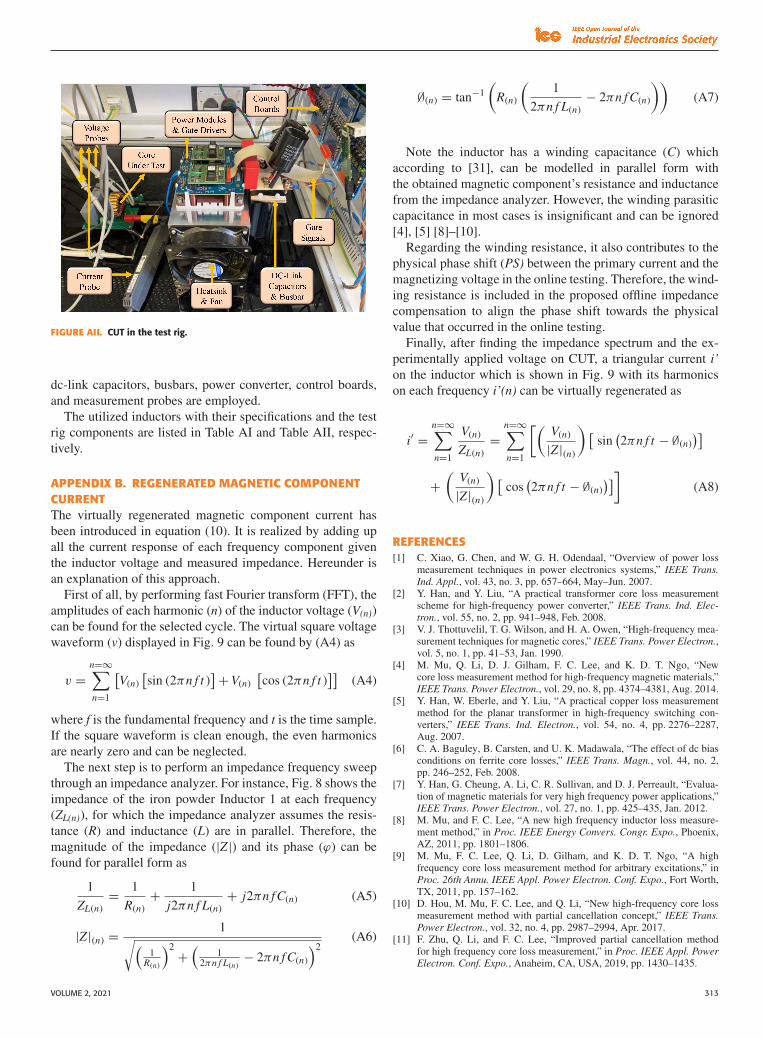
FIGURE AII. CUT in the test rig.
dc-link capacitors, busbars, power converter, control boards,and measurement probes are employed.
The utilized inductors with their specifications and the testrig components are listed in Table AI and Table AII, respec-tively.
APPENDIX B. REGENERATED MAGNETIC COMPONENTCURRENTThe virtually regenerated magnetic component current hasbeen introduced in equation (10). It is realized by adding upall the current response of each frequency component giventhe inductor voltage and measured impedance. Hereunder isan explanation of this approach.
First of all, by performing fast Fourier transform (FFT), theamplitudes of each harmonic (n) of the inductor voltage (V(n))can be found for the selected cycle. The virtual square voltagewaveform (v) displayed in Fig. 9 can be found by (A4) as
v =n=∞∑n=1
[V(n)
[sin (2πn f t )
] + V(n)[cos (2πn f t )
]](A4)
where f is the fundamental frequency and t is the time sample.If the square waveform is clean enough, the even harmonicsare nearly zero and can be neglected.
The next step is to perform an impedance frequency sweepthrough an impedance analyzer. For instance, Fig. 8 shows theimpedance of the iron powder Inductor 1 at each frequency(ZL(n)), for which the impedance analyzer assumes the resis-tance (R) and inductance (L) are in parallel. Therefore, themagnitude of the impedance (|Z|) and its phase (ϕ) can befound for parallel form as
1
ZL(n)= 1
R(n)+ 1
j2πn f L(n)+ j2πn f C(n) (A5)
|Z|(n) = 1√(1
R(n)
)2 +(
12πn f L(n)
− 2πn f C(n)
)2(A6)
∅(n) = tan−1(
R(n)
(1
2πn f L(n)− 2πn f C(n)
))(A7)
Note the inductor has a winding capacitance (C) whichaccording to [31], can be modelled in parallel form withthe obtained magnetic component’s resistance and inductancefrom the impedance analyzer. However, the winding parasiticcapacitance in most cases is insignificant and can be ignored[4], [5] [8]–[10].
Regarding the winding resistance, it also contributes to thephysical phase shift (PS) between the primary current and themagnetizing voltage in the online testing. Therefore, the wind-ing resistance is included in the proposed offline impedancecompensation to align the phase shift towards the physicalvalue that occurred in the online testing.
Finally, after finding the impedance spectrum and the ex-perimentally applied voltage on CUT, a triangular current i’on the inductor which is shown in Fig. 9 with its harmonicson each frequency i’(n) can be virtually regenerated as
i′ =n=∞∑n=1
V(n)
ZL(n)=
n=∞∑n=1
[(V(n)
|Z|(n)
) [sin
(2πn f t − ∅(n)
)]
+(
V(n)
|Z|(n)
) [cos
(2πn f t − ∅(n)
)]](A8)
REFERENCES[1] C. Xiao, G. Chen, and W. G. H. Odendaal, “Overview of power loss
measurement techniques in power electronics systems,” IEEE Trans.Ind. Appl., vol. 43, no. 3, pp. 657–664, May–Jun. 2007.
[2] Y. Han, and Y. Liu, “A practical transformer core loss measurementscheme for high-frequency power converter,” IEEE Trans. Ind. Elec-tron., vol. 55, no. 2, pp. 941–948, Feb. 2008.
[3] V. J. Thottuvelil, T. G. Wilson, and H. A. Owen, “High-frequency mea-surement techniques for magnetic cores,” IEEE Trans. Power Electron.,vol. 5, no. 1, pp. 41–53, Jan. 1990.
[4] M. Mu, Q. Li, D. J. Gilham, F. C. Lee, and K. D. T. Ngo, “Newcore loss measurement method for high-frequency magnetic materials,”IEEE Trans. Power Electron., vol. 29, no. 8, pp. 4374–4381, Aug. 2014.
[5] Y. Han, W. Eberle, and Y. Liu, “A practical copper loss measurementmethod for the planar transformer in high-frequency switching con-verters,” IEEE Trans. Ind. Electron., vol. 54, no. 4, pp. 2276–2287,Aug. 2007.
[6] C. A. Baguley, B. Carsten, and U. K. Madawala, “The effect of dc biasconditions on ferrite core losses,” IEEE Trans. Magn., vol. 44, no. 2,pp. 246–252, Feb. 2008.
[7] Y. Han, G. Cheung, A. Li, C. R. Sullivan, and D. J. Perreault, “Evalua-tion of magnetic materials for very high frequency power applications,”IEEE Trans. Power Electron., vol. 27, no. 1, pp. 425–435, Jan. 2012.
[8] M. Mu, and F. C. Lee, “A new high frequency inductor loss measure-ment method,” in Proc. IEEE Energy Convers. Congr. Expo., Phoenix,AZ, 2011, pp. 1801–1806.
[9] M. Mu, F. C. Lee, Q. Li, D. Gilham, and K. D. T. Ngo, “A highfrequency core loss measurement method for arbitrary excitations,” inProc. 26th Annu. IEEE Appl. Power Electron. Conf. Expo., Fort Worth,TX, 2011, pp. 157–162.
[10] D. Hou, M. Mu, F. C. Lee, and Q. Li, “New high-frequency core lossmeasurement method with partial cancellation concept,” IEEE Trans.Power Electron., vol. 32, no. 4, pp. 2987–2994, Apr. 2017.
[11] F. Zhu, Q. Li, and F. C. Lee, “Improved partial cancellation methodfor high frequency core loss measurement,” in Proc. IEEE Appl. PowerElectron. Conf. Expo., Anaheim, CA, USA, 2019, pp. 1430–1435.
VOLUME 2, 2021 313

RASEKH ET AL.: NEW METHOD FOR OFFLINE COMPENSATION OF PHASE DISCREPANCY IN MEASURING THE CORE LOSS
[12] Z. Ma, J. Yao, Y. Li, and S. Wang, “Comparative analysis of mag-netic core loss measurement methods with arbitrary excitations,” inProc. IEEE Energy Convers. Congr. Expo., Baltimore, MD, USA, 2019,pp. 4125–4130.
[13] M. Mu, “High frequency magnetic core loss study,” Ph.D. dissertation,Dept. Elect. Eng., Virginia Tech., Blacksburg, VA, USA, 2013.
[14] N. F. Javidi, and M. Nymand, “Error analysis of high frequency coreloss measurement for low-permeability low-loss magnetic cores,” inProc. IEEE 2nd Annu. Southern Power Electron. Conf., Auckland,2016, pp. 1–6.
[15] N. F. Javidi, M. Nymand, and A. J. Forsyth, “New method for errorcompensation in high frequency loss measurement of powder cores,”in Proc. IEEE Appl. Power Electron. Conf. Expo., Tampa, FL, 2017,pp. 876–881.
[16] Keysight Technologies, “Keysight U1882B, Measurement Applicationfor Infiniium Oscilloscopes”, Dec. 2017, [Online]. Available:http://www.keysight.com/gb/en/assets/7018-01738/datasheets/5989-7835.pdf
[17] T. Shimizu, K. Kakazu, K. Takano, and H. Ishii, “Verification of ironloss calculation method using a high-precision iron loss analyzer,” IEEJTrans. Ind. Appl., vol. 133, no. 1, pp. 84–93, 2013.
[18] H. Matsumori, T. Shimizu, K. Takano, and H. Ishii, “Evaluation of ironloss of ac filter inductor used in three-phase pwm inverters based onan iron loss analyzer,” IEEE Trans. Power Electron., vol. 31, no. 4,pp. 3080–3095, Apr. 2016.
[19] J. Muhlethaler, J. Biela, J. W. Kolar, and A. Ecklebe, “Core losses underthe DC bias condition based on steinmetz parameters,” IEEE Trans.Power Electron., vol. 27, no. 2, pp. 953–963, Feb. 2012.
[20] T. Shimizu and S. Iyasu, “A practical iron loss calculation for AC filterinductors used in PWM inverters,” IEEE Trans. Ind. Electron., vol. 56,no. 7, pp. 2600–2609, Jul. 2009.
[21] L. Yi and J. Moon, “Direct in-situ measurement of magnetic loss inpower electronic circuits,” IEEE Trans. Power Electron., vol. 36, no. 3,pp. 3247–3257, Mar. 2021.
[22] J. Moon, “In-situ direct magnetic loss measurement in a DC-DC con-verter,” in Proc. IEEE Energy Convers. Congr. Expo., Baltimore, MD,USA, 2019, pp. 1261–1268.
[23] C. R. Sullivan and J. H. Harris, “Testing core loss for rectangular wave-forms, phase II final report,” 2010. [Online]. Available: http://www.psma.com/coreloss/phase2.pdf
[24] K. Venkatachalam, C. R. Sullivan, T. Abdallah, and H. Tacca, “Accu-rate prediction of ferrite core loss with nonsinusoidal waveforms usingonly steinmetz parameters,” in Proc. IEEE Workshop Comput. PowerElectron., 2002, pp. 36–41.
[25] C. R. Sullivan, J. H. Harris, and E. Herbert, “Core loss predictions forgeneral PWM waveforms from a simplified set of measured data,” inProc. IEEE Appl. Power Electron. Conf. Expo., 2010, pp. 1048–1055.
[26] C. R. Sullivan and J. H. Harris, “Testing core loss for rectangularwaveforms,” 2010. [Online]. Available: http://www.psma.com/coreloss/pilot.pdf
[27] E. Herbert, “Testing core loss for rectangular waveforms, phase IIsupplemental report,” 2012. [Online]. Available: http://www.psma.com/coreloss/supplement.pdf
[28] J. Wang, K. J. Dagan, X. Yuan, W. Wang, and P. H. Mellor, “A practicalapproach for core loss estimation of a high-current gapped inductor inPWM converters with a user-friendly loss map,” IEEE Trans. PowerElectron., vol. 34, no. 6, pp. 5697–5710, Jun. 2019.
[29] J. Wang, X. Yuan, and N. Rasekh, “Triple pulse test (TPT) for character-izing power loss in magnetic components in analogous to double pulsetest (DPT) for power electronics devices,” in Proc. Annu. Conf. IEEEInd. Electron. Soc., 2020, pp. 4717–4724.
[30] J. Wang, N. Rasekh, X. Yuan, and K. J. Dagan, “An analytical methodfor fast calculation of inductor operating space for high-frequency coreloss estimation in two-level and three-level PWM converters,” IEEETrans. Ind. Appl., vol. 57, no. 1, pp. 650–663, Jan./Feb. 2021.
[31] B. X. Foo, A. L. F. Stein, and C. R. Sullivan, “A step-by-step guideto extracting winding resistance from an impedance measurement,” inProc. IEEE Appl. Power Electron. Conf. Expo., 2017, pp. 861–867.
[32] National Instruments Corporation, “Understanding FFTs and window-ing,” Mar 2019. [Online]. Available: http://www.ni.com./en-gb.html
[33] L. Chioye, “Choose the right FFT window function when evalu-ating precision ADCs,” Nov 2013, [Online]. Available: http://www.electronicdesign.com
[34] J. C. Schatzman, “Accuracy of the discrete fourier transform and the fastfourier transform, “SIAM J. Sci. Comput., vol. 17, no. 5, pp. 1150–1166,1996.
[35] D. Morin, Fourier Analysis, Version 1, Nov. 2009, [Online]. Available:http://scholar.harvard.edu/files/david morin/files/waves_fourier.pdf
[36] B. Zhao, Q. Song, W. Liu, and Y. Sun, “Overview of dual-active-bridge isolated bidirectional DC-DC converter for high-frequency-linkpower-conversion system,” IEEE Trans. Power Electron., vol. 29, no. 8,pp. 4091–4106, Aug. 2014.
[37] W. Liang, L. Raymond, and J. Rivas, “3-D-printed air-core inductorsfor high-frequency power converters,” IEEE Trans. Power Electron.,vol. 31, no. 1, pp. 52–64, 2016.
NAVID RASEKH (Student Member, IEEE) re-ceived the B.Sc. degree in electrical engineeringfrom the Kermanshah University of Technology,Kermanshah, Iran, in 2015 and the M.Sc. degreein electrical engineering from the Amirkabir Uni-versity of Technology, Tehran, Iran, in 2018. He iscurrently working toward the Ph.D. degree with theElectrical Energy Management Group, Universityof Bristol, Bristol, U.K. His main research interestsinclude design and control of the power electronicconverters, power loss modeling of magnetic com-
ponents, wireless power transfer, and finite element analysis.
JUN WANG (Member, IEEE) received the B.S.degree in electrical engineering from Sichuan Uni-versity, Chengdu, China, the M.Sc. degree in elec-trical engineering from the University of Notting-ham, Nottingham, U.K., in 2014, and the Ph.D.degree in power electronics from the Universityof Bristol, Bristol, U.K., in 2019. He is currentlya Senior Research Associate with the ElectricalEnergy Management Group, University of Bristol.His research interests include PWM power con-verters, multilevel DC or AC converter topologies,
power loss modeling of power devices and magnetic components, and designoptimization and application of wide-bandgap power devices.
XIBO YUAN (Senior Member, IEEE) receivedthe B.S. degree in electrical engineering fromthe China University of Mining and Technology,Xuzhou, China, in 2005 and the Ph.D. degree inelectrical engineering from Tsinghua University,Beijing, China, in 2010.
He has been a Professor since 2017 in the Elec-trical Energy Management Group, Department ofElectrical and Electronic Engineering, Universityof Bristol, Bristol, U.K., where he became Lec-turer, Senior Lecturer and Reader in 2011, 2015
and 2016, respectively. He also holds the Royal Academy of Engineer-ing/Safran Chair in Advanced Aircraft Power Generation Systems. He is anexecutive committee member of the UK National Centre for Power Electron-ics and the IET Power Electronics, Machines and Drives (PEMD) network.
His research interests include power electronics and motor drives, windpower generation, multilevel converters, application of wide-bandgap de-vices, electric vehicles and more electric aircraft technologies. Professor Yuanis an Associate Editor of IEEE TRANSACTIONS ON INDUSTRY APPLICATIONS
and IEEE JOURNAL OF EMERGING AND SELECTED TOPICS IN POWER ELEC-TRONICS. He is a Fellow of IET and received The Isao Takahashi PowerElectronics Award in 2018.
314 VOLUME 2, 2021