a new magnetotelluric monitoring network operating in agri
TRANSCRIPT

265
ANNALS OF GEOPHYSICS, VOL. 51, N. 1, February 2008
Key words magnetotelluric – remote reference –apparent resistivity curve – earthquake precursors
1. Introduction
A great variety of phenomena such aschanges in electric (Huang and Liu, 2006),magnetic and electromagnetic fields and/orchanges in the electric structure of subsoil (Na-gao et al. 2002; Zhao and Qian, 1994) have
been associated to seismic activity (Park et al.1993; Merzer et al. 1997; Karakelian et al.2002). The magnetotelluric (MT) method is ageophysical technique used to image the sub-surface electrical resistivity (Cagniard, 1953)using as a source the Earth’s natural electro-magnetic field, whose range of periods is verybroad. Under the assumption that the externalsources are spatially uniform and neglecting thedisplacement current, the physical problemmay be treated as one in pure diffusion (Kellerand Fischknecht, 1966). The penetration depthof the electromagnetic field increases with peri-od and resistivity and can reach several tens ofkilometers for longer periods, depending on theresistivity of the rocks. By inverting the imped-ance tensor, which linearly relates the two hor-
A new magnetotelluric monitoring network operating in Agri Valley(Southern Italy): study of stability of apparent resistivity estimates
Marianna Balasco (1), Vincenzo Lapenna (1), Gerardo Romano (1), Agata Siniscalchi (2) and Luciano Telesca (1)
(1) Istituto di Metodologie per l’Analisi Ambientale, CNR, Tito Scalo (PZ), Italy, (2) Dipartimento di Geologia e Geofisica, Università degli Studi di Bari, Italy
AbstractVariations detected in geophysical, especially electromagnetic, parameters in seismic active areas have beensometimes attributed to modifications of the stress field. Among the different geophysical methods, magnetotel-lurics (MT) could be one of the most effective because it allows us to explore down to seismogenic depths. Con-tinuous MT recording could allow us to evaluate whether possible variations are significantly correlated with theseismic activity of investigated area. To assess the significance of such observations we must be able to say howwell an apparent resistivity curve should be reproduced when measurements are repeated at a later time. To dothis properly it is essential to know that the estimated error bars accurately represent the true uncertainties incomparing the transfer functions. In this work we will show the preliminary results obtained from the analysisof the data coming from the new MT monitoring network installed in Agri Valley. This analysis gives us the pos-sibility: i) to better study the temporal stability of the signals, ii) to better discriminate the noise affecting themeasures by remote reference estimation. The performed analysis disclosed a relatively low degree of noise inthe investigated area, which is a promising condition for monitoring.
Mailing address: Dr. Luciano Telesca, Istituto di Meto-dologie per l’Analisi Ambientale, CNR, C. da S.Loja 5,85050 Tito (PZ), Italy; e-mail: [email protected]
Vol51,1,2008_DelNegro 16-02-2009 21:28 Pagina 265

266
M. Balasco, V. Lapenna, G. Romano, A. Siniscalchi and L. Telesca
izontal electric components to the horizontalmagnetic ones, the electrical resistivity distribu-tion of the Earth’s interior can be defined.
The use of MT data as a seismic precursorcan be limited by problems related to the relia-bility of MT results. These problems are con-nected with the sources of electromagneticfield, the complexity of the observed system(the Earth) and the need to integrate the MT da-ta with other geophysical data not always avail-able. Violation of plane wave assumption due tocultural electromagnetic noise (Egbert andBooker 1986) or variation of MT response pro-duced by conductivity anomalies in the shallowlayers of subsoil (Bahr,1988) can hide the vari-ations of ground resistivity linked to the seismicactivity.
In 2003 a magnetotelluric (MT) monitoringstation was installed by the Institute of Method-ologies for the Environmental Analysis (IMAA)at Barricelle in Agri Valley, Southern Italy (Bal-asco et al. 2004a). This area is very interestingfor its structural geologic context (Giano et al.2000), its recent and historical seismicity and al-so for the presence of numerous oil wells thatexpose it to a high environmental risk. Duringthree years of observation (2003-2005) therewere no significant seismic events, and, there-fore, it was possible to define the characteristicMT curve of the site as function of period forwhich we studied the stability of the apparentresistivity and the fluctuation dynamics of theapparent resistivity values at different timescales (Balasco et al. 2007). Because of unavail-ability of Barricelle site, the station was re-moved and in 2006 the IMAA installed MT sta-tions at other two locations in the Agri Valley,near the principal faults of this area.
The increased number of MT stations givesthe possibility to improve the estimates of ap-parent resistivities by remote reference methodin which horizontal magnetic fields recorded si-multaneously at a second remote site are corre-lated with the electromagnetic fields at localsite: this method provides a clear identificationof coherent noise in contaminated MT data.
Our aim is to obtain a good background forthe future analysis characterizing the siteswhere the MT stations are installed. This couldbe useful to analyse resistivity variations ob-
served during the monitoring. Furthermore, inthis work, we carry out the analysis of the sta-bility of the resistivity estimates to choose a«time window» which can represent a goodcompromise between reliability and sensitivityof our data.
2. The magnetotelluric method and dataanalysis
A classical MT sounding uses the measure-ments of electromagnetic fields induced in theEarth by variations in the external geomagneticfield to obtain, by means a frequency-depend-ent impedance tensor |Z|, the apparent resistivi-ty. The relationship between two orthogonalcomponent of electric E
–and magnetic M
–fields
is given by the following equation (Kaufmanand Keller, 1981)
(2.1)
where ω is the angular frequency, and (Ex, Ey)and (Hx, Hy) represent respectively the electricand magnetic components in an orthogonal ref-erence. As a simple linear system, the transferfunction Z(ω) acts as a filter, while the magnet-ic and electric fields represent the input andoutput respectively.
The apparent resistivity (ρ) of the ground isdefined by the following equation:
(2.2)
where µ0 is the permeability of the vacuum andZij are the complex components of the tensordefined in eq. (2.1), with i,j = x or y.
At the moment, in Agri Valley (fig. 1) twoMT monitoring stations are working: MN sta-tion, located in Marsico Nuovo (lat. 40.42533long. 15.72950) and TR station, located in Coz-zo La Gatta (lat. 40.29668 long. 15.80554),away from urban and industrial centers. TheMT monitoring stations are equipped with a re-ceiver MT24LF (Magnetotelluric 24-bit A/DLow Frequency system) and two inductioncoils (EMI Inc., BF4) which record the magnet-
( ) ( )Z1
ija
oij
2ρ ω µ ω ω=
( )
( )
( )
( )
( )
( )
( )
( )
E
E
Z
Z
Z
Z
H
H
x
y
xx
yx
xy
yy
x
y
ωω
ωω
ωω
ωω
=
Vol51,1,2008_DelNegro 16-02-2009 21:28 Pagina 266

267
A new magnetotelluric monitoring network operating in Agri Valley (Southern Italy)
ic fields. MN station measures two componentsof the magnetic field along 0°N and 90°N direc-tions (Hx and Hy respectively) and the two com-ponents of the electrical field in the same direc-tions (Ex and Ey) by means of 20 m long electri-cal dipoles. TR station measures the same com-ponents of the magnetic field as the MN station,but also measures the electric field by means ofthree electrical dipoles (50 m length): Ex along0°N direction and Ey1 and Ey2 in 90°N direction.
In this study we have analyzed two data setsof apparent resistivity, obtained by a magne-totelluric recording at MN and TR sites fromJuly to November, 2006. The frequency of datarecording was set to 6.25Hz in continuousmode and about every five days we acquired da-ta at high frequency sampling (500 Hz) for 30minutes at 1:00 GMT choosing this windowtime to take advantage of the better signal tonoise ratio (Garcia and Jones, 2002). The ap-
parent resistivity curves ρxy and ρyx, related re-spectively to the off-diagonal components ofimpedance tensor Zxy and Zyx, were estimatedusing the procedure and the Robust TransferFunction Estimation Program for data reduc-tion described in (Egbert, 1997).
The continuous data stream was divided in-to subsets of 45000, 90000, 135000 and 180000values, corresponding to intervals of 2, 4, 6 and8 h respectively and processed individually.This segmentation was devised to have a suffi-ciently long sample for reliable statistics (Eiseland Egbert, 2001). The procedure was appliedto all the MN and TR subsets.
The estimation of the apparent resistivitycurve was obtained with a stability analysisand a consistency analysis. The stability wasperformed using the median value (ρmed) foreach subset, because it is unaffected by outliers(Balasco et al. 2004b). The consistency of ρmed
Fig. 1. Structural geological context of the investigated area. The alluvial deposits are shown: recent (1),Holocene–upper Pleistocene (2), upper-middle Pleistocene (3); subaerial slope deposits, upper-middle Pleis-tocene (4); conglomerates and sands, middle-lower Pleistocene (5); Pertusillo Dam (6); faults (7) (Giano et al.,2000). A: location of the magnetotelluric monitoring station in Marsico Nuovo. B: location of the magnetotel-luric monitoring station in Tramutola
Vol51,1,2008_DelNegro 16-02-2009 21:28 Pagina 267
268
M. Balasco, V. Lapenna, G. Romano, A. Siniscalchi and L. Telesca
was performed by the calculation of ρWmed
(weighted median) for each frequency (ω) giv-en by
(2.3)
(2.4)
with weights pi determined for each subset i.In our case
(2.5)
.
p
p
p
2 1
2 99 1100
99 0 001
<
>
i i
i ii
i i
$
$
$
#
#
ζ
ζζ
ζ
=
= -
=
Z
[
\
]]
]]
p
p21
: ,
: i
i n
i
i
1
i Wmed
$t t$ //
p
p21<
: ,
: i
i n
i
i
1
<i Wmedt t //
where ζi is ((σi / ρi)∗100) and σi is the standarddeviation associated to each estimate ρi of ap-parent resistivity.
Figure 2a,b shows the comparison betweenthe ρmed and ρWmed curves of the MN (fig. 2a)and TR sites (fig. 2b). These curves were ob-tained using the 8 h which compared with 2, 4and 6 h subsets result more stable. The ρWmed
curve was selected as the characteristic appar-ent resistivity curve (ρC), and used as referencein the further analyses. In fact, it is smootherthan ρmed curve and weakens the dead band ef-fect highlighted by anomalous slope.
Fig. 2a,b. Comparison between ρmed and ρWmed
curves for (a) the MN site and (b) the TR site.
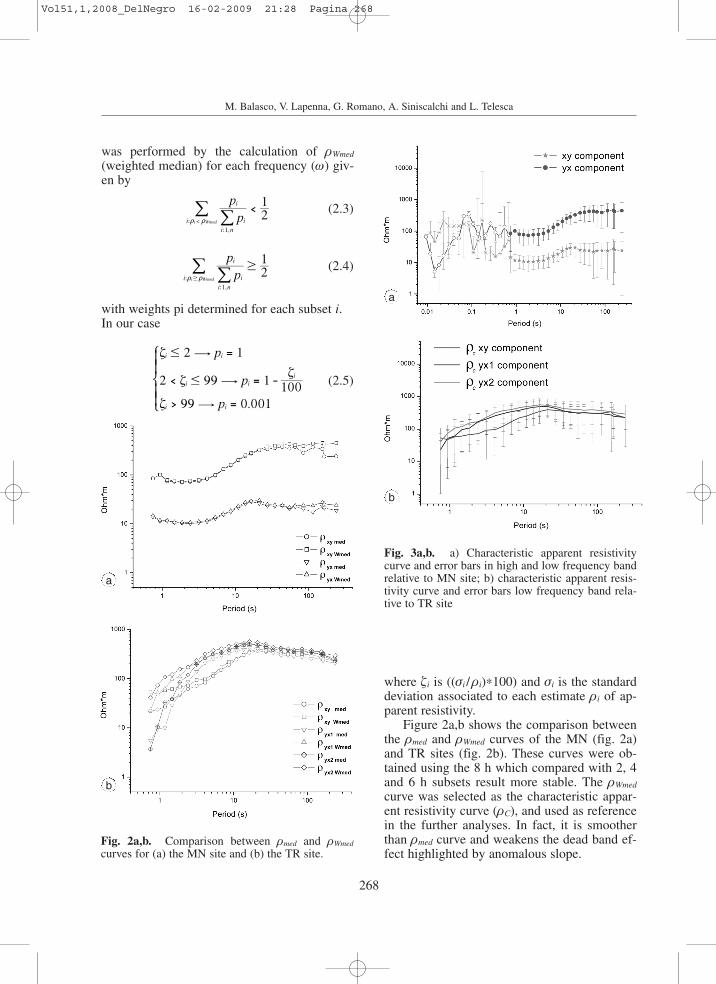
Fig. 3a,b. a) Characteristic apparent resistivitycurve and error bars in high and low frequency bandrelative to MN site; b) characteristic apparent resis-tivity curve and error bars low frequency band rela-tive to TR site
a
b
a
b
Vol51,1,2008_DelNegro 16-02-2009 21:28 Pagina 268

269
A new magnetotelluric monitoring network operating in Agri Valley (Southern Italy)
Fig. 4a,b. Variogram for MN site: a) xy component; b) yx component; the vertical labels on the left highlight thehigh variability zones (red labels [0.74s, 1.86s] and [27.3s, 238.3s]) and the stable zone (blue label [2.40s, 21.14s]).
Fig. 5a-c. Variogram for TR site: a) xy compo-nent; b) yx1 component; c) yx2 component. The yx2
component is shorter than the other two compo-nents due to technical problems occurred to thestation.
a b
a
c
b
Vol51,1,2008_DelNegro 16-02-2009 21:28 Pagina 269

270
M. Balasco, V. Lapenna, G. Romano, A. Siniscalchi and L. Telesca
The ρC curves with error bars defined by, are shown in
fig. 3a,b. For MN site (fig. 3a) the curve shownis obtained joining together the ρC Low Fre-quency (LF) curve [0.744 s, 238.312 s] and theρ High Frequency (HF) curve [0.009 s, 0.682s]. Even if the HF curve, obtained from a poorstatistical sample, is characterized by large er-ror bars and by a scattered behaviour, it isshown because it highlights the period range inwhich the static shift originated.
To study the behaviour of the apparent resis-tivity variations and not knowing their «tempo-ral scale» we calculated the variograms for all
( ) / ( ) ( )n1,
c c ii n1
ρ ω ρ ω ρ ω∆ = -=
/the two-hour subsets by means of the formula
.
The variability of the apparent resistivity ρi
from the characteristic resistivity ρC, for all thetwo-hour subsets in period range (0.74-238.31s), for both sites is shown in fig. 4 and fig. 5.The monochromatic bands correspond to datamissing.
In those figures, all the good estimates areassociated with values of ∆ρi(ω)<1 (light greenin the colour scale). Taking this into account,
( )( ( ))
( ) ( )Log
Log Logi
c
i Cρ ω ρ ω
ρ ω ρ ω∆ =
-
Fig. 6a-c. Comparison between the apparent resistivity curves estimate for the MN site computed with robustsingle station method (zss curve), using TR site as a reference (zrr curve) for xy component (a) and yx compo-nent (b). (c) Eigenvalues of SDM for MN site: the two dominant eigenvalues are plotted with solid line.
c
a b
Vol51,1,2008_DelNegro 16-02-2009 21:28 Pagina 270

271
A new magnetotelluric monitoring network operating in Agri Valley (Southern Italy)
we can assess that estimates related to MN siteshow a general high degree of stability. In par-ticular, xy component is more stable than yxcomponent where a great variability can be ob-served at high and low period ranges and in par-ticular at some fixed periods. Regarding TRsite, instead, the variograms show a twofold be-haviour: a good degree of stability for the firstsubsets, and an increasing instability in the lastsubsets, probably due to equipment technicalproblems. Comparing the MN and TR vari-ograms, we selected two sets, having the samestart time, in which ∆ρi(ω) is shortest. Two dif-ferent MT processing schemes were applied tothe data: a robust single site processing scheme
(zss) and a remote reference (zrr, Gamble et al.,1979; Egbert and Booker 1986) processingscheme. The use of the remote referencemethod removes uncorrelated noise from MTdata. In this way we can better understand thecharacter of the signal and noise in MT data.Figure 6a,b shows the apparent resistivitycurves estimate for the MN site with the twoabove-mentioned methods compared with thecharacteristic apparent resistivity curve. In zrrestimates, we use TR site as a reference. For xycomponent, the two methodologies give quitesimilar results (past 10s the three curves in fig.6a are fairly coincident) while for yx compo-nent we have dissimilarities at high and low pe-
Fig. 7a-c. Comparison between the apparent resistivity curves estimate for the TR site computed with a robustsingle station method (zss curve), using MN site as a reference (zrr curve) for xy component (a), yx1 component(b), yx2 component (c).
a
c
b
Vol51,1,2008_DelNegro 16-02-2009 21:28 Pagina 271

272
M. Balasco, V. Lapenna, G. Romano, A. Siniscalchi and L. Telesca
riods. Such results are totally compatible withwhat emerged analyzing the variograms. A pos-sible explanation for the divergences betweenthe curves, in period range 1-10s, can be thepresence of the «dead band»; the instability past60s can be due to shortness of the sets used toestimate the apparent resistivity.
The zrr and zss curves are within the errorbars of the characteristic apparent resistivitycurves (ρC) highlighting the goodness estimates.
Figure 6c plots the eigenvalues obtained bymultivariate analysis of the spectral density ma-trix as a function of period (SDM, Egbert, 1997).The number of eigenvalues significantly greaterthan one are two thus effectively confirming ofthe absence of coherent noise in our MT data.
A similar discussion can be extended to fig.7a-d in which the apparent resistivity curves in TRsite have been computed using MN site as a refer-ence. In this site, the zrr and zss-xy componentsare well-matched while in yx component theagreement is confined in middle period range. Thesignal to noise ratio is generally great (fig. 7d).
3. Conclusions
Using data from two magnetotelluric sta-tions operating in Agri Valley (Southern Italy)we have computed the apparent resistivitycurves for each day divided into intervals of 2,4, 6, 8 h in a 5 month period (July-November
2006). This segmentation provides the opportu-nity for a detailed and reliable statistics and es-tablishes the shortest length of the subset to ob-tain stable apparent resistivity curves. Duringour investigation period some data segmentswere contaminated by significant instrumentmalfunction. To automatically down-weight oreliminate poor quality data a weighted medianprocedure was applied. The weighted medianprocedure applied to apparent resistivity valuesfor each frequency and for all subset gives the«characteristic apparent resistivity curve». Thecharacteristic apparent resistivity curves esti-mated for Marsico Nuovo and Tramutola sitecan be used to evaluate possible temporal vari-ations in subsoil that could be connected to«seismic stress». The good quality of our data(restricted at high frequency as the apparent re-sistivity curves are unstable) is also highlightedby eingevalues analysis which supports quasi-uniform plane wave MT source assumptionwithout coherent noise. Moreover, comparingthe zrr estimates, the single station estimates(zss curve) and ρC curves we can conclude thatthe noise involving the Agri Valley is lowenough to consider this area reliable for ourmonitoring study. We can also assess that ourweighted median values are good estimators.The sporadic difference between ρC and zrrcurves, in fact, can probably be ascribed to un-satisfactory statistic sample. Expanding the useof the remote reference on longer data set will
Fig. 7d. Eigenvalues of SDM for TR site: the two dominant eigenvalues are plotted with solid line.
Vol51,1,2008_DelNegro 16-02-2009 21:28 Pagina 272

273
A new magnetotelluric monitoring network operating in Agri Valley (Southern Italy)
allow us to improve the stability of estimatesand to have a continuous indication of the pres-ence/absence of noise and its characterization.
We can conclude that our magnetotelluricestimates are reliable which is one of the keypoints for the use of apparent resistivity varia-tions as a seismic precursor.
GAMBLE, T.D., W.M. GOUBAU and J. CLARKE (1979) Mag-netotellurics with a remote reference, Geophysics, 44,53-68.
GARCIA, X. and A.G. JONES (2002): Extended decomposi-tion of MT data in three-dimensional electromagnetics,Methods Geochem. Geophys., 35, 235-250.
GIANO, I.G., L. MASCHIO, M.ALESSIO, L. FERRANTI, S. IM-PROTA and M. SCHIATTARELLA (2000): Radiocarbon dat-ing of active faulting in the Agri high valley, SouthernItaly, J. Geodyn., 29, 371-386.
HUANG, Q. and T. LIU (2006): Earthquakes and tide re-sponse of geoelectric potential field at the Niijima sta-tion, Chinese J. Geophys., 49, 1745-1754.
KARAKELIAN, D., G.C. BEROZA, S.L. KLEMPERER and A.C.FRASER-SMITH (2002): Analysis of ultralow-frequencyelectromagnetic field measurements associated withthe 1999 M 7.1 Hector Mine, California, earthquake se-quence, Bull. Seismol. Soc. Am., 92 (4), 1513-1524.
KAUFMAN, A. and G.V. KELLER (1981): The magnetotelluricsounding method, Methods Geochem. Geophys., 15,pp. 583.
KELLER, G.V. and F.C. FRISCHKNECHT (1966): ElectricalMethods in Geophysical Prospecting (Pergamon Press,New York).
MERZER, M. and S.L. KLEMPLERER (1997): Modeling low-frequency magnetic-field precursors to the Loma Prietaearthquake with a precursory increase in fault-zoneconductivity, Pure Appl. Geophys., 150, 217-248.
NAGAO, T.,Y. ENOMOTO, Y. FUJINAWA, M. HATA, M.HAYAKAWA, Q. HUANG, J. IZUTSU, Y. KUSHIDA, K. MAE-DA, K. OIKE, S. UYEDA and T. YOSHINO (2002): Electro-magnetic anomalies associated with 1995 Kobe earth-quake, J. Geodyn., 33, 401-411.
PARK, S.K., M.J.S. JOHNSTON, T.R. MADDEN, F.D. MORGAN
and H.F. MORRISON (1993): Electromagnetic precur-sors to earthquakes in the ULF band; a review of obser-vations and mechanism, Rev. Geophys., 31, 117-132.
ZHAO, Y. and F. QIAN (1994): Geoelectric precursors to strongearthquakes in China, Tectonophysics, 233, 99-113.
REFERENCES
BAHR, K. (1988): Interpretation of the magnetotelluric im-pedance tensor: regional induction and local telluricdistortion, J. Geophys., 62, 119-127.
BALASCO, M., G. COLANGELO, V. LAPENNA, M. LODDO, A.SINISCALCHI and L. TELESCA (2004a): Measuring ap-parent resistivity in a seismically active area of south-ern Italy, Phys. Chem. Earth, 29, 329-337.
BALASCO, M., V. LAPENNA, A. SINISCALCHI and L. TELESCA
(2004b): Stability analysis of apparent resistivity meas-urement in the seismically active area of Val d’Agri(Southern Italy), Nat. Haz. Earth Sys. Sci., 4, 1-7.
BALASCO, M., V. LAPENNA, G. ROMANO, A. SINISCALCHI andL. TELESCA (2007): Extracting quantitative dynamics inEarth’s apparent resistivity time series by using the de-trended fluctuation analysis, Physica A, 374, 380-388.
CAGNIARD, L. (1953): Basic theory of the magnetotelluricmethod of geophysical prospecting, Geophysics, 18, 605.
EGBERT, G.D. (1997): Robust multiple-station magnetotel-luric data processing, Geophys J. Int., 130, 475-496.
EGBERT, G.D. and J.R. BOOKER (1986): Robust estimationof geomagnetic transfer functions, Geophys. J. R. As-tron. Soc., 87, 173-194.
EISEL, M. and G.D. EGBERT (2001): On the stability of mag-netotelluric transfer function estimates and the reliabil-ity of their variances, Geophys. J. Int., 144, 65-82.
Vol51,1,2008_DelNegro 16-02-2009 21:28 Pagina 273