a new hybrid decision making approach for housing
TRANSCRIPT

Research ArticleA New Hybrid Decision Making Approach for HousingSuitability Mapping of an Urban Area
Mithat Zeydan ,1 Bülent BostancJ,2 and Burcu Oralhan3
1 Industrial Engineering, Erciyes University, Kayseri 38030, Turkey2Geomatics Engineering, Erciyes University, Kayseri 38280, Turkey3Economics and Administrative Sciences, Nuh Naci Yazgan University, Kayseri 38170, Turkey
Correspondence should be addressed to Mithat Zeydan; [email protected]
Received 18 May 2018; Revised 23 August 2018; Accepted 9 September 2018; Published 15 October 2018
Academic Editor: Ana C. Teodoro
Copyright © 2018 Mithat Zeydan et al. This is an open access article distributed under the Creative Commons Attribution License,which permits unrestricted use, distribution, and reproduction in any medium, provided the original work is properly cited.
In urbanplanning, housing evaluation of residential areas plays a critical role in promoting economic efficiency.This studyproducedan evolutionary-based map through the combination of hybrid Multicriteria Decision Making (MCDM) and GeographicalInformation System (GIS) by assessing suitability of housing location. Suitable locations were modelled and determined withthe present study from very low suitability to very high suitability. In the first stage, Fuzzy DEMATEL (the Decision MakingTrial and Evaluation Laboratory) and Covariance Matrix Adaptation Evolutionary Strategy (CMA-ES) under fuzzy conditionsas a subjective and an objective (model-based) technique, respectively, were employed to find the weights of criteria which arecritical part of decision making. In the second stage, housing evaluation map for these two approaches was drawn and theirperformances were classified and measured with WLC (Weighted Linear Combination) method. 29 criteria determined wereprioritized as per judgment of urban planning and real estate experts for Fuzzy DEMATEL and CMA-ES. After having been codedtoMATLAB for obtaining optimumweights in CMA-ES, all collected data for 160 houses weremapped as vectorial (positional) andtransformed to raster (pixel) data by getting entered in ArcGIS 10.4 software. We achieved CMA-ES-WLCmaximization values for104 alternatives with (positive value) 65% performance, but we obtained FDEMATEL-WLCmaximization values for 56 alternativeswith (negative value) 35%performance.WLC values calculatedwith CMA-ES and FDEMATELweights allowed us to conclude thatthe houses with the highest suitability in terms of investment are in Alpaslan, Kosk, and Melikgazi streets. The result shows thatthe methodology used in the application of this study performed in Turkey is an important and powerful technology in providingdecision support for spatial planning.
1. Introduction
As urban population living in cities increases rapidly, it iscrucial to preserve environmental values and improve qualityof urban service and quality of life. In this context, the conceptof the land use and development of urban areas in accordancewith this goal is one of the topics discussed in the urban-ization literature [1]. Land use planning includes decisionsabout interdependent and multilayered issues affecting airand water quality, access to transportation options, economicviability, and quality of life [2–5]. Creating planned areasthat include types and uses of buildings and places to meetneeds of residents’ daily lives has a critical viewpoint. Primarytypes of planning areas that need to be supplied to residentsby municipalities are classified as residential, commercial,
industrial, green, and agricultural areas [6, 7]. Land use, onceconsidered as a local environmental issue, is now regarded asa driving force of global importance. Regulation of land useis the main function of local governments whose planningdepartments monitor many regulations related to land acqui-sition, including land master planning, transport, housing,economic development, and reconstruction [8]. Suitabilityevaluation is of considerable use for land use planning anddevelopment [9]. The development of land use policies andrelated coordination in Turkey has come to the fore after1980s. Urban Land Use and Planning Act was renovatedin 1985 [10] since migrations, urban population growth,increasing population density in city center, infrastructureproblems, use of fertile agricultural land, industrialization,and other factors reveal necessity of producing policies for
HindawiMathematical Problems in EngineeringVolume 2018, Article ID 7038643, 13 pageshttps://doi.org/10.1155/2018/7038643
2 Mathematical Problems in Engineering
land use planning [11]. Regional, environmental, master, andimplementation plan hierarchy for physical planning wasforeseen. The law was designed in order to ensure thatthe settlements and the structures in these places are inaccordance with the plan, science, health, and environmentconditions [10, 12]. Policies made for this purpose generallybring temporary solutions together with socially meaningfulhousing and social and spatial-functional injustice accompa-nied by the release of slum dwellings on one hand. In general,it has been observed that applications for urban land useand housing production are primarily due to technical andlegal problems of ownership structure and fail to producesustainable land use and housing policies [13]. The basic aimof housing policies is to get at the price that they will be ableto pay for “good and adequate housing” for entire segmentof society from lowest income group to top income group.Nevertheless, housing problem (especially, for low incomefamilies) has not been fully resolved in both developed anddeveloping countries from past to present [14]. In countriessuch as Turkey where housing is seen as a guarantee, demandfor investment by high income group is very important.In this case, there may be more than one housing in theirownership, except for the house that the individual uses.The majority of these dwellings are offered on the market asrental housing stocks. For middle and lower income groups,purchasing a house is still an important problem. Especially,housing supply for lower income group is a serious problemand policies for purchasing house of lower income groupare still insufficient. In this sense, housing loan system isnot yet able to run for its purpose. The main reason for thisfailure is that the interest rates on housing loans are still quitehigh in today’s conditions [15]. Turkey real estate sector is asignificant driving force in its economy due to employmentalong with many subsectors such as tourism and building. Tochoose a suitable location for investors who want to purchasea house has become a crucial matter since price and demandas well as gross domestic product per capita are increasing.Site selection literature [2–5, 16–18], opinions of housingdevelopment and valuation experts, and a Ph.D. Thesis [19]were used for selection of criteria and, finally, 29 criteria withevaluations of authors were determined. Our study focuseson selection problem of best suitable among existing ones forsale with the help of housing suitability evaluation whenevera customer wants to buy a house depending on 29 criteriawhich are related to distance, building, and surroundingproperties among others. To solve this problem MCDM andEvolutionary Algorithm (EA) approaches can be consideredwith weighting of criteria to either single or multiple sets ofobjectives [20]. However, these methods used alone revealserious deficiencies from the view of geographical aspects [21]and are eliminated to a large extent with Spatial DecisionSupport System (SDSS) technique considering heterogeneityin environment [22]. Many studies have used the MCDMtechniques like ordered weighted averaging (OWA) [23],analytical hierarchy/network [24] process, ELECTRE (elim-ination and choice expressing reality) [25], PROMETHEE(the preference ranking organization method for enrichmentof evaluations) [26], EA [27], Combined Decision MakingTrial and Evaluation Laboratory (DEMATEL), the Analytic
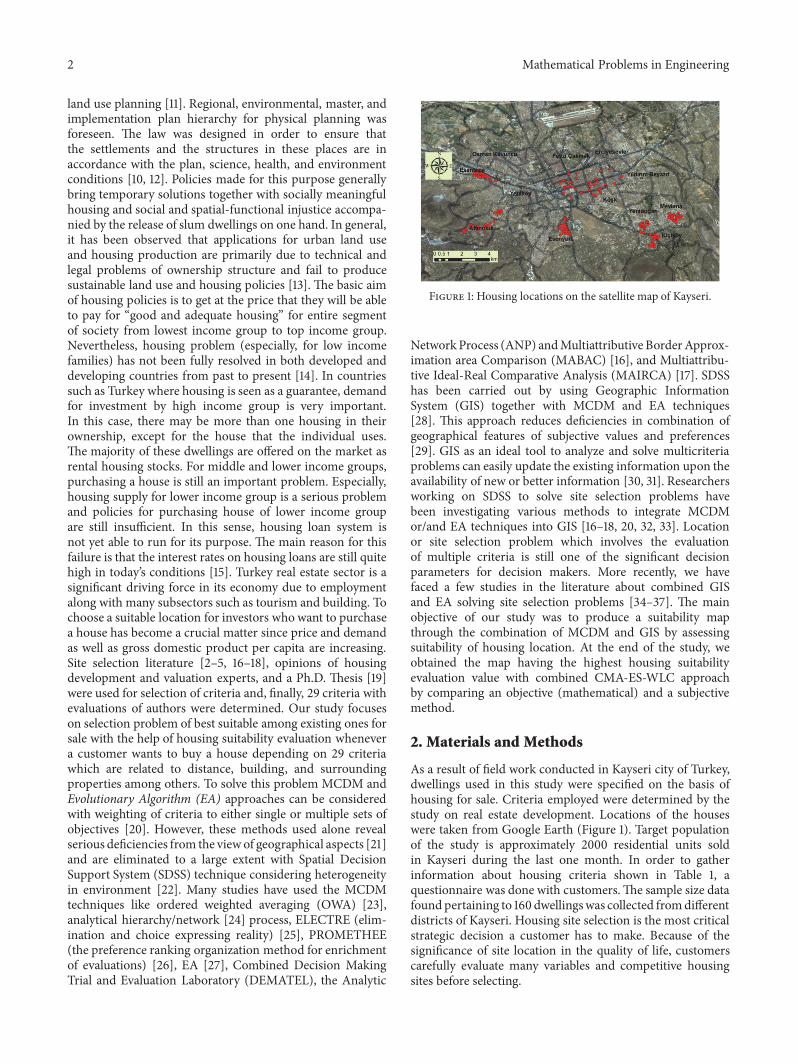
Figure 1: Housing locations on the satellite map of Kayseri.
NetworkProcess (ANP) andMultiattributive BorderApprox-imation area Comparison (MABAC) [16], and Multiattribu-tive Ideal-Real Comparative Analysis (MAIRCA) [17]. SDSShas been carried out by using Geographic InformationSystem (GIS) together with MCDM and EA techniques[28]. This approach reduces deficiencies in combination ofgeographical features of subjective values and preferences[29]. GIS as an ideal tool to analyze and solve multicriteriaproblems can easily update the existing information upon theavailability of new or better information [30, 31]. Researchersworking on SDSS to solve site selection problems havebeen investigating various methods to integrate MCDMor/and EA techniques into GIS [16–18, 20, 32, 33]. Locationor site selection problem which involves the evaluationof multiple criteria is still one of the significant decisionparameters for decision makers. More recently, we havefaced a few studies in the literature about combined GISand EA solving site selection problems [34–37]. The mainobjective of our study was to produce a suitability mapthrough the combination of MCDM and GIS by assessingsuitability of housing location. At the end of the study, weobtained the map having the highest housing suitabilityevaluation value with combined CMA-ES-WLC approachby comparing an objective (mathematical) and a subjectivemethod.
2. Materials and Methods
As a result of field work conducted in Kayseri city of Turkey,dwellings used in this study were specified on the basis ofhousing for sale. Criteria employed were determined by thestudy on real estate development. Locations of the houseswere taken from Google Earth (Figure 1). Target populationof the study is approximately 2000 residential units soldin Kayseri during the last one month. In order to gatherinformation about housing criteria shown in Table 1, aquestionnaire was done with customers.The sample size datafound pertaining to 160 dwellingswas collected fromdifferentdistricts of Kayseri. Housing site selection is the most criticalstrategic decision a customer has to make. Because of thesignificance of site location in the quality of life, customerscarefully evaluate many variables and competitive housingsites before selecting.

Mathematical Problems in Engineering 3
Table1:Definitio
nof
thec
riteria.
No
Criteria
Descriptio
nof
thec
riteria
C1To
pographicS
tructure
Physicalfeatures
ofthea
rea
C2StructuralDensity
Ther
atioof
thetotalgrou
ndflo
orarea
ofab
uildingto
thetotalland
area
C3Land
scape
Allthev
isiblefeatureso
fanarea
ofland
C4Distance
toCityCenter
Distance
tocenter
accordingto
transportatio
nnetworkwith
referencetotheG
overno
rate
C5Distance
toElem
entary
Scho
olSpecified
dista
ncea
ccording
tonearestp
rimaryscho
olC6
Distance
toSecond
aryScho
olSpecified
dista
ncea
ccording
tosecond
aryscho
olC7
Distance
toUniversity
Specified
dista
ncea
ccording
toErciyesU
niversity
C8Distance
toSh
opping
Center
Specified
dista
ncea
ccording
to2larges
hopp
ingmalls
C9ArrivalTimetoCityCenter
Estim
ated
transportatio
ntim
efrom
resid
entia
ltocitycenter
C10
Impu
rity
pollu
tionlevelofthe
area
where
housingislocated
C11
Age
ofBu
ilding
Actualageo
fthe
build
ing
C12
Build
ingLand
Area
Land
area
where
housingislocated
C13
Warm-upTy
peEv
aluatio
nof
warm-uptype
interm
sofcostand
airp
ollutio
nC14
FuelTy
peEv
aluatio
nof
fuelused
interm
sofp
reference
C15
Build
ingSecurity
Thelevelof
build
ingsecurity
C16
SatelliteAc
cess
Evaluatio
nof
satelliteor
terrestrialbroadcasting
status
C17
Hou
singFron
tEv
aluatio
nof
resid
entia
lceilin
gin
term
sofp
reference
C18
Resid
entia
lArea
Hou
singarea
basedon
m2
C19
Mon
thlyRe
ntRe
ntvalueo
fthe
housing
C20
Build
ingFees
Mon
eycollected
forb
uildingexpenses
C21
Num
bero
fRoo
ms
Totaln
umbero
froo
mse
xcluding
loun
geC2
2Num
bero
fBathroo
ms
Totaln
umbero
fbathroo
ms
C23
Hou
singVa
lue
Up-to-datesales
valueo
fthe
estate
C24
IsHou
singin
Hou
singEstate
stateof
settlem
ento
fsite
type
C25
Garden
Gardenarea
C26
Percentage
ofGreen
Space
Percentage
ofgreenspaceinthen
eigh
borhoo
dC2
7Infrastructure
Percentage
ofgreenspaceinthen
eigh
borhoo
dC2
8Parking
Percentage
ofgreenspaceinthen
eigh
borhoo
dC2
9IncomeL
evel
Hou
singmon
thlyincomelevelas
households

4 Mathematical Problems in Engineering
Hybrid Decision Making for Housing Suitability
Criteria Selection of the Measurements-Evaluation of home appraisers-Literature research and evaluation of writers
Target Population of the Study-Approximately 2000 residential units sold in Kayseri during the last 1 month
Sample Size Selection for questionnaire-99 % acceptable level of the confidence with an accuracy level of ∓10 % = 154 -Information on a total of 160 dwellings wascollected in 23 localities.
Fuzzy (F) DEMATEL Weights-Evaluate the criteria according to FDEMATEL Method-Find criteria weights FDEMATEL for 29 criteria.
WLC Score ValueUsing the information about 160 dwellings toestablish a score-value table based on WLC scale- Quantitative Data- Qualitative Data
CMA-ES Weights under fuzzy conditions-Evaluation of criteria according to CMA-ES Method-Find criteria weights CMA-ES for 29 criteria.
WLC Suitability Value-Determination of the WLC Suitability Value for 160 residences with 29 FDEMATEL weights.-Determination of the WLC Suitability Value for 160 residences with 29 CMA-ES weights.
Suitability Map Production�e production of two residential suitability maps by IDW interpolation method in ARCGIS 10.1 so�ware using the wlc suitability values obtained from FDEMATEL and CMA-ES weighting methods under fuzzy conditions.
Making point and regional evaluations on the housing
Figure 2: Hybrid decision making for housing suitability flow diagram.
In order to better understand the material and the meth-odology used, housing suitability flow diagram employed inthe study is given in Figure 2.
2.1. Weights of Criteria Estimation
2.1.1. CMA-ES Algorithm and Optimization. As an evolution-ary approach to solve housing location site selection problem,we considered CMA-ES algorithm under fuzzy conditionsnecessary. Since EAs for local and global optimization solu-tions are fast and robust computation methods, they havebeen widely used as a state of the art method. CMA-ES asa class of continuous EAs was proposed by Hansen [38]. Inparticular, CMA-ES which is one of the most effective EAsdue to its self-training behaviour is oftenpreferred to other ES(Evolutionary Strategy) techniques for continuous objectivefunctions [39]. Compared to other EAs, invariability againstthe linear transformations in the search space is an important
characteristic of CMA-ESwhich is a stochasticmethod gener-ating new populationmember by sampling from a probabilitydistribution that is constructed during the optimizationprocess. Training process of correlations between parametersand use of the correlations to accelerate convergence of thealgorithm are key concepts of this algorithm. In recent years,there have been many studies about CMA-ES or hybridCMA-ES approach.These studies in the literature proved thatCMA-ES is a more efficient EA than others in improvingperformance of systems [40]. CMA-ES is one of the mostefficient metaheuristics for dealing with difficult numericaloptimization problems [41]. Another reason to prefer suchalgorithm is that a modification of the constraints may notrequire a reformulation of the problem, which, in practice,may be of considerable usefulness [42]. This choice maythus also have some operational advantages. CMA-ES aregenerally the most effective strategies on nonseparable andbadly scaled problems and advantages, showing in particular

Mathematical Problems in Engineering 5
Initialization
Define/Update Mean, covariance Matrix and Step Size
Generate offspring
Selection and Recombination
While exit criteria not met
Input Parameters
Figure 3: A cycle of stages for CMA-ES works.
active decrease in the sampling variance [43, 44]. CMA-ES, which performs for nonlinear function minimization,produces a Gaussian probabilistic model of finding solutionsand the next generation population andworks through a cycleof stages represented in Figure 3.
In our study as a new hybrid approach, we used CMA-ES-WLC as an objective (mathematical model) approachto be able to obtain the most suitable solution to drawthe map based on GIS and compared Fuzzy DEMATEL-WLC as a subjective method. If we use fuzzy approach indecision making, it presents powerful reasoning that canhandle uncertainties and vagueness. Therefore, we use CMA-ES under fuzzy conditions to find the importance weightof each criteria wi. With n criteria, let 𝑤 = (𝑤1, 𝑤2,...,𝑤𝑛) be priority vector of criteria (0<𝑤𝑖<1) and 𝐸𝑊𝑖𝑗 = (𝑥𝑙𝑖𝑗,𝑥𝑚𝑖𝑗, 𝑥𝑢𝑖𝑗) present the importance of criteria ci respective tocriteria cj in pairwise comparison by decision maker (i < j).Finding the value of weight 𝑤𝑖 is similar to the value of ratio𝑤𝑖/𝑤𝑗, which maximizes their membership function in thecorresponding fuzzy set 𝐸𝑊𝑖𝑗. Triangular fuzzy membershipfunction 𝜇𝑖𝑗 is defined in (1).
𝜇𝑖𝑗 (𝑤𝑖𝑤𝑗) ={{{{{{{{{{{{{{{
𝑤𝑖/𝑤𝑗 − 𝑥𝑙𝑖𝑗𝑥𝑚𝑖𝑗 − 𝑥𝑢𝑖𝑗 𝑥𝑙𝑖𝑗 ≤ 𝑤𝑖𝑤𝑗 ≤ 𝑥𝑚𝑖𝑗
𝑤𝑖/𝑤𝑗 − 𝑥𝑢𝑖𝑗𝑥𝑚𝑖𝑗 − 𝑥𝑢𝑖𝑗 𝑥𝑙𝑖𝑗 ≤ 𝑤𝑖
𝑤𝑗 ≤ 𝑥𝑢𝑖𝑗0 𝑜𝑡ℎ𝑒𝑟𝑤𝑖𝑠𝑒
(1)
A fitness function was proposed by Moneim, [45] as definedin (2).
𝐺(𝑤1, 𝑤2, . . . , 𝑤𝑛) = min𝑖<𝑗
(𝜇12, 𝜇13, . . . 𝜇𝑖𝑗, . . . , 𝜇(𝑛−1)𝑛) (2)
The problem of obtaining a priority vector of n criteria can bedetermined in the following optimization problem defined in(3).
𝑀𝑎𝑥𝑖𝑚𝑖𝑧𝑒 𝐺 (𝑤1, 𝑤2, . . . , 𝑤𝑛)𝑆𝑢𝑏𝑗𝑒𝑐𝑡 𝑡𝑜 𝑛∑
𝑖=1
𝑤𝑖 = 1𝑊ℎ𝑒𝑟𝑒 𝐺 (𝑤1, 𝑤2, . . . , 𝑤𝑛)
(3)
In our study, CMA-ES under fuzzy conditions was used tomake clear the optimization problem formulated in (3). Thequality of a solution is defined by the fitness function. Theproblem was coded and solved by MATLAB 2011 in 2016.Elapsed time for solution and the number of iteration were188.86 seconds and 197218, respectively. CMA-ES algorithmhas been explained by many sources in detail [38, 46].Besides, the steps of algorithmare given in the SupplementaryMaterials (available here).
2.1.2. Fuzzy DEMATEL (FDEMATEL). FDEMATEL wasused first by Lin andWu [47]whileDEMATELwas developedby Gabus and Fontela [48]. It is helpful for monitoring thestructure of complex causal relationships with matrices ordigraphs. FDEMATEL is amethod which gathers group ideasand analyzes the cause and effect relationship of complicatedproblems in fuzzy environments. Shieh et al. [49] evaluatedthe importance of the criteria and constructed the causal rela-tionships among the criteria with FDEMATEL. ConvertingFuzzy Data into Crisp Scores (CFCS) defuzzification methodgenerated by Opricovic and Tzeng [50] was employed inthis paper. Since Fuzzy DEMATEL method can get anintelligible structural model of the system by transformingthe relationship between the causes and effects of criteria [51–53], this method has been chosen for weighing the criteria[54]. The procedure for weighing criteria of the FDEMATELmethod is shortly explained below [55] and given in theSupplementary Materials as detailed.
Step 1. Identify the decision aim and establish a committee.
Step 2. Develop the assessment criteria and design the fuzzylinguistic range.
Step 3. Acquire and average the evaluations of decisionmakers.
Step 4. Steps of Converting Fuzzy data into Crisp Scoresdefuzzification Method
Step 5. Acquire the normalized direct-relation fuzzy matrix.(𝑋)Step 6. Acquire the total-relational fuzzy matrix (��)Step 7. Determine the criteria weights. (𝜔𝑖)2.2. Combination of MCDM and WLC. Our problem isto find the best one among the existing housing for thecustomer who wants to purchase a house. Generally, MCDMtechniques are required to answer this problem. This studycombines the spatial analyst of GIS andmulticriteria decisionanalysis in the housing evaluation site selection model. Thechoice of weights and weighting techniques has an importanteffect on decision making. In MCDM methods, the mostimportant point is to find criteria weights especially objective.While criteria weights determined with subjective decisionmaking methods depend on decision makers’ preferences,weights with objective decision making are obtained from

6 Mathematical Problems in Engineering
mathematical models [56]. Weights assigned to criteria inMCDM methods are the most important task and stepto reach final results mostly depending on such weights.Writers working on MCDM have more commonly indicatedthat there is no single MCDM method considered whichcan be superior method for all decision making problemsto weigh the criteria [57–59]. Recently, some authors haveused some performance evaluation approach tomake criteriaweights correct and overcome this problem [60]. In thisstudy, performance measurement for alternative ranking wasperformed by maximizing WLC that is probably the mostused MCDM technique in land suitability score calculationsrelated to GIS. The higher WLC score, the more suitablesite selection area. The total WLC score for each alternativeis calculated by multiplying the weight assigned to eachattribute by the scaled value and then summing the productsover all attributes. The sum of weights as a requirement inproducing the final susceptibility map must equal 1. Differentdata layers for 29 criteria which correlate to various physical,cultural, or economic factors that would be important forsite selection analysis were created and mapped [2–5, 9].The results are often shown on a map that is employed tohighlight areas from high to low suitability [20, 21]. With thehelp of WLC, factors are put together by applying a weightto each factor followed by a summation of the results toacquire a suitability map. In our study, proposed housingareas were selected by assigning weights based on the criteriadetermined by real estate agencies and literature search [19].Suitability index (S) to generate the overall score of a cell isgiven in the following formula defined in
𝑆 = 𝑛∑𝑖=1
𝑊𝑖.𝑋𝑖.𝑚∏𝑗=1
𝐶𝑗 (4)
where S is the suitability, Wi the weight of factor i, nthe number of factors, Xi the criterion score of factor iin continued range, and Cj restricted state for any area.WLC function of ArcGIS model builder has been appliedto generate housing evaluation suitability map. Malczewskiand Rinner [61] highlighted WLC as the most popular MCE(Multicriteria Evaluation) method about suitability analysiswith GIS on location which was developed by Voogd [62].In order to find the suitable alternatives for housing siteselection, WLC models have been commonly used in SDSS.Generally, SDSS considers many criteria to make a decision.Since determining the factor weights of WLC effectivelyand in a realistic style without user bias is difficult as aweakness point, different MCDM methods have been usedto find the weights of criteria with the combination ofWLC. The outcomes exhibited the capability of the modelto eliminate human interference. Suitability score indicateswhich locations or areas are particularly well suited for aspecific purpose. A suitability map is created as a result ofobtaining the suitability score. The evaluation was done byintersecting 29 criteria such as social, economic, ecologic,and environmental as given in Table 1. We assumed thatsuitability is linear with respect to scores and that variablesare independent. Organizing a single index of evaluationcombined by MCDA provides information about severalcriteria. To combine continuous factors by applying a weightto each factor, a linear combination is used to get a suitabilitymap [63, 64]. One of the significant applications for spatialplanning andmanagement is GIS-based land suitability map-ping [65]. Score values in decision matrix are standardized asdefined in
V (𝑎𝑞𝑖𝑘) =
{{{{{{{{{
𝑎𝑞𝑖𝑘−min𝑖,𝑞 {𝑎𝑞𝑖𝑘}
𝑟𝑞𝑘
, for 𝑡ℎ𝑒 𝑘 − 𝑡ℎ 𝑐𝑟𝑖𝑡𝑒𝑟𝑖𝑜𝑛 𝑡𝑜 𝑏𝑒 𝑚𝑎𝑥𝑖𝑚𝑖𝑧𝑒𝑑max𝑖,𝑞 {𝑎𝑞𝑖𝑘} − 𝑎𝑞𝑖𝑘
𝑟𝑞𝑘
, for 𝑡ℎ𝑒 𝑘 − 𝑡ℎ 𝑐𝑟𝑖𝑡𝑒𝑟𝑖𝑜𝑛 𝑡𝑜 𝑏𝑒 𝑚𝑖𝑛𝑖𝑚𝑖𝑧𝑒𝑑(5)
where min {𝑎𝑖𝑘} and max {𝑎𝑖𝑘} are the values of minimumand maximum criterion for the k-th criterion, respectively,and 𝑟𝑘 = max {𝑎𝑖𝑘} − min {𝑎𝑖𝑘} is the global range of the k-th criterion. In the standardized score values V{𝑎𝑖𝑘}, rangingfrom 0 to 1, 0 is the least suitable value while 1 is the mostdesired score.
3. Results
According to the linguistic variables in Table 2, real estateexperts and decision makers selected randomly from housesevaluated decision criteria. The data were obtained fromhousing based different locations.
To determine the weighting of criteria is a significantpoint in MCDM. Many researchers have accepted direct andindirect way for deciding the value of criteria weighting.
Decision maker’s preference or opinion may contain uncer-tain information. Thus, methods might result in some incon-sistency in the weighting. The purpose of the comparisonfor the MCDA methods is to demonstrate the feasibility ofthe model-based objective approaches and which MCDAmethods will be more suitable in selection and evaluationproblems. In this study, ten real estate experts working in themarket were asked for the evaluation of 29 decision criteria.The results calculated using FDEMATEL and CMA-ES underfuzzy conditions were given in Table 3. The criteria weightsobtained from CMA-ES and the FDEMATEL algorithmswere processed manually in ArcGIS using WLC method.
Figure 4 shows a sample grid-cells suitability value calcu-lation for 29 criteria for the effect of scale on WLC suitabilityvalue. The weights were obtained from the CMA-ES method.Equation (5) has been used for the score values. Score values

Mathematical Problems in Engineering 7
Table 2: Linguistic scales for criteria weights and alternatives.
Linguistic variables Fuzzy (FDEMATEL) Triangular fuzzy number Linguistic variable (CMA-ES) Triangular Fuzzy NumberNo Impact (N) (0.00,0.00,0.25) Equally strong (1,1,1)Very Low Impact (VL) (0.00,0.25,0.50) Intermediate (1,2,3)Low Impact (L) (0.25,0.50,0.75) Moderately strong (2,3,4)High Impact (H) (0.50,0.75,1.00) Intermediate (3,4,5)Very High Impact (VH) (0.75,1.00,1.00) Strong (4,5,6)
Intermediate (5,6,7)Very strong (6,7,8)Intermediate (7,8,9)
Extremely strong (9,9,9)
110 130 80 120
100 120 90 195
120 160 90 200
95 100 87 125
0,25 0,42 0,00 0,33
0,17 0,33 0,08 0,96
0,33 0,67 0,08 1,00
0,13 0,17 0,06 0,38
(Standardize)
Housing Value (1000TL)
110 130 80 120
100 120 90 195
120 160 90 200
95 100 87 125
0,00 0,67 0,67 0,67
0,67 0,00 0,67 0,67
1,00 0,00 0,67 0,37
1,00 0,67 0,37 1,00
(Standardize)
Landscape Score
… … … …
… … … …
… … … …
… … … …
… … … …
… … … …
… … … …
… … … …
(Standardize)
…
4 3 4 4
4 4 3 4
4 4 4 4
4 3 4 4
1,00 0,00 1,00 1,00
1,00 1,00 0,00 1,00
1,00 1,00 1,00 1,00
1,00 0,00 1,00 1,00
(Standardize)
Parking
0,81 0,81 0,23 0,85
0,79 0,77 0,19 0,92
0,22 0,83 0,84 0,93∗
0,23 0,17 0,75 0,81
(W= 0,1930)
(W= 0,00526)
(W= … )
(W= 0,03062)
∗ Best Cell
Figure 4: The effect of scale on WLC suitability value.
were obtained from the questionnaire data relying on 160houses as a sample.
A location of houses and information based on criteriawas determined with positional database logic using onArcGIS raster map.The 3most commonly used interpolationmethods in the ArcGIS program have been investigatedby comparing RMSE values. These values were mapped as
vectorial (positional) and transformed to raster (pixel) datausing IDW (Inverse Distance Weighting) interpolation as adeterministic spatial interpolation model adopted by geosci-entists to find the unknown location method. In order topredict the unknown interval values, the points close to eachother were clustered together. According to the IDWmethod,the highest weight is assigned to the nearest one where the

8 Mathematical Problems in Engineering
Table3:Th
eimpo
rtance
weight
ofeach
criterio
nby
metho
ds.
Criteria
C1C2
C3C4
C5C6
C7C8
C9C1
0FD
EMAT
EL0.034
0.06
40.043
0.04
20.011
0.011
0.012
0.016
0.038
0.035
CMA-
ES0.082
0.00
00.00
50.00
00.010
0.016
0.017
0.020
0.010
0.00
5Cr
iteria
C11
C12
C13
C14
C15
C16
C17
C18
C19
C20
FDEM
ATEL
0.019
0.04
20.021
0.021
0.027
0.00
60.020
0.04
40.06
40.058
CMA-
ES0.00
60.002
0.00
40.00
40.011
0.003
0.00
50.04
00.013
0.021
Criteria
C21
C22
C23
C24
C25
C26
C27
C28
C29
FDEM
ATEL
0.035
0.034
0.083
0.030
0.026
0.033
0.037
0.026
0.053
CMA-
ES0.012
0.038
0.019
0.012
0.575
0.012
0.002
0.030
0.00
1

Mathematical Problems in Engineering 9
Figure 5: Areal raster map obtained from FDEMATEL weights and WLC suitability values.
Figure 6: Areal raster map obtained from CMA-ES weights and WLC suitability.
smallest weight value is assigned to the farthest one. As aresult, IDW interpolation method was chosen because IDWRMSE: 0.2501, RBF RMSE: 0.2536, and Ordinary KrigingRMSE: 0.2725 were obtained. Two different raster maps wereproduced by applying the IDW interpolation method basedonWLC suitability values obtained from the residential basis.The WLC classification was made to be very low suitabilityfrom 0 to 0.20, low suitability from 0.20 to 0.40, moderatesuitability from 0.4 to 0.60, high suitability from 0.60 to 0.80,and very high suitability from 0.80 to 1. Raster map obtainedfrom CMA-ES weights was divided into 5 classes but thatproduced by FDEMATEL weights was divided into 3 classesfor WLC suitability values (Figures 5 and 6).
When comparing between Figures 4 and 5, areas withvery high suitability on the map obtained from CMA-ESweights seems to be similar to the high suitability areasobtained by FDEMATEL weights. The low suitability areain the northeast of CMA-ES weights and the low suitabilityarea of FDEMATELweightswere identical.Themap obtainedfrom FDEMATEL weights has not shown very high and verylow suitability areas. It seems to be a medium-suitability(yellow) area in large proportion. Accordingly, the suitability
map obtained from CMA-ES weights has shown all classesand produced more sensitive map.
In this context, the WLC was employed in the criteriaaggregation, producing a priority map for Kayseri that wasclassified into five priority levels: very low, low,medium, high,and very high. It seems clear that these weights will havefull effect with WLC operator. The suitability status of all thedwelling units assessed for the WLC values calculated withCMA-ES and FDEMATEL weights is shown on the Kayserineighbourhood map (Figure 7). According to this map, it hasbeen seen that the houses with the highest suitability in termsof investment are in Alpaslan, Kosk, and Melikgazi streets.This shows that the suitabilitymaps obtainedwith theweightsin these areas and the housing values are compatible with eachother.
Our goal from a performance criterion measuring theweighting efficiency is to maximize the WLC value for160 alternatives. We achieved CMA-ES-WLC maximizationvalues for 104 alternatives but we obtained FDEMATEL-WLCmaximization values for 56 alternatives as shown in Table 4.Thus, housing suitability map was performed with CMA-ESweighting model approach. Since the WLC value close to 1 is

10 Mathematical Problems in Engineering
Figure 7: Housing location suitability comparison by hybrid weighting definition methods.
Table 4: Differences between CMA-ES and FDEMATEL models.
Name WLC Suitability Value for CMA-ES WLC Suitability Value for FDEMATEL Difference1014-08 0.25 0.42 -0.171014-07 0.18 0.37 -0.191014-06 0.21 0.41 -0.201014-05 0.21 0.39 -0.18. . . . . . . . . . . .1024-09 0.77 0.44 0.331024-12 0.83 0.51 0.321003-14 0.23 0.53 -0.301003-19 0.27 0.52 -0.25FDEMATEL performance (negative value) 56 (35%)CMA-ES performance (Positive value) 104 (65 %)
the most suitable value, if the difference is positive, it is thereason for preference.
4. Discussion and Conclusions
This paper has shown that evolutionary-based map produc-tion in the evaluation of housing as an objective approach islikely more efficient than subjective approaches. We proposeCMA-ES-WLC as a new hybrid EA for the solution of siteselection problem with respect to performance evaluationbased on suitability value. In order to produce housing suit-ability raster map, WLC approach was applied successfullyby measuring performance of criteria weights. Successfulimplementation of this study would enable decision makersto follow a comprehensive easy-to-use procedure tomake thecorrect decision.The criterionnumber 25 described as gardenis the most important factor for CMA-ES in maximizing thedecision goal. Therefore, today and in the future, decisionmaker should firstly take this factor into consideration inurban planning because of priority preference of customers.IDW interpolation method was employed to determineappropriate region in the mapping. The problem of optimiz-ing housing and regional selection was solved in terms ofindividual and institutional investment. By setting their own
criteria on these maps in accordance with their own goals,anybody can determine the most suitable housing or the areawhere their residence is located. Local governments will beable to adjust their services accordingly by determiningwhichcriteria are the most important. Local taxation coefficientscan be obtained to increase wealth by making classificationson the map developed by the local governments in determin-ing property taxes as a result of this study. Development of aregional housing evaluation map will help determine servicequality standards in fulfilling responsibilities of central andlocal governments. Governments will be able to distributeservices provided by local authorities on an equal basisacross their city. Aforementioned features are useful fora municipal agency to do a housing evaluation map forplanning purposes. In Table 5, we found some classificationdimension from the results obtained and some interpretationcan be made about housing location areas (zones) as follows:
S1: When WLC classification is made according to bothweight methods, there is no worst zone in terms of housingevaluation and selection.
S2: According to both weighting methods in terms ofhousing evaluation and selection, a region of about 10% isworse based on WLC classification. In the classification mapobtained from the FDEMATEL method, only the marginal

Mathematical Problems in Engineering 11
Table 5: Classification dimension of suitability zones for CMA-ES and FDEMATEL models.
Suitability Zones Class Percent (%) Area (km2)FDEMATEL CMA-ES FDEMATEL CMA-ES
S1 (0.0000-0.1999) Very Low Suitability 0 0 0.00 0.00S2 (0.2000-0.3999) Low Suitability 8 13 6.51 10.58S3 (0.4000-0.5999) Medium Suitability 81 22 65.94 17.91S4 (0.6000-0.7999) High Suitability 11 51 8.95 41.51S5 (0.8000-1.0000) Very High Suitability 0 14 0.00 11.40Total 100 100 81.40 81.40
areas which are east of Kayseri were found as poor regions.According to the CMA-ES method, some of the old streetsin the city and the streets in the east of the city wereidentified as poor districts. They are the areas where peoplewho have a low income level live and which are generallyunplanned.
S3: According to FDEMATEL weights and WLC classi-fication, 80% of the residential areas fall into this area. Inthe CMA-ES weights and WLC classification, 22% of theresidential areas are located in this region. Even though theseareas are planned, they are now developing regions accordingto the plan of the city of 30-40 years ago and where the peoplebelonging to low-middle-income level live.
S4: These regions are good areas for housing quality andplanned settlements. Generally, the income levels are in theregions where people live on average of about $ 1000 amonth.According to the CMA-ES weighting method, 51% of theentire area is available as a suitable region. This situation isconsistent with Turkey’s economic realities and Kayseri.
S5:This region did not occur in the FDEMATEL methodand the WLC classification. According to the CMA-ESmethod and WLC classification, the most suitable areasinclude Kayseri’s most prestigious streets such as Alpaslan,Kosk, Melikgazi, and Gultepe. They are the most beautifulregions of the city in terms of planning and have shown greatdevelopment since 2000’s. Housing values are also high inthe region. They are close to Sivas street and tram line whichprovide main transportation of the city. The income level ofpeople living in this region is about 2000 dollars a month.
Nowadays, the development of web-based data collectionsystems is necessary to apply for all countries since theywill bring a new perspective in the evaluation and selec-tion of housing. Raster maps can be drawn in the futureby calculating web-based suitability values. In the futurestudy, different evolutionary/hybrid evolutionary algorithms(such as RAND: a random search algorithm, FFGA: Fon-seca and Fleming’s multiobjective EA, NPGA: the NichedPareto Genetic Algorithm, HLGA: Hajela and Lin’s weighted-sum based approach, VEGA: the Vector Evaluated GeneticAlgorithm, NSGA: the Nondominated Sorting Genetic Algo-rithm, SOEA: a single-objective evolutionary algorithmusingweighted-sum aggregation, and SPEA: the Strength ParetoEvolutionary Algorithm) can be used for housing evaluation[66–73]. With the help of this approach, producers andconsumers can invest by specifying their streets or residenceby entering their own benchmark values.
Data Availability
The data used to support the findings of this study areavailable from the corresponding author upon request.
Conflicts of Interest
The authors declare that they have no conflicts of interest.
Acknowledgments
The authors want to express their thanks to Prof. Dr. FranzROTHLAUF from the Department of Information Systems,Mainz University, Germany, for his invaluable and significantcontributions and Dr. Burak URAZEL from the Departmentof Electrical and Electronics Engineering, Osmangazi Uni-versity, Turkey, because of his help in coding which wasrequired.
Supplementary Materials
This section is used for finding the weighting of criteria(factors) by application of Fuzzy DEMATEL and CMA-ESMethod. (Supplementary Materials)
References
[1] J. Tosun, “How the eu handles uncertain risks: understandingthe role of the precautionary principle,” Journal of EuropeanPublic Policy, vol. 20, no. 10, pp. 1517–1528, 2013.
[2] A. L. Dannenberg, R. J. Jackson, H. Frumkin et al., “The Impactof CommunityDesign and Land-Use Choices on Public Health:A Scientific Research Agenda,” American Journal of PublicHealth, vol. 93, no. 9, pp. 1500–1508, 2003.
[3] H. Barton, “Landuse planning andhealth andwell-being,” LandUse Policy, vol. 26, no. 1, pp. S115–S123, 2009.
[4] F. Dieleman, Households and housing: Choice and outcomes inthe housing market, Routledge, 2017.
[5] J. Dumanski, “Criteria and indicators for land quality andsustainable land management,” ITC Journal, vol. 1997, no. 3-4,pp. 216–222, 1997.
[6] LandUsePlaning, 2017, http://www.sustainablecitiesinstitute.org/topics/land-use-and-planning/land-use-and-planning-tradi-tional-approaches.
[7] M. Kasanko, J. I. Barredo, C. Lavalle et al., “Are European citiesbecoming dispersed? A comparative analysis of 15 European

12 Mathematical Problems in Engineering
urban areas,” Landscape and Urban Planning, vol. 77, no. 1-2, pp.111–130, 2006.
[8] Land Use 2017, 2017, http://www.sustainablecitiesinstitute.org/Documents/SCI/Topic Overviews/Land%20Use%20-%20Full%20OverviewNew NLC.pdf.
[9] J.Malczewski, “GIS-based land-use suitability analysis: a criticaloverview,” Progress in Planning, vol. 62, no. 1, pp. 3–65, 2004.
[10] “Law On Land Development Planning And Control, Law No:3194, Date of Enactment: 3/5/1985, Published in the OfficialGazette: Date: 9/5/1985 Issue: 18749, Publication Series,” vol. 5,no 24, pp. 378, 1985.
[11] A. Ocu, “The politics of the urban landmarket in Turkey: 1950–1980,” International Journal of Urban and Regional Research, vol.12, no. 1, pp. 38–64, 1988.
[12] J. Corburn, Toward the healthy city: people, places, and thepolitics of urban planning, MIT Press, 2009.
[13] A. Bozdag, “Combining AHP with GIS for assessment ofirrigation water quality in Cumra irrigation district (Konya),Central Anatolia, Turkey,”Environmental Earth Sciences, vol. 73,no. 12, pp. 8217–8236, 2015.
[14] A. Ugurlar and T. O. Eceral, “Turkiye’de konut politikalariningelisim sureci ve Ankara Metropol kentinde mevcut kiralikkonut piyasasina iliskin bir degerlendirme,” in Kbam Kentselve Bolgesel Arastırmalar Agı 3. Kent Bolgeler, MetropolitenAlanlar ve Buyuksehirler, vol. 3, pp. 6-7,Metropoliten Alanlar veBuyuksehirler, Degisen Dinamikler ve Sorunlar Bildiri Kitabı,Ulusal, 2012.
[15] L. Alkan and A. Ugurlar, “Turkiye’de konut sorunu ve konutpolitikalari,” Kent Arastirmalari Enstitusu, Rapor, 2015.
[16] L. Gigovic, D. Pamucar, D. Bozanic, and S. Ljubojevic, “Appli-cation of the GIS-DANP-MABAC multi-criteria model forselecting the location of wind farms: A case study of Vojvodina,Serbia,” Journal of Renewable Energy, vol. 103, pp. 501–521, 2017.
[17] L. Gigovic, D. Pamucar, Z. Bajic, and M. Milicevic, “Thecombination of expert judgment andGIS-MAIRCA analysis forthe selection of sites for ammunition depots,” Sustainability , vol.8, no. 4, 2016.
[18] D. Pamucar, L. Gigovic, Z. Bajic, and M. Janosevic, “LocationSelection for Wind Farms Using GIS Multi-Criteria HybridModel: An Approach Based on Fuzzy and Rough Numbers,”Sustainability , vol. 9, no. 8, p. 1315, 2017.
[19] B. Bostanci, Forecasting analysis on real estate development andapplication of housing area model in Istanbul Unpublished Ph.D.Thesis, Istanbul, 2008, https://tez.yok.gov.tr/UlusalTezMerkezi/.
[20] P. Jankowski, “Integrating geographical information systemsand multiple criteria decision-making methods,” InternationalJournal of Geographical Information Science, vol. 9, no. 3, pp.251–273, 1995.
[21] J. Malczewski, “A GIS-based approach to multiple criteriagroup decision-making,” International Journal of GeographicalInformation Science, vol. 10, no. 8, pp. 955–971, 1996.
[22] M. A. Mohit andM. M. Ali, “Integrating GIS and AHP for landsuitability analysis for urban development in a secondary city ofBangladesh,” Jurnal Alam Bina, vol. 81, p. 19, 2006.
[23] T. Rashed and J. Weeks, “Assessing vulnerability to earthquakehazards through spatial multicriteria analysis of urban areas,”International Journal of Geographical Information Science, vol.17, no. 6, pp. 547–576, 2003.
[24] X. Ying, G.-M. Zeng, G.-Q. Chen, L. Tang, K.-L. Wang, and D.-Y. Huang, “Combining AHP with GIS in synthetic evaluationof eco-environment quality-A case study of Hunan Province,China,” Ecological Modelling, vol. 209, no. 2-4, pp. 97–109, 2007.
[25] F. Morari, E. Lugato, and M. Borin, “An integrated non-point source model-GIS system for selecting criteria of bestmanagement practices in the PoValley, North Italy,”Agriculture,Ecosystems & Environment, vol. 102, no. 3, pp. 247–262, 2004.
[26] N. J. Martin, B. St Onge, and J.-P. Waaub, “Integrated decisionaid system for the development of Saint Charles River alluvialplain, Quebec, Canada,” International Journal of Environmentand Pollution, vol. 12, no. 2, pp. 264–279, 1999.
[27] M. J. Aitkenhead and I. H. Aalders, “Predicting land cover usingGIS, Bayesian and evolutionary algorithm methods,” Journal ofEnvironmental Management, vol. 90, no. 1, pp. 236–250, 2009.
[28] J. Malczewski, “GIS-based multicriteria decision analysis: asurvey of the literature,” International Journal of GeographicalInformation Science, vol. 20, no. 7, pp. 703–726, 2006.
[29] K. Rajitha, C. K. Mukherjee, and R. Vinu Chandran, “Applica-tions of remote sensing and GIS for sustainable management ofshrimp culture in India,” Aquacultural Engineering, vol. 36, no.1, pp. 1–17, 2007.
[30] E. Natividade-Jesus, J. Coutinho-Rodrigues, andC.H. Antunes,“A multicriteria decision support system for housing evalua-tion,”Decision Support Systems, vol. 43, no. 3, pp. 779–790, 2007.
[31] S. J. Carver, “Integrating multi-criteria evaluation with geo-graphical information systems,” International Journal of Geo-graphical Information Science, vol. 5, no. 3, pp. 321–339, 1991.
[32] J. Coutinho-Rodrigues, A. Simao, and C. H. Antunes, “A GIS-basedmulticriteria spatial decision support system for planningurban infrastructures,” Decision Support Systems, vol. 51, no. 3,pp. 720–726, 2011.
[33] N. Sharmin and M. N. Neema, “A GIS based multicriteriaanalysis to site appropriate locations of hospitals in Dhaka City,”Asian Transactions on Engineering, vol. 03, no. 04, pp. 2221–4267, 2013.
[34] X. Li and A. G.-O. Yeh, “Integration of genetic algorithmsand GIS for optimal location search,” International Journal ofGeographical Information Science, vol. 19, no. 5, pp. 581–601,2005.
[35] L. Gigovic, D. Pamucar, D. Lukic, and S. Markovic, “GIS-Fuzzy DEMATEL MCDA model for the evaluation of the sitesfor ecotourism development: a case study of ‘Dunavski kljuc’region, Serbia,” Land Use Policy, vol. 58, pp. 348–365, 2016.
[36] G. Romano, P. Dal Sasso, G. Trisorio Liuzzi, and F. Gentile,“Multi-criteria decision analysis for land suitability mapping ina rural area of Southern Italy,” Land Use Policy, vol. 48, pp. 131–143, 2015.
[37] S. Nasehi, S. Karimi, andH. Jafari, “Application of fuzzy GIS andANP for wind power plant site selection in east,” in Azerbaijanprovince of Iran, vol. 02, pp. 116–124, Computational ResearchProgress in Applied Science Engineering, 2016.
[38] N.Hansen, “TheCMAEvolution Strategy: ATutorial Nikolaus,”Hansen, 2016, http://cma.gforge.inria.fr/.
[39] S. Y. Yuen, C. K. Chow, X. Zhang, and Y. Lou, “Which algo-rithm should i choose: An evolutionary algorithm portfolioapproach,” Applied Soft Computing, vol. 40, pp. 654–673, 2016.
[40] N. Hansen and A. Ostermeier, “Completely derandomized self-adaptation in evolution strategies,” Evolutionary Computation,vol. 9, no. 2, pp. 159–195, 2001.
[41] N. Hansen, A. Auger, R. Ros, S. Finck, and P. Posık, “Comparingresults of 31 algorithms from the black-box optimization bench-marking BBOB-2009,” in Proceedings of the 12th Annual Geneticand Evolutionary Computation Conference, GECCO-2010, pp.1689–1696, USA, July 2010.

Mathematical Problems in Engineering 13
[42] S. Belaqziz, S. Mangiarotti, M. Le Page et al., “Irrigationscheduling of a classical gravity network based on the Covari-ance Matrix Adaptation - Evolutionary Strategy algorithm,”Computers and Electronics in Agriculture, vol. 102, pp. 64–72,2014.
[43] G. A. Jastrebski and D. V. Arnold, “Improving evolution strate-gies through active covariance matrix adaptation,” in Proceed-ings of the 2006 IEEE Congress on Evolutionary Computation,CEC 2006, pp. 2814–2821, Canada, July 2006.
[44] O. Krause and T. Glasmachers, “A CMA-ES with multiplicativecovariance matrix updates,” in Proceedings of the 16th Geneticand Evolutionary Computation Conference, GECCO 2015, pp.281–288, Spain, July 2015.
[45] A. F. A. Moneim, “Fuzzy genetic prioritization in multicriteriadecision problems,” Jordan Journal of Mechanical and IndustrialEngineering, vol. 24, pp. 175–182, 2008.
[46] D. V. Arnold and N. Hansen, “A (1+1)-CMA-ES for constrainedoptimisation,” in Proceedings of the 14th International Confer-ence on Genetic and Evolutionary Computation, GECCO’12, pp.297–304, USA, July 2012.
[47] C. J. Lin and W. W. Wu, “A causal analytical method for groupdecision-making under fuzzy environment,” Expert Systemswith Applications, vol. 34, no. 1, pp. 205–213, 2008.
[48] A.Gabus andE. Fontela,World problems, an invitation to furtherthought within the framework of DEMATEL, Battelle GenevaResearch Center, Geneva, Switzerland, 1972.
[49] J. I. Shieh, H. K. Chen, and H. H. Wu, “Case study of applyingfuzzy dematel method to evaluate performance criteria ofemployment service outreach program,” International Journalof Industrial Engineering, vol. 20, pp. 1–20, 2013.
[50] S. Opricovic and G.-H. Tzeng, “Defuzzification within a multi-criteria decision model,” International Journal of Uncertainty,Fuzziness and Knowledge-Based Systems, vol. 11, no. 5, pp. 635–652, 2003.
[51] C.-Y. Hsu, K.-T. Chen, and G.-H. Tzeng, “FMCDM with fuzzyDEMATEL approach for customers’ choice behavior model,”International Journal of Fuzzy Systems, vol. 9, no. 4, pp. 236–246,2007.
[52] Y. Kim, “Study on Impact Mechanism for Beef Cattle Farmingand Importance of Evaluating Agricultural Information inKorea Using DEMATEL, PCA and AHP,” Agricultural Informa-tion Research, vol. 15, no. 3, pp. 267–279, 2006.
[53] A. H. I. Lee, W.-C. Chen, and C.-J. Chang, “A fuzzy AHP andBSC approach for evaluating performance of IT departmentin the manufacturing industry in Taiwan,” Expert Systems withApplications, vol. 34, no. 1, pp. 96–107, 2008.
[54] J. S. Jeong, L. Garcıa-Moruno, J. Hernandez-Blanco, and A.Sanchez-Rıos, “Planning of rural housings in reservoir areasunder (mass) tourismbased on a fuzzy DEMATEL-GIS/MCDAhybrid and participatory method for Alange, Spain,” HabitatInternational, vol. 57, pp. 143–153, 2016.
[55] D. Dalalah, M. Hayajneh, and F. Batieha, “A fuzzy multi-criteriadecision making model for supplier selection,” Expert Systemswith Applications, vol. 38, no. 7, pp. 8384–8391, 2011.
[56] A. Aalianvari, H. Katibeh, and M. Sharifzadeh, “Application offuzzy Delphi AHPmethod for the estimation and classificationof ghomrud tunnel from groundwater flow hazard,” ArabianJournal of Geosciences, vol. 5, no. 2, pp. 275–284, 2012.
[57] N. H. Zardari, K. Ahmed, S. M. Shirazi, and Z. B. Yusop,“Literature Review,” in Weighting Methods and their Effectson Multi-Criteria Decision Making Model Outcomes in Water
Resources Management, SpringerBriefs in Water Science andTechnology, pp. 7–67, Springer International Publishing, Cham,2015.
[58] M. Velasquez and P. T. Hester, “An analysis of multi-criteriadecision making methods,” International Journal of OperationsResearch, vol. 10, no. 2, pp. 56–66, 2013.
[59] E. Triantaphyllou, “Multi-criteria decision makingmethods,” inMulti-criteria Decision Making Methods: A Comparative Study,vol. 44 of Applied Optimization, pp. 5–21, Springer US, Boston,MA, 2000.
[60] B. Bostancı, M. Zeydan, M. Cete, H. Demir, and A. Karaagac,“Decision Making for Site Selection Using Fuzzy Modeling,”Journal of Urban Planning and Development, vol. 143, no. 1, p.05016010, 2017.
[61] J. Malczewski and C. Rinner, “Multiattribute decision analysismethods,” in Multicriteria Decision Analysis in GeographicInformation Science, pp. 81–121, Springer, Berlin, Heidelberg,Germany, 2015.
[62] H. Voogd, Multicriteria evaluation for urban and regionalplanning, vol. 20, London, 1983.
[63] J. Malczewski, “On the use of weighted linear combinationmethod in GIS: Common and best practice approaches,” Trans-actions in GIS, vol. 4, no. 1, pp. 5–22, 2000.
[64] R. J. Eastman, Guide to GIS and Image processing, vol. 2, USA,Clark University, 2001.
[65] J. Malczewski, “Ordered weighted averaging with fuzzy quanti-fiers: GIS-based multicriteria evaluation for land-use suitabilityanalysis,” International Journal of Applied EarthObservation andGeoinformation, vol. 8, no. 4, pp. 270–277, 2006.
[66] C. M. Hosage and M. F. Goodchild, “Discrete space location-allocation solutions from genetic algorithms,” Annals of Opera-tions Research, vol. 6, no. 2, pp. 35–46, 1986.
[67] L. Pitaksringkarn and M. A. P. Taylor, “Grouping GeneticAlogirhtm InGIS: A Facility LocationModelling,” Journal of theEastern Asia Society for Transportation Studies, vol. 6, pp. 2908–2920, 2005.
[68] S. Sasaki, A. J. Comber, H. Suzuki, and C. Brunsdon, “Usinggenetic algorithms to optimise current and future healthplanning - the example of ambulance locations,” InternationalJournal of Health Geographics, vol. 9, article no. 4, 2010.
[69] D. Gong, M. Gen, G. Yamazaki, and W. Xu, “Hybrid evolu-tionary method for capacitated location-allocation problem,”Computers & Industrial Engineering, vol. 33, no. 3-4, pp. 577–580, 1997.
[70] C. A. C. Coello, G. B. Lamont, and D. A. van Veldhuizen,Evolutionary Algorithms for Solving Multi-Objective Problems,Springer, New York, NY, USA, 2007.
[71] E. Zitzler, K. Deb, and L.Thiele, “Comparison of multiobjectiveevolutionary algorithms: empirical results,” Evolutionary Com-putation, vol. 8, no. 2, pp. 173–195, 2000.
[72] C. M. Fonseca and P. J. Fleming, “An overview of evolutionaryalgorithms in multiobjective optimization,” Evolutionary Com-putation, vol. 3, no. 1, pp. 1–16, 1995.
[73] S. Arifin, Location Allocation Problem Using Genetic Algorithmand Simulated Annealing: A Case Study Based on School inEnschede, Unpublished Master’s Thesis, Department of Geo-information Science and Earth Observation, University ofTwente, Enschede, The Netherlands, 2011.

Hindawiwww.hindawi.com Volume 2018
MathematicsJournal of
Hindawiwww.hindawi.com Volume 2018
Mathematical Problems in Engineering
Applied MathematicsJournal of
Hindawiwww.hindawi.com Volume 2018
Probability and StatisticsHindawiwww.hindawi.com Volume 2018
Journal of
Hindawiwww.hindawi.com Volume 2018
Mathematical PhysicsAdvances in
Complex AnalysisJournal of
Hindawiwww.hindawi.com Volume 2018
OptimizationJournal of
Hindawiwww.hindawi.com Volume 2018
Hindawiwww.hindawi.com Volume 2018
Engineering Mathematics
International Journal of
Hindawiwww.hindawi.com Volume 2018
Operations ResearchAdvances in
Journal of
Hindawiwww.hindawi.com Volume 2018
Function SpacesAbstract and Applied AnalysisHindawiwww.hindawi.com Volume 2018
International Journal of Mathematics and Mathematical Sciences
Hindawiwww.hindawi.com Volume 2018
Hindawi Publishing Corporation http://www.hindawi.com Volume 2013Hindawiwww.hindawi.com
The Scientific World Journal
Volume 2018
Hindawiwww.hindawi.com Volume 2018Volume 2018
Numerical AnalysisNumerical AnalysisNumerical AnalysisNumerical AnalysisNumerical AnalysisNumerical AnalysisNumerical AnalysisNumerical AnalysisNumerical AnalysisNumerical AnalysisNumerical AnalysisNumerical AnalysisAdvances inAdvances in Discrete Dynamics in
Nature and SocietyHindawiwww.hindawi.com Volume 2018
Hindawiwww.hindawi.com
Di�erential EquationsInternational Journal of
Volume 2018
Hindawiwww.hindawi.com Volume 2018
Decision SciencesAdvances in
Hindawiwww.hindawi.com Volume 2018
AnalysisInternational Journal of
Hindawiwww.hindawi.com Volume 2018
Stochastic AnalysisInternational Journal of
Submit your manuscripts atwww.hindawi.com