a new generation of thermal energy benchmarks for
TRANSCRIPT

energies
Article
A New Generation of Thermal Energy Benchmarksfor University Buildings
Salah Vaisi 1,* , Saleh Mohammadi 1,2 , Benedetto Nastasi 3 and Kavan Javanroodi 4
1 Department of Architecture, Faculty of Art and Architecture, University of Kurdistan (UOK), Sanandaj 0871,Iran; [email protected]
2 Department of Architectural Engineering + Technology, Faculty of Architecture and the Built Environment,Delft University of Technology (TU Delft), 2628BX Delft, The Netherlands
3 Department of Planning, Design & Technology of Architecture, Sapienza University of Rome, Via Flaminia72, 00196 Rome, Italy; [email protected]
4 Solar Energy and Building Physics Laboratory (LESO-PB), Ecole Polytechnique Fédérale deLausanne (EPFL), 1015 Lausanne, Switzerland; [email protected]
* Correspondence: [email protected] or [email protected]; Tel.: +98-918-871-5086
Received: 10 November 2020; Accepted: 11 December 2020; Published: 14 December 2020 �����������������
Abstract: In 2008, the Chartered Institution of Building Services Engineers (CIBSE TM46 UC) presentedan annual-fixed thermal energy benchmark of 240 kWh/m2/yr for university campus (UC) buildingsas an attempt to reduce energy consumption in public buildings. However, the CIBSE TM46 UCbenchmark fails to consider the difference between energy demand in warm and cold months, as thethermal performance of buildings largely depends on the ambient temperature. This paper presents anew generation of monthly thermal energy benchmarks (MTEBs) using two computational methodsincluding mixed-use model and converter model, which consider the variations of thermal demandthroughout a year. MTEBs were generated using five basic variables, including mixed activities inthe typical college buildings, university campus revised benchmark (UCrb), typical operation ofheating systems, activities impact, and heating degree days. The results showed that MTEBs varyfrom 24 kWh/m2/yr in January to one and nearly zero kWh/m2/yr in June and July, respectively. Basedon the detailed assessments, a typical college building was defined in terms of the percentage ofits component activities. Compared with the 100% estimation error of the TM46 UC benchmark,the maximum 21% error of the developed methodologies is a significant achievement. The R-squaredvalue of 99% confirms the reliability of the new generation of benchmarks.
Keywords: energy benchmarking; university campus; energy performance certificate; CIBSE TM46;thermal energy efficiency
1. Introduction
There has been a global trend in the recent years to reduce energy demand and greenhousegas (GHG) emissions in the higher educational institution buildings [1]. The trend is even moreaccelerated by the new policies and regulations such as the European Green Deal with ambitious goalsto achieve neutral GHG cities and areas by 2050 [2]. In this regard, energy benchmarking is a usefultool to evaluate the energy performance of buildings [3]. The higher educational buildings (universitybuildings) are important in terms of high energy demand (kWh/m2) and the variety of activities inthe buildings.
Chartered Institution of Building Services Engineers (CIBSE) TM46:2008 [4] is one of thefundamental references for energy performance certification, and benchmarking in buildings. Despitethe improvement of the energy performance of university buildings in recent years, the CIBSE TM46
Energies 2020, 13, 6606; doi:10.3390/en13246606 www.mdpi.com/journal/energies

Energies 2020, 13, 6606 2 of 18
UC (university campus) benchmark has remained unchanged [5]. The CIBSE TM46 UC benchmarksignificantly overestimates the thermal demand compared with the actual measurements [6]. Most ofthe benchmarking methodologies such as ”Energy Star” and CIBSE TM46 have focused on the annualscale [7], while failed to consider the differences in thermal energy consumption in the cold and warmmonths. This leads to a notable gap in the energy demand estimations where the annual benchmark isincapable to provide detailed information based on outdoor temperature [8]. This can be even morecritical considering the convoluted urban microclimate conditions around buildings [9] and complexinteractions between outdoor temperature and other climate variables. Although the benchmarkingmethodology is not feasible to take into account detailed climate variations, it is vital to investigate forfiner temporal resolution (e.g., seasonal or monthly) models to assess energy consumption profiles ofuniversity buildings. This paper addressed this research gap by introducing a novel method, namely,monthly thermal energy benchmarks (MTEBs). MTEBs aim to represent the monthly variations ofmixed-use campus buildings as an accurate tool to move towards sustainable transition pathways ineducational buildings.
This paper is structured as follows. First, the background of energy benchmarking systemsis assessed (Section 1.1) to highlight the major research gaps in the field. The study of the relatedworks and the discussion of the TM46 benchmarking method are presented in Sections 1.2 and 1.3,respectively. In Section 1.4, the contributions of this study are discussed. The methods and materialadopted and developed in the paper are explained thoroughly in Section 2. The application of majorbenchmarking methods, including mixed-use and converter models are assessed in Sections 3 and 4,respectively. The novel benchmarking model (MTEBs) is presented in Section 5, followed by theconclusion to highlight the major findings of the study.
1.1. Background of Energy Benchmarking Systems
The “energy benchmarking” term was used in the 1990s to refer to the knowledge of comparingenergy consumption in similar building types (peer buildings) [10]. The top-down benchmarkingmethod uses real consumption data to calculate the energy benchmark of peer buildings. This is acomprehensive method applying officially in the EU, US, Australia, Japan, Canada, and other countriesto manage the end-use energy consumption in buildings [11]. Benchmarking is a cornerstone of theEuropean Council Directive 93/76/CEE [12] to improve energy efficiency and reduce CO2 emissions inbuildings. Energy benchmarking compares the annual total primary energy required (TPER) per unitarea (m2) in a building with the median consumption of peers [13].
Based on Chapter 20 of the original CIBSE Guide F: “Energy efficiency in buildings” and EnergyConsumption Guide ECG 19: “Energy efficiency in offices”, the CIBSE TM46 energy benchmark wasupdated by the Chartered Institution of Building Services Engineers (CIBSE) in 2008. CIBSE TM46 [4]and TM47 [14] explain the statutory energy benchmarks in buildings, which are used as predominantreferences in the EU and UK to calculate the building energy ratio (BER). BER is the main part of adisplay energy certificate (DEC).
According to the CIBSE TM46, 237 building types were classified into 29 benchmark categoriesbased on the building’s dominant function (single function). TM46 presumes the buildings as asingle function and neglects other functions (activities) in the buildings, while many of them aremultifunctional (mixed-use) particularly in city centers. According the CIBSE TM46, a universitycampus building (a typical educational building on/off campus) needs 240 kWh/m2/yr of thermalenergy per year [4].
There are fundamental modifications in thermal demand during a year; however, TM46 andEnergy Star methodology cannot explain such variations. The majority of heat demand (80%) inwinters is used for space heating purposes, whereas in summers the energy is consumed to preparedomestic hot water [15]. The accuracy of TM46 UC benchmarks has been studied recently by severalresearchers and a series of problems, such as a significant discrepancy between the benchmark andactual measurements have been reported frequently [16,17]. For example, Vaisi et al. discovered a

Energies 2020, 13, 6606 3 of 18
30% gap between the actual consumption and TM46 UC benchmark [8]. Based on the actual dataof four university buildings in Dublin, the authors revised the CIBSE TM46 thermal benchmark of240 kWh/m2/yr and introduced a university campus revised benchmark (UCrb) of 130 kWh/m2/yr as avalidated annual index. In addition, the reviewed studies not only highlighted the requirement forrevising the TM46 benchmarks [18], but also suggested the necessity for renaming the UC category [19].The majority of current energy models present the annual-fixed benchmark, which take into accountbuildings as single-use (single function, single activity) because the data on mixed activities usuallyare unavailable or hard to collect.
1.2. Display Energy Certificate (DEC)
Display energy certificate (DEC) is an authentic certificate that shows the annual energyperformance of buildings (Figure 1). The DEC dataset is used frequently for energy managementin buildings. In summer 2008, for the first time, DECs were introduced in the EU under the EnergyPerformance of Building Directive (EPBD) regulation [20]. DEC presents the building energy efficiency,which is calculated using the total primary energy requirement (TPER). TPER is the overall quantity ofall energies (electricity, oil, coal, gas, renewables, etc.) delivered to a building, including the energythat is used or lost beyond the boundary of the building during energy transformation, transmission,and distribution processes. The other index displayed on DECs is total primary fossil energy required(TPEFR), which shows the annual fossil thermal energy delivered to the boundary of buildings(Figure 1).
Energies 2020, 13, x FOR PEER REVIEW 3 of 18
kWh/m2/yr and introduced a university campus revised benchmark (UCrb) of 130 kWh/m2/yr as a validated annual index. In addition, the reviewed studies not only highlighted the requirement for revising the TM46 benchmarks [18], but also suggested the necessity for renaming the UC category [19]. The majority of current energy models present the annual-fixed benchmark, which take into account buildings as single-use (single function, single activity) because the data on mixed activities usually are unavailable or hard to collect.
1.2. Display Energy Certificate (DEC)
Display energy certificate (DEC) is an authentic certificate that shows the annual energy performance of buildings (Figure 1). The DEC dataset is used frequently for energy management in buildings. In summer 2008, for the first time, DECs were introduced in the EU under the Energy Performance of Building Directive (EPBD) regulation [20]. DEC presents the building energy efficiency, which is calculated using the total primary energy requirement (TPER). TPER is the overall quantity of all energies (electricity, oil, coal, gas, renewables, etc.) delivered to a building, including the energy that is used or lost beyond the boundary of the building during energy transformation, transmission, and distribution processes. The other index displayed on DECs is total primary fossil energy required (TPEFR), which shows the annual fossil thermal energy delivered to the boundary of buildings (Figure 1).
Total final consumption (TFC) or actual consumption (recorded consumption) is the amount of energy consumed in a building. TFC is measured by meters and it is typically the quantity shown on bills [21]. If other types of bulk energy such as oil and coal are used, for calculation of TPFER they must be converted into kgCO2 or kWh of energy. Generally, TPFER is approximately 20% greater than TFC [22].
On DEC, the quantity of TPER (kWh/m2/yr) is divided by the annual benchmark, the consumption of 50% of samples, and the percentage of the result is called BER, which is graded. The alphabetical grades range from “A1” to “G” and show the best to worst efficiency, respectively. The TPER, TPFER, and BER displayed on a DEC are presented in Figure 1.
Figure 1. The main data presented on a display energy certificate (DEC).
1.3. Related Works
Figure 1. The main data presented on a display energy certificate (DEC).
Total final consumption (TFC) or actual consumption (recorded consumption) is the amount ofenergy consumed in a building. TFC is measured by meters and it is typically the quantity shown onbills [21]. If other types of bulk energy such as oil and coal are used, for calculation of TPFER theymust be converted into kgCO2 or kWh of energy. Generally, TPFER is approximately 20% greater thanTFC [22].

Energies 2020, 13, 6606 4 of 18
On DEC, the quantity of TPER (kWh/m2/yr) is divided by the annual benchmark, the consumptionof 50% of samples, and the percentage of the result is called BER, which is graded. The alphabeticalgrades range from “A1” to “G” and show the best to worst efficiency, respectively. The TPER, TPFER,and BER displayed on a DEC are presented in Figure 1.
1.3. Related Works
The literature in the field of benchmarking can be divided into four categories including (1)benchmarking methods and data assessment, (2) underlining the discrepancy between the energybenchmarks and actual consumption, (3) energy performance over time, and (4) reviewing the policyand presenting new recommendations. This study falls into the first and second categories.
Pasichnyi et al. [23] recommended the display energy certificate system as a new opportunityfor data-enabled urban energy policy instruments. However, the certificate systems are mostlylimited to annual scale rather than monthly. Burman et al. [24] compared the annual fossil–thermalperformance of five new educational buildings in the UK against the operational benchmarks atthe annual scale and discovered a significant discrepancy between the heating energy use and thedesign expectations. Papadopoulos et al. [25] assessed the energy use intensity between 2011 and 2016and used approximately 15,000 energy consumption data of New York City properties based on anannual period.
To address the role of mixed activities on energy consumption, a study was conducted based onquantile regression model. The authors analyzed the electricity consumption of nearly 1000 buildingsand found that cooling degree days and the presence of gyms, spas, and elevators were significantfactors affecting the energy use. Moreover, the number of employees per unit area had a great effect onthe total electricity consumption in poorly performing buildings [26].
Liu et al. [27] developed a systematic methodology as well as an energy consumption rating(ECR) system to create dynamic energy benchmarks for an individual office building with verylimited information. Based on outdoor temperature, relative humidity, and daily energy consumption,the authors, at an hourly scale analysis, presented four typical energy benchmarks, including 272,427, 497, and 592 kWh, which represent the momentary operation of the studied building. Anotherstudy identified three fundamental energy consumption periods, i.e., morning, noon, and eveningpeak energy consumption patterns using K-means clustering and load shape profile [28]. The authorsdiscovered how energy consumption is changed during the daytime and consequently, they plottedthe typical consumption patterns of four groups of buildings. Those patterns are the basis for modelinghigher resolution profiles from monthly bills [29] or to evaluate flexibility potential of the builtenvironment [30].
Papadopoulos and Kontokosta [31] developed a building GREEN energy grading methodologyby adopting machine learning and city-specific energy use and building data to enable more precise,reasonable, and contextualized individual building energy profiles [31]. They indicated how differentfactors such property value (cost/square ft), unit density, bedroom density, built year, etc. affected theenergy use intensity. Finally, they proposed a graded (alphabetical) annual benchmark instead of the0–100 rating system of Energy Star. A large number of studies have frequently adopted statisticalbenchmarking models using machine-learning algorithms that can illustrate multifaceted relationshipsbetween energy uses and building characteristics, such as floor area and functions [32–34].
Khoshbakht et al. [35] adopted stochastic frontier analysis (SFA) to determine benchmark valuesfor various activities and disciplines in higher educational buildings. They classified the educationalbuildings into different activities (e.g., research, academic offices, administration, library, teachingspaces) but did not look into the monthly or seasonal consumption patterns. In another work conductedin 81 residential buildings in Singapore [36], the authors proposed a framework to categorize thebuildings by their operational similarities using data mining obtained from smart meters. Theyhighlighted the impact of the mixed-use operation on energy demand and discovered that the activityplays a key role in energy consumption. For instance, the residential buildings had fewer facilities and

Energies 2020, 13, 6606 5 of 18
lower energy load density compared to the buildings with research centers. Therefore, the EUI (EnergyUse Intensity) was much smaller than the mixed-use buildings due to the galleries and laboratoriesthat require energy in 24 h. However, the impact of each activity on energy consumption and theirweight were not addressed.
Arjunan et al. [37] developed a method based on both linear and nonlinear models to increase theaccuracy of energy benchmarking of office buildings in the US. They applied several building attributessuch as gross floor area, cooling gross floor area, number of employees, computers, and cooling degreedays, and determined the features affecting energy consumption.
1.4. The Novelty of the Proposed Method
Based on the reviewed literature, there are still unexplored particular areas, even not addressedby the renowned benchmarking systems such as CIBSE (worldwide approved benchmarking system)and Energy Star (US benchmarking system). Most of the research reviewed focused on analyzingstatic snapshots of buildings, i.e., annual fixed energy benchmark rather than dynamic performancetrends over time, and considered buildings as a single activity [38]. Applying an annual-fixedbenchmark and considering the buildings as single-use are the major research gaps in the field.This paper moves beyond the current state-of-art by proposing a new generation of thermal energybenchmarks, monthly thermal energy benchmarks (MTEBs), instead of a fixed-annual benchmark.The MTEBs benchmarking method improves the CIBSE TM46 UC benchmark of 240 kWh/m2/yr byincorporating monthly variables, which are sensitive to ambient temperature and environmentalconditions. Moreover, this study considers the impacts of various activities such as computer rooms,offices, library, laboratory, seminar and research rooms, workshop, stores, and restaurant and coffeeshops on the energy consumption in typical college buildings using a revised benchmark (UCrb)model. Readers are referred to an earlier study by the authors [8] for more information about theUCrb benchmark.
Moreover, five fundamental parameters were applied in the mixed-use and converter models,including conditioned area of buildings, heating degree days (HDD), mixed-use, a recently revisedbenchmark (UCrb), and typical operation hours of heating systems. Finally, this study aims to fillthe discrepancy between the TM46 UC benchmark and actual heat consumption highlighted in theliterature, which is a step beyond the model introduced by Vaisi et al. [8] in 2018. For the first time,a definition of typical college buildings based on their mixed activities is presented.
Figure 2 is a schematic ideogram that shows the gap between CIBSE TM46 benchmark and theactual consumptions during a year, and it illustrates how a curved line benchmark can be betteradapted to reality. The CIBSE TM46 UC benchmark is a horizontal line, an index for a whole year,while the methodology of MTEBs has focused on transforming the horizontal TM46 UC into a monthlydynamic benchmark (a curved line) that delivers valuable information.
Energies 2020, 13, x FOR PEER REVIEW 5 of 18
attributes such as gross floor area, cooling gross floor area, number of employees, computers, and cooling degree days, and determined the features affecting energy consumption.
1.4. The Novelty of the Proposed Method
Based on the reviewed literature, there are still unexplored particular areas, even not addressed by the renowned benchmarking systems such as CIBSE (worldwide approved benchmarking system) and Energy Star (US benchmarking system). Most of the research reviewed focused on analyzing static snapshots of buildings, i.e., annual fixed energy benchmark rather than dynamic performance trends over time, and considered buildings as a single activity [38]. Applying an annual-fixed benchmark and considering the buildings as single-use are the major research gaps in the field. This paper moves beyond the current state-of-art by proposing a new generation of thermal energy benchmarks, monthly thermal energy benchmarks (MTEBs), instead of a fixed-annual benchmark. The MTEBs benchmarking method improves the CIBSE TM46 UC benchmark of 240 kWh/m2/yr by incorporating monthly variables, which are sensitive to ambient temperature and environmental conditions. Moreover, this study considers the impacts of various activities such as computer rooms, offices, library, laboratory, seminar and research rooms, workshop, stores, and restaurant and coffee shops on the energy consumption in typical college buildings using a revised benchmark (UCrb) model. Readers are referred to an earlier study by the authors [8] for more information about the UCrb benchmark.
Moreover, five fundamental parameters were applied in the mixed-use and converter models, including conditioned area of buildings, heating degree days (HDD), mixed-use, a recently revised benchmark (UCrb), and typical operation hours of heating systems. Finally, this study aims to fill the discrepancy between the TM46 UC benchmark and actual heat consumption highlighted in the literature, which is a step beyond the model introduced by Vaisi et al. [8] in 2018. For the first time, a definition of typical college buildings based on their mixed activities is presented.
Figure 2 is a schematic ideogram that shows the gap between CIBSE TM46 benchmark and the actual consumptions during a year, and it illustrates how a curved line benchmark can be better adapted to reality. The CIBSE TM46 UC benchmark is a horizontal line, an index for a whole year, while the methodology of MTEBs has focused on transforming the horizontal TM46 UC into a monthly dynamic benchmark (a curved line) that delivers valuable information.
Figure 2. Monthly thermal energy benchmarks (MTEBs) ideogram.
2. Methodology
To create the monthly thermal energy benchmarks (MTEBs), the actual thermal consumption data and the operational hours of the heating systems of 52 buildings in four university campuses (Trinity College Dublin, University College Dublin, Dublin City University, Dublin Institute of Technology) were analyzed. The actual energy consumption data were obtained from the Cylon Active Energy Management online dataset [39]. The heating degree day data were collected from Degree Days.net [40]. To discover the mixed activities in the case study buildings, a survey was
Figure 2. Monthly thermal energy benchmarks (MTEBs) ideogram.

Energies 2020, 13, 6606 6 of 18
2. Methodology
To create the monthly thermal energy benchmarks (MTEBs), the actual thermal consumption dataand the operational hours of the heating systems of 52 buildings in four university campuses (TrinityCollege Dublin, University College Dublin, Dublin City University, Dublin Institute of Technology)were analyzed. The actual energy consumption data were obtained from the Cylon Active EnergyManagement online dataset [39]. The heating degree day data were collected from Degree Days.net [40].To discover the mixed activities in the case study buildings, a survey was conducted at the floor scale.According to the assessment of energy consumption of 52 UC buildings, five key parameters that affectthe thermal energy demand were found to be:
1. Area (m2)—building useful area and activities area;2. Mixed-use activities—this factor considers all activities in a building and calculates the value
of each activity based on its area—the composite benchmark is one of the results of themixed-use method;
3. UCrb (university campus revised benchmark)—the revised benchmark of 130 kWh/m2/yr [8] wasused instead of 240 kWh/m2/yr as suggested by CIBSE TM46;
4. Heating degree days (HDD);5. Typical operation hours of heating systems—usually influenced by the college’s energy policy,
not occupants’ behavior.
The area of all activities in the surveyed buildings was calculated based on the architecturalplans of the buildings. The impact of various activities on thermal energy consumption in the collegebuildings was determined based on the percentage area of activities. Based on the actual thermalconsumption data recorded at the quarter-hour scale [39], the typical operating hours of the heatingsystems were calculated and the results presented in Table 1.
Table 1. Typical operation hours of heating systems.
Months Jan Feb Mar Apr May Jun Jul Aug Sep Oct Nov Dec TotalYear
Meanoperation of10 buildings
300 280 260 250 240 85 45 35 80 223 249 229 2276
Two models were developed to generate the MTEBs: (1) mixed-use model and (2) converter model.The mixed-use model relies upon the impact of all activities in a building on thermal consumption.Accordingly, a composite benchmark that considers the role of mixed activities in terms of thermalenergy demand was progressed. The converter model, developed based on the annual thermalconsumption, presenting on DECs. The accuracy of both models was validated against the actualthermal consumption.
To assess the impact of various activities on thermal demand, the area of all the activities of thecase study buildings was surveyed, and then the area of each activity calculated in AutoCAD precisely.Ten activities were identified in 52 analyzed college buildings, while among them, 7 activities werecommon in all cases. Based on the analysis, a typical college building in terms of mixed activities isdefined for the first time: a typical college building is a type of educational building, comprising seventypical mixed activities, including computer rooms and laboratories (31%), offices (29%), seminar andresearch rooms (18%), library (14%), workshop (4%), stores (3%), and restaurant or coffee shop (1%).
The energy demand estimation based on TM46 UC benchmark against the actual consumptiondata of ”Aras An Phiarsaigh” building at the Trinity College Dublin (TCD) campus was analyzed as asample and the results, as well as the estimation of the mixed-use model, are presented in Figure 3.Both estimations were assessed against the actual data. Lines (a) and (M) show the mean annual

Energies 2020, 13, 6606 7 of 18
estimations of TM46 UC benchmark (240 kWh/m2/yr) and the mixed-use model, respectively, whileline (b) presents the mean of annual actual data.
Energies 2020, 13, x FOR PEER REVIEW 7 of 18
convert this horizontal line into monthly figures. To generate the monthly thermal benchmarks, two models were improved using further drivers. Additional information about the generation of the models is presented in Sections 2.1 and 2.2.
Figure 3. CIBSE TM46 UC and mixed-use model for thermal estimation against the actual data, ArasAn Phiarsaigh building, Trinity College Dublin (TCD) campus 2014.
2.1. Mixed-Use Model
The mixed-use methodology is applicable to existing buildings and buildings at the construction stage. The method relies on CIBSE TM46 benchmarks, including 29 building categories, especiallythose categories found mostly in a typical college building such as “general office”, “restaurant”, “cultural activities”, “classrooms”, and “general retail”. Based on the analysis, most of the collegebuildings comprise seven typical activities, i.e., mixed-use functions. In fact, activity plays a key role in thermal demand; for example, a general office needs 120 kWh/m2/yr of thermal energy while a restaurant needs 370 kWh/m2/yr [4,14].
Using Equation (1) and the architectural maps, the quantity of thermal demand of a mixed-use college building can be calculated. By dividing the annual thermal demand by 12 (Equation (2)) the mean monthly thermal demand can also be calculated. To calculate the composite benchmark, Equation (1) is divided by the total useful floors area (TUFA) of the buildings; therefore, Equation (3) indicates how to calculate a composite benchmark. The mixed-use method to estimate the annual thermal demand follows: [ 𝑓1 × 𝐴1 + 𝑓2 × 𝐴2 + 𝑓3 × 𝐴3 + ⋯ 𝑓n × 𝐴n ] = ∑ (𝐴𝑖 × 𝑓𝑖) (1)
Mixed − Use (mean monthly heat demand) = ∑ (Ai × fi)12 = 𝐸𝑞𝑢𝑎𝑡𝑖𝑜𝑛 (1)12 (2)
Composite benchmark = ∑ (𝐴𝑖 × 𝑓𝑖)𝐴(𝑇𝑈𝐹𝐴) = 𝐸𝑞𝑢𝑎𝑡𝑖𝑜𝑛 (1)𝐴 (𝑇𝑈𝐹𝐴) (3)
Coefficient (n) = 𝐸𝑞𝑢𝑎𝑡𝑖𝑜𝑛 (3)𝑇𝑀46 𝑈𝐶 𝑏𝑒𝑛𝑐ℎ𝑚𝑎𝑟𝑘 (4)
0
10,000
20,000
30,000
40,000
50,000
60,000
70,000
80,000
90,000
100,000
Actual (kWh)
72,940 kWh, CIBSE TM46 mean monhtly
42,217 kWh, Mixed-use mean monthly
kWh
Difference 68%
CIBSE (mean monthly) Mixed-Use (mean monthly)Actual (mean monthly)
23,015 kWh, Actual mean monthly
(a)
(b)
𝒂 + (𝒃)𝟐(M)
24,434 Impact of Coefficient (n)
(a)+(b)/2
Difference 6%
Impact of Coefficient (n), Line N
(N)
Difference 45% Difference 42%
Figure 3. CIBSE TM46 UC and mixed-use model for thermal estimation against the actual data, ArasAn Phiarsaigh building, Trinity College Dublin (TCD) campus 2014.
Considering the Aras An Phiarsaigh building as an example, the differences between thermaldemand estimations of TM46 (mean annual) and the mixed-use model with the actual consumptionwere 68% and 45%, respectively (Figure 3). The result shows the mixed-use model improved thethermal demand estimation, approximately 42% compared with TM46. Coefficient (n) was defined toimprove the accuracy of the mixed-use model as the ratio of the composite benchmark to the TM46UC benchmark (240 kWh/m2/yr). Coefficient (n) reduced the errors of the mixed-use model to 6%.At this stage, the mixed-use model presents an annual-fixed estimation (line M); however, the aim isto convert this horizontal line into monthly figures. To generate the monthly thermal benchmarks,two models were improved using further drivers. Additional information about the generation of themodels is presented in Sections 2.1 and 2.2.
2.1. Mixed-Use Model
The mixed-use methodology is applicable to existing buildings and buildings at the constructionstage. The method relies on CIBSE TM46 benchmarks, including 29 building categories, especiallythose categories found mostly in a typical college building such as “general office”, “restaurant”,“cultural activities”, “classrooms”, and “general retail”. Based on the analysis, most of the collegebuildings comprise seven typical activities, i.e., mixed-use functions. In fact, activity plays a key rolein thermal demand; for example, a general office needs 120 kWh/m2/yr of thermal energy while arestaurant needs 370 kWh/m2/yr [4,14].
Using Equation (1) and the architectural maps, the quantity of thermal demand of a mixed-usecollege building can be calculated. By dividing the annual thermal demand by 12 (Equation (2))the mean monthly thermal demand can also be calculated. To calculate the composite benchmark,Equation (1) is divided by the total useful floors area (TUFA) of the buildings; therefore, Equation (3)
Energies 2020, 13, 6606 8 of 18
indicates how to calculate a composite benchmark. The mixed-use method to estimate the annualthermal demand follows:
[ f1 ×A1 + f2 ×A2 + f3 ×A3 + . . . fn ×An ] =n∑
i = 1
(Ai× f i) (1)
Mixed−Use (mean monthly heat demand) =
∑ni = 1(Ai× f i)
12=
Equation (1)12
(2)
Composite benchmark =
∑ni = 1(Ai× f i)A(TUFA)
=Equation (1)A (TUFA)
(3)
Coefficient (n) =Equation (3)
TM46 UC benchmark(4)
where (fi) is the CIBSE TM46 benchmark of activity (i), (Ai) is the relevant area of activity (i), and A(m2) is the total useful floor area of the building.
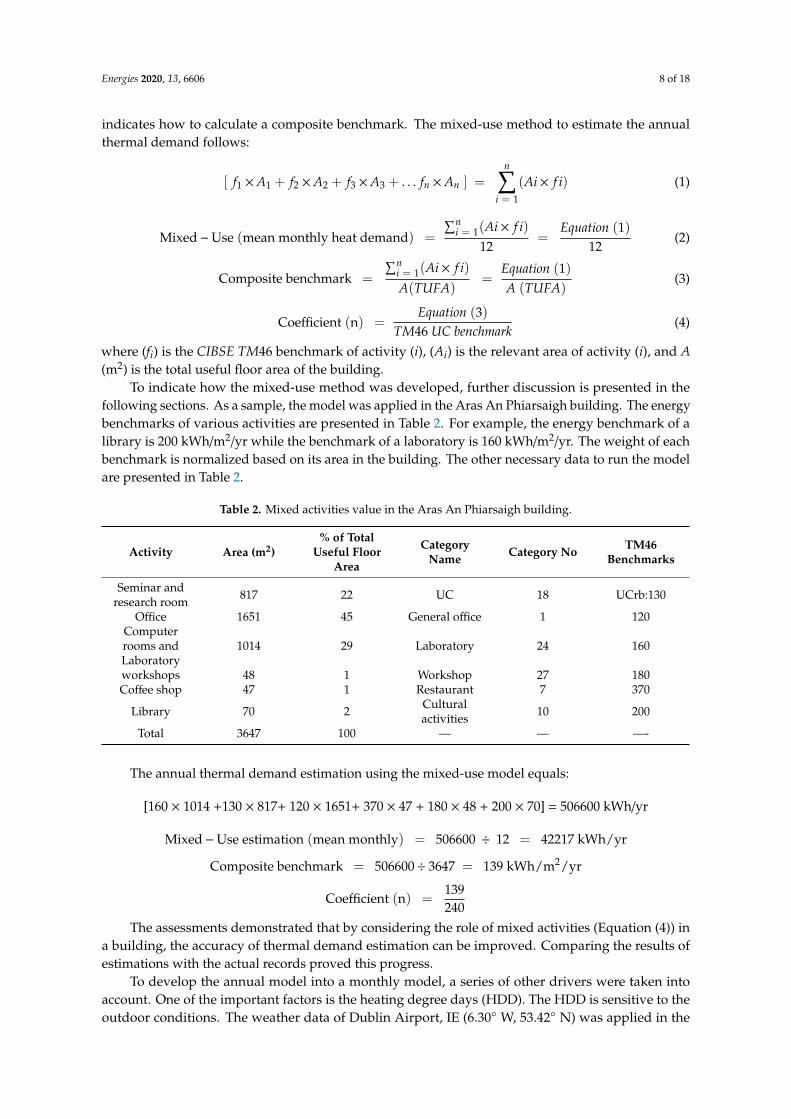
To indicate how the mixed-use method was developed, further discussion is presented in thefollowing sections. As a sample, the model was applied in the Aras An Phiarsaigh building. The energybenchmarks of various activities are presented in Table 2. For example, the energy benchmark of alibrary is 200 kWh/m2/yr while the benchmark of a laboratory is 160 kWh/m2/yr. The weight of eachbenchmark is normalized based on its area in the building. The other necessary data to run the modelare presented in Table 2.
Table 2. Mixed activities value in the Aras An Phiarsaigh building.
Activity Area (m2)% of Total
Useful FloorArea
CategoryName Category No TM46
Benchmarks
Seminar andresearch room 817 22 UC 18 UCrb:130
Office 1651 45 General office 1 120Computerrooms andLaboratory
1014 29 Laboratory 24 160
workshops 48 1 Workshop 27 180Coffee shop 47 1 Restaurant 7 370
Library 70 2 Culturalactivities 10 200
Total 3647 100 — — —-
The annual thermal demand estimation using the mixed-use model equals:
[160 × 1014 +130 × 817+ 120 × 1651+ 370 × 47 + 180 × 48 + 200 × 70] = 506600 kWh/yr
Mixed−Use estimation (mean monthly) = 506600 ÷ 12 = 42217 kWh/yr
Composite benchmark = 506600÷ 3647 = 139 kWh/m2/yr
Coefficient (n) =139240
The assessments demonstrated that by considering the role of mixed activities (Equation (4)) ina building, the accuracy of thermal demand estimation can be improved. Comparing the results ofestimations with the actual records proved this progress.
To develop the annual model into a monthly model, a series of other drivers were taken intoaccount. One of the important factors is the heating degree days (HDD). The HDD is sensitive to theoutdoor conditions. The weather data of Dublin Airport, IE (6.30◦ W, 53.42◦ N) was applied in the

Energies 2020, 13, 6606 9 of 18
calculations and the base temperature of 15.5 ◦C chosen to determine the HDDs. In Table 3, the HDDdata of 2014 are reported.
Table 3. Heating degree days (HDD) for 2014.
Months Jan Feb Mar Apr May Jun Jul Aug Sep Oct Nov Dec
HDD 303 274 267 182 133 63 32 70 72 132 225 316Annual 2069
Through multiplying Equations (1) and (2) by the result obtained from the division of the monthlyHDD by annual HDD ( HDD month
HDD annual ), Equation (5) was created. Then, using Equation (5), the primaryversion of the monthly thermal models was generated. The primary model was applied in 10 buildingsand its accuracy was calibrated using the actual thermal measurements; nevertheless, the Aras AnPhiarsaigh building is discussed in detail.
Equation (5) =
[∑ni = 1(Ai× f i)
]2×HDD month
240×A× HDD(annual)(5)
where (fi) is the CIBSE TM46 benchmark of activity (i), (Ai) is the relevant area of activity (i), A (m2) isthe total useful floor area of a building, and the HDD is the heating degree days at both annual andmonthly scale.
The analysis showed there were significant differences between the estimations of the primaryversion (Equation (5)) of the model and the actual monthly consumption data. The differences,especially in the summer season, were notable. The reason for the lower accuracy of the primaryversion of the model refers to the local energy efficiency policies in universities. For example, it wasfound that despite heating degree days, which shows the thermal demand even during summer inDublin (Table 3), the Estates and Facilities Office at TCD turns off the heating systems during summer.This policy drastically reduced the actual thermal consumption during the summer at TCD. Therefore,another factor, i.e., typical operation hours of heating systems, was taken into account and multiplied byEquation (5) to create Equation (6). In public buildings such as colleges, the operation hours of heatingsystems are not affected by occupant behavior, but controlled by energy managers at universities.
Equation (6) = [[∑n
i = 1(Ai× f i)]2×HDD month
240×A×HDD(annual) ] ×Monthly typical operation (hours)
Standard monthly opration (CIBSE, hours) (6)
where (fi) is the CIBSE TM46 benchmark of activity (i), (Ai) is the relevant area of activity (i), A (m2) is thetotal useful floor area of a building, and HDD is heating degree day at both annual and monthly scale.
The mean absolute percentage error (MAPE) on a monthly scale evaluated the accuracy of thefinal mixed-use model (Equation (6)). Besides, the accuracy of the model was calibrated by R-squaredvalue, which indicates the error between the modeled values and the recorded values. The modelapplied to the other case study buildings. In all of the analyzed buildings, the maximum MAPE at themonthly level was under 21%, whereas it was 18% at the annual level. Compared with the best result(22%) of other annual estimation models [14], the result is acceptable.
2.2. Converter Model
Display energy certificates (DECs) present annual thermal consumption. If DEC documents areavailable, the converter model is more user-friendly compared to the mixed-use method to convert theannual heat demand into the monthly profiles. Normally the TPFER (Figure 1) is presented on DECsin kWh/m2yr. To create a monthly thermal energy model using TPFER, HDD and the operation hoursof heating systems play a key role. Equation (7) shows the final version of the converter model:
Equation (7) = [TPFER×m×A× HDD monthTotal HDD(annual) ] ×
Monthly typical operation (hours)Standard monthly opration (CIBSE, hours) (7)

Energies 2020, 13, 6606 10 of 18
where A (m2) is the total useful floor area of the building and HDD is heating degree day at both annualand monthly scale.
The maximum unit interval of 20%, presented by the coefficient (m) in which m ∈ [0.80, 1] wasconsidered in the model and refers to the difference between TPFER and TFC. This difference was alsoshown by other scholars [22]. To increase the accuracy of simulations this difference was considered.Using the converter model, the annual thermal demand of a typical college building can be convertedinto the monthly figures. To understand how both mixed-use and converter models can be applied inpractice, a flowchart is presented in Appendix A.
3. Application of the Mixed-Use Model
The Museum Building on the TCD campus is located on the south of the New Square, just besidethe Berkeley Library. The building is a mixed-use, typical college building where the Geology andEngineering Departments are housed. TM46 predicts that the building needs 240 kWh/m2 of thermalenergy per year. The actual consumption, HDD, and the mean of monthly thermal demand based onTM46 and the mixed-use model are presented in Figure 4. Compared with TM46, the mixed-use modelimproved the accuracy of estimation by 42%. The data were used to run the mixed-use model for theMuseum Building, as presented in Table 4.
Energies 2020, 13, x FOR PEER REVIEW 10 of 18
TM46 and the mixed-use model are presented in Figure 4. Compared with TM46, the mixed-use model improved the accuracy of estimation by 42%. The data were used to run the mixed-use model for the Museum Building, as presented in Table 4.
Table 4. Museum Building data.
Activities Area (m2) % Area of Activities (m2) Computer rooms and Laboratory 683 19
Office 1553 43Seminar, class, and Research room 965 26
Library 324 9Stores 120 3Total 3645 100
Figure 4. Comparison of actual heat consumption with CIBSE and mixed-use model.
Based on the data presented in Table 4 and using Equation (6), the monthly thermal demand of the Museum Building was generated (Table 5). The MAPE (mean absolute percentage error) of the mixed-use model and TM46 (mean monthly) compared with the actual consumption and the resultsare presented in Table 5.
Table 5. Monthly heat demand and the percent of errors.
Months
Actual GasConsumption,
Museum Building 2012
(kWh/yr)
HDD
2012
Typical Operation of Heating
Systems (Hours)
Mixed-Use
Model (kWh/yr)
TM46 Mean
Monthly (kWh/yr)
MAPE of the
Mixed-Use
Model
MAPE of TM46 (Mean
Monthly)
January 64,200 281 300 57,414 72,900 11 14 February 51,374 253 280 48,247 72,900 6 42
March 47,607 224 260 39,666 72,900 17 53 April 39,534 264 250 44,951 72,900 14 84 May 28,433 171 240 27,951 72,900 2 156 June 0 93 85 5383 72,900 * * July 0 66 45 2023 72,900 * *
0
50
100
150
200
250
300
350
0
10,000
20,000
30,000
40,000
50,000
60,000
70,000
80,000
Actual Gas Consumption, Museum Building 2012 (kWh)
HDD (Heating Degree Days) 2012
kWh
44,008 kWh, Mixed-use average annual
Mixed-use Average annual
CIBSE Average annual
76,440 kWh, CIBSE average annual
HDD
Figure 4. Comparison of actual heat consumption with CIBSE and mixed-use model.
Table 4. Museum Building data.
Activities Area (m2) % Area of Activities (m2)
Computer rooms and Laboratory 683 19Office 1553 43
Seminar, class, and Research room 965 26Library 324 9Stores 120 3Total 3645 100

Energies 2020, 13, 6606 11 of 18
Based on the data presented in Table 4 and using Equation (6), the monthly thermal demand ofthe Museum Building was generated (Table 5). The MAPE (mean absolute percentage error) of themixed-use model and TM46 (mean monthly) compared with the actual consumption and the resultsare presented in Table 5.
Table 5. Monthly heat demand and the percent of errors.
Months
Actual GasConsumption,
Museum Building2012 (kWh/yr)
HDD 2012
TypicalOperationof Heating
Systems(Hours)
Mixed-UseModel
(kWh/yr)
TM46Mean
Monthly(kWh/yr)
MAPE ofthe
Mixed-UseModel
MAPE ofTM46(Mean
Monthly)
January 64,200 281 300 57,414 72,900 11 14February 51,374 253 280 48,247 72,900 6 42
March 47,607 224 260 39,666 72,900 17 53April 39,534 264 250 44,951 72,900 14 84May 28,433 171 240 27,951 72,900 2 156June 0 93 85 5383 72,900 * *July 0 66 45 2023 72,900 * *
August 751 36 35 858 72,900 14 9607September 5276 110 80 5993 72,900 14 1282
October 40,697 214 223 32,502 72,900 20 79November 53,484 272 249 46,128 72,900 14 36December 56,758 310 229 48,349 72,900 15 28
Total 388,114 2294 2276 359,466 874,800 7 125
The overall difference in thermal demand using the mixed-use model with actual annualconsumption was 7%, while the error of TM46 was 125% (Table 5). The greatest error of the mixed-usemodel was 20% in October, while the lowest error of 2% was observed in May. In April, August,and September, the model shows 14% overestimation. However, the greatest monthly MAPE of TM46was 9607%. The high estimation errors of TM46 in summer months means that this benchmarkingsystem cannot reliably predict the thermal demand at smaller temporal resolutions.
Adopting linear regression model [41], the energy demand prediction results of the model wereassessed versus the actual energy demand (Figure 5). R-squared (R2) is a statistical measure thatrepresents the proportion of the variance for a dependent variable that is explained by the independentvariables in a regression model. It is the percentage of the response variable variation that is explainedby a linear model. In our models, the R-squared of 0.971 shows a strong relationship between the actualdata and the predicted figures. Therefore, it proves the high level of accuracy of the mixed-use model.

Energies 2020, 13, 6606 12 of 18
Energies 2020, 13, x FOR PEER REVIEW 11 of 18
August 751 36 35 858 72,900 14 9,607 September 5276 110 80 5993 72,900 14 1,282
October 40,697 214 223 32,502 72,900 20 79 November 53,484 272 249 46,128 72,900 14 36 December 56,758 310 229 48,349 72,900 15 28
Total 388,114 2294 2276 359,466 874,800 7 125
The overall difference in thermal demand using the mixed-use model with actual annual consumption was 7%, while the error of TM46 was 125% (Table 5). The greatest error of the mixed-use model was 20% in October, while the lowest error of 2% was observed in May. In April, August, and September, the model shows 14% overestimation. However, the greatest monthly MAPE of TM46 was 9607%. The high estimation errors of TM46 in summer months means that this benchmarking system cannot reliably predict the thermal demand at smaller temporal resolutions.
Adopting linear regression model [41], the energy demand prediction results of the model were assessed versus the actual energy demand (Figure 5). R-squared (R2) is a statistical measure that represents the proportion of the variance for a dependent variable that is explained by the independent variables in a regression model. It is the percentage of the response variable variation that is explained by a linear model. In our models, the R-squared of 0.971 shows a strong relationship between the actual data and the predicted figures. Therefore, it proves the high level of accuracy of the mixed-use model.
Figure 5. R-squared assessment to control the accuracy of the model.
4. Application of the Converter Model
The converter model is applicable when DECs are available. In fact, this approach relies upon the total primary fossil (nonelectrical) energy required (TPFER) displaying on DECs. In the converter model, the TPFER number, an annual index, was converted into monthly thermal figures, which are more informative for the energy efficiency planning and management. Using Equation (7), the TPFER number on DECs can be converted into the monthly thermal demand values.
As an example, using five key parameters, a monthly thermal demand profile was generated for the Nova Building at the UCD (University College Dublin) campus (Figure 6). According to the Nova’s DEC certificate, the building requires 122 kWh/m2/yr of total primary fossil energy and the
Figure 5. R-squared assessment to control the accuracy of the model.
4. Application of the Converter Model
The converter model is applicable when DECs are available. In fact, this approach relies uponthe total primary fossil (nonelectrical) energy required (TPFER) displaying on DECs. In the convertermodel, the TPFER number, an annual index, was converted into monthly thermal figures, which aremore informative for the energy efficiency planning and management. Using Equation (7), the TPFERnumber on DECs can be converted into the monthly thermal demand values.
As an example, using five key parameters, a monthly thermal demand profile was generated forthe Nova Building at the UCD (University College Dublin) campus (Figure 6). According to the Nova’sDEC certificate, the building requires 122 kWh/m2/yr of total primary fossil energy and the building’stotal useful area is 4066 m2. Both approaches, mixed-use model and converter model, were applied tothe Nova Building and the results compared with the actual records (Figure 6). It can be seen that theactual consumption is located between the estimated values generated by the both models.
Table 6 shows the results of monthly thermal demand prediction generated by both models in theNova Building. Furthermore, the MAPE of the two models was compared with TM46 estimations.The accuracy of TM46 and the monthly models was assessed against the actual figures. The differencesof errors between TM46 and the predictions of the two models were significant. The maximummonthly MAPE of the mixed-use model and converter model was under 22%, while the maximumMAPE of TM46 in August was 7187% (Table 6). This huge error of TM46 in August means that theCIBSE benchmarking system overestimates the energy demand 71 times more than the actual energyconsumption, which indicates the weakness and inability of the CIBSE TM46 benchmarking system.The minimum error of the mixed-use model was 5% and that of the converter model was only 1%,while the minimum error of TM46 was 13%. The annual errors of the monthly models were 11% and14%, respectively. In contrast, the annual error of TM46 was 116%. The comparison methodologyindicates a substantial development of the accuracy for both the mixed-use and converter models.

Energies 2020, 13, 6606 13 of 18
Energies 2020, 13, x FOR PEER REVIEW 12 of 18
building’s total useful area is 4066 m2. Both approaches, mixed-use model and converter model, were applied to the Nova Building and the results compared with the actual records (Figure 6). It can be seen that the actual consumption is located between the estimated values generated by the both models.
Figure 6. Monthly thermal demand profiles, mixed-use model and converter model, Nova Building,University College Dublin (UCD).
Table 6 shows the results of monthly thermal demand prediction generated by both models in the Nova Building. Furthermore, the MAPE of the two models was compared with TM46 estimations. The accuracy of TM46 and the monthly models was assessed against the actual figures. The differences of errors between TM46 and the predictions of the two models were significant. The maximum monthly MAPE of the mixed-use model and converter model was under 22%, while the maximum MAPE of TM46 in August was 7187% (Table 6). This huge error of TM46 in August means that the CIBSE benchmarking system overestimates the energy demand 71 times more than the actual energy consumption, which indicates the weakness and inability of the CIBSE TM46 benchmarking system. The minimum error of the mixed-use model was 5% and that of the converter model was only 1%, while the minimum error of TM46 was 13%. The annual errors of the monthly models were11% and 14%, respectively. In contrast, the annual error of TM46 was 116%. The comparison methodology indicates a substantial development of the accuracy for both the mixed-use andconverter models.
Table 6. Recorded data and monthly profiles and percent of errors compared with mean annual of CIBSE for the Nova Building, UCD.
Months Actual GasConsumption (kWh)
MixedUse
Model (kWh)
Converter
Model (kWh)
TM46 Estimation
(MeanAnnual) (kWh)
MAPE of Mixed
Use Model
MAPE of
Converter
Model
MAPE of TM46
January 71,907 64,550 82,407 81,320 10 15 13 February 63,696 54,244 69,249 81,320 15 9 28
March 47,268 44,538 56,859 81,320 6 20 72 April 55,451 50,538 64,518 81,320 9 16 47 May 34,113 31,425 40,118 81,320 8 18 138 June 6,739 6,053 7,727 81,320 10 15 1,107
Figure 6. Monthly thermal demand profiles, mixed-use model and converter model, Nova Building,University College Dublin (UCD).
Table 6. Recorded data and monthly profiles and percent of errors compared with mean annual ofCIBSE for the Nova Building, UCD.
MonthsActual Gas
Consumption(kWh)
MixedUse
Model(kWh)
ConverterModel(kWh)
TM46Estimation(MeanAnnual) (kWh)
MAPE ofMixed
UseModel
MAPE ofConverter
Model
MAPE ofTM46
January 71,907 64,550 82,407 81,320 10 15 13February 63,696 54,244 69,249 81,320 15 9 28
March 47,268 44,538 56,859 81,320 6 20 72April 55,451 50,538 64,518 81,320 9 16 47May 34,113 31,425 40,118 81,320 8 18 138June 6739 6053 7727 81,320 10 15 1107July 2784 2274 2903 81,320 18 4 2821
August 1116 965 1232 81,320 14 10 7187September 8544 6738 8602 81,320 21 1 852
October 39,015 36,569 46,685 81,320 6 20 108November 54,489 51,895 66,252 81,320 5 22 49December 66,876 54,438 69,497 81,320 19 4 22
Total 451,998 404,227 516,051 975,840 11 14 116
5. Monthly Thermal Energy Benchmarks (MTEBs)
Using the mixed-use and converter models, the monthly thermal energy benchmarks (MTEBs)for typical college buildings were generated. This new generation of thermal energy benchmarksvaries during a year, following the outdoor conditions. The MTEBs methodology can extrapolate intoother weather conditions as well as building types. If in Equations (6) and (7) the total useful area ofbuildings is assumed to be 1 m2 (the definition of benchmark), then the monthly benchmarks per unitarea can be determined accordingly. The annual-fixed benchmark was proposed by TM46 in 2008;i.e., 240 kWh/m2/yr was developed through the models into 12 monthly thermal energy benchmarks.
The MTEBs (Figure 7) show various thermal demand in each month. For example, in January,a typical college building needs 24 kWh/m2/month, and the demand was reduced regularly when theoutdoor temperature was decreased; therefore in June, the benchmark is 1 kWh/m2/month. Likewise,the benchmark from nearly 0 kWh/m2/month in July increased to 19 kWh/m2/month in December.

Energies 2020, 13, 6606 14 of 18
Energies 2020, 13, x FOR PEER REVIEW 13 of 18
July 2,784 2,274 2,903 81,320 18 4 2,821 August 1,116 965 1,232 81,320 14 10 7,187
September 8,544 6,738 8,602 81,320 21 1 852 October 39,015 36,569 46,685 81,320 6 20 108
November 54,489 51,895 66,252 81,320 5 22 49 December 66,876 54,438 69,497 81,320 19 4 22
Total 451,998 404,227 516,051 975,840 11 14 116
5. Monthly Thermal Energy Benchmarks (MTEBs)
Using the mixed-use and converter models, the monthly thermal energy benchmarks (MTEBs)for typical college buildings were generated. This new generation of thermal energy benchmarks varies during a year, following the outdoor conditions. The MTEBs methodology can extrapolate into other weather conditions as well as building types. If in Equations (6) and (7) the total useful area of buildings is assumed to be 1 m2 (the definition of benchmark), then the monthly benchmarks per unit area can be determined accordingly. The annual-fixed benchmark was proposed by TM46 in 2008;i.e., 240 kWh/m2/yr was developed through the models into 12 monthly thermal energy benchmarks.
The MTEBs (Figure 7) show various thermal demand in each month. For example, in January, a typical college building needs 24 kWh/m2/month, and the demand was reduced regularly when the outdoor temperature was increased; therefore in June, the benchmark is 1 kWh/m2/month. Likewise, the benchmark from nearly 0 kWh/m2/month in July increased to 19 kWh/m2/month in December.
Figure 7. Monthly thermal energy benchmarks (MTEBs) for typical college buildings.
Table 7 shows the MTEBs indexes which were validated against the mean of monthly actual consumption (kWh/m2/month) of 10 college buildings obtained from the AEM (Active Energy Management dataset) [39]. Using the mean of actual thermal consumption of the buildings belongingto the four case study universities, the accuracy of MTEBs was assessed and the results are presented in Figure 7.
In addition, the values of MTEBs were compared with the TM46 annual benchmark. According to the analysis, the predictions of MTEBs were very close to the actual measurements. The mean annual actual thermal consumption was 128 kWh/m2/yr and the developed MTEBs predicted 130 kWh/m2/yr, while the TM46 method predicted 240 kWh/m2/yr. The overall MTEB was 130 kWh/m2/yr. The R-squared of 0.995 shows the high level of accuracy for MTEBs, as presented in Figure 8.
Figure 7. Monthly thermal energy benchmarks (MTEBs) for typical college buildings.
Table 7 shows the MTEBs indexes which were validated against the mean of monthly actualconsumption (kWh/m2/month) of 10 college buildings obtained from the AEM (Active EnergyManagement dataset) [39]. Using the mean of actual thermal consumption of the buildings belongingto the four case study universities, the accuracy of MTEBs was assessed and the results are presentedin Figure 7.
Table 7. MTEBs against TM46 UC benchmark and actual thermal consumptions.
MonthsMTEBs Based onMixed-Use Model(kWh/m2/month)
MTEBs based onConverter Model(kWh/m2/month)
MTEBsMean of Both
Models(kWh/m2/month)
Mean of ActualThermal
Consumption of 10Buildings
(kWh/m2/month)
TM46Benchmark
(kWh/m2/yr)
January 21 28 24 24 -February 17 23 20 20 -
March 16 21 19 18 -April 10 14 12 13 -May 7 10 9 7 -June 1 2 1 2 -July 0 0 0 1 -
August 1 1 1 1 -September 1 2 2 2 -
October 7 9 8 8 -November 13 17 15 15 -December 17 22 19 18 -
Total 111 149 130 128 240
In addition, the values of MTEBs were compared with the TM46 annual benchmark. According tothe analysis, the predictions of MTEBs were very close to the actual measurements. The meanannual actual thermal consumption was 128 kWh/m2/yr and the developed MTEBs predicted130 kWh/m2/yr, while the TM46 method predicted 240 kWh/m2/yr. The overall MTEB was130 kWh/m2/yr. The R-squared of 0.995 shows the high level of accuracy for MTEBs, as presentedin Figure 8.

Energies 2020, 13, 6606 15 of 18
Energies 2020, 13, x FOR PEER REVIEW 14 of 18
Table 7. MTEBs against TM46 UC benchmark and actual thermal consumptions.
Months
MTEBs Based on Mixed-Use
Model (kWh/m2/mon
th)
MTEBs based on Converter
Model (kWh/m2/mon
th)
MTEBs Mean of Both
Models (kWh/m2/mont
h)
Mean of Actual
Thermal Consumption
of 10 Buildings (kWh/m2/mont
h)
TM46 Benchmar
k (kWh/m2/
yr)
January 21 28 24 24 - February 17 23 20 20 -
March 16 21 19 18 - April 10 14 12 13 - May 7 10 9 7 - June 1 2 1 2 - July 0 0 0 1 -
August 1 1 1 1 - September 1 2 2 2 -
October 7 9 8 8 - November 13 17 15 15 - December 17 22 19 18 -
Total 111 149 130 128 240
Figure 8. Accuracy assessment of the MTEBs.
6. Conclusions
Due to the excessive dependence of heat consumption on the ambient temperature, the annual-fixed thermal benchmark (240 kWh/m2/yr) suggested by CIBSE TM6 for the category of UC is not very effective. Instead, the concept of monthly thermal energy benchmarks (MTEBs) for typical college buildings was developed, which are more informative, especially for managing the thermal consumption/efficiency at the community scale. Unlike other benchmarking methodologies that consider buildings as having a single function, in this study the mixed activities in buildings were taken into account. Two methods, including mixed-use model and converter model, were adopted to generate the MTEBs. MTEBs present information that is more detailed and therefore more applicable compared to the annual benchmarks such as TM46. This detailed information from the viewpoint of heat efficiency and planning, as well as the energy supplying and financial policy, is vital.
Figure 8. Accuracy assessment of the MTEBs.
6. Conclusions
Due to the excessive dependence of heat consumption on the ambient temperature, the annual-fixedthermal benchmark (240 kWh/m2/yr) suggested by CIBSE TM6 for the category of UC is not very effective.Instead, the concept of monthly thermal energy benchmarks (MTEBs) for typical college buildings wasdeveloped, which are more informative, especially for managing the thermal consumption/efficiencyat the community scale. Unlike other benchmarking methodologies that consider buildings as havinga single function, in this study the mixed activities in buildings were taken into account. Two methods,including mixed-use model and converter model, were adopted to generate the MTEBs. MTEBs presentinformation that is more detailed and therefore more applicable compared to the annual benchmarkssuch as TM46. This detailed information from the viewpoint of heat efficiency and planning, as well asthe energy supplying and financial policy, is vital.
The accuracy of the developed models at a monthly scale was validated against the actual thermalconsumption using the mean absolute percentage error (MAPE). In addition, the truthfulness of thenew generation of the developed benchmarks was examined by linear regressions.
While the discrepancy of the CIBSE TM46 benchmark with the actual consumption was radicallysignificant (e.g., 7187%), the maximum monthly error of the progressed models was lower than 22%.The MTEBs show that a typical college building needs 24 kWh/m2/month in January and the demandreduces regularly in summer months. In June, only 1 kWh/m2/month of heat is needed while in Julyit is nearly zero. The monthly benchmarks from July increased gradually to 19 kWh/m2/month inDecember. The overall annual MTEBs is 130 kWh/m2/yr, which shows a significant improvementcompared with 240 kWh/m2/yr suggested by TM46. The benchmarking methodology developedpresents a curved line instead of an annual-fixed horizontal line as proposed by TM46. In thispaper, 12 thermal energy benchmarks at the monthly level were presented instead of a TM46 annualbenchmark. Finally, the R-squared of 0.995 indicated the high level of reliability of MTEBs. Planners,energy suppliers, and professionals for detailed heat planning at the community scale can use MTEBs.Since the benchmarks play a key role in energy action plans at the national scale, the new generation ofproposed benchmarks can improve the accuracy of national action plans by sharing more informationat the monthly level.
Author Contributions: Conceptualization, S.V.; formal analysis S.V., S.M., and K.J.; investigation, B.N. and S.V.;methodology, S.V., B.N., and S.M.; writing, S.M., K.J., and B.N.; supervision, S.V. and B.N. All authors have readand agreed to the published version of the manuscript.
Funding: This research received no external funding.
Acknowledgments: The authors acknowledge the State Office of four universities in Dublin for sharing DECsand data provided, which facilitated this research. The authors acknowledge in particular Kieron McGovern,

Energies 2020, 13, 6606 16 of 18
Mark Argue, Stephen Folan, and Kieran Brassil for their kind help and providing data. We also acknowledge theDegree Days.net website for sharing the data for free.
Conflicts of Interest: The authors declare no conflict of interest.
Nomenclature
BER: building energy ratio; CIBSE: Chartered Institution of Building Services Engineers; DEC: display energycertificate; HDD: heating degree days; MAPE: mean absolute percentage error; MTEBs: monthly thermal energybenchmarks; TFC: total final consumption or actual consumption is the amount of energy consumed in thebuildings measured by meters and displayed on energy bills; TPER: total primary energy required in a buildingincluding thermal and electricity; TPFER: total primary fossil energy required in a building; UC: universitycampus, refers to the category number 18 of CIBSE TM46:2008 benchmark
Appendix A The Flowchart of Developed Models
The following flowchart shows how both mixed-use model and converter model can be applied in practicestep-by-step, given available energy data.Energies 2020, 13, x FOR PEER REVIEW 16 of 18
Figure A1. The flowchart of model application.
References
1. Evangelinos, K.I.; Jones, N.; Panoriou, E.M. Challenges and opportunities for sustainability in regional universities: A case study in Mytilene, Greece. J. Clean. Prod. 2009, 17, 1154–1161, doi:10.1016/j.jclepro.2009.02.020.
2. Locmelis, K.; Blumberga, D.; Blumberga, A.; Kubule, A. Benchmarking of industrial energy efficiency. outcomes of an energy audit policy program. Energies 2020, 13, 2210, doi:10.3390/en13092210.
3. HG;, K.; SS;, K. Development of energy benchmarks for office buildings using the national energy consumption database. Energies 2020, 13, 950, doi:10.3390/en13040950.
4. Chartered Institution of Building Services Engineers; CIBSE TM46; CIBSE: London, UK,2008. 5. Hong, S.-M.; Steadman, P. An Analysis of Display Energy Certificates for Public Buildings, 2008 to 2012, a Report
to Chartered Institution of Building Services Engineering; Energy Institue, University College, CIBSE: London, UK,2013.
6. Hawkins, D.; Hong, S.M.; Raslan, R.; Mumovic, D.; Hanna, S. Determinants of energy use in UK higher education buildings using statistical and artificial neural network methods. Int. J. Sustain. Built Environ. 2012, 1, 50–63, doi:10.1016/j.ijsbe.2012.05.002.
7. Bruhns, H.; Jones, P.; Cohen, R. CIBSE review of energy benchmarks for display energy certificates. In Proceedings of the CIBSE Technical Symposium, DeMontfort University, Leicester, UK, 6–7 September 2011.
8. Vaisi, S.; Pilla, F.; McCormack, S.J. Recommending a thermal energy benchmark based on CIBSE TM46 for typical college buildings and creating monthly energy models. Energy Build. 2018, 176, 296–309, doi:10.1016/j.enbuild.2018.07.041.
9. Javanroodi, K.; Mahdavinejad, M.; Nik, V.M. Impacts of urban morphology on reducing cooling load and increasing ventilation potential in hot-arid climate. Appl. Energy 2018, 231, 714–746, doi:10.1016/j.apenergy.2018.09.116.
10. Pérez-Lombard, L.; Ortiz, J.; González, R.; Maestre, I.R. A review of benchmarking, rating and labelling concepts within the framework of building energy certification schemes. Energy Build. 2009, 41, 272–278, doi:10.1016/j.enbuild.2008.10.004.
11. International Energy Agency. Energy Performance Certification of Building, a Policy Tool to Improve Energy Efficiency; International Energy Agency: Paris, France,2010.
12. The Council of the European Commuities. European Council Directive 93/76/EEC, 13 September 1993; European Commuities, Ed.; The Council of the European Commuities: Brussels, Belgium,1993.
13. Sustainable Energy Authority Ireland (Seai). What is the Total Primary Energy Requirement (TPER)? Available online: http://www.seai.ie/Your_Business/Public_Sector/FAQ/Calculating_Savings_Tracking_Progress/What_is_the_Total_Primary_Energy_Requirement.html (accessed on 28 December 2015).
14. Chartered Institution of Building Services Engineers; CIBSE TM47; CIBSE: London, UK,2009.
Figure A1. The flowchart of model application.
References
1. Evangelinos, K.I.; Jones, N.; Panoriou, E.M. Challenges and opportunities for sustainability in regionaluniversities: A case study in Mytilene, Greece. J. Clean. Prod. 2009, 17, 1154–1161. [CrossRef]
2. Locmelis, K.; Blumberga, D.; Blumberga, A.; Kubule, A. Benchmarking of industrial energy efficiency.outcomes of an energy audit policy program. Energies 2020, 13, 2210. [CrossRef]
3. Kim, H.G.; Kim, S.S. Development of energy benchmarks for office buildings using the national energyconsumption database. Energies 2020, 13, 950. [CrossRef]
4. Chartered Institution of Building Services Engineers; CIBSE TM46; Energy Institue, University College, CIBSE:London, UK, 2008.
5. Hong, S.-M.; Steadman, P. An Analysis of Display Energy Certificates for Public Buildings, 2008 to 2012, a Reportto Chartered Institution of Building Services Engineering; Energy Institue, University College, CIBSE: London,UK, 2013.
6. Hawkins, D.; Hong, S.M.; Raslan, R.; Mumovic, D.; Hanna, S. Determinants of energy use in UK highereducation buildings using statistical and artificial neural network methods. Int. J. Sustain. Built Environ.2012, 1, 50–63. [CrossRef]
7. Bruhns, H.; Jones, P.; Cohen, R. CIBSE review of energy benchmarks for display energy certificates.In Proceedings of the CIBSE Technical Symposium, Leicester, UK, 6–7 September 2011.
8. Vaisi, S.; Pilla, F.; McCormack, S.J. Recommending a thermal energy benchmark based on CIBSE TM46 fortypical college buildings and creating monthly energy models. Energy Build. 2018, 176, 296–309. [CrossRef]

Energies 2020, 13, 6606 17 of 18
9. Javanroodi, K.; Mahdavinejad, M.; Nik, V.M. Impacts of urban morphology on reducing cooling load andincreasing ventilation potential in hot-arid climate. Appl. Energy 2018, 231, 714–746. [CrossRef]
10. Pérez-Lombard, L.; Ortiz, J.; González, R.; Maestre, I.R. A review of benchmarking, rating and labellingconcepts within the framework of building energy certification schemes. Energy Build. 2009, 41, 272–278.[CrossRef]
11. International Energy Agency. Energy Performance Certification of Building, a Policy Tool to Improve EnergyEfficiency; International Energy Agency: Paris, France, 2010.
12. The Council of the European Commuities. European Council Directive 93/76/EEC, 13 September 1993; EuropeanCommuities, Ed.; The Council of the European Commuities: Brussels, Belgium, 1993.
13. Sustainable Energy Authority Ireland (Seai). What is the Total Primary Energy Requirement (TPER)?Available online: http://www.seai.ie/Your_Business/Public_Sector/FAQ/Calculating_Savings_Tracking_Progress/What_is_the_Total_Primary_Energy_Requirement.html (accessed on 28 December 2015).
14. Chartered Institution of Building Services Engineers; CIBSE TM47; CIBSE: London, UK, 2009.15. Carbon Trust. The Carbon Trust Annual Report 2012/2013, Accelerating the Move to a Sustainable, Low Carbon
Economy; Carbon Trust: London, UK, 2013.16. Hong, S.-M.; Paterson, G.; Burman, E.; Steadman, P.; Mumovic, D. A comparative study of benchmarking
approaches for non-domestic buildings: Part 1—Top-down approach. Int. J. Sustain. Built Environ. 2013,2, 119–130. [CrossRef]
17. Burman, E.; Hong, S.-M.; Paterson, G.; Kimpian, J.; Mumovic, D. A comparative study of benchmarkingapproaches for non-domestic buildings: Part 2—Bottom-up approach. Int. J. Sustain. Built Environ. 2014,3, 247–261. [CrossRef]
18. Burman, E.; Mumovic, D.; Kimpian, J. Towards measurement and verification of energy performance underthe framework of the European directive for energy performance of buildings. Energy 2014, 77, 153–163.[CrossRef]
19. Salah, V.; Mark, D.; Francesco, P. Energy requirement mapping for university campus using CIBSE benchmarksand comparing CIBSE to display energy certificate (DEC) to extract a new criterion. In Proceedings of theEnergy Systems Conference, London, UK, 24–25 June 2014.
20. EPBD Energy Performance of Building Directive. Directive 2002/91/CE of the European Parliament andCouncil from 16 of December 2002. Off. J. Eur. Communities 2003. Available online: https://eur-lex.europa.eu/
legal-content/EN/TXT/PDF/?uri=CELEX:32002L0091&from=IT (accessed on 12 September 2020).21. Borgstein, E.H.; Lamberts, R.; Hensen, J.L.M. Evaluating energy performance in non-domestic buildings:
A review. Energy Build. 2016, 128, 734–755. [CrossRef]22. Lee, W.-S.; Lee, K.-P. Benchmarking the performance of building energy management using data envelopment
analysis. Appl. Therm. Eng. 2009, 29, 3269–3273. [CrossRef]23. Pasichnyi, O.; Wallin, J.; Levihn, F.; Shahrokni, H.; Kordas, O. Energy performance certificates—New
opportunities for data-enabled urban energy policy instruments? Energy Policy 2019, 127, 486–499. [CrossRef]24. Burman, E.; Kimpian, J.; Mumovic, D. Building schools for the future: Lessons learned from performance
evaluations of five secondary schools and academies in England. Front. Built Environ. 2018, 4. [CrossRef]25. Papadopoulos, S.; Bonczak, B.; Kontokosta, C.E. Pattern recognition in building energy performance over
time using energy benchmarking data. Appl. Energy 2018, 221, 576–586. [CrossRef]26. Roth, J.; Rajagopal, R. Benchmarking building energy efficiency using quantile regression. Energy 2018,
152, 866–876. [CrossRef]27. Liu, J.; Chen, H.; Liu, J.; Li, Z.; Huang, R.; Xing, L.; Wang, J.; Li, G. An energy performance evaluation
methodology for individual office building with dynamic energy benchmarks using limited information.Appl. Energy 2017, 206, 193–205. [CrossRef]
28. Park, J.Y.; Yang, X.; Miller, C.; Arjunan, P.; Nagy, Z. Apples or oranges? Identification of fundamentalload shape profiles for benchmarking buildings using a large and diverse dataset. Appl. Energy 2019, 236,1280–1295. [CrossRef]
29. Lamagna, M.; Nastasi, B.; Groppi, D.; Nezhad, M.M.; Garcia, D.A. Hourly energy profile determinationtechnique from monthly energy bills. Build. Simul. 2020, 13, 1235–1248. [CrossRef]
30. Mancini, F.; Nastasi, B. Energy retrofitting effects on the energy flexibility of dwellings. Energies 2019,12, 2788. [CrossRef]

Energies 2020, 13, 6606 18 of 18
31. Papadopoulos, S.; Kontokosta, C.E. Grading buildings on energy performance using city benchmarking data.Appl. Energy 2019, 233–234, 244–253. [CrossRef]
32. Seyedzadeh, S.; Rahimian, F.P.; Glesk, I.; Roper, M. Machine learning for estimation of building energyconsumption and performance: A review. Vis. Eng. 2018, 6, 5. [CrossRef]
33. Koo, C.; Hong, T. Development of a dynamic operational rating system in energy performance certificatesfor existing buildings: Geostatistical approach and data-mining technique. Appl. Energy 2015, 154, 254–270.[CrossRef]
34. Yan, C.; Wang, S.; Xiao, F.; Gao, D.-C. A multi-level energy performance diagnosis method for energyinformation poor buildings. Energy 2015, 83, 189–203. [CrossRef]
35. Khoshbakht, M.; Gou, Z.; Dupre, K. Energy use characteristics and benchmarking for higher educationbuildings. Energy Build. 2018, 164, 61–76. [CrossRef]
36. Zhan, S.; Liu, Z.; Chong, A.; Yan, D. Building categorization revisited: A clustering-based approach to usingsmart meter data for building energy benchmarking. Appl. Energy 2020, 269, 114920. [CrossRef]
37. Arjunan, P.; Poolla, K.; Miller, C. EnergyStar++: Towards more accurate and explanatory building energybenchmarking. Appl. Energy 2020, 276, 115413. [CrossRef]
38. Wei, Z.; Xu, W.; Wang, D.; Li, L.; Niu, L.; Wang, W.; Wang, B.; Song, Y. A study of city-level building energyefficiency benchmarking system for China. Energy Build. 2018, 179, 1–14. [CrossRef]
39. Cylon. Cylon Active Energy Management. Available online: https://cylonaem.com/energy/#v=1&t=9&c=0(accessed on 10 March 2015).
40. Heating Degree Days. BizEE Software, Degree Days.Net—Custom Degree Day Data. Available online:http://www.degreedays.net/ (accessed on 2 January 2016).
41. Manfren, M.; Nastasi, B.; Tronchin, L. Linking design and operation phase energy performance analysisthrough regression-based approaches. Front. Energy Res. 2020, 8, 557649. [CrossRef]
Publisher’s Note: MDPI stays neutral with regard to jurisdictional claims in published maps and institutionalaffiliations.
© 2020 by the authors. Licensee MDPI, Basel, Switzerland. This article is an open accessarticle distributed under the terms and conditions of the Creative Commons Attribution(CC BY) license (http://creativecommons.org/licenses/by/4.0/).