a new flexible multiple discrete-continuous extreme value ... · a new flexible multiple...
TRANSCRIPT

A NEW FLEXIBLE MULTIPLE DISCRETE-CONTINUOUS EXTREME VALUE
(MDCEV) CHOICE MODEL
Chandra R. Bhat
The University of Texas at Austin
Department of Civil, Architectural and Environmental Engineering
301 E. Dean Keeton St. Stop C1761, Austin TX 78712, USA
Tel: 1-512-471-4535; Email: [email protected]
and
The Hong Kong Polytechnic University, Hung Hom, Kowloon, Hong Kong

ABSTRACT
Traditional multiple discrete-continuous (MDC) models generally predict the continuous
consumption quantity component reasonably component well, but not necessarily the discrete
choice component. In this paper, we propose, for the first time, a new flexible closed-form
MDCEV model that breaks the tight linkage between the discrete and continuous choice
dimensions of the traditional MDC models. We do so by (1) employing a linear utility function
of consumption for the first outside good (which removes the continuous consumption quantity
of the outside good from the discrete consumption decision, and also helps in forecasting), and
(2) using separate baseline utilities for the discrete and continuous consumption decisions. In the
process of proposing our new formulation, we also revisit two issues related to the traditional
MDC model. The first relates to clarification regarding the identification of the scale parameter
of the error terms, and the second relates to the probability of the discrete choice component of
the traditional MDC model (that is, the multivariate probability of consumption or not of the
alternatives). We show why the scale parameter of the error terms is indeed estimable when a -
profile is used, as well as show how one may develop a closed-form expression for the discrete
choice consumption probability. The latter contribution also presents a methodology to estimate
pure multiple discrete choice models without the need for information on the continuous
consumptions. Finally, we also develop forecasting procedures for our new MDC model
structure.
We demonstrate an application of the proposed model to the case of time-use of
individuals. In a comparative empirical assessment of the fit from the proposed model and from
the traditional MDCEV models, our proposed model performs better in terms of better predicting
both the discrete outcome data as well as the continuous consumptions.
Keywords: Multiple discrete-continuous choice models, multiple discrete-continuous extreme value model, utility theory, time use, consumer theory.

1
1. INTRODUCTION
Many choice situations are characterized by the choice of multiple alternatives at the same time,
as opposed to the choice of a single alternative. These situations have come to be labeled by the
term “multiple discreteness” in the literature (see Hendel, 1999). In addition, in such situations,
the consumer usually also decides on a continuous dimension (or quantity) of consumption,
which has prompted the label “multiple discrete-continuous” (MDC) choice (see Bhat, 2005,
2008). Specifically, an outcome is said to be of the MDC type if it exists in multiple states that
can be jointly consumed to different continuous amounts. Earlier studies of MDC situations have
included such choice contexts as (a) the participation decision of individuals in different types of
activities over the course of a day and the duration in the chosen activity types, (b) household
holdings of multiple vehicle body/fuel types and the annual vehicle miles of travel on each
vehicle, and (c) consumer purchase of multiple brands within a product category and the quantity
of purchase. In the recent literature, there is increasing attention on modeling these MDC
situations based on a rigorous micro-economic utility maximization framework.
The basic approach in a utility maximization framework for multiple discreteness hinges
upon the use of a non-linear (but increasing and continuously differentiable) utility structure with
decreasing marginal utility (or satiation). Doing so has the effect of introducing imperfect
substitution in the mix, allowing the choice of multiple alternatives. The origins of utility-
maximizing MDC models may be traced back to the research of Wales and Woodland (1983)
(see also Kim et al., 2002; von Haefen and Phaneuf, 2003; Bhat, 2005). More recently, Bhat
(2008) proposed a Box-Cox utility function form that is quite general and subsumes earlier utility
specifications as special cases, and that is consistent with the notion of weak complementarity
(see Mäler, 1974), which implies that the consumer receives no utility from a non-essential
good’s attributes if she/he does not consume it. Then, using a multiplicative log-extreme value
error term in the baseline preference for each alternative, Bhat (2005, 2008) proposed and
formulated the multiple discrete-continuous extreme value (MDCEV) model, which has a
closed-form probability expression and collapses to the MNL in the case that each (and every)
decision-maker chooses only one alternative. It also is equally applicable to cases with complete
or incomplete demand systems (see Castro et al., 2012 for an extended discussion). The MDCEV
model has now been applied in a wide variety of fields. Some recent examples include
Yonezawa and Richards (2017) in the managerial economics field, Shin et al. (2015) in the

2
technological and social change field, and Wafa et al. (2015) in the regional science field. Of
course, just as in the case of the traditional single choice models, advanced variants of the
MDCEV such as the MDCGEV and random-coefficients MDCEV have also been introduced
and applied (see, for example, Calastri et al., 2017; Bernardo et al., 2015; Pinjari, 2011; Pinjari
and Bhat, 2010) In addition, some studies have considered the replacement of the log-extreme
value error term in the baseline preference with a log-normal error term, along with random-
coefficients versions of the resulting MDC probit (MDCP) model (Bhat et al., 2016a; Khan and
Machemehl, 2017).
In all of the MDC formulations thus far, there is an implicit assumption that the same
baseline utility preference influences both the choice of making a positive consumption of a good
(the discrete choice) as well as constitutes the starting point for satiation effects (that impact the
continuous choice). This has the effect of very tightly tying the discrete and continuous choices
in terms of variable effects. However, there may be many reasons why the marginal utility that
dictates the discrete consumption decision (that is, whether or not to invest in a particular good)
may be different from the marginal utility once a consumption decision has actually been made.
First, there may be a need for variety seeking that operates at the pure discrete level of
consumption that may make a person’s valuation of the discrete consumption decision different
from the one that forms the basis for the continuous consumption decision. For instance, a person
may want a specific brand of yoghurt that is consumed in very small quantities simply as an
occasional consumption break from another substantially consumed brand. Second, there may be
a branding effect (that is, a prestige/image effect) that operates at the pure discrete level, but does
not necessarily carry over with the same intensity to the continuous consumption decision. Thus,
an individual may consume a premium brand simply to signal an exclusive, high-culture,
sophisticated image, but purchase very little of that good. Third, for many goods, there may not
be any value gained by investing in a single unit of that good. Indeed, this even brings up the
question of how to define a unit of a good. More generally, the traditional MDC model assumes
that consumers make continuous consumption choices of goods in a smooth fashion ranging
from zero to large amounts of that good. In practice, value may be gained only if some sizeable
non-zero amount of a good is consumed.
The tightness maintained by the traditional MDC model can sometimes lead to a situation
where the continuous consumption amount is predicted well, but not the discrete choice. This has

3
been observed by previous studies (see You et al., 2014; Lu et al., 2017). The reason for this
situation is that a variable that increases the baseline preference in the traditional MDC model
has the effect of simultaneously increasing both the probability of non-zero consumption as well
as the continuous amount of the consumption. While the presence of a satiation effect in the
traditional MDC model, especially when the satiation effect is allowed to vary across individuals
based on exogenous variables, can partially account for a high probability of non-zero
consumption and low continuous amount of consumption (or low probability of non-zero
consumption and high continuous amount of consumption) for specific individuals, the overall
utility profile is still constrained because the satiation starts from the same baseline preference
that also determines the discrete consumption decision. In this paper, we propose, for the first
time, a new MDC model that breaks this tight linkage between the discrete and continuous
choice dimensions. We do so by allowing the utility that determines the discrete decision to be
different from the baseline preference utility that determines the continuous choice.
In the process of proposing a new formulation for the MDCEV model, we also revisit two
issues related to traditional MDC models. The first relates to clarification regarding the
identification of the scale parameter of the error terms in the absence of price variation, and the
second relates to the probability of the discrete choice component of traditional MDC models
(that is, the multivariate probability of consumption or not of the alternatives).
The rest of the paper is structured as follows. Section 2 presents the model formulation
and forecasting procedure. Section 3 illustrates an application of the proposed model for
analyzing individual time use. The fourth and final section offers concluding thoughts and
directions for further research.
2. MODEL FORMULATION
In this section, we first present Bhat’s (2008) traditional MDC model structure and present two
important considerations related to this model that have not been discussed in the earlier
literature. In the presentation, we consider the case of incomplete demand with an essential
“numeraire” Hicksian outside good and multiple non-essential inside goods. We then proceed to
the new proposed model formulation.

4
2.1. Traditional MDC Model Structure
Assume without any loss of generality that the essential Hicksian composite outside good is the
first good. Following Bhat (2008), the utility maximization problem in the traditional MDC
model is written as:
,..
111
)(
1
211
1
1
Expts
xxU
K
kkk
k
kk
k
kK
k
k
x
(1)
where the utility function )(xU is quasi-concave, increasing and continuously differentiable,
0x is the consumption quantity ( x is a vector of dimension )1( K with elements kx ), and
k , k , and k are parameters associated with good k.1 The constraint in Equation (1) is the
linear budget constraint, where E is the total expenditure across all goods k (k = 1, 2,…, K) and
0kp is the unit price of good k (with 11 p to represent the numeraire nature of the first
essential good). The function )(xU in Equation (1) is a valid utility function if 0k , 0k ,
and 1k for all k. As discussed in detail in Bhat (2008), k represents the baseline marginal
utility, k is the vehicle to introduce corner solutions (that is, zero consumption) for the inside
goods (k = 2, 3,…, K), but also serves the role of a satiation parameter (higher values of k
imply less satiation). There is no 1 term for the first good because it is, by definition, always
consumed. Finally, the express role of k is to capture satiation effects. When 1k for all k,
this represents the case of absence of satiation effects or, equivalently, the case of constant
marginal utility (that is, the case of single discrete choice). As k moves downward from the
value of 1, the satiation effect for good k increases. When kk 0 , the utility function
collapses to the linear expenditure system (LES) The reader will note that there is an assumption
of additive separability of preferences in the utility form of Equation (1), which immediately
implies that none of the goods are a priori inferior and all the goods are strictly Hicksian
substitutes (see Deaton and Muellbauer, 1980; p. 139). Additionally, additive separability
1 The assumption of a quasi-concave utility function is simply a manifestation of requiring the indifference curves to be convex to the origin (see Deaton and Muellbauer, 1980, p. 30 for a rigorous definition of quasi-concavity). The assumption of an increasing utility function implies that U(x1) > U(x0) if x1 > x0.

5
implies that the marginal utility with respect to any good is independent of the levels of all other
goods. While the assumption of additive separability can be relaxed (see Castro et al., 2012), we
confine attention to the additive separability case in this paper.
2.1.1. Identification of the Scale Parameter of the Error Term in the Baseline Marginal Utility
Bhat observes that both k and k influence satiation, though in quite different ways: k
controls satiation by translating consumption quantity, while k controls satiation by
exponentiating consumption quantity. Empirically speaking, it is difficult to disentangle the
effects of k and k separately, which leads to serious empirical identification problems and
estimation breakdowns when one attempts to estimate both parameters for each good. Thus, Bhat
suggests estimating a -profile (in which 0k for all alternatives, and the k terms are
estimated) and an -profile (in which the k terms are normalized to the value of one for all
alternatives, and the k terms are estimated), and choose the profile that provides a better
statistical fit. These two utility functions take the following forms:
1lnln)(2
11
k
kkk
K
k
xxU
x for the -profile, and (2)
1111
)(2
11
1
1
k
kk
k
K
k
xxU
x for the -profile.
Earlier studies have considered both the above functional forms, and it has been generally the
case that that -profile comes out to be superior to the -profile (see, for example, Khan and
Machemehl, 2017; Bhat et al., 2016a; Jian et al., 2017; Jäggi et al., 2013). Further, from a
prediction standpoint, the -profile provides a much easier mechanism for forecasting the
consumption pattern, given the observed exogenous variates, as explained in Pinjari and Bhat
(2011). Thus, in the rest of this paper, we will focus attention on the -profile. Additionally, to
ensure the non-negativity of the baseline marginal utility, while also allowing it to vary across
individuals based on observed and unobserved characteristics, k is usually parameterized as
follows:
kkk zβexp , , ,...,2 ,1 Kk (3)

6
where kz is a set of attributes that characterize alternative k and the decision maker (including a
constant), and k captures the idiosyncratic (unobserved) characteristics that impact the baseline
utility of good k. Because of the budget constraint in Equation (1), only K–1 of the *
kx values
need to be estimated, since the quantity consumed of any one good is automatically determined
from the quantity consumed of all the other goods. Thus, a constant cannot be identified in the β
term for one of the K alternatives. Similarly, individual-specific variables are introduced in the
vector kz for (K–1) alternatives, with the remaining alternative serving as the base. As a
convention, we will not introduce a constant and individual-specific variables in the vector 1z
corresponding to the first outside good.
To find the optimal allocation of goods, the Lagrangian is constructed and the first order
equations are derived based on the Karash-Kuhn-Tucker (KKT) conditions. The Lagrangian
function for the model, when combined with the budget constraint, is:
K
kkk xpEUL
1
)( x , (4)
where is a Lagrangian multiplier for the constraint. The KKT first order conditions for
optimal consumption allocations ( *kx ) take the following form:
kk VV 11 if consumption is equal to *
kx (k = 2, 3,…, K), where 0* kx
kk VV 11 if 0* kx (k = 2, 3,…, K), where (5)
kk
kkk p
xV ln1ln
*
zβ (k = 2, 3,…, K) and )ln( *
111 xV zβ .
The likelihood function for the observed consumption pattern depends on the stochastic
assumptions made on the error terms k . If these error terms are considered identically and
independently distributed (IID) across alternatives with a type 1 extreme-value distribution, Bhat
showed that the resulting likelihood function takes a surprisingly simple closed-form expression,
and he labels the resulting model as the multiple discrete-continuous extreme value (MDCEV)
model. As correctly pointed out by Bhat (2008), in the MDCEV (or in any other model with IID
error terms even if not type 1 extreme-value), when one uses the general utility profile of
Equation (1), it is not possible to estimate the scale parameter of the error terms k when
there is no price variation across the alternatives (equivalently, in more general non-IID error

7
models, a scaling is needed as a normalization). Using the same argument and proof as in Bhat
(2008), it is easy to see that this same result holds for the case when the actually estimable α-
profile is used. Unfortunately, because Bhat develops the proof for the general case and not
specific cases, his result appears to have been taken to imply that the scale parameter is not
estimable even for the -profile case (with α fixed) unless there is price variation (all the -
profile studies to date, as far as we know, have imposed the normalization of one for the error
scale in the absence of price variation). This is, however, not the case, and the scale parameter is
estimable for the -profile with α fixed even if there is no price variation. To see this, in
standardized form and without price variation, the KKT conditions of Equation (2) for the -
profile may be written as:
**
11
kk VV
if consumption is equal to *
kx (k = 2, 3,…, K), where 0* kx
**
11
kk VV
if 0* kx (k = 2, 3,…, K), where (6)
1ln
1 **
k
kkk
xV
zβ
'* (k = 2, 3,…, K) and )ln(1 *
11*
1 xV
zβ'* , with
β
β* .
The scale parameter is distinctly estimable here because it is essentially the coefficient on the
natural logarithm term of the continuous consumption quantities in the expressions for *
kV and
*
1V above. On the other hand, as shown in Section 3.2 of Bhat (2008), there is the coefficient
)1( k on the
1ln
*
k
kx
terms in the kV (k = 2, 3,…, K) expressions and )1( 1 on the
)ln( *
1x in the 1V expression for the first good when the -profile of Equation (2) is used. Thus,
when standardizing by dividing kV and 1V by , the term in )1( k and in the
denominator cancel, leaving inestimable and the *β vector scaled up or scaled down.2
2 The same situation applies also to a third estimable utility profile in Bhat (2008) in which there is a common α
parameter across all the goods as follows:
111
)(2
11
k
kk
kK
k
xxU x . This functional form above
is estimable (though we have not seen this form used often in empirical studies), because the constant α parameter is obtaining a “pinning effect” from the satiation parameter for the outside good. Interestingly, but not surprisingly, in our test simulation cases, using the expression above or the -profile with a standard deviation estimated for the
error terms provided identical likelihood function values. That is, one can use the -profile with an estimated

8
2.1.2. Multiple Choice Probability
In earlier studies of the MDC model, the discrete choice probability of positive consumption has
been typically estimated through a simulation technique where the error terms of alternatives are
drawn multiple times, and the occurrence of non-zero consumptions of an alternative as a ratio of
the total error realizations is declared as the probability of the discrete outcome of positive
consumption (see, for example, Bhat et al., 2016b). However, missing in earlier studies is an
expression that provides the discrete multivariate probability of consumption across all the
goods. Here, we explicitly provide a probability expression for the discrete pattern of
consumption, given the consumption in the outside good, and show that this takes a nice closed-
form expression for the MDCEV model.
Consider the KKT conditions in Equation (5). However, we rewrite the conditions as
follows:
11
~kkk V if 0* kx and 11 kkk V
if continuous consumption is *
kx (k = 2,…, K)
11
~kkk V if 0* kx (k = 2, 3,…, K), (7)
where )ln(ln)0|(~ *
1111, kkkkk pxxVVV zβzβ , and 1 1 1 ln 1kk k k
k
xV V V V
.
The difference between the KKT conditions as written above and those in Equation (5) is that we
have explicitly added the condition that 11
~kkk V if 0* kx for the consumed goods.
This is completely innocuous because 11
~kk VV
as long as .0* kx That is, as long as ,0* kx by
standard deviation or the hybrid α and profile above (but with an identical α value across all the goods), and both
end up with essentially identical likelihood values, reinforcing the empirical identification problem between the α and parameters discussed in Bhat (2008). We prefer to use the -profile with an estimated standard deviation
rather than the hybrid utility profile function above, because the hybrid includes two very different forms of satiation behavior and is more difficult to justify conceptually. For the same reason, we also prefer the -profile with an
estimated standard deviation to another hybrid variant in Bhat that uses a pure α-profile for the outside good
combined with a -profile for the inside goods as in
1ln1
)(2
111
1
k
kkk
K
k
xxU
x . In our experience, this
last utility functional form also can run into convergence problems when the scale of the error terms is left free for estimation.

9
formulation, we have .1|)~
(Prob 11 kkkk VV
Focusing only on the discrete choice of
consumption, from the KKT conditions, we can write:
1,1
~kkk V if 0* kx (k = 2, 3,…, K) (8)
1,1
~kkk V if 0* kx (k = 2, 3,…, K).
Intuitively, the conditions above state that good k will be consumed to a non-zero amount only if
the price normalized random marginal utility of consumption of the first unit ( kkk p lnzβ )
is greater than the random utility 1*11 ln xzβ accrued at the point of the optimal
consumption of the outside good. Let kd be a dummy variable that take a value 1 if good k (k =
2, 3,…, K) is consumed, and zero otherwise. Then, the multivariate probability that the
individual consumes a non-zero amount of the first M of the K–1 inside goods (that is, the goods
2, 3,…, M+1) and zero amounts of the remaining K–1–M goods (that is, the goods M+2, M+3,…,
K), given that the consumption in the outside good is *
1x , takes the following form that combines
integrals capturing a combination of multivariate survival functions (for the non-zero
consumption goods) and multivariate cumulative distribution functions (for the zero
consumption goods):
, ...),...,,(........
)0,0,0,1,1(
2,132
~~~~
~~~
3212
1,1,11
1
1,33
3
1,22
2
1
1,11
3
1,33
2
1,22
ddd
dddddP
KKK
VVVV
VVV
KMMM
KK
K
KK
K
MM
M
MM
M
M
MM
f
(9)
where ),...,,( 32 Kf represents the multivariate probability density function (pdf) of the
random variates K ,...,, 32 . Based on the inclusion-exclusion probability law, and for all
Fretchet class of multivariate distribution functions with given univariate margins, the
probability expression above can be written purely as a function of multivariate cumulative
distribution functions (CDFs) corresponding to the random variates as follows:
),
~,
~,
~,...
~,
~()1()
~,
~,...
~,
~(
)0,0,0,1,1(
1,1,1,11,31,2||11||},1,...3,2{
||1,1,11,31,21
3212
SKKMMSMKSMS
SKKMMMK
KMMM
VVVVVVVV
dddddP
VFF
(10)
where DF (.) is the multivariate CDF of dimension D, S represents a specific combination of the
consumed goods (there are a total of 12),(...)3,()2,( MMMCMCMCM possible

10
combinations of the consumed goods), |S| is the cardinality of the specific combination S, and
1,
~SV is a vector of utility elements drawn from }
~,...
~,
~{ 1,11,31,2 MVVV that belong to the specific
combination S. The key point to note is that the discrete probability of consumption now is
solely a combination of CDFs corresponding to combinations of the elements of the random
vector ),...,,( 32 Kη . Thus, for example, this discrete probability entails the evaluation of
multivariate normal CDFs if the error terms k in the baseline preference in Equation (3) of the
MDC formulation are normally distributed (because the vector η of error differentials is then
multivariate normally distributed).
Interestingly, in the case of Bhat’s MDCEV model, there is a closed-form expression for
the discrete probability in Equation (10), an important observation that has not appeared in the
literature. Specifically, when the k error terms in the baseline preference in Equation (10) are
IID extreme value with a scale parameter of (as assumed to obtain the MDCEV model), the η
vector is multivariate logistic distributed (see Bhat, 2008). Specifically, the pdf and CDF of the η
vector are:
.1),...,,(
and,1)!1(
),...,,(
1
23322
213322
2
k
kK
k
k
hK
kKK
hKhK
kKKK
ehhh
eeK
hhh
F
f
(11)
The CDF of any subset of the η vector is readily obtained from the CDF expression above for the
entire η vector. For example, the CDF of only the first two elements is:
.1),(1
3322
32
hh
eehhF (12)
Thus, by plugging the appropriate CDF functions in the expression of (10), one can obtain a
closed-form expression for the probability of any pattern of discrete consumption of the many
alternatives in the MDCEV model.
The closed form expression for this multivariate discrete probability in the MDCEV
model can aid in forecasting. In particular, once the parameters are estimated, one can compute
the ),...,3 ,2(~
1, KkVk values using Equation (7) and determine the discrete choice probability of
each of the possible )12( 1 K combinations of consumption of the goods. For each combination,
11
the continuous consumption quantities can be estimated (see Pinjari and Bhat, 2011). The
consumption quantity of each good is then simply the weighted (based on the probability of each
combination) sum of the estimation consumption of that good across all combinations.
Alternatively, the analyst can sequence the many combinations of possible discrete consumptions
and place the corresponding probabilities (as computed using Equation (10)) in the same
sequence to span the 0-1 probability scale. The analyst can draw a random number between 0 to
1 and, depending upon where this falls in the probability scale, one can identify the forecast
discrete consumption pattern. Once the discrete forecasting is done, the continuous consumption
quantities can be computed. To do so, the analyst can draw extreme value error realizations for
each consumed good (including the outside good) from the extreme value distribution with
location parameter of 0 and the scale parameter equal to the estimated value (label this
distribution as EV(0, )̂ ). For each set of error realizations for these consumed goods, the analyst
can compute the consumption quantities using Equations (15) and (16) from Pinjari and Bhat
(2011), and then take the mean of the consumption quantities across the many realizations.
There is one problem though when using the -profile of Equation (2) with the
forecasting approach above. In particular, the expressions for ),...,3 ,2(~
1, KkVk include *
1ln x ,
which implies that the prediction of the continuous value of the outside good needs to be known
in computing the discrete probability expressions in Equation (10). But the value of *
1ln x itself
depends on which specific discrete combination of alternatives is consumed. Also, while *
1ln x is
available for the estimation sample, and the forecasting procedure above may be used to estimate
the discrete choice probabilities for the estimation sample, *
1ln x is not available outside the
estimation sample. Indeed, *
1x is part of what needs to be forecasted. In this regard, an alternative
specification is needed where *
1ln x does not appear in the expressions for 1,
~kV if the forecasting
procedure above is to be used. More generally, the presence of *
1ln x is part of what creates the
tight connection between the discrete and continuous consumptions of the MDC model, which
can be relaxed with an alternative utility specification, as we discuss next.

12
2.2. A New Flexible MDC Model
The traditional MDC model uses a single baseline utility k that dictates both the discrete and
consumption decisions, and has the continuous consumption of the outside good appear in the
discrete consumption decision. This can compromise the ability of the traditional MDC model to
predict the discrete decision well. This may also be clearly seen from the KKT conditions of the
traditional model from revisiting Equation (7). Specifically, the probability that an individual
consumes ),...,( *
1
*
3
*
2 Mxxx of the first M of the K–1 inside goods, in addition to an amount *
1x of
the first good, and does not consume the remaining K–1–M goods may be written as:
, )~
,...~
,,...,~
,...~
(
|| )0,0,0,,,(
1,1,221,11121,11212
*1
*2
*1
KKMMMMkMM
M
VVVVVVP
JxxxP
(13)
where | |J is the determinant of the Jacobian matrix obtained from applying the change of
variables calculus between the stochastic KKT conditions and the consumptions. The traditional
MDC model recognizes, correctly, that 1 ,...,3 ,2for1)(|)~
(Prob 11 MkVV kkkk
(see
earlier) and so writes the expression above equivalently as:
. )~
,...~
,,...(
|| )0,0,0,,,(
1,111,221,1112
*1
*2
*1
MMMMMMk
M
VVVVP
JxxxP
(14)
Thus, the traditional MDC model does not partition into distinct discrete choice and continuous
choice components. Specifically, during estimation, the parameters associated with the
consumed goods are estimated solely based on fitting to the equality conditions
1,1112 ,.... MMk VV
, with no regard to whether the multiple discrete choice condition is also
fit well. Intuitively speaking, the traditional MDC model simultaneously estimates the baseline
marginal utility and the k parameters (that control satiation) for the consumed goods so that the
level of consumption is generally fitted reasonably well (with zero consumption simply being
one possible continuous consumption value). But, in doing so, for example, it can attribute a very
high baseline utility for an alternative and adjust the satiation parameter for the alternative such
that the continuous values are fitted nicely, but the high baseline utility (that determines the
discrete choice consumption pattern) may imply a much higher than observed non-zero
consumption for this alternative (and, correspondingly, much lower observed zero consumption
for other alternatives). Alternatively, for a good that is consumed in very small quantities, the
13
traditional model may assign a low baseline utility, so it can fit the low continuous consumption
values well with an appropriate satiation parameter, but it may then underestimate the discrete
choice of consumption if this good is a specialty good with a positive branding effect that
operates at the discrete choice level. The result is that the traditional MDC model generally
predicts the continuous component quite well, but may not always do well in terms of predictions
for the discrete choice component (though, in some empirical cases, the traditional MDC may
predict both the continuous and discrete consumptions poorly, or both consumptions very well).
In this paper, we untangle the strong interlinkage between the discrete and continuous
consumption decisions by (1) employing a linear utility function of consumption for the first
outside good (which removes the continuous consumption quantity of the outside good from the
discrete consumption decision, and also helps in forecasting), and (2) using separate baseline
utilities for the discrete and continuous consumption decisions. The model is still based on a
theoretic utility-maximizing framework, except that we now assume that the marginal utility of a
good at the point of zero consumption of the good is not the same as the marginal utility of the
good at the point of an infinitesimally small amount of positive consumption of the good.
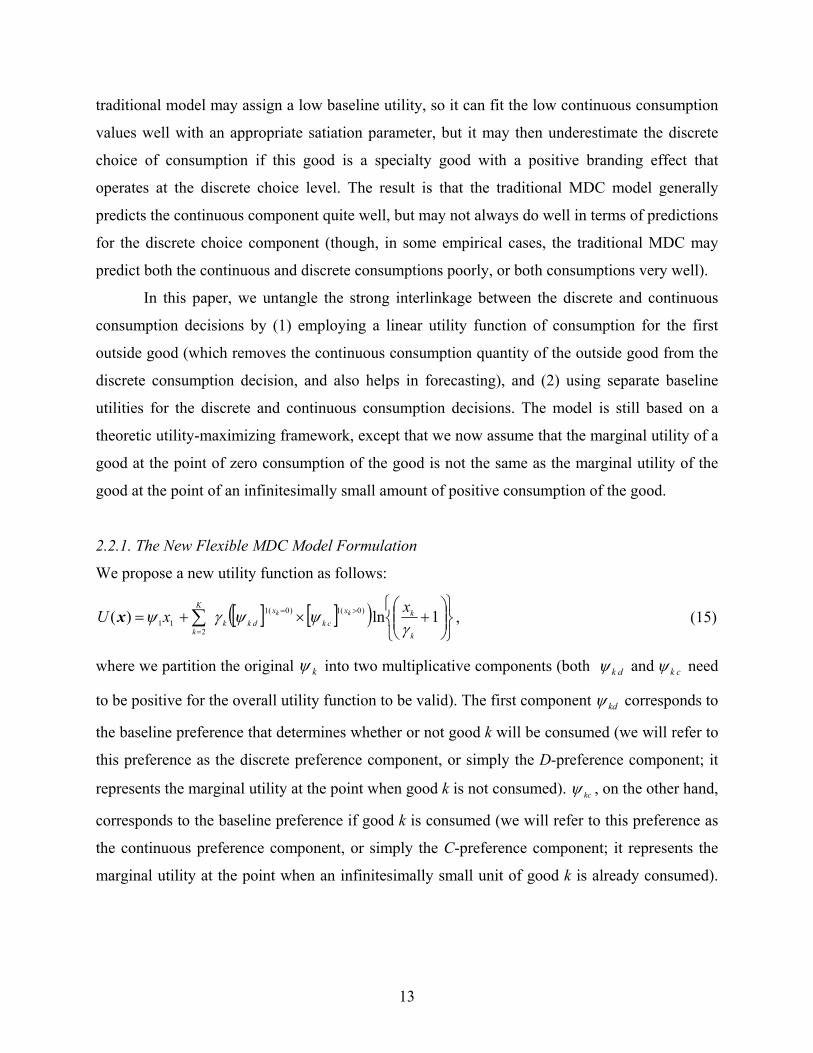
2.2.1. The New Flexible MDC Model Formulation
We propose a new utility function as follows:
1ln)( )0(1)0(1
211
k
kx
ck
x
dkk
K
k
xxU kk
x , (15)
where we partition the original k into two multiplicative components (both ckdk and need
to be positive for the overall utility function to be valid). The first component kd corresponds to
the baseline preference that determines whether or not good k will be consumed (we will refer to
this preference as the discrete preference component, or simply the D-preference component; it
represents the marginal utility at the point when good k is not consumed). kc , on the other hand,
corresponds to the baseline preference if good k is consumed (we will refer to this preference as
the continuous preference component, or simply the C-preference component; it represents the
marginal utility at the point when an infinitesimally small unit of good k is already consumed).

14
)0(1 kx in Equation (15) takes the value of 1 if 0kx and 0 otherwise, and )0(1 kx in
Equation (15) takes the value of 1 if 0kx and the value of 0 otherwise.3
To find the optimal allocation of goods, we construct the Lagrangian and derive the
Karash-Kuhn-Tucker (KKT) conditions. For the modified utility of Equation (15), these
conditions take the following form:
kk
kkckkd p
xp
1*
1)( and0 for k = 2,…, K with consumption *kx ( *
kx >0)
0 kkd p if 0* kx , Kk ,...,2 (16)
1 .
Note that, in the KKT conditions above, the inequality 0 kkd p is implicitly implied when
*
kx >0, because 0* kx otherwise (that is, 0 kkd p if 0* kx ). For our purposes, we write
0 kkd p when *
kx >0 explicitly in the KKT conditions above. It is the addition of this
explicit inequality, combined with different specifications for the D-preference and C-preference
components (as discussed later), that differentiates the proposed model from the traditional MDC
model.4 Substituting for from the last equation into the earlier equations for the inside goods,
and taking logarithms, we can rewrite the KKT conditions as:
0ln)ln(1ln)ln(and0ln)ln()ln( 1
*
1
k
k
kkckkd p
xp
for k = 2,…, K with consumption *kx ( *
kx >0) (17)
0ln)ln()ln( 1 kkd p if 0* kx , Kk ,...,2 .
To ensure the positivity of the D-preference and the C-preference terms, we specify these two
components for each inside good as follows:
, )exp(and)exp( kkkckkkd wθzβ (18)
3 At 0,kx 1
( )1 .k
kd kdk k
xU
x
x At 0 ,kx 1
0lim 1 .k
kc kcx
k
x
4 In the traditional MDC, kkckd , and it will be necessarily true that 0 kk p as soon as
px
k
kk
1*
1 if *
kx >0 because 1
*
1
k
kx
is between 0 and 1 (
k >0). Thus, it would be redundant to have
the condition 0 kk p , as discussed in Section 2.2.
15
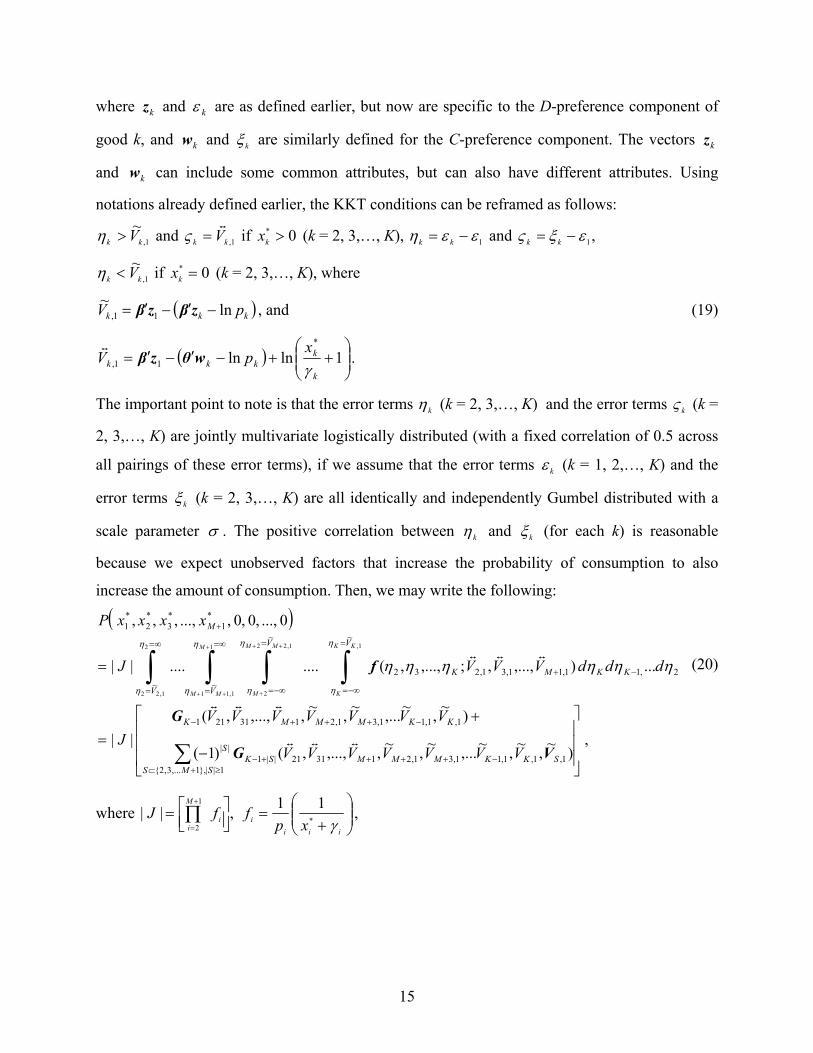
where kz and k are as defined earlier, but now are specific to the D-preference component of
good k, and kw and k are similarly defined for the C-preference component. The vectors kz
and kw can include some common attributes, but can also have different attributes. Using
notations already defined earlier, the KKT conditions can be reframed as follows:
1,
~kk V and 1,kk V
if 0* kx (k = 2, 3,…, K), 1 kk and ,1 kk
1,
~kk V if 0* kx (k = 2, 3,…, K), where
kkk pV ln
~11, zβzβ , and (19)
. 1lnln*
11,
k
kkkk
xpV
wθzβ
The important point to note is that the error terms k (k = 2, 3,…, K) and the error terms k (k =
2, 3,…, K) are jointly multivariate logistically distributed (with a fixed correlation of 0.5 across
all pairings of these error terms), if we assume that the error terms k (k = 1, 2,…, K) and the
error terms k (k = 2, 3,…, K) are all identically and independently Gumbel distributed with a
scale parameter . The positive correlation between k and k (for each k) is reasonable
because we expect unobserved factors that increase the probability of consumption to also
increase the amount of consumption. Then, we may write the following:
,)
~,
~,
~,...
~,
~,,...,,()1(
)~
,~
,...~
,~
,,...,,(
||
...),...,,;,...,,(........ ||
0 ..., ,0 ,0 , ..., , ,,
1,1,1,11,31,213121||11||},1,...3,2{
||
1,1,11,31,2131211
2,11,11,31,232
~~
~~
*1
*3
*2
*1
1,1,22
2
1
1,11
2
1,22
SKKMMMSKSMS
S
KKMMMK
KKMK
VV
VV
M
VVVVVVV
VVVVVVV
J
dddVVVJ
xxxxP
KK
K
MM
M
M
MM
VG
G
f
(20)
where , ||1
2
i
M
i
fJ
iii
i xpf
*
11,

16
.
1
!)
~,
~,..,
~,,...,(
and,
1
!)
~,..,
~,,...,(
1)
~()
~(
2
)(1
2
)(1
21,1,1,2121||1
1)
~(
2
)(1
2
)(1
21,1,21211
111
1
11
1
MV
Si
VK
Mk
VM
k
VM
kMSKMMSK
MVK
Mk
VM
k
VM
kMKMMK
ikk
k
kk
k
eee
eM
VVVV
ee
eM
VVVV
VG
G
(21)
As defined earlier, 1,
~SV is a vector of utility elements )(
~1, SiVi drawn from }
~,...,
~,
~{ 1,11,31,2 MVVV
that belong to the specific combination S. The likelihood function, which is the same as the
probability expression of Equation (20) written as a function of the parameter vector
( σ ,,, γθβ ) can be maximized in the usual fashion to estimate the parameters. The likelihood
function takes a convenient closed-form expression.
2.2.2. Forecasting
A two-phase approach may be used in forecasting, where, given the parameters of the model, the
multivariate discrete probability of consumption (or not) of each combination of the inside goods
may be obtained using Equation (10), followed by the continuous consumptions for the
consumed alternatives. Consider a specific combination corresponding to consumption of the
first M inside goods. Then, for this combination, based on the KKT conditions in Equation (19),
the following must be true:
kkkkkk WxV 1)|exp()exp(and~
11,*
1,1 for k = 2, 3,…, M+1, (22)
1,1
~kk V for k = M+2, M+3,…, K, where kkk pW ln| 1111, wθzβ .
The forecasting procedure for each observation is as follows:
Step 1: Develop the discrete choice probability of each of the possible )12( 1 K combinations
of consumption of the goods. That is, set M=1, develop all the possible C(K–1,1)
combinations of a single inside good having positive consumption and form the probability
of choice for each combination, then set M=2 develop all the possible C(K–1,2) combinations
of two inside goods having positive consumption and form the probability of choice for each
17
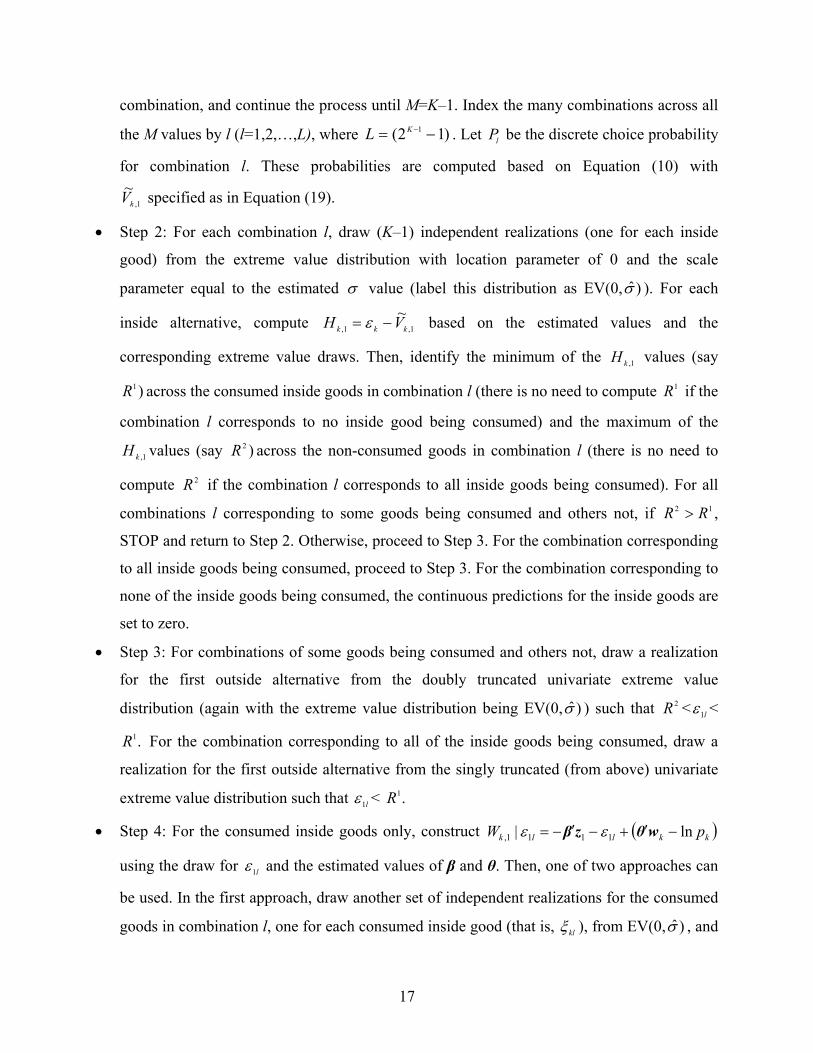
combination, and continue the process until M=K–1. Index the many combinations across all
the M values by l (l=1,2,…,L), where )12( 1 KL . Let lP be the discrete choice probability
for combination l. These probabilities are computed based on Equation (10) with
1,
~kV specified as in Equation (19).
Step 2: For each combination l, draw (K–1) independent realizations (one for each inside
good) from the extreme value distribution with location parameter of 0 and the scale
parameter equal to the estimated value (label this distribution as EV(0, )̂ ). For each
inside alternative, compute 1,1,
~kkk VH based on the estimated values and the
corresponding extreme value draws. Then, identify the minimum of the 1,kH values (say
)1R across the consumed inside goods in combination l (there is no need to compute 1R if the
combination l corresponds to no inside good being consumed) and the maximum of the
1,kH values (say )2R across the non-consumed goods in combination l (there is no need to
compute 2R if the combination l corresponds to all inside goods being consumed). For all
combinations l corresponding to some goods being consumed and others not, if 12 RR ,
STOP and return to Step 2. Otherwise, proceed to Step 3. For the combination corresponding
to all inside goods being consumed, proceed to Step 3. For the combination corresponding to
none of the inside goods being consumed, the continuous predictions for the inside goods are
set to zero.
Step 3: For combinations of some goods being consumed and others not, draw a realization
for the first outside alternative from the doubly truncated univariate extreme value
distribution (again with the extreme value distribution being EV(0, )̂ ) such that 2R < l1 <
.1R For the combination corresponding to all of the inside goods being consumed, draw a
realization for the first outside alternative from the singly truncated (from above) univariate
extreme value distribution such that l1 < .1R
Step 4: For the consumed inside goods only, construct kkllk pW ln| 1111, wθzβ
using the draw for l1 and the estimated values of β and θ. Then, one of two approaches can
be used. In the first approach, draw another set of independent realizations for the consumed
goods in combination l, one for each consumed inside good (that is, kl ), from EV(0, )̂ , and

18
predict the consumption levels for each consumed good in the combination for the specific
realization as 1)|exp()exp( 11,
* kkkl Wx . For the set of realizations for the consumed
inside goods, check to ensure that the sum of consumption quantities across the inside goods
is less than the budget constraint and that each consumption quantity is higher than zero. If
these conditions are not achieved, reject the corresponding realization, and go back to Step 4.
In the second approach, a more systematic truncation approach is used to ensure that the sum
of consumption quantities across the inside goods is less than the budget constraint and that
each consumption quantity is higher than zero. Specifically, first randomize the ordering of
the consumed inside goods. Then, start from the first consumed inside good in the random
ordering (label this as the second good, the first being the outside good). Draw a realization
for l2 from the doubly truncated univariate extreme value distribution EV(0, )̂ such that
.1ln)|()|(22
11,2211,2
p
EWW lll Using this realization for l2 , compute the
consumption level for this alternative in the combination l being considered as
211,22
*
2 1)|exp()exp( lll Wx . Next, if there are more than two inside goods consumed
in the combination l, draw a realization for l3 from the doubly truncated univariate extreme
value distribution EV(0, )̂ such that ,1ln)|()|(33
*22
11,3311,3
p
xpEWW l
lll
and compute 311,33
*
3 1)|exp()exp( ll Wx . Continue this process for all consumed
inside goods, drawing a realization from
,1ln)|()|(
*1
11,11,
kk
glg
k
glkkllk p
xpE
WW
and computing
.1)|exp()exp( 11,
*
klkklkl Wx
Step 5: Continue Steps 2 through 4 for each combination l until a fixed number of full
realizations are obtained, and take the mean (across realizations) of the consumption
quantities for each consumed inside good to predict the continuous consumption value.

19
Step 6: Forecast the continuous amount of consumption for each alternative k as
.** l
kllk xPx
The one issue with the forecasting approach above is that, for a given individual, it will
always forecast a positive value of consumption for each and every alternative, because it
considers all the possible combinations of consumption. In case a deterministic choice of
alternatives is needed, such as in a micro-simulation framework, another possible approach, that
may also be easier to implement and will forecast corner values, is to consider the discrete choice
probabilities from the first step, then use the usual discrete probability-to-deterministic choice
procedure (used in traditional simulation approaches) to determine the most likely market basket
of consumption, and forecast the consumption quantities for this single market basket.
Specifically, the procedure is as follows:
Step 1: Identical to Step 1 of the earlier forecasting procedure.
Step 2: Order the combinations from 1 to L in an arbitrary order (but retain this from hereon),
and, for each combination l up to the penultimate combination (l=1,2,…L–1), obtain the
cumulative probability from combination 1 to combination l as
l
ddl PCP
1
.
Step 3: Partition the 0-1 line into L segments (each corresponding to a specific combination l)
using the (L–1) lCP values. Draw a random uniformly distributed realization from {0,1} and
superimpose this value over the 0-1 line with the L segments. Identify the segment where the
realization falls, and declare the combination corresponding to that line segment as the
deterministic discrete event of consumption for the individual.
Step 4: Undertake Steps (2) through (6) from the previous forecasting procedure for the
specific combination identified from Step (3) above. This provides the continuous
consumption for the predicted discrete event of consumption from Step (3) above.
A third forecasting procedure is perhaps the easiest to implement, and does not use a two-
step approach (in which the probabilities of the discrete choice are first computed followed by
appropriate simulations). Rather, the simulations dictate even the discrete choice event. The
procedure is as follows:
Step 1: Draw K independent realizations (one for each inside good and the outside good)
from EV(0, )̂ .
20
Step 2: If 1,1
~kk V , declare the inside good as being selected for consumption ( )1kd ;
otherwise, declare the inside good as not being selected for consumption ( ).0kd
Step 3: Run through Steps (4) through (6) of the first forecasting procedure.
3. EMPIRICAL APPLICATION
3.1. Sample Description
To demonstrate an application of the new proposed MDCEV model, we consider the case of
time-use of individuals. This is a situation with no price variation. The data and sample used is
the same as those in Bhat et al. (2016a), and is drawn from the Puget Sound household travel
survey conducted during the spring (April–June) of 2014 in the four county PSRC planning
region (the four counties are King, Kitsap, Pierce, and Snohomish) in the State of Washington.
Survey administration and sampling details are provided in Bhat et al. (2016a). The sample used
includes 3,637 households who had at least one worker employed in the household and with a
work location outside the residential dwelling unit. The amount of time spent on a typical
weekday across all individuals in the household on (a) in-home (IH) non-work, non-educational,
and non-sleep activities and (b) out-of-home (OH) non-work non-educational pursuits is
computed from the survey. In the analysis, the OH activities are classified into one of six types:
(1) personal business (including family or personal obligations, going to day care, and medical
appointments), (2) shopping (including buying food and goods), (3) recreation (including visiting
cultural/arts centers, going to the movies, attending sports events, going to the gym, pursuing
physical activities such as running, walking, swimming, and playing sports), (4) eating out, (5)
social activities (including visiting friends or relatives and attending parties), and (6) “serve
passenger”. In all, there are seven activity purposes (alternatives in the MDCEV), with the first
in-home activity serving as the “outside good” in which all individuals participate. The discrete
component corresponds to household-level participation in these different activity purposes,
while the continuous component corresponds to the amount of household time invested in these
activity purposes. The total household time budget in the MDC model corresponds to the sum
across the seven activity purposes just listed. In the analysis, for convenience, we use the
household-level participations and fractions of time investments in each activity purpose as the
dependent variables (that is, we normalize the household time investments in each purpose by
the total household budget, so that the continuous components correspond to fractions, and the

21
total budget is 1 for each household). The sociodemographic characteristics of the sample are
available at
http://www.caee.utexas.edu/prof/bhat/ABSTRACTS/MDCP_GHDM/online_supplement.pdf).
3.2. Traditional MDCEV Model with -profile
Table 1 shows the estimation results for the traditional MDCEV model with a -profile
constraining the scale of the error terms to 1 (as has been done in earlier studies) and the same
model releasing this constraint on the scale. We will refer to the first model as the TFIXED-
MDCEV (for the traditional MDCEV with fixed scale) and the second as the T-MDCEV (for the
traditional MDCEV with freely estimated scale). While the intent of this paper is not to study
time-use behavior per se (rather it is to demonstrate the value of the proposed new MDCEV
model), we will note that the specification is based on a systematic process of rejecting
statistically insignificant effects, combining effects when they made sense and did not degrade fit
substantially, and, judgment and insights from earlier studies. Also, while variables such as
commute distance, residential location (whether living in a high density neighborhood or not,
and accessibility to out-of-home activities), and household auto-ownership have been used as
explanatory variables of time-use in the past, we avoid using these variables because Bhat et al.
(2016a) show that these variables are endogenous (co-determined) with time-use.
For completeness, we now briefly discuss the substantive results from the two models in
Table 1, which are similar to each other. The coefficients on the exogenous variables
corresponding to the baseline preference are not directly comparable, because the TFIXED-
MDCEV normalizes the error scale to one; however, one can notice that the coefficients in the T-
MDCEV model, when normalized by the estimated scale in that model of 0.4289, bring the
coefficient estimates in that model to close to the magnitudes of the first model.
The effects of the family structure variables are introduced with couple households and
multi-adult households as the base category (we did not find any difference in time-use among
these two family types; in any case, the fraction of multi-adult households in the sample was
quite low). Table 1 indicates that single person households have the lowest preference of all
household types for recreational, social, and serve passenger activities, and the highest
preference for in-home activities (the base activity purpose). Nuclear families and single-parent
families relative to other household types, have a clear higher baseline preference for serve

22
passenger activities (a reflection of child chauffeuring responsibilities), and nuclear families are
the least likely to participate and spend time in shopping.
The next set of variables relate to the fraction of part-time and non-workers in the
household, with the fraction of full-time workers in the household constituting the base category.
Overall, these coefficients indicate a pattern where households with a high fraction of part-time
workers and non-workers are more likely than full-time workers to participate in non-work out-
of-home activities (particularly in personal business) and are less likely to spend time at home.
This effect is particularly the case for households with a high fraction of non-workers.
The baseline preference constants and satiation parameters in Table 1 are estimated for
each activity purpose (except the IH activity purpose) to best replicate the continuous values of
time-use in the different activities and the split between sole and joint participations with other
activity purposes. Thus, they do not have any substantial interpretations. However, the baseline
preference constants are all negative in the TFIXED-MDCEV, a reflection of the fact that most
time is spent at home (across all individuals, the mean percentage of time spent at home in the
sample is 78%). Also, the constants are highest for the shopping and personal-business activity
purposes, and the lowest for the social and serve-passenger purposes. This is because, in trying to
fit to the continuous values, the traditional MDCEV model is replicating the presence of a high
fraction of non-zero values for the shopping and personal business purposes and a low fraction of
non-zero values for the social and serve-passenger purposes (about 45% of households in the
sample participate in each of shopping and personal business purposes; on the other hand, the
percentage of households with a non-zero time investment in recreation and eating out is about
30%, and the corresponding percentage for each of the social and serve passenger purposes is of
the order of 20%). The baseline preference constants in the T-MDCEV model in Table 1 do not
exactly follow the same trends as in the first model, and this is again because the sole purpose of
the constants, in combination with the satiation parameters and now the scale parameter too, is to
replicate the continuous values of time-use. However, among the out-of-home activities, the
constants are again highest for the shopping and personal business purposes and lowest for the
social and serve-passenger purposes.
The satiation ( ) ,...,3 ,2( Kkk ) parameters in Table 1 correspond to the -profile.
Satiation increases for purpose k as k goes closer to zero. In the sample, the shopping, eating
out, and serve passenger activity purposes, among the out-of-home activity purposes, have

23
relatively low durations of participation if non-zero (taking up between 5-8% of the total time
budget), while the personal business, recreation, and social purposes have relatively high
participation durations if non-zero (taking up between 13-20% of the total time budget). In both
the first and second models in Table 1, these trends are reflected in the high satiation rates (lower
values of k ) for the shopping, eating out, and serve passenger purposes, and low satiation rates
(higher values of k ) for the personal business, recreation, and social purposes.
The scale parameter, when freely estimated, shows that it is less than one and statistically
significantly so. Thus, arbitrarily normalizing to one when using the -profile, as done in earlier
studies that apply the traditional MDCEV model (and, more broadly, traditional MDC models),
is generally not appropriate, and will lead to an unnecessary degradation in fit. This is also
noticeable in the log-likelihood values at convergence for the two models (see the row panel
entitled “Data fit measures for continuous consumption” in Table 1). In fact, as indicated in the
next row, the log-likelihood with only the constants in the baseline preference for the T-MDCEV
model is superior to the log-likelihood at convergence for even the best specification with
additional exogenous variables for the TFIXED-MDCEV model. Using the log-likelihood at
constants for the TFIXED-MDCEV, the row entitled “Adjusted likelihood ratio index” (ADLRI)
computes the rho-bar squared value for each of the models as
)(
)ˆ(12
c
M
L
L
θ
, (23)
where )ˆ(θ
L and )(c L are the log-likelihood functions at convergence and at constants,
respectively, and M is the number of parameters (not including the constants appearing in the
baseline preference). The value of )(c L used in Equation (23) is -4534.94, corresponding to the
constant only log-likelihood value for the TFIXED-MDCEV model. The superiority of the T-
MDCEV model is apparent again. A likelihood ratio test between the two models rejects the
TFIXED-MDCEV model at any reasonable level of significance. To be noted here is that the
discussion on data fit thus far corresponds to the continuous values of consumption, because the
probability being maximized (as a function of parameters) in the traditional MDCEV is that of
the continuous consumptions as in Equation (14) (with zero being one of the continuous values).
Interestingly, when we compute a predictive likelihood for the discrete probability of
consumption (based on Equation (10) and the actual discrete pattern of consumptions for each

24
individual), the corresponding predictive log-likelihood values are -13,143.75 for the TFIXED-
MDCEV and -13,931.32 for the T-MDCEV (see the entries in the row entitled “predictive log-
likelihood at convergence” under “Data fit measures for discrete consumption” in Table 1). That
is, the traditional model normalizing the scale to one does better than the traditional model that
leaves the scale free to be estimated (this is another indication that the traditional MDCEV model
is based on improving the fit of the continuous consumption quantities, not necessarily the
discrete consumption event). Indeed, as can be observed from the entries corresponding to the
row “predictive log-likelihood at constants” under “Data fit measures for discrete consumption”,
the TFIXED-MDCEV with baseline constants only performs better than the T-MDCEV model
with variables included in the baseline preference (a reverse of the situation for the continuous
consumptions). Using the predictive log-likelihood with constants only for the T-MDCEV model
as the base, one can compute the predictive ADLRI values, which are presented in Table 1. One
can then use a predictive non-nested likelihood ratio test to compare the performances of the
implied discrete predictions from the two models. In particular, if the difference in the indices is
)( 22
MDCEVTMDCEVTFIXED , then the probability that this difference could have occurred by
chance is no larger than 5.0)]()(2[ MDCEVTMDCEVTFIXED MMc L in the asymptotic limit,
where the value of )(cL for this test is -14,319.56, MDCEVTFIXEDM =13, and .14MDCEVTM 5 A
small value for the probability of chance occurrence indicates that the difference is statistically
significant and that the model with the higher value for the adjusted likelihood ratio index is to
be preferred. The non-nested adjusted likelihood ratio test returns a value of )72.39( , which
is literally zero, clearly indicating that the TFIXED-MDCEV model (that does substantially
worse than the T-MDCEV in terms of the continuous predictions) does statistically better than
the T-MDCEV model in terms of the discrete event prediction.
5 The number of parameters for this predictive test correspond to the number of parameters estimated in the baseline parameters (excluding the constants) without considering the
k satiation parameters but including the scale
parameter in the T-MDCEV model (the k satiation parameters do not appear in the predictions for the discrete
component; see Equation (10)).

25
3.3. Traditional MDCEV Model with a Linear-in-Consumption Profile for the Outside
Good
As discussed earlier, one of the reasons for the tight linkage between the discrete and continuous
components in a traditional MDCEV model, which can compromise the ability of the traditional
MDCEV to predict the discrete choices well even as it focuses on predicting the continuous
choices well, is that the continuous consumption *
1x of the outside good appears in the discrete
consumption decision component (see Section 2.1.2). A better separation of the discrete
component from the continuous component can be achieved by assuming a linear-in-
consumption utility. That is, instead of using the -profile of Equation (2) in the traditional
MDCEV model, we now consider the following profile that we label as the L -profile (for
linear utility in the outside good, combined with a -profile for the inside goods):
1ln)(
211
k
kkk
K
k
xxU
x .
The above profile assumes that there is no satiation in the outside good. In doing so, and
following the earlier derivations, kkk pV ln~
11, zβzβ , and becomes independent of the
consumption of the outside good.6 This allows the forecasting of the discrete event for any
individual (given her or his associated exogenous vector of variables), whether or not the
individual’s observed choices are available. As importantly, the use of the L -profile presents
researchers with a utility-theoretic pure multiple discrete choice model that does not need any
observations on the continuous consumptions. This is an important supplementary contribution
of this paper.
Table 2 provides the data fit statistics for this L -profile, similar to Table 1 for the -
profile. Again, the TFIXED-MDCEV model is the one that constrains the scale to one and the T-
MDCEV model is the one that allows a free scale parameter. In Table 2, we dispense with the
presentation of the parameter estimates, and focus on data fit (the substantive interpretations of
exogenous effects remain the same). The ordering of the data fit statistics in Table 2 is the same
as in Table 1. As in the -profile case, the model that leaves the scale free for estimation does
6 On the other hand, as discussed in Section 2.1.2, the term kkk pxV lnln
~ *111, zβzβ includes *
1ln x in the
-profile utility form.

26
substantially better than the one that constrains the scale to one in the context of predicting the
continuous consumptions. In fact, the constants only model (but with the scale free) easily
surpasses even the best specification of exogenous variables when the scale is fixed to one. As
importantly, a comparison of the log-likelihood values of the two models in Table 2 with the
corresponding two models in Table 1 indicates that the models in Table 1 are doing much better
for the predictions of the continuous consumptions. A non-nested likelihood test of the TFIXED-
MDCEV models across the two tables (using the constants only log-likelihood of the TFIXED-
MDCEV from Table 2 as the base) returns a probability value of )14.42( , which is literally
zero. The corresponding probability value for the comparison of the T-MDCEV models across
the two tables (using the constants only log-likelihood of the T-MDCEV model from Table 2 as
the base) is )81.38( . These results are not surprising, since the models in Table 1 allow
satiation in the utility for the outside good, while the L -profile does not. Again, it should be
borne in mind that these log-likelihoods correspond to the continuous quantities of
consumptions.
However, the situation completely changes when the predictive likelihood for the discrete
probability of consumption is considered. First, there is not much difference between the
predictive likelihoods for the two models in Table 2. Using the constants only predictive log-
likelihood for discrete consumption from the T-MDCEV model of Table 1 as the base, the
adjusted likelihood ratio index values can be computed for each of the models in Table 2,
followed by a non-nested likelihood ratio test. As shown in Table 2, the result indicates that the
TFIXED-MDCEV is statistically better than the T-MDCEV model, even though the ADLRI
index difference is not much. But, much more importantly, the predictive log-likelihoods for the
discrete consumption events from the models in Table 2 are far superior to those from Table 1.
Again, using the constants only predictive log-likelihood for discrete consumption from the
TFIXED-MDCEV model of Table 1 as the base, one can compute a non-nested likelihood ratio
test between the TFIXED-MDCEV models in the two tables, and similarly a non-nested
likelihood ratio test between the T-MDCEV models in the two tables. The results in Table 2
clearly demonstrate the superiority of the L -profile models in Table 2 relative to those in Table
1 in terms of discrete consumption predictions. Indeed, the predictive log-likelihoods for discrete
consumptions from the constants only models in Table 2 are superior to those from the
corresponding full models in Table 1.

27
There are three primary summary results from the previous two sections. First, traditional
MDC models using the -profile have unnecessarily constrained the scale parameter to one.
Doing so can degrade the predictions of the continuous consumptions. Second, the -profile
does much better than a L -profile for the predictions of the continuous consumptions, but does
much worse than the L -profile for predictions of the discrete consumptions. This latter result is
because, given that the same baseline parameters drive both the discrete and continuous
consumption predictions in the traditional MDCEV model, the -profile uses satiation in the
outside good as an additional instrument to fit the continuous consumption values well. But it
also ties the discrete and continuous consumptions predictions very tightly through the presence
of the *
1ln x term in the discrete consumption predictions. The L -profile, on the other hand,
completely removes any continuous consumption element presence from the discrete
consumption predictions. While the use of the L -profile within the traditional MDCEV model
also focuses expressly on maximizing the likelihood of the continuous consumptions, the
optimization procedure essentially “realizes” that its effort is better spent on predicting the zero
continuous consumption values of the outside goods well even as its goal is to fit all continuous
consumptions well (because it has more limited ability to utilize the satiation in the outside good
to fit the non-zero values well).7 Third, our new proposed model essentially provides the L -
profile more flexibility to focus on the zero predictions as well as the non-zero predictions by
releasing the constraint of the same baseline parameters dictating the zero and the non-zero value
predictions. As we will see next, doing so more than makes up for the steep penalty the L -
profile pays (because of assuming zero satiation in the outside good) in terms of the overall
7 We noticed this clearly by way of the closeness of the predictive log-likelihood for the discrete consumptions from the L -profile traditional MDCEV model estimation (that maximizes the continuous consumptions) and a discrete
model estimation that expressly optimizes the discrete consumptions (using Equation (10) as the objective function, and setting the scale to one; note that the satiation parameters do not appear in this estimation). For the -profile,
the predictive log-likelihoods for the discrete consumption from the T-MDCEV model is -13931.32 as compared to the log-likelihood value of -13134.80 at convergence for the model that expressly maximizes the discrete log-likelihood. For the L -profile, the predictive log-likelihood for the discrete consumption from the T-MDCEV
model is -12743.95 as compared to the log-likelihood value of -12732.31 at convergence for the model that expressly maximizes the discrete log-likelihood. The closeness of the predictive discrete log-likelihoods and the actual discrete log-likelihood at convergence is clearly obvious for the L -profile. Of course, in some other
empirical contexts, it is possible that the performance difference between the -profile and L -profile MDCEV
models in predicting the discrete consumptions will not be as substantial as found in this study.

28
continuous consumption predictions in the traditional MDCEV model that has a single set of
baseline parameters driving both the zero and non-zero consumption predictions.
3.4. The Proposed New Flexible MDCEV Model Results
Table 3 provides the results for the proposed model, with separate baseline parameter estimates
for the discrete and continuous components using the L -profile, and a free estimate for the
error scale (the corresponding log-likelihood at convergence when the scale was constrained to
one was -5041.5; a nested likelihood ratio test between this model and the one in Table 3 returns
a value of 404.5, which implies the clear rejection of the scale-normalized model relative to
when the scale is estimated freely). Interestingly, in comparing the baseline preference
coefficients on exogenous variables from the T-MDCEV model in Table 1 with the
corresponding D-preference coefficients in Table 3, these all have the same signs and substantive
interpretations. Further, the scale-normalized coefficients from both these models are about
exactly the same. The D-preference constants have the expected negative signs, because the
participation rates in all the OH activities are lower than the 100% participation in in-home
activities (unlike those in the T-MDCEV model in Table 1, because the constants in the T-
MDCEV model of Table 1 also have a role in the continuous consumption predictions). What is
also important to note from the parameter estimates of the D-preference and C-preference
variables in Table 3 is that the coefficients sometimes have the opposite signs in the two baseline
preferences, as well as do not necessarily have the same set of variables. The C-preference
coefficients in Table 3 are introduced as increments over the D-preference coefficients (for
convenience in interpretation as well as to highlight statistically significant differences in
coefficients on the same variable across the two preference baselines). For instance, from the
standpoint of the D-preference (that is, discrete participation), single person households have the
lowest preference of all household types for recreational, social, and serve passenger activities.
However, conditional on participation, single person households have the highest baseline
preference for long time investments in these same activities (note that the sum of the D-
preference and C-preference coefficients, which represent the effective coefficients for the
continuous baseline component, are the most positive for single person households across all
household types). Also, while single person households do not appear to be more likely than
other households to participate in eating out activity (the variable does not appear in the D-

29
preference), such households have a clear higher propensity for long durations of time
investment in dining out conditional on participation (the variable has a clear and statistically
significant positive coefficient in the C-preference, while other households have a negative
coefficient on eating out or a zero effect for the base category of households). Many other
variables in Table 3 similarly have differential directions of effects and/or affect only one of the
discrete and continuous components of baseline preference. Other substantive results from Table
3 include the higher propensity of nuclear and single parent households to invest time in personal
business conditional on participation, as well as the lower propensity of such households,
conditional on participation, to invest time in any other out-of-home activity purpose relative to
other households (presumably because of child-rearing responsibilities, reinforcing time poverty
and potential social exclusion considerations that parents with children face in society; see
Bernardo et al., 2015). Also, while households with a high fraction of part-time workers and non-
workers are clearly more likely than households with a high fraction of full-time workers to
participate in shopping and personal business, the differences among these households are
substantially tempered in the context of duration of time investment conditional on participation.
The satiation parameters are much lower than the corresponding values in the traditional
models. That is, given the distinct baseline parameters for the continuous consumption (and the
generally more positive magnitudes for these baseline parameters than the in the traditional
models), the satiation parameters present much stronger satiation to fit the continuous
consumptions well.
3.5. Likelihood-Based Data Fit Measures
The bottom row panel of Table 3 presents the likelihood-based data fit statistics for the proposed
flexible MDCEV model and compares these with those from the traditional -profile MDCEV
and the traditional L -profile MDCEV. The fit statistics for all models correspond to the case
when the scale is estimated freely (the results for the two traditional models are reproduced from
Tables 1 and 2). The first row provides the log-likelihood at convergence for the full model,
while the second row provides the log-likelihood with only the constants in the D-preference and
C-preferences for the full model. Of course, these log-likelihoods for the proposed model cannot
be directly compared to those from the traditional models (since our model includes the distinct
modeling of both the discrete and continuous consumption events, while the traditional models
30
focus on the continuous consumption prediction).8 However, we are able to compute the
predictive log-likelihoods implied by our model for the continuous component and the discrete
component. The results in the table provide a positive log-likelihood value for the continuous
consumption, as predicted by our new model. This shows that our model is vastly superior to the
traditional models in terms of continuous consumption prediction (note that the predictive
likelihood of the continuous consumption includes density functions, and is a full density
function for the case when all goods are consumed; density functions are not constrained to be
less than one, and thus a positive predictive likelihood for the continuous consumption is
perfectly legitimate, and, in fact, shows the substantial superiority when the discrete and
continuous consumptions are disentangled). The Akaike Information Criterion (AIC)
[ MLLlog (# of model parameters)] and the Bayesian Information Criterion (BIC) values
[ MLLlog + 0.5(# of model parameters) log(sample size)] for the three models are shown in
Table 3.9 The AIC and BIC values reinforce the improved continuous consumption predictions
from our proposed model relative to the two traditional models. The predictive log-likelihood for
the discrete component is also better from our proposed model relative to the two traditional
models. The rho bar-squared values, computed with respect to the log-likelihood at constants of
the traditional -profile MDCEV, is also provided for all three models in the table, as is the
result of a non-nested predictive likelihood ratio test of each of the two traditional models with
respect to our proposed full model. Again, the superiority of our proposed model is clear even for
the discrete consumption component.
8 Our proposed model does not nest the traditional L -profile MDCEV model because that would require that
,,,...,3 ,2 θβwz Kkkk and cor( Kkkk ,...,3 ,21), in the D-preference and C-preference
specifications of Equation (18). The last of these conditions cannot be met by our proposed model, because the closed form is obtained by requiring that cor( Kkkk ,...,3 ,25.0), . As we discuss in the last section,
however, our proposed framework can be used to implement more flexible error forms for kk and that allow
testing whether the correlation between these error terms (for each k) approaches one. But allowing such flexible forms for the error terms will, of course, come at the expense of not having a nice closed-form probability structure as in our proposed model. 9 Log LML refers to the log-likelihood value at convergence. Many measures have been suggested in the literature to evaluate model fit among non-nested models. Including the AIC, the BIC, and variants of these (see Fonseca, 2010 for a listing and description of these information criteria). In general, the AIC tends to favor more complex models, leading to potential overfit. On the other hand, the BIC tends to favor simpler models, with an adjustment for sample size to avoid overfit. More simply speaking, the BIC-based measures demand a higher strength of evidence to add complexity than do the AIC-based measures, and thus the BIC-based measures favor more parsimonious models (see Neath and Cavanaugh, 2012).

31
3.6. Non-Likelihood Based Data Fit Measures
The likelihood-based tests (for the comparison of the two traditional models and the proposed
flexible MDCEV model) constitute disaggregate measures of fit that consider performance at the
multivariate and disaggregate level, While the best data fit measures, these are not very intuitive.
So, we also evaluate the performance of the three models intuitively and informally at a
disaggregate and aggregate level. At the disaggregate level, we estimate the probability of the
observed multivariate discrete outcome for each individual using Equation (10), and compute an
average probability of correct prediction for the discrete consumption outcome. At the aggregate
level, we design an informal heuristic diagnostic check of model fit by computing the predicted
aggregate share of individuals for specific multivariate discrete outcomes (because it would be
infeasible to provide this information for each possible multivariate outcome). In particular, we
compare the aggregate marginal trivariate predictions (with the true sample values) for
combinations of three of the most participated-in inside activity purposes: shopping, personal
business, and eat-out (the outside activity is always participated in). That is, we first compute the
probability of each individual participating in each of the following seven combination activity
purposes (including in-home): (1) shopping only, (2) personal business only, (3) eat-out only, (4)
shopping and personal business, (5) shopping and eat-out, (6) personal business and eat-out, and
(7) shopping, personal business, and eat-out (these probabilities are computed using Step 1 of the
first forecasting algorithm). The probabilities for each combination are averaged across
individuals to obtain the predicted percentage of individuals falling into each combination
category and compared with the actual percentage of individuals in each combination (using the
weighted mean absolute percentage error (MAPE) statistic, which is the MAPE for each
combination weighted by the actual percentage shares of individuals participating in each
combination.
For the continuous consumption predictions, to remove any effects of poor discrete
choice predictions on the continuous prediction outcomes, we assume the observed multivariate
discrete outcome, and predict the continuous consumptions for each individual using Steps (2)
and (3) of the first forecasting algorithm (and its equivalent for the traditional models). In using
this procedure, we use 1000 error vector replications per individual observation. We then
compute the aggregate predicted continuous consumption values for each inside activity purpose
across all individuals at the individual level (these are in the form of fractions of the time budget

32
invested in each activity participated in), and compare the predicted versus actual fractions of
time budget invested in each inside good using the MAPE statistic (note that the time budget for
the outside good is effectively obtained from the inside good consumptions).
For the discrete consumptions, the average probability of correct prediction from the
traditional -profile MDCEV model, the traditional L -profile MDCEV model, and the
proposed new flexible MDCEV model were 0.0451, 0.0695, and 0.0705, respectively. Table 4
presents the aggregate prediction results. The top row panel provides the actual and predicted
percentages of individuals participating in each of the seven specific combinations identified
earlier. The weighted MAPE is about the same for the traditional L -profile model and the
proposed flexible model, and is about 50% higher for the traditional -profile MDCEV model.
In the table, we also provide the weighted MAPE statistic for the number of inside alternatives
chosen in the same, and here again the traditional L -profile model and the proposed flexible
model perform much better than the traditional -profile MDCEV model.
The bottom row panel of Table 4 provides the aggregate continuous consumption values
(as a percentage of total budget) for each of the six inside alternatives. The superior performance
of the proposed model is clear here. Interestingly, while at the disaggregate-level, the traditional
-profile MDCEV model does better than the traditional L -profile MDCEV model, the latter
outperforms the former in the context of the aggregate continuous predictions (though this is
primarily because of the relatively poor aggregate prediction for the personal business activity
from the traditional -profile MDCEV model).
4. CONCLUSIONS
The traditional MDC models simultaneously estimate the baseline marginal utility and the
satiation parameters so that the level of consumptions is fitted well (with zero consumption
simply being one possible continuous consumption value). The result is that the traditional MDC
models generally predict the continuous component well, but may not do as well in terms of
predictions for the discrete choice component.
In this paper, we propose, for the first time, a new flexible and also utility-theoretic MDC
model that breaks the tight linkage between the discrete and continuous choice dimensions of the
traditional MDC models. We do so by (1) employing a linear utility function of consumption for

33
the first outside good (which removes the continuous consumption quantity of the outside good
from the discrete consumption decision, and also helps in forecasting), and (2) using separate
baseline utilities for the discrete and continuous consumption decisions. In the process of
proposing our new formulation, we also revisit two issues related to the traditional MDC model.
The first relates to clarification regarding the identification of the scale parameter of the error
terms, and the second relates to the probability of the discrete choice component of the
traditional MDC model (that is, the multivariate probability of consumption or not of the
alternatives). We show why the scale parameter of the error terms is indeed estimable when a -
profile is used, as well as show how one may develop an expression for the discrete choice
consumption probability.
The paper then proposes a new utility functional form for modeling MDC choices. To
introduce stochasticity in the model, we consider independent and identically distributed (IID)
log-extreme-value error terms in the baseline utility preferences for the discrete component and
for the continuous component. This stochastic specification results in a multivariate logistic
distribution functional form for the error terms in the discrete and continuous baseline
preferences, and leads to a closed form MDCEV model, as well as allows the discrete choice
probabilities to be specified in closed form. The latter issue, when combined with our proposed
L -profile, presents a methodology to estimate pure multiple discrete choice models without the
need for information on the continuous consumptions. We also develop forecasting procedures
for the proposed model that are easily implemented, thanks to the disentangling of the strong tie
between the discrete and continuous components.
To demonstrate an application of the proposed model, we consider the case of time-use of
individuals. The data and sample used is drawn from the Puget Sound household travel survey
conducted by the Puget Sound Regional Council (PSRC) in the spring (April–June) of 2014 in
the four county PSRC planning region (the four counties are King, Kitsap, Pierce, and
Snohomish) in the State of Washington. The participation decision and the amount of time spent
on a typical weekday across all individuals in the household on (a) in-home (IH) non-work, non-
educational, and non-sleep activities and (b) out-of-home (OH) non-work non-educational
pursuits are computed from the survey, and form the multiple discrete-continuous dependent
variable. In a comparative empirical assessment of the fit from the proposed model and from the
34
traditional MDCEV models, our proposed model came out clearly as the winner in terms of
better predicting both the discrete outcome data as well as the continuous consumptions.
In summary, the proposed new flexible MDCEV formulation should be a valuable
approach to model multiple discrete-continuous choices if one is willing to work with IID log
extreme-value error terms across the baseline preferences, and accept a constant correlation of
0.5 across the D-preference and C-preference error terms. Of course, the framework developed
here can also form the basis for more general MDC models, such as introducing flexible forms of
stochasticity through (a) the specification of multivariate error structures across the baseline
preferences of alternatives (such as a multivariate normal error structure), (b) correlations across
error terms in the D-preference and C-preference baselines, and (c) mixing error structures to
accommodate unobserved heterogeneity in the responsiveness to exogenous variables. However,
such more general stochastic formulations will also lead to more complicated model forms, with
many of these having non-closed forms for the probability expressions. Also, while the proposed
MDCEV model performs substantially better than the traditional MDCEV in our empirical
context, it is important to bear in mind that the traditional MDCEV may perform almost as well
as the proposed model in other empirical contexts where the discrete and continuous marginal
utility functions are not very different. Similarly, in other empirical contexts, the traditional
MDCEV model, which has much fewer parameters to estimate, may be able to predict both the
discrete and continuous consumptions reasonably well. Thus, comparing the performance of the
traditional parsimonious (in parameters) MDCEV with the proposed more flexible MDCEV
model would always be helpful. Finally, this is the first foray into a flexible MDCEV
formulation, and the properties of this model need to be examined carefully in future studies.
ACKNOWLEDGMENTS
This research was partially supported by the U.S. Department of Transportation through the
Data-Supported Transportation Operations and Planning (D-STOP) Tier 1 University
Transportation Center. The author would like to acknowledge support from a Humboldt
Research Award from the Alexander von Humboldt Foundation, Germany. The author is also
grateful to Lisa Macias for her help in formatting this document. Three anonymous reviewers
provided useful comments on an earlier version of this paper.
35
REFERENCES
Bernardo, C., Paleti, R., Hoklas, M., Bhat, C.R., 2015. An empirical investigation into the time-use and activity patterns of dual-earner couples with and without young children. Transportation Research Part A, 76, 71-91.
Bhat, C.R., Astroza, S. Bhat, A.C., Nagel, K., 2016a. Incorporating a multiple discrete-continuous outcome in the generalized heterogeneous data model: Application to residential self-selection effects analysis in an activity time-use behavior model. Transportation Research Part B, 91, 52-76.
Bhat, C.R., Astroza, S., Bhat, A.C., 2016b. On allowing a general form for unobserved heterogeneity in the multiple discrete-continuous probit model: Formulation and application to tourism travel. Transportation Research Part B, 86, 223-249.
Bhat, C.R., 2005. A multiple discrete-continuous extreme value model: Formulation and application to discretionary time-use decisions. Transportation Research Part B, 39(8), 679-707.
Bhat, C.R., 2008. The multiple discrete-continuous extreme value (MDCEV) model: Role of utility function parameters, identification considerations, and model extensions. Transportation Research Part B, 42(3), 274-303.
Calastri, C., Hess, S., Daly, A., Carrasco, J.A., 2017. Does the social context help with understanding and predicting the choice of activity type and duration? An application of the Multiple Discrete-Continuous Nested Extreme Value model to activity diary data. Transportation Research Part A, 104, 1-20.
Castro, M., Bhat, C.R., Pendyala, R.M., Jara-Diaz, S.R., 2012. Accommodating multiple constraints in the multiple discrete-continuous extreme value (MDCEV) choice model. Transportation Research Part B, 46(6), 729-743.
Deaton A., Muellbauer J., 1980. Economics and Consumer Behavior. Cambridge University Press: Cambridge.
Fonseca, J.R., 2010. On the performance of information criteria in latent segment models. World Academy of Science, Engineering and Technology, 63.
Hendel, I., 1999. Estimating multiple-discrete choice models: An application to computerization returns. Review of Economic Studies, 66, 423-446.
Jäggi, B., Weis, C., Axhausen, K.W., 2013. Stated response and multiple discrete-continuous choice models: analyses of residuals. Journal of Choice Modelling, 6, 44-59.
Jian, S.S., Rashidi, T.H., Dixit, V. 2017. An analysis of carsharing vehicle choice and utilization patterns using multiple discrete-continuous extreme value (MDCEV) models. Transportation Research Part A, 103, 362-376.
Khan, M., Machemehl, R., 2017. Commercial vehicles time of day choice behavior in urban areas. Transportation Research Part A, 102, 68-83.
Kim, J., Allenby, G.M., Rossi. P.E., 2002. Modeling consumer demand for variety. Marketing Science, 21, 229-250.
Lu, H., Hess, S., Daly, A., Rohr, C., 2017. Measuring the impact of alcohol multi-buy promotions on consumers' purchase behavior. Journal of Choice Modelling, 24, 75-95.
36
Mäler, K-G., 1974. Environmental Economics: A Theoretical Inquiry. The Johns Hopkins University Press for Resources for the Future, Baltimore, MD.
Neath, A.A., Cavanaugh, J.E., 2012. The Bayesian information criterion: Background, derivation, and applications. WIREs Computational Statistics, 4, 199-203.
Pinjari, A.R., 2011. Generalized extreme value (GEV)-based error structures for multiple discrete-continuous choice models. Transportation Research Part B, 45(3), 474-489.
Pinjari, A.R., Bhat, C.R., 2010. A multiple discrete-continuous nested extreme value (MDCNEV) model: Formulation and application to non-worker activity time-use and timing behavior on weekdays. Transportation Research Part B, 44(4), 562-583.
Pinjari, A.R., Bhat, C.R., 2011. Computationally efficient forecasting procedures for Kuhn-Tucker consumer demand model systems: Application to residential energy consumption analysis. Working paper, Department of Civil and Environmental Engineering, University of South Florida.
Shin, J., Ahn, J., Lee, D., 2015. The impact of diversification with and without commodity bundling on corporate performance: An empirical analysis in Korea telecommunication markets. Technological Forecasting and Social Change, 101, 314-319.
von Haefen, R.H., Phaneuf, D.J., 2003. Estimating preferences for outdoor recreation: a comparison of continuous and count data demand system frameworks. Journal of Environmental Economics and Management, 45(3), 612-630.
Wafa, Z., Bhat, C.R., Pendyala, R.M., Garikapati, V.M., 2015. Latent-segmentation-based approach to investigating spatial transferability of activity-travel models. Transportation Research Record: Journal of the Transportation Research Board, 2493, 136-144.
Wales, T.J., Woodland, A.D., 1983. Estimation of consumer demand systems with binding non-negativity constraints. Journal of Econometrics, 21(3), 263-85.
Yonezawa, K., Richards, T.J., 2017. Consumer risk-reduction behavior and new product purchases. Managerial and Decision Economics, 38(7), 1003 1016.
You, D., Garikapati, V.M., Pendyala, R.M., Bhat, C.R., Dubey, S., Jeon, K., Livshits, V., 2014. Development of vehicle fleet composition model system for implementation in activity-based travel model. Transportation Research Record: Journal of the Transportation Research Board, 2430, 145-154.

37
Table 1. Estimation Results for Traditional MDCEV Model with a -profile
Independent Variables/ Data Fit Measures
TFIXED-MDCEV T-MDCEV
Shop Pers. Bus. Recr. Dining Social Serve Shop
Pers. Bus. Recr. Dining Social Serve
Coeff (t-stat)
Coeff (t-stat)
Coeff (t-stat)
Coeff (t-stat)
Coeff (t-stat)
Coeff (t-stat)
Coeff (t-stat)
Coeff (t-stat)
Coeff (t-stat)
Coeff (t-stat)
Coeff (t-stat)
Coeff (t-stat)
Family structurea
Single person HH -- -- -0.496 (-5.67)
-- -0.299 (-2.72)
-1.354 (-7.74)
-- -- -0.254 (-6.70)
-- -0.169 (-3.59)
-0.596 (-7.80)
Nuclear family -0.230 (-3.44)
-- -- -- -- 1.555
(18.47) -0.032(-1.09)
-- -- -- -- 0.728
(18.86)
Single parent family -- -- -- -- -- 0.982
(4.07) -- --
-- -- -- 0.534 (5.10)
Fraction of adults by work status in HHb
Part-time workers 0.365 (3.09)
0.651 (5.58)
-- -- 0.406 (2.37)
0.373 (2.18)
0.178(3.47)
0.292 (5.74)
-- -- 0.191 (2.58)
0.181 (2.44)
Non-workers 0.789 (6.24)
1.109 (8.82)
-- -- 0.484 (2.53)
-- 0.350
(6.35) 0.481 (8.72)
-- -- 0.207 (2.52)
--
Baseline preference constants -0.082 (-1.98)
-0.312 (-7.72)
-0.600(-15.09)
-0.596 (-16.91)
-1.266 (-19.51)
-1.439 (-21.20)
0.170(9.14)
0.045 (2.42)
-0.034 (-1.74)
-0.041 (-2.31)
-0.321 (-10.07)
-0.417 (-12.42)
Satiation parameters 0.027
(24.44) 0.103
(20.74) 0.089
(18.52)0.038
(19.32) 0.160
(14.30) 0.014
(16.09) 0.085
(23.03)0.442
(17.49)0.281
(17.83) 0.128
(18.85) 0.514
(13.64) 0.047
(16.61) Scale parameter Fixed to the value of 1.0 0.429 (t-stat of 62.08 with respect to the value of 1.0) Fit measures for continuous consumptions Log-likelihood at convergence -4163.88 -3529.26 Log-likelihood at constants -4534.94 -3940.22 Number of parameters 19 20 Adjusted likelihood ratio index 0.0776 0.2174
Nested likelihood ratio test Test statistic [-2*(LLTFIXED-MDCEV-LLT-MDCEV)]=1269.24 > Chi-Squared statistics with 1 degree of freedom at any reasonable
level of significance; Conclusion is that the T-MDCEV model is preferred Fit measures for discrete consumptions Predictive log-likelihood at convergence -13143.75 -13931.32 Predictive log-likelihood at constants -13540.06 -14319.56 Number of parameters 13 14 Predictive adjusted likelihood ratio index 0.0821 0.0261 Predictive non-nested test 0001.072.39 ; Conclusion is that the TFIXED-MDCEV model is preferred
--: Not significant a: base is couple family and multi-adult households b: base is full-time workers

38
Table 2. Estimation Results for Traditional MDCEV Model with a L -profile, and Comparison with the Traditional MDCEV Model with a -profile
Independent Variables/ Data Fit Measures
TFIXED-MDCEV T-MDCEV
Scale parameter Fixed to the value of 1.0 0.121 (t-stat of 73.23 with respect to the
value of 1.0)
Data fit measures for continuous consumptions
Log-likelihood at convergence -5147.96 -4195.24
Log-likelihood at constants -5497.32 -4528.14
Number of parameters 19 20
Adjusted likelihood ratio index 0.0600 0.2332
Nested likelihood ratio test between the TFIXED-MDCEV and T-MDCEV models of this table
Test statistic [-2*(LLTFIXED-MDCEV-LLT-MDCEV)]=1905.44 > Chi-Squared statistics with 1 degree of freedom at any reasonable level of significance; Conclusion is that the T-
MDCEV model is preferred
Non-nested likelihood ratio test between the TFIXED-MDCEV models from Tables 1 and 2
0001.014.42 ; Conclusion is that the TFIXED-MDCEV model from Table 1 is
better Not applicable
Non-nested likelihood ratio test between the T-MDCEV models from Tables 1 and 2
Not applicable 0001.081.38 ; Conclusion is that the
T-MDCEV model from Table 1 is better
Data fit measures for discrete consumptions
Predictive log-likelihood at convergence -12738.40 -12743.95
Predictive log-likelihood at constants -13104.41 -13106.63
Number of parameters 13 14
Predictive adjusted likelihood ratio index 0.1095 0.1091
Predictive non-nested likelihood ratio test between the TFIXED-MDCEV and T-MDCEV models of this table
001.023.3 ; Conclusion is that the TFIXED-MDCEV model is preferred
Predictive non-nested likelihood ratio test between the TFIXED-MDCEV models from Table 1 and 2
0001.047.28 ; TFIXED-MDCEV model from Table 2 is better
Not applicable
Predictive non-nested likelihood ratio test between the T-MDCEV models from Table 1 and 2
Not applicable 0001.076.48 ; T-MDCEV model
from Table 2 is better

39
Table 3. Estimation Results for Proposed New Flexible MDCEV Model with a L -profile
Independent Variables/ Data Fit Measures
Discrete baseline preference (D-preference) Continuous baseline preference (C-preference) Shop P.Bus. Recr. Dining Social Serve Shop P. Bus. Recr. Dining Social Serve Coeff
(t-stat) Coeff
(t-stat) Coeff
(t-stat)Coeff
(t-stat) Coeff
(t-stat) Coeff
(t-stat) Coeff
(t-stat)Coeff
(t-stat) Coeff
(t-stat) Coeff
(t-stat) Coeff
(t-stat) Coeff
(t-stat) Family structurea
Single person HH -- -- -0.248 (-5.22)
-- -0.145 (-2.54)
-0.685 (-7.20)
0.436 (10.43)
-- 0.750
(11.23) 0.419
(9.57) 0.760
(9.18) 1.250
(9.10)
Nuclear family -0.119 (-3.19)
-- -- -- -- 0.815
(14.94) -0.243 (-4.89)
0.692(17.92)
-0.225 (-4.86)
-0.403 (-7.62)
-0.353 (-6.40)
-0.935 (-13.49)
Single parent family -- -- --- -- -- 0.441
(3.27) -0.432 (-3.07)
1.139 (12.35)
-0.232 (-1.26)
-0.373 (-2.25)
-0.170 (-1.99)
-0.538 (-2.58)
Fraction of adults by work status in HHb
Part-time workers 0.222 (3.51)
0.348 (5.60)
-- -- 0.130 (1.80)
0.129 (1.81)
-0.383 (-4.60)
-0.244 (-2.94)
-0.217 (-2.67)
-- -- --
Non-workers 0.410 (6.13)
0.601 (8.73)
- -- 0.217 (2.94)
-- -0.169 (-1.89)
-0.695 (-7.73)
-- -- -- 0.170 (1.69)
Baseline preference constants -0.255 (-9.64)
-0.343 (-12.93)
-0.509 (-18.16)
-0.512 (-18.91)
-0.844 (-21.38)
-0.947 (-19.74)
1.348 (15.09)
0.914 (15.34)
1.534 (18.50)
1.372 (17.05)
1.824 (19.90)
1.747 (14.89)
Satiation parameters One set of satiation parameters as listed in next column 0.013 (8.52)
0.065 (11.72)
0.036 (9.27)
0.021 (9.13)
0.050 (8.19)
0.008 (7.05)
Scale parameter 0.5244 (t-stat of 27.98with respect to the value of 1.0) Data fit measures for full model Log-likelihood at convergence -4636.92 Log-likelihood at constants -5673.25 Fit measures for continuous consump.
Predictive log-likelihood at convergence = -3218.90 for flexible MDCEV model, = -3529.26 for -profile T-MDCEV, = -4195.24 for L -profile T-MDCEV
Number of model parameters =49 for flexible MDCEV model, =20 for -profile T-MDCEV, = 20 for L -profile T-MDCEV
Akaike Information Criterion = -3169.90 for flexible MDCEV model, = -3549.26 for -profile T-MDCEV, = -4205.24 for L -profile T-MDCEV
Bayesian Information Criterion = -3018.03 for flexible MDCEV model, = 3611.25 for -profile T-MDCEV, = 4277.23 for L -profile T-MDCEV
Fit measures for discrete consumptions
Predictive log-likelihood at convergence = -12738.37 for flexible MDCEV model, = -13,931.32 for -profile T-MDCEV, = -12743.95 for L -profile T-MDCEV
Predictive log-likelihood at constants = -13111.35 for flexible MDCEV model, = -14319.56 for -profile T-MDCEV, = -13106.63 for L -profile T-MDCEV
Number of parameters 14 non-constant parameters for all models that determine discrete consumption patterns
Predictive adjusted likelihood ratio index 0.1094 for flexible MDCEV model, 0.0261 for -profile T-MDCEV, 0.1091 for L -profile T-MDCEV
Predictive non-nested test 84.48 and 93.2 for comparisons of the -profile T-MDCEV and L -profile T-MDCEV with the proposed
flexible MDCEV model; Conclusion is that the proposed flexible MDCEV model is preferred

40
Table 4. Aggregate Measures of Fit
Percentage of individuals participating in in-home and…
Actual percentage of individuals
participating
Traditional -
profile MDCEV prediction
Traditional L -
profile MDCEV prediction
Proposed Flexible MDCEV model
prediction
Shopping (S) only 9.76 6.39 7.24 7.06
Personal Business (PB) only 5.94 5.16 6.54 6.54
Eat Out only (EO) 5.58 3.03 3.44 3.56
S and PB 5.88 3.63 4.62 4.43
S and EO 2.89 1.99 2.19 2.16
PB and EO 2.42 1.55 1.90 1.93
S and PB and EO 2.69 2.36 2.68 2.60
Weighted Mean Absolute Percentage Error - 31.40 22.06 22.96
Weighted Mean Absolute Percentage Error for number of inside alternatives picked
- 39.55 22.59 22.42
Percentage of overall time-budget spent in … Actual percentage Traditional -
profile MDCEV prediction
Traditional L -
profile MDCEV prediction
Proposed Flexible MDCEV model
prediction
Shopping 2.76 3.12 2.41 3.07
Personal Business 8.92 6.91 8.35 8.58
Recreation 3.65 3.18 3.10 3.94
Eat Out 2.44 2.26 1.95 2.39
Social 3.26 2.42 2.72 3.48
Serve Passenger 0.97 0.72 0.70 0.70
Weighted Mean Absolute Percentage Error - 18.69 12.61 6.75