a new antispoofing approach for biometric devices
TRANSCRIPT

1
Abstract— The deployment of fingerprint sensors is increasingly becoming common and has now gained high user acceptance. However, fingerprint sensors are susceptible to spoofing using artificial materials or in worst case to the dismembered fingers. Fake/gummy fingerprints have shown to fool most commercial fingerprint systems. This paper proposes a new method of anti-spoofing using reliable liveness detection. The proposed method of liveness detection is based on the principle of pulse oximetry and involves the source of light originating from a probe at two wavelengths. The light is partly absorbed by haemoglobin, by amounts which differ depending on whether it is saturated with oxygen or deoxygenated haemoglobin. We then perform the computations for the absorption at two wavelengths to estimate the proportion of haemoglobin which is oxygenated. The computed percentage of oxygen in the blood, along with the heart pulse rate, determines the liveness of the enrolled biometric. Our experimental results demonstrate that the developed prototype can successfully thwart the spoof attacks (including those based on dismembered fingers).
Index Terms— Antispoofing, biometrics, fingerprint antispoofing, liveness detection, pulse oximetry.
I. INTRODUCTION ecent research and tests have show that with negligible-to-modest effort, many leading biometric
technologies are susceptible to attacks in which fake fingerprints, static facial images, static iris images can be used successfully as biometric samples. These fraudulent samples are processed by the biometric system to generate templates and to verify enrolled individuals. Methods of attack include fashioning fingerprints from gelatin, superimposing iris images atop human eyes, and even breathing on a fingerprint sensor. All biometrics are vulnerable to spoofing from the smartly faked copies.
• Hand Geometry and Palm print acquisition devices can be easily spoofed.
• Biometric samples are vulnerable to spoof attacks and should no longer be considered a secret.
• The survival of biometric identification technologies will depends on its ability to reject fake samples.
The answer to the above problems lies in Liveness Detection Countermeasures. In general, a biometric system may have to cope up spoof attacks at two levels; sensor level and data level. The data level attacks involve spurious transmission of the sensed data, template data or matching score data at key intersections to achieve the favorable decision [32]. The imposter attacks at data level are not considered in this work. The objective of our work is to introduce a new capability in the biometric system to detect during enrollment and identification or verification, whether the biometric sample presented is alive or not. Furthermore, since our system is designed to protect against the attacks from artificial fingerprints, it must also
† Corresponding Author, Email: [email protected]
check that the presented biometric sample belongs to the live human being who was originally enrolled in the system and not just any live human being. Many users believe that the current biometric systems can detect liveness in the presented biometric. Some manufacturers of biometric system also claim to have liveness detection in their system. It has however been shown that fingerprint systems can be fooled with artificial fingerprints, that static facial images can be used to fool face recognition systems [23], and that static iris images can be used to fool iris recognition systems [5].
A. Prior Work and Motivation The fingerprint of a person enrolled in a database is easy to
acquire, even without the user’s knowledge and cooperation. The latent fingerprint impressions on the daily-use products or on sensors of access control may itself be lifted and used as templates [4]. Successful experiments in creating fake fingers and spoofing commercially available fingerprint sensors have been reported by Putte and Keuning [8] and by Matsumoto et al. [25]. Schuckers [13] has presented a detailed study on the detection of liveness and fake biometric samples for the fingerprint based systems. Uludag and Jain [14] use hill climbing approach to synthesize target feature templates that can guarantee positive identification in small number of attempts. Moon et al. [22] have analyzed surface coarseness of high resolution fingerprint images and proposed wavelet based approach for liveness detection. Another texture analysis based liveness detection test for fingerprint images is reported in [25]. Recently, Antonelli et al. [21] have proposed the detection of fake fingers from the video analysis of distortion pattern generated on the surface.
Researchers have suggested several liveness countermeasures to avoid sensor level spoof attacks: finger response to electrical impulse [17], finger temperature and electrocardiographic signals [15], and time varying perspiration patterns from fingertips [3]. Despite variety of these suggestions only few have been implemented [24] and there has been no investigation to ascertain the effectiveness of these approaches in liveness detection for fingerprint devices. The measurement of the percentage of oxygen in the blood has been known in the literature [26]-[27] and used in the medical measurements. However, there has not been any systematic study to illustrate its usefulness/effectiveness as an antispoofing technique for the fingerprint identification. Therefore the objective of our work was to design, develop and investigate the utility of oxygenated blood measurements for fingerprint antispoofing. We propose a low-cost, fully automated design that works simultaneously with fingerprint identification device and reliably thwarts sensor level spoof attempts. The developed system combines pulse oximetry with the fingerprint sensing and can be easily integrated to any existing fingerprint devices.
A New Antispoofing Approach for Biometric DevicesP. Venkata Reddy, Ajay Kumar†, S. M. K. Rahman, Tanvir Singh Mundra
R
2
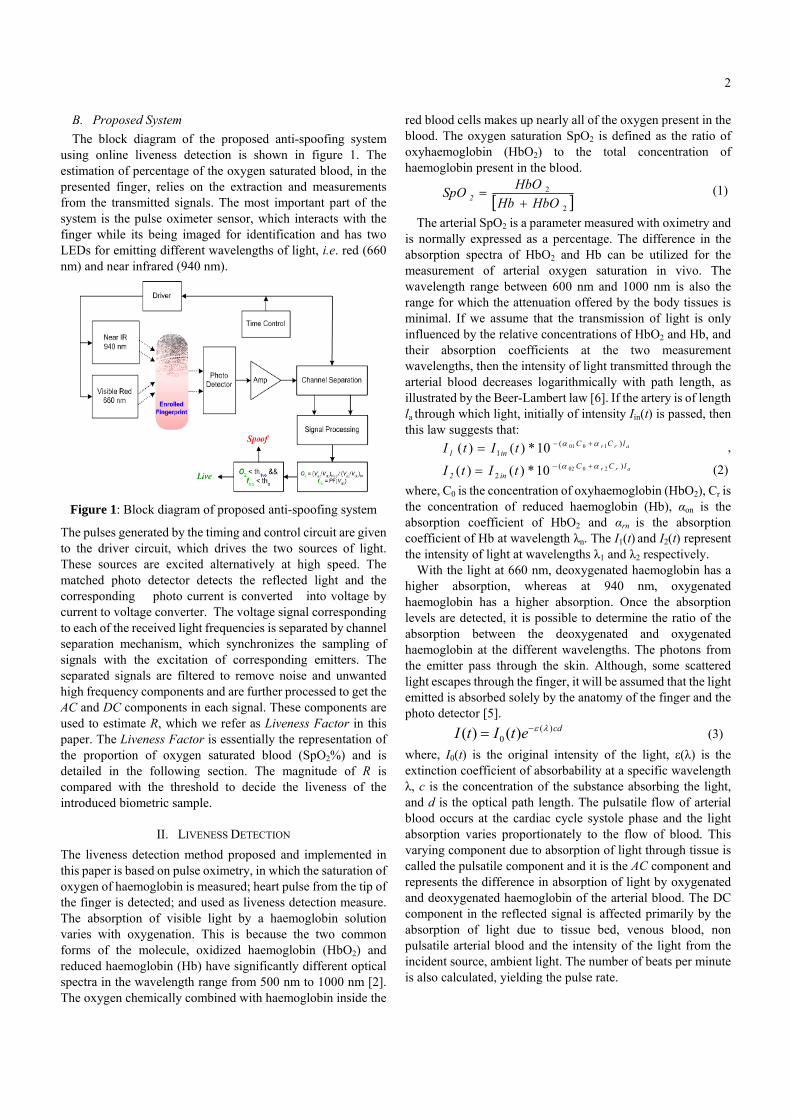
B. Proposed System The block diagram of the proposed anti-spoofing system
using online liveness detection is shown in figure 1. The estimation of percentage of the oxygen saturated blood, in the presented finger, relies on the extraction and measurements from the transmitted signals. The most important part of the system is the pulse oximeter sensor, which interacts with the finger while its being imaged for identification and has two LEDs for emitting different wavelengths of light, i.e. red (660 nm) and near infrared (940 nm).
Figure 1: Block diagram of proposed anti-spoofing system
The pulses generated by the timing and control circuit are given to the driver circuit, which drives the two sources of light. These sources are excited alternatively at high speed. The matched photo detector detects the reflected light and the corresponding photo current is converted into voltage by current to voltage converter. The voltage signal corresponding to each of the received light frequencies is separated by channel separation mechanism, which synchronizes the sampling of signals with the excitation of corresponding emitters. The separated signals are filtered to remove noise and unwanted high frequency components and are further processed to get the AC and DC components in each signal. These components are used to estimate R, which we refer as Liveness Factor in this paper. The Liveness Factor is essentially the representation of the proportion of oxygen saturated blood (SpO2%) and is detailed in the following section. The magnitude of R is compared with the threshold to decide the liveness of the introduced biometric sample.
II. LIVENESS DETECTION The liveness detection method proposed and implemented in this paper is based on pulse oximetry, in which the saturation of oxygen of haemoglobin is measured; heart pulse from the tip of the finger is detected; and used as liveness detection measure. The absorption of visible light by a haemoglobin solution varies with oxygenation. This is because the two common forms of the molecule, oxidized haemoglobin (HbO2) and reduced haemoglobin (Hb) have significantly different optical spectra in the wavelength range from 500 nm to 1000 nm [2]. The oxygen chemically combined with haemoglobin inside the
red blood cells makes up nearly all of the oxygen present in the blood. The oxygen saturation SpO2 is defined as the ratio of oxyhaemoglobin (HbO2) to the total concentration of haemoglobin present in the blood.
[ ]2
2
HbOHbHbOSpO 2 +
= (1)
The arterial SpO2 is a parameter measured with oximetry and is normally expressed as a percentage. The difference in the absorption spectra of HbO2 and Hb can be utilized for the measurement of arterial oxygen saturation in vivo. The wavelength range between 600 nm and 1000 nm is also the range for which the attenuation offered by the body tissues is minimal. If we assume that the transmission of light is only influenced by the relative concentrations of HbO2 and Hb, and their absorption coefficients at the two measurement wavelengths, then the intensity of light transmitted through the arterial blood decreases logarithmically with path length, as illustrated by the Beer-Lambert law [6]. If the artery is of length la through which light, initially of intensity Iin(t) is passed, then this law suggests that:
arr lCCin1 tIt I )(
1100110*)()( αα +−= ,
arr lCCin2 tI tI )(
2200210*)()( αα +−= (2)
where, C0 is the concentration of oxyhaemoglobin (HbO2), Cr is the concentration of reduced haemoglobin (Hb), αon is the absorption coefficient of HbO2 and αrn is the absorption coefficient of Hb at wavelength λn. The I1(t) and I2(t) represent the intensity of light at wavelengths λ1 and λ2 respectively.
With the light at 660 nm, deoxygenated haemoglobin has a higher absorption, whereas at 940 nm, oxygenated haemoglobin has a higher absorption. Once the absorption levels are detected, it is possible to determine the ratio of the absorption between the deoxygenated and oxygenated haemoglobin at the different wavelengths. The photons from the emitter pass through the skin. Although, some scattered light escapes through the finger, it will be assumed that the light emitted is absorbed solely by the anatomy of the finger and the photo detector [5].
cdetItI )(0 )()( λε−= (3)
where, I0(t) is the original intensity of the light, ε(λ) is the extinction coefficient of absorbability at a specific wavelength λ, c is the concentration of the substance absorbing the light, and d is the optical path length. The pulsatile flow of arterial blood occurs at the cardiac cycle systole phase and the light absorption varies proportionately to the flow of blood. This varying component due to absorption of light through tissue is called the pulsatile component and it is the AC component and represents the difference in absorption of light by oxygenated and deoxygenated haemoglobin of the arterial blood. The DC component in the reflected signal is affected primarily by the absorption of light due to tissue bed, venous blood, non pulsatile arterial blood and the intensity of the light from the incident source, ambient light. The number of beats per minute is also calculated, yielding the pulse rate.

3
Figure 2: Microcontroller integration with serial and sensor interface
III. DESIGN AND IMPLEMENTATION The initial design of the proposed prototype device for liveness detection employed analog approach. However, with analog components the response of the device was very sluggish, due to the slow charging of the capacitors at the low pass filter stages, and the complexity of the device was high to extract a low amplitude biomedical signal in the presence of noise. In order to account the phase shift between the red and infra-red signals peak detectors were employed. This resulted in slow response time of the system as the capacitors charged to their peak value had to comeback to a lower voltage level. In order to speed up the response and to facilitate the integration with a fingerprint sensor, the final implementation (figure 2) was initiated using a microcontroller that had most of the instructions implemented as single cycle instructions.
Several fingerprint devices are standalone USB devices so the microcontroller (MCU) with this type of interface was preferred for easy integration. The AVR microcontroller AT90USB1287 [10] was found suitable for implementation as it is having an USB and RS232 interface, along with sufficient programmable Flash memory (128K) and on-chip EEPROM (8K) for complete data acquisition and processing. An on-chip bootloader permits very quick firmware download from a PC, without using a parallel programmer or dedicated hardware. In
System Programming (ISP) of the chip entails to update the software using simple two wire serial interface to connect to a PC, without the need to remove the controller or use some dedicated programming hardware.
A. Signal Acquisition We implemented the entire steps of signal processing for the
acquired signals in digital domain to effectively and quickly filter the associated noise. The fast Pulse Width Modulation (PWM) mode of AT90USB1287 [10] provides a high frequency PWM waveform generation option. The PWM channel 1 with the Timer1 is programmed by loading the Output Compare Registers (OCR1A and OCR1B) to generate a PWM pulses with ON time of 500 µs and OFF time of 7500 µs, the clock count is started with the time period of 7500 µs. Emitter of the sensor gets the excitation signal from the PWM output at I/O port pins PB6 and PB4 of AT90USB1287 (figure
2). In order to increase the intensity of light that the emitter of the pulse oximeter sensor can emit, an increased mount of current is passed through the sensor for a short duration of time (ON time) with the help of driving transistor. The timer pulses (figure 3) are given to the base of the driving transistor through a series capacitor, which acts as a high pass filter, to protect the sensor emitter from being spoilt by controller hang-up.
VCC1
VCC1
VCC1
VCC1VCC1
VCC1
VCC1
PWM IRPWM RED
To ADCPB1PB3
UGnd
PB2RESET
RST
RST
TxD
RxD
RxD
TxD
135
246
PD0SCKRESET
VCCPDIGnd
SHIE
LD
1-V_BUS
2-D-
3-D+
4-ID
5-GND6
MAX232
13
811
10
1
3
4
5
2
6
12
9 14
7
1615
R1IN
R2INT1IN
T2IN
C+
C1-
C2+
C2-
V+
V-
R1OUT
R2OUT T1OUT
T2OUT
VC
CG
ND
1 2
123456789
10111213141516
17 18 19 20 21 22 23 24 25 26 27 28 29 30 31 32
48474645444342414039383736353433
64 63 62 61 60 59 58 57 56 55 54 53 52 51 50 49
PE6PE7UVccD-D+UGndUCapVBusPE3 PB0PB1PB2PB3PB4PB5PB6
PB7
PE4
PE5
RE
SET
VCC
GN
DXT
AL2
XTA
L1PD
0PD
1PD
2PD
3PD
4PD
5PD
6PD
7
PA3PA4PA5PA6PA7PE2PC7PC6PC5PC4PC3PC2PC1PC0PE1PE0
AV
CC
AR
EFAG
ND
PF0(
ADC
0)PF
1(AD
C1)
PF2
PF3
PF4
PF5
PF6
PF7
GN
DV
CC
PA0
PA1
PA2
JP3ADC port
1 2 3 4 5 6 7 8 9 10 1211
594837261
Serial ISPInterface Push Sw itch
For BootLoader
AT90USB1287
USB Interface
To AnalogInterfaceand PulseOximeterSensor
ControllerReset
RS232Interface

4
VCC
VCC
To ADC
PWM RED
PWM IR
32
1
+
-
5
67
REDLED1
COMAnode1
PulseOximeterSensor
123456
123456
+
-
3
21
411
12
IR LED132
1
Figure 3: Implementation of PWM and signal acquisition
The matched photo detector detects the light in the range 300-1100 nm and it has its peak response at 660 nm and 940 nm. The signal from the matched photo detector corresponding to red (660 nm) wavelength light has to be separated from the infra-red (940 nm) wavelength light without interference. This is achieved by synchronization between the emitter excitation and the acquiring of received signal at the output of photo detector. The time duration between the 660 nm pulse and the 940 nm excitation pulse is 500 µs with 660 nm pulse followed by 940 nm. The photo current is converted into voltage by a current to voltage converter. This voltage signal comprises of high frequency components, i.e., signals due to noise induced by ambient light. The high frequency noise is removed by low pass filtering with a cutoff frequency of 1.59 kHz. The signal after low pass filtering is given to one of the ADC channels with a buffer in between to decrease the effects of loading the output signal by ADC of the controller. The on-chip ADC is a successive approximation analog to digital converter, with a reference voltage of 2.56 V and a conversion time of 70 µs.
B. Finger Presence Detection The detected signal from the photo detector is measured after
every 8 m sec and the sampled ADC value is compared with the fixed threshold value of 0x1FF (1.28V). If the signal acquired is below the threshold voltage level, the finger is present and the status is marked as PRESENT, the periodic sampling of signal by ADC starts and at the same time fingerprint sensor is enabled.
C. Synchronization of Red and IR Signal Acquisition The Red and IR signals are acquired by the controller at the
ADC channels by starting conversion only at the occurrences of the corresponding PWM pulse. This ensures that the detector detects the transmitted light from the fingerprint sample only at the Red and IR excitation pulses at the emitter, and is in synchronization with the transmitted signal. This makes it almost impossible for the attacker to pulse and synchronize a pair of infra-red and red LEDs underneath the gummy fingerprint and successfully spoof the system.
D. Ambient Light Removal The detector output sample is taken just before every PWM
pulse (red and IR) and digital signal level is subtracted from the very next digital values of the analog signal measurements taken at pulse intervals when the emitter is excited.
E. D/A conversion using PWM The TIMER0 of the microcontroller is configured to change
the time interval of the generated PWM pulses, which corresponds to the analog values read at the ADC input. When this PWM pulse output is passed through low pass filter we get the analog equivalent of the original signal being acquired.
F. Filtering The filtering is required to eliminate high frequency noisy
components and extract low frequency signal of our interest. In our implementation, a low pass digital filter which makes the averaging of 10 neighborhood samples was employed.
∑=
−=9
0)()()(
kknhkxnz (4)
where z(n) is the filtered sequence, x(k) is the input sequence, and h(n) is the impulse response of the low pass filter. The samples from the acquired signal are also reproduced in figure 7. The convolution of the red and infrared sample sequence, with the filter sequence, generates corresponding moving average filtered sequences in which the high frequency noisy components are attenuated.
IV. LIVENESS ESTIMATION AND INTEGRATION
A. AC-DC components Extraction The measurements on the detected and processed signals are
used to ascertain the percentage of oxygen saturated blood. The magnitude of AC and DC component measurement in the filtered samples, for red (660 nm) and infrared (940 nm), requires measuring the minimum and maximum values of the corresponding sample sequences. The difference of minimum and maximum is calculated and this is the peak to peak amplitude of each sequence. The average of the minimum values of the samples in each case is calculated for both the sequences which represent the absorption of light due to tissue, fat and non pulsatile part of the haemoglobin.
The peak-to-peak amplitudes (Vpp) correspond to the AC component of the signals and some part of the DC components. These are calculated as follows:
π/ppmindc VVV += and 2/ppac VV = (5)
where, Vac and Vdc represent the measured AC and DC components of the samples.
B. Calculation of R The estimation of the oxygen saturated blood, i.e. SpO2%,
uses classical approach under assumption of a homogenous Beer-Lambert transmission model cited in section II. The two equations in (2) are solved to compute SpO2 [29]:

5
)()()()(1
1
21
212
λελελελε
dd
oo
kRkRSpO
−−
−= (6)
where, )( 1λε o and )( 2λε o are the extinction coefficient of
absorbability for oxygenated hemoglobin at wavelengths λ1 and λ2 respectively, while )( 1λε d
and )( 2λε d are the corresponding extinction coefficients for the deoxygenated hemoglobin. Note that even though equation (6) is the required solution for SpO2, both k and R are functions of unknown optical properties of the tissue. The quantity R is the ratio of the logarithmic derivatives of the received intensities, or equivalently the ratio of the normalized derivatives;
)()()()(
)(ln)(ln
21
12
2
1
tItItItI
tItIR
∆∆
=∆∆
= (7)
In order to determine the Liveness Factor R, from the pulsatile light intensities to non-pulsatile light intensities, the constant DC component of the light intensity must be factored out. The amplitudes of both the AC and DC components are dependent on the incident light intensity. Dividing the AC level by the DC level gives a ‘corrected’ AC level that is no longer a function of the incident light intensity. The ratio of the AC and DC components for the red (660nm) and infra-red (940nm) is measured with the following equation.
( )( )
( )( )irDCAC
rDCAC
VVVV
DCACDCACR
//
//
940940
660660 == (8)
VAC and VDC are the correspondingly AC and DC components for red (660 nm) and infra-red (940 nm) samples. In a nonturbid medium, k = 1, which is the reasonable approximation employed in pulse oximetry [29]. Thus the Liveness Factor R itself represents the saturated oxygen (SpO2%) in haemoglobin. An empirically derived calibration curve [1] for the relationship between R and SpO2% provides the pulse oximetry oxygen saturation level SpO2%. This calibration curve is employed to build a lookup table (LUT) illustrated in table 1. The SpO2% values for R > 2.8 (corresponding to SpO2% < 30%) are considered non-live and are forced to zero. If the oxygen saturation level SpO2% is above 30% the introduced biometric is designated as live otherwise it’s treated as non-live.
C. Liveness Integration by Negotiation The decision on liveness of the introduced sample by the
liveness detection device (host controller) determines whether the negotiation has to be done or not. If the host controller decision is live then the fingerprint identification decision is activated and for non-live decision the integration of the fingerprint decisions from simultaneously captured fingerprint images is suspended. In the process of integration of the fingerprint sensor the host controller communicates with the
fingerprint device through full-duplex serial communication protocol and performs the operation specified by command byte value in the command field of the packet sent by host controller. The flow chart shown in figure 4 summarizes the operation and the implementation of our approach.
D. Communication with Fingerprint Device The fingerprint sensor is powered up by the power source of 5V which comes either from the USB bus power or external power supply. One of the RS232 channel is connected to the serial interface of the host controller (liveness detection device). The RS-232C communication setup is with a baud rate 9600 bps (1 start-bit, 8 data-bits, 1 stop-bit and no parity bit). The embedded fingerprint device employed to generate fingerprint matching decision uses ARM7 processor. Figure 5 shows snapshot of the liveness detection device developed for our investigation. The fingerprint device performs an action given by the command in the command field of the packet sent by the host controller. Each acknowledgement packet is compared with the predefined packets to determine the response from the finger print sensor. If the host controller gets the Identification Success, or Failure, or Capture Timed out from the fingerprint device then it determines whether the user is to be accepted or rejected.
Figure 4: Operation of automated liveness detection and its integration with fingerprint device
Table 1: Look up Table for R and SpO2% R 0.4 0.6 0.8 1.0 1.2 1.4 1.6 1.8
SpO2% 100 96 90 85 80 75 68 62R 2.0 2.2 2.4 2.6 2.8 3.0 3.2 3.4
SpO2% 56 50 43 37 31 24 16 8

6
Figure 5: Development of interfacing board
V. EXPERIMENTS AND RESULTS The implementation of the proposed liveness detection module was carried out as detailed in section III and IV. This device was integrated with an embedded fingerprint matcher as discussed in previous section. The rigorous testing results from the implemented system have illustrated the success of the device in detecting spoof attempts. Some of the experimental results and observations from the developed system are reproduced.
In order to ascertain the performance of the developed liveness detection module, we investigated its performance on spoof attacks using artificial fingers. The spoof fingers are made using M-seal to firstly construct the fingerprint molds. Then the artificial fingerprint is obtained from these molds using the gelatin powder (using equipments from Bio Research Organic Laboratory, at IIT Delhi, for conditioning the surface). In addition to the preparation of just thin layers reproducing the fingerprints, we also made whole 3D fake fingers. These gummy fingers were made with Play-doh as in shown in figure 6.
Figure 6: Mold, Play-doh artificial finger and artificial fingerprint.
The acquired signal samples for an interval of 1.6 seconds for the live and non-live fingerprint samples are shown in the figure 7. These samples are having superimposed noise which causes small variation in the envelope of the signal and was taken care by applying sliding window averaging filter with 10 samples to smooth the acquired signal. Figure 7 also shows the
corresponding filtered signals which generate reliable measure of the AC and DC components. In the case of a live sample, the presence of heart pulse along with the change in amplitude with the IR and Red signals results in variation of the signal. But in the case of non-live fingers the pulsating nature of the signal is absent and the variation in the samples is very small. The AC values for the non-live case are not varying even with slight change in the position of its placement.
Table 2 shows the Red and IR signal measurements along with their corresponding R and SpO2% values from the seven artificial fingers that simulate the spoof attacks. In order to ascertain the variation in signal measurements from the real live fingers, we gathered data from 18 volunteers (males and females between 17 to 58 years of age) using the developed device. The experimental results in table 3 suggest the regular variation in the AC and DC components among different persons from the live fingerprints. However, the relative change between IR and Red is quite small among different live fingerprints and therefore a threshold of 30% is judicious.
The Liveness Factor R calculated using equation (8) from the Non-live samples is very high, i.e. more than 6, and it doesn’t come within the range of R values measured from the live samples. The AC and DC component measured from the live samples are highly separated from the corresponding measurements using non-live samples, especially with IR light as it is color independent and varies very little. This is despite the fact that the reflected light from red light is color dependent on the sample and changes the factor R calculated by equation (8). The estimated R, as expected, is in the non-live range from the spoof fingerprint samples and well separated (far below) from the threshold, which is empirically selected as 2.8 for R values. The corresponding SpO2% for the decision threshold is 30% as shown in figure 8.
Figure 7: Unfiltered and filtered samples from red and infra-red signal using live and non-live samples

7
Figure 8: Live Vs Non-live estimation of SpO2% values in an
interval of 22 seconds
VI. DISCUSSION The selection of threshold for the estimated SpO2% is quite critical for the success of this approach. The SpO2% threshold can significantly vary in the live persons with their individual medical conditions; e.g. carboxyhemoglobin, anemia, hypovolemia/hypotension, hypothermia, etc [33]. Furthermore the SpO2% for the individuals can drastically change (up to 15%) if more than one of the above conditions hold simultaneously. In general, the theoretical value of SpO2% for a conscious person can go up to 70%. In addition, the operating environmental conditions also have a profound effect on the measured SpO2 values. The accurate measurement of the ambient light and its complete removal from the received signal is extremely difficult. The system could be kept in a completely dark room with no ambient light or be installed outdoor under the sun, where the contribution of the ambient light is quite substantial. Under these varied
Table 2: The AC and DC components, R value and SpO2% for Non-Live
S. No. Red AC
value
Red DC
Value
IR AC Value
IR DC Value
Red Minimum AC Value
Red Minimum DC Value
IR Minimum AC Value
IR Minimum DC Value
Ratio R SpO2%
1 7 51 6 446 5 50 6 440 10.2026 0 2 8 75 5 755 3 75 5 753 16.1067 0 3 35 317 1 1012 34 317 3 1011 111.7350 0 4 3 10 6 823 3 9 5 820 41.1530 0 5 18 145 7 979 17 141 5 972 17.3616 0 6 19 143 5 233 17 143 5 232 6.1916 0 7 24 187 4 695 10 183 4 687 22.2995 0
Average 16.286 132.571 4.857 706.143 12.714 131.143 4.714 702.143 32.1500 0
Table 3: The AC and DC components, R value and SpO2% obtained for Live
S. No. Red AC
value
Red DC
Value
IR AC Value
IR DC Value
Red Minimum AC Value
Red Minimum DC Value
IR Minimum AC Value
IR Minimum DC Value
Ratio R SpO2%
1 19 128 52 363 15 122 45 352 1.036208 85 2 43 285 70 367 40 278 66 350 0.791028 90 3 26 251 90 566 25 200 78 310 0.651439 90 4 25 170 60 476 22 165 51 454 1.166667 85 5 32 244 40 457 23 237 33 457 1.498361 80 6 26 176 47 305 22 151 45 276 0.958656 90 7 19 98 33 194 17 96 33 190 1.139765 85 8 18 113 51 382 17 110 40 390 1.193129 85 9 24 136 41 269 22 130 28 248 1.157819 85
10 47 359 84 664 45 333 80 568 1.034885 85 11 44 248 95 485 28 196 44 325 0.905772 90 12 26 191 95 619 20 153 42 402 0.886966 90 13 36 284 65 587 30 276 64 545 1.144745 85 14 22 166 70 449 21 164 67 465 0.850086 90 15 27 315 42 424 20 327 38 442 0.865306 90 16 21 115 41 351 16 113 30 298 1.563309 75 17 29 143 54 216 17 134 37 219 0.811189 90 18 24 134 34 264 18 107 30 194 1.390694 80
Average 28.222 197.556 59.111 413.222 23.222 182.889 47.278 360.278 1.05811 86.111
8
operating conditions, the 100% linearity and high accuracy of the sensors cannot be assumed. Secondly, the movement/placement of the finger during the sampling process and varying magnitude of pressure applied while enrolling the sample induces inaccuracy in the reflected signal and the corresponding SpO2 value. Under strictly controlled environments this effect may be reduced, but it is not prudent to make such assumptions in general for practical purposes. Thirdly, the skin pigmentation and body fat also introduce errors in the SpO2 values measured due to varied absorption coefficients [31]. Due to the physical constraints beyond our control, our system cannot be used on the finger tips or ear lobes where the readings are relatively more accurate. In summary, a high value of SpO2% threshold cannot account for significantly varying individual medical conditions and environmental conditions. Therefore the high value of the threshold will increase the false rejection rate (FRR) of this antispoofing system. On the other hand, if the SpO2% threshold is kept low, the spoof attempts have more chances of acceptance and thereby increasing the false acceptance rate (FAR) of this system.
The liveness detection from fingerprints can also be ensured by acquiring the pulse, from the tip of fingers, which are generated from the autonomic nervous system. However, the problem with this approach is that it requires users to hold his/her fingers up to four seconds. Also, the pulse can be transmitted from a live finger on which a thin spoofing material is worn. On the other hand, the approach employed in our work using the pulse oximetry is fast and generate results synchronously with all the processing done in parallel with the fingerprint identification module (in about 1.5 seconds). The spoof attacks from a very thin translucent fingerprint worn over a live finger generates low-quality fingerprint image from the employed optical sensor. Thus the rejection of such spoof attacks is also dependent on the quality-checker employed in the fingerprint identification module. Another kind of spoof attack that the liveness detection system may have to cope with involves attacker pulsing a pair of infrared and red LEDs underneath the spoof finger. However, in our system these external pulses cannot produce the variations in AC components introduced by the live tissue (pulse oximetry) through transmission. Assuming that even if this has been achieved by the attacker, the main problem would be the synchronization of these pulses with the excitation pulses of our system, which is not extremely difficult to achieve even if the attacker has the information about the frequency of the employed excitation pulses. There will always be a phase difference between the excitation and received signals, unless the attacker tampers the system and takes the excitation signal from our system to trigger his pulses. The excitation pulses of the LED indicators are generated by Pulse Width Modulation (PWM) and the ON/OFF time of the pulse is defined by two 16-bit registers respectively. Therefore, achieving correct synchronization with the excitation pulses is to find one point in a space of 216×216 points. The analog to digital converter of the micro-controller is a 10-bit ADC, to spoof the system by externally generating an AC component would be of the order of 210. Therefore, to successfully spoof the system the attacker has to find one point in a space of 216×216×210. Further, our
system takes 200 samples to calculate the SpO2 value, as can be seen in figure 7 in the paper. This makes it a problem to find out one point in a space of 216×216×212×200 = 1 in 8.796E+14, which is certainly extremely difficult. The spectrographic characteristics of the live human tissue can also be used to ensure liveness using multispectral analysis of the finger [28]. However, the optical properties of gelatin artificial fingerprints are quite similar to human skin [30] and therefore such approaches are still prone to spoof attacks.
VII. CONCLUSIONS A new anti-spoofing technique for fingerprint identification systems, using liveness detection has been proposed and implemented. This technique relies on the physiological behavior of the arterial blood volume and oxygen saturation level changes (principle of pulse oximetry). The oxygen saturation level of arterial blood (SpO2%) is measured and used to ascertain the liveness decision from the presented biometric sample. The proposed liveness detection design has been integrated with the fingerprint device to develop a standalone liveness integrated fingerprint sensor. The proposed design and its standalone implementation using AT90USB1287 microcontroller has been rigorously tested.
In order to make the device standalone, and to integrate with the fingerprint sensor, an interfacing programming microcontroller based board, as shown in figure 5, was developed. The integration of this device with the fingerprint device is achieved by serial communication with this device and the decision of the fingerprint identification is being delivered to the host controller (AT90USB1287). The experimental results presented in section V, from several live and variety of non-live spoof fingerprint samples, have illustrated very high separation in the corresponding values of liveness factor R. The observed wide separation in the percentage of SpO2 confirms the reliability of the proposed design to thwart spoof attacks on the fingerprint identification device. The developed device detects the liveness based on the SpO2% and decides to integrate the fingerprint identification decisions from the live samples and deactivates the sensor for non-live samples. This device also displays the fingerprint identification status.
A summary of prior work on fingerprint antispoofing techniques, presented in section I A, has suggested that there has not been any systematic study to illustrate the effectiveness of oxygenated blood measurements in detecting spoofed fingerprints. Although more work remains to be done, this paper has successfully illustrated the utility of proposed low-cost and fully automated design that can simultaneously work with any fingerprint based identification device. Conclusively, the developed prototype of the liveness detection module, which is based on the estimation of the saturated oxygen level in the haemoglobin, has significantly higher anti-spoofing reliability as compared with several image or illumination based approaches, e.g. [11]-[12], presented in the literature. Our efforts are currently focused to further miniaturize the developed liveness detection module. It is

9
generally believed that any countermeasures to thwart biometric spoof attacks can be circumvented. The success of method investigated in this paper depends on the effectiveness of the fingerprint image quality checker employed in the fingerprint identification module. The antispoofing approach developed in this paper is tailored/limited to the optical fingerprint sensors that generate the image using the reflection of light from the finger valleys. Another possible method to circumvent this method is to develop spoof finger that can pulse a pair of infrared and red LEDs with a brute force attack, involving combinations of varying frequency and phase information. Therefore future efforts should be directed towards the large scale comparative evaluation of the effectiveness of various liveness detection approaches for such state-of-art sensor level spoof attacks.
VIII. ACKNOWLEDGMENT This work is supported by the research grant from Department of Information Technology, Ministry of Information and Communication Technology, Government of India, grant no. 12(54)/2006-ESD.
REFERENCES [1] M. Drahansky, R. Notzel and W. Funk, “Liveness Detection based on Fine
Movements of the Fingertip Surface”, Proc. IEEE Workshop on Information Assurance United States Military Academy, West Point, pp. 42-47, NY, Jun. 2006.
[2] A. B. Borreto, L. M.Vicente and I. K. Persad, “Adaptive Cancellation of Motion Artifact in Photoplethysmyographic Blood Volume Pulse Measurements for Exercise Evaluation,” Proc. IEEE 17th Annual Conference on Engg. in Medicine and Biology Society, vol. 2, pp. 983-984, 1995.
[3] S. T. V. Parthasaradhi, R. Derakhshani, L. A. Hornak, and S. A. C. Schuckers, “Time-series detection of perspiration as a liveness test in fingerprint devices,” IEEE Trans. Systems Man, and Cybernetics, Part C, vol.35, pp. 335 - 343, Aug. 2005.
[4] N. K. Ratha, J. H. Connel, and R. M. Bolle, “Enhancing security and privacy in biometrics-based authentication systems,” IBM Syst. J., vol. 40, no. 3, pp. 614–634, 2001.
[5] T. Matsumoto, H. Matsumoto, K. Yamada, and S. Hoshino, “Impact of Artificial Gummy Fingers on Fingerprint System”, Proc. SPIE, vol. 4677, pp. 275-289, 2002.
[6] Y. Shimada, K. Nakashima, Y. Fujiwara, T. Komatsu, M. Kawanishi, J. Takezawa and S. Takatani, “Evaluation of a new reflectance pulse oximeter for clinical applications,”, J. of Med. & Biol. Eng & Comp., vol. 29, pp. 557-561, Sep. 1991.
[7] H. Shimazu, H. Ito, and K.Yamakoshi, “Noninvasive method for estimating the mean capillary pressure and pre- and post capillary resistance ratio in human fingers,”, Medical & Biological Engineering & Computing, vol. 24, pp. 585-590, 1986.
[8] T. Vander Putte and J. Keuning, “Biometrical fingerprint recognition: don't get your fingers burned”, Proc. 4th Working Conference of Smart Card Research and Advanced Applications, pp. 289-303, Kluwer Academic, Sep. 2000.
[9] Barbagelata, Melissa and H. Asada, “Wireless Fingernail Sensor for Continuous Long Term Health Monitoring”, MIT Home Automation and Healthcare Consortium Phase 3, Report 3-1, Oct. 1, 2000.
[10] http://www.atmel.com/dyn/resources/prod_documents/doc7593.pdf [11] K. Brownlee, Method and apparatus for distinguishing a human finger
from a reproduction of fingerprint, US Patent No. 6, 292, 571, Sep. 2001. [12] D. R. Setlak, Fingerprint sensor having spoof reduction features and
related methods, US Patent No. 5, 953, 441, Sep. 1999. [13] S.A.C. Schuckers, “Spoofing and Anti-spoofing measures,” Information
Security Technical Report, vol. 7, pp. 56-62, Dec. 2002.
[14] U. Uludag and A.K. Jain, “Attacks on biometric systems: a case study in fingerprints,” Proc. SPIE-EI 2004, Security, Steganography and Watermarking of Multimedia Contents VI, pp. 622-633, San Jose, CA, Jan. 18-22, 2004.
[15] D. Osten, H. M. Carin, M. R. Arneson, and B. L. Blan, “Biometric Personal Authentication System,” U. S. Patent # 571, 9950, Feb. 1998.
[16] P. D. Lapsley, J. A Less, D. F. Pare, and N Hoffman, “Anti-fraud biometric sensor that accurately detects blood flow”, US Patent # 5,737,439, April 7, 1998.
[17] P. Kallo, I. Kiss, A. Podmaniczky, and J. Talosi, “Detector for recognizing the liveness character of a finger in fingerprint recognizing apparatus,” U. S. Patent # 6,175,641, Jan. 2001.
[18] V. Valencia and H. Horn, “Biometrics liveness testing,” in Biometrics, J. D. Woodward, N. M. Orlans, and R. T. Higgins, Eds., New York: Osborne, McGraw Hill.
[19] M. Drahanskỳ, R. Nötzel, and W. Funk, “Liveness detection based on fine movements of the fingerprint surface,” Proc. 2006 IEEE workshop on Information Assurance, United States Military Academy, New York, pp. 42-47, 2006.
[20] J. Kent, Malaysia car thieves steal finger, BBC News, Kuala Lumpur, http://news.bbc.co.uk/2/hi/asia-pacific/4396831.stm
[21] A. Antonelli, R. Capelli, D. Maio, and D. Maltoni, “Fake finger detection by skin distortion analysis,” IEEE Trans. Info. Forensics & Security, vol. 1, pp. 360-373, Sep. 2006.
[22] Y. S. Moon, J. S. Chen, K. C. Chan, K. So, and K. C. Woo, “Wavelet based liveness detection,” Electronics Letters, vol. 41, pp. 1112-1113, Sep. 2005.
[23] A. Adler, “Sample images can be independently restored from the face recognition templates,” Proc. Canadian Conf. Electrical Computer Engg. (CCECE), Montréal, Canada, pp. 1163-1166, May 2003.
[24] B. Toth, “Biometric liveness detection,” Information Security Bulletin, vol. 10, pp. 291-297, Oct. 2005.
[25] A. Abhyankar and S. Schuckers, “Fingerprint liveness detection using local ridge frequencies and multi resolution texture analysis techniques,” Proc. ICIP 2006, pp. 321-324, Oct. 2006.
[26] S. A. Wilber, “Blood constituent measuring device and methods,” U. S. Patent # 4,407,290, Apr. 1983.
[27] R. T. Stone and D. A. Briggs, “Method and apparatus for calculating oxygen saturation based plethysmographs including transients,” U. S. Patent # 5,078,136, Jul. 1992.
[28] K. A. Nixon, R. K. Rowe, J. Allen, S. Corcoran, L. Fang, D. Gabel, D. Gonzales, R. Harbour, S. Love, R. McCaskill, B. Ostrom, D. Sidlauskas, and K. Unruh, “Novel spectroscopy-based technology for biometric and liveness verification,” Proc. SPIE , vol. 5404-27, pp. 287-295, Aug. 2004.
[29] G. Zonios, U. Shankar, and V. K. Iyer, “Pulse oximetry theory and calibration for low saturations,” IEEE Trans. Biomedical Engineering, vol. 51, pp. 818-822, May 2004.
[30] D. Maltoni, D. Maio, A. K. Jain, and S. Prabhakar, Handbook of Fingerprint Recognition, Springer Verlag, 2003.
[31] P. E. Philip, J. R. Feiner, and J. W. Severinghaus, “Effects of skin pigmentation on pulse oximeter accuracy at low saturation,” Anesthesiology, vol. 102, no. 4, pp. 715-719, 2005
[32] N. K. Ratha, J. H. Connell, and R. M. Bolle, “Enhancing security and privacy in biometrics-based authentication systems,” IBM Systems Journal, vol. 40, no. 3, pp. 614-634, 2001.
[33] J. W. Severinghaus and S. O. Koh, “Effect of anemia on pulse oximeter accuracy at low saturation,” J. Clinical Monitoring & Computing, vol. 6, no. 2, April 1990.