a new algorithm for minutiae extraction and matching in...
TRANSCRIPT

i
A New Algorithm for Minutiae Extraction and
Matching in Fingerprint
by
Azad Noor
Dissertation submitted to the
School of Engineering and Design
at Brunel University, UK
in partial fulfilment of the requirements
for the degree of
Doctor of Philosophy
in
Electronic & Computer Engineering
Uxbridge, London
July 2012
ii
Abstract
A novel algorithm for fingerprint template formation and matching in automatic fingerprint
recognition has been developed.
At present, fingerprint is being considered as the dominant biometric trait among all other
biometrics due to its wide range of applications in security and access control. Most of the
commercially established systems use singularity point (SP) or ‘core’ point for fingerprint
indexing and template formation. The efficiency of these systems heavily relies on the
detection of the core and the quality of the image itself. The number of multiple SPs or
absence of ‘core’ on the image can cause some anomalies in the formation of the template
and may result in high False Acceptance Rate (FAR) or False Rejection Rate (FRR). Also
the loss of actual minutiae or appearance of new or spurious minutiae in the scanned image
can contribute to the error in the matching process. A more sophisticated algorithm is
therefore necessary in the formation and matching of templates in order to achieve low FAR
and FRR and to make the identification more accurate.
The novel algorithm presented here does not rely on any ‘core’ or SP thus makes the structure
invariant with respect to global rotation and translation. Moreover, it does not need
orientation of the minutiae points on which most of the established algorithm are based. The
matching methodology is based on the local features of each minutiae point such as distances
to its nearest neighbours and their internal angle.
Using a publicly available fingerprint database, the algorithm has been evaluated and
compared with other benchmark algorithms. It has been found that the algorithm has
performed better compared to others and has been able to achieve an error equal rate of 3.5%.

iii
Acknowledgements
First of all, I would like to thank my supervisor Professor Wamadeva Balachandran for his
enormous support, invaluable advice and positive encouragement throughout the course of
my research. I am grateful to Dr Nadarajan Manivanan for his kind assistance, advice and
friendly support during my hard work. Also, I would like to thank everyone in the Centre for
Electronic Systems Research lab for keeping the lab lively and making my time enjoyable.
Finally, a special thanks to my wife Nafiza for inspiring me all the time and being with me
with her love.

iv
Table of contents
Abstract......................................................................................................................... ii
Acknowledgement........................................................................................................iii
List of acronyms...........................................................................................................xi
1 Introduction.................................................................................................................1
1.1 Benefits of biometrics........................................................................................1
1.2 Advantages of fingerprint biometrics................................................................7
1.3 Challenges in automatic fingerprint recognition...............................................9
1.3.1 Inconsistent contact..............................................................................9
1.3.2 Non-uniform contact............................................................................9
1.3.3 Irreproducible contact.........................................................................10
1.3.4 Small overlapping area and nonlinear distortion................................10
1.3.5 Latent fingerprint................................................................................10
1.3.6 Altered/Fake fingerprints....................................................................11
1.3.7 Interoperability....................................................................................11
1.3.8 Feature extraction artefacts.................................................................12
1.4 Security issues.................................................................................................12
1.5 Research aims and objectives..........................................................................13
1.6 Contributions to knowledge............................................................................14
1.7 Thesis outline...................................................................................................17

v
2 Fingerprint biometrics............................................................................................18
2.1 Introduction.....................................................................................................18
2.2 Fingerprint template formation and matching.................................................25
2.3 Image enhancement.........................................................................................25
2.3.1 Methodology........................................................................................29
2.3.2 Normalisation.......................................................................................29
2.3.3 Identification of ridge like regions.......................................................31
2.3.4 Orientation estimation..........................................................................32
2.3.5 Ridge frequency estimation.................................................................35
2.3.6 Gabor filtering......................................................................................37
2.3.7 Binarisation..........................................................................................42
2.3.8 Thinning...............................................................................................42
2.4 Minutiae extraction........................................................................................43
2.5 Removal of false minutiae.............................................................................45
2.6 Fingerprint matching......................................................................................47
2.7 Minutiae based fingerprint matching.............................................................53
2.7.1 Introduction..........................................................................................53
2.7.2 Problem formulation.............................................................................54
2.7.3 Similarity score.....................................................................................60
2.7.4 Point pattern matching..........................................................................61
2.8 Minutiae based template formation...............................................................64
2.9 Summary........................................................................................................67

vi
3 Novel Structure for Template Formation and Matching………….......................68
3.1 Introduction……………………………………………………………..….68
3.2 Tolerance areas……………………………………………………………...71
3.3 Matching score………………………………………………………...……72
3.4 Matching of the feature vectors…………………………………………….74
3.5 Research methodology...................................................................................75
3.6 Evaluation of the novel algorithm……………………..................................76
3.7 Minutiae extraction process…………………………………………...........77
3.8 Performance evaluation…………………………………………………….80
3.9 Performance evaluation of TIAAFR across images from different sensors.83
3.10 Summary………………………………………………………………......88
4 Conclusion and recommendation for future work……………………….............90
4.1 Conclusion.....................................................................................................90
4.2 Recommendation for future work.................................................................92
References...................................................................................................................94
Appendix A
List of publications...................................................................................................101

vii
List of figures
Figure 1.1: Different Biometric features that can be used to generate uniqueness……….. .5
Figure 1.2: Global Biometric Market Projections by Technology, 2005-2012 (BCC
Research)………………………………………………………………………................... .8
Figure 2.1: A typical fingerprint with its features…………………..……………………..18
Figure 2.2: Fingerprints of five major classes……………………………………..............19
Figure 2.3: Ridge ending and bifurcation on a fingerprint………………………………...20
Figure 2.4: Minutiae matching at level2…………………………………………………...21
Figure 2.5: A typical fingerprint identification/verification process……………………....22
Figure 2.6: Singular regions (white boxes) and core points (small circles) in fingerprint
images………………………………………………………………………………………24
Figure 2.7: An example of normalisation with zero (0) mean and unit (1) standard deviation.
Images before (a) and after (b) normalisation……………………………………………...31
Figure 2.8: Identifying ridge like region with reliability factor of 0.5 in a typical
fingerprint…………………… ….…………………………………………………………32
Figure 2.9: Orientation of a ridge pixel………………. …………………………………..33
Figure 2.10: Block wise orientation estimation on a typical fingerprint……………….. ..35
Figure 2.11: The projection of the intensity values of the pixels along a direction orthogonal
to the local ridge orientation. (a) A block from a fingerprint image. (b) The
projected waveform of the block…………………………………………………. 36
Figure 2.12: An even-symmetric Gabor filter in the spatial domain…………………… 38
Figure 2.13: Results of applying a Gabor filter with kx = 0:5 and ky = 0:5 to a good quality,
medium quality and poor quality fingerprint image……………………………….. …...…41
Figure 2.14: (a) A fingerprint gray-scale image; (b) the image obtained after binarisation of
the image in (a); (c) skeleton image obtained after a thinning of the image…….. ……..42

viii
Figure 2.15: Examples of a ridge ending and bifurcation pixel. (a) A Crossing Number of one
corresponds to a ridge ending pixel. (b) A Crossing Number of three corresponds to a
bifurcation pixel………… ………………………………………………………………. .44
Figure 2.16: Ridge ending and ridge bifurcation on a skeleton image…….. ..……………45
Figure 2.17: Examples of typical false minutiae structures…………………….. ………...45
Figure 2.18 Removal of spurious minutiae…………………………………………..... …46
Figure 2.19: Falsely matched fingerprints……………………………………...... ……….50
Figure 2.20: Falsely accepted fingerprints. …………………...………….............. ……...51
Figure 2.21: Mapping of corresponding minutiae………………………… ……………...58
Figure 2.22: Pairing of corresponding minutiae for matching…………….. ……………..59
Figure 3.1: Schematic of feature formation of minutiae………………….. …………...69
Figure 3.2: Feature vector construction suggested by Jea and Govindaraju. . …………….70
Figure 3.3: Dynamic tolerance areas around a minutia for a novel architecture. The gray areas
around the two nearest neighbours set the threshold……………………............................ 71
Figure 3.4: Matching algorithm of two feature vectors in the novel architecture…….. ….74
Figure 3.5: Some images from FVC 2006 (DB2). Each row corresponds to the impressions
from same finger………………. ………………………………………………………….77
Figure 3.6: Stages of extracting minutiae at Level2………………… …………………..78
Figure 3.7: Varying number of minutia in different impression from the same finger… ...79
Figure 3.8: Normal distribution of extracted minutiae in finger images from FVC
200(DB2)…………… ……………………………………………………………………80
Figure 3.9: Matlab function to calculate FAR and FRR…………………………………..81
Figure 3.10: Performance of TIAAFR................................................................................. 82
Figure 3.11: Comparison of images scanned by different sensors with their
processed versions and extracted minutiae………………………………………………...84

ix
Figure 3.12: Comparison of matching performance of TIAAFR across images
scanned by different sensors………………………………………………………………85
Figure 3.13: Difference in image quality and the number of extracted minutiae
on images from the same finger scanned by capacitive, optical and thermal sensors…….86
Figure 3.14: Performance of TIAFFR in sensor interoperability
(capacitive, optical and thermal)…………………………………………………………..87
x
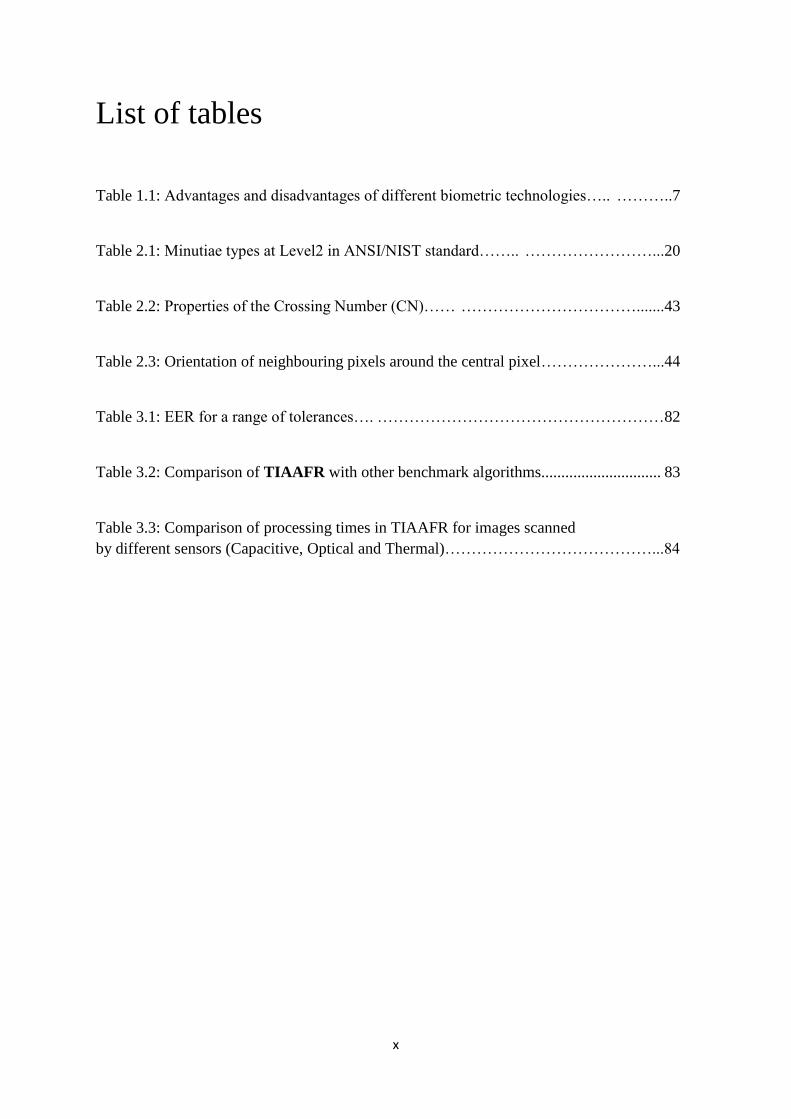
List of tables
Table 1.1: Advantages and disadvantages of different biometric technologies….. ………..7
Table 2.1: Minutiae types at Level2 in ANSI/NIST standard…….. ……………………...20
Table 2.2: Properties of the Crossing Number (CN)…… …………………………….......43
Table 2.3: Orientation of neighbouring pixels around the central pixel…………………...44
Table 3.1: EER for a range of tolerances…. ………………………………………………82
Table 3.2: Comparison of TIAAFR with other benchmark algorithms.............................. 83
Table 3.3: Comparison of processing times in TIAAFR for images scanned
by different sensors (Capacitive, Optical and Thermal)…………………………………...84

xi
Acronyms
ANSI American National Standard for Information System
AFIS Automatic fingerprint identification systems
AFRS Automatic fingerprint recognition systems
ATM Automatic Teller Machine
CN Crossing Number
FTA Failure to Acquire
FTE Failure to Enrol
FAR False Acceptance Rate
FRR False Rejection rate
FVC Fingerprint Verification Competition
MINEX Minutiae Exchange
NIST National Institute of Standards and Technology
PM Percentage Match
PIN Personal Identification Number
RF Radio frequency
SP Singularity Point
SVM Support Vector Machine
TH Threshold
TIAAFR Transformation Invariant Algorithm for Automatic Fingerprint Recognition
xii
Introduction
In recent years, biometrics has become a potential authentication tool which can address the
inherent weaknesses of the traditional knowledge-based (e.g., password) and possession based (e.g.,
key or token) recognition systems in terms of authenticating genuine users. The uniqueness and
permanence of biometric features such as ridge and valley structure on fingerprint, geometry of
hand, facial thermogram or iris structure have made it possible to replace the traditional knowledge
and token based authentication system by more reliable, robust and effective biometric system.
Each biometric attribute has its strengths and weaknesses and the choice typically depends on the
feasibility of its use, characteristics of the application and cost. In some applications, the biometric
works as a deterrent; in others, it is central to system operation. Whatever the application, the
common elements of any biometric system are [1]
The biometric can offer a high degree of certainty regarding an individual’s identity.
The benefits lead directly or indirectly to cost savings, enhanced security or to reduced risk
of financial losses for an individual or institution.
1.1 Benefits of biometrics
There are many benefits of using biometrics as an authentication tool over traditional knowledge-
based or token-based tools that includes increased security, increased convenience, reduced fraud
or delivery of enhanced services. Access to personal computers, networks and applications, access to
secured areas of a building, authorisation at automatic teller machine (ATM) and transaction in
online banking are some common applications of knowledge-based autehtication systems. Handheld
tokens such as cards and key fobs are used mainly for building access but they have replaced
passwords in some high security applications. The generation of personal identification number (
PIN)s using key generator for online banking is an example of this. However, passwords, PINs,
tokens or cards have a number of weaknesses that may raise concern about their suitability in
modern applications, especially high-security applications such as acess to online financial accounts
or medical data.
The authentication mechanism can be implemented by any of the followings or combination of
these
Something you know such as passwords and PINs.
Something you have such as smart cards, keys or tokens.
Soemthing you are, which refers to biometrics- the measurement of physical characteristics
or personal traits.
The knowledge based system which is based on passwords and PINs is still most widely used
authentication system but the shortcomings of the knowledge-based or token based authentication
can be overcome by the introduction of biometrics and the benefits it can bring are

xiii
a) Increased Security: Biometrcis can provide an enhanced level of security to the traditional
authentication methods by allowing access only to authorised users and restrict access or
protect data from unautorised users. Although password is meant to be confidential, should
be hard to guess and should not be written down; in practice, people often forgot their
passwords, sometimes share it with their friends and colleagues. Many users use obvious
words or numbers to make passwords and PINs that can be easily guessed so unauthorised
users can break into account with little effort. “ Good passwords” , i.e. long passwords with
numbers and symbols, are difficult to remembr for most users and rarely enforced.
On the other hand, biometric data cannot be guessed or stolen in the same way as password or
token. Although some biometric systems can be broken under certain conditions, todays biometric
systems are highly unlikely to be fooled by a picture of a face, an impression of a fingerprint or
recording of a voice. This assumes, of course, that the imposter has been able to gather these
physiological characteristic- which is unlikely in most cases.
b) Increased convenience: Most of the time, ordinary users choose simple words as their
passwords so they are not forgotten. As computer users are forced to manage a number of
passwords, the likelyhood of passwords being forgotten increases unless the user choose to
use a universal password for every login, which in effect reduces the security. Tokens and
cards can sometimes be forgotten or lost.
Because biometrics are always attached with the person and so there is nothing to forgot. It offers a
greater convenience than systems based on remembering multiple passwords or on keeping
possession of an authentication token. For PC applications, where users can have access to multiple
resources, biometric can simplify the authentication process by replacing multiple passwords and
thus reduce the burden on both the user and the system administrator. Applications such as point of
sale transactions have also begun to see the use of biometrics to authorise purchases from
prefunded accounts, eliminating the need for cards.
Biometric authentication can also be used to allow users to access higher level of rights and
privileges. Highly sensitive and critical information can be readily available on a biometrically
protected network than on one protected by passwords. This can increase user and enterprise
conveniences, as users can access otherwise protected information without the need for human
intervention.
c) Increased accountability: The increased awareness of security in the enterprise and service
industry has put a huge demand on auditing and reporting capabilities. Biometrics can be a
very useful tool to secure computers and facilities and offer a high degree of certainity as to
what an user has accessed in which computer at what time. Although the auditing and
reporting capability of a computer system is rarely used, the presence of such system can be
an effective deterrent for fraudstars.
Until now, a number of biometric technologies has been developed and deployed in different
industries and some are still in the development process. Each biometric technology has its own

xiv
advantages and disadvantages but they should be considered and evaluated giving full consideration
to the following characteristics [2]:
Universality: Every person should have the characteristic. People who are mute or does not have a
fingerprint will need to be accommodated in some way.
Uniqueness: Generally, no two people have identical characteristics. However, identical twins are
hard to distinguish.
Permanence: The characteristics should not vary with time. A person's face, for example, may
change with age.
Collectibility: The characteristics must be easily collectible and measurable.
Performance: The method must deliver accurate results under varied environmental circumstances.
Acceptability: The general public must accept the sample collection routines. Nonintrusive methods
are more acceptable.
Circumvention: The technology should be difficult to deceive.
Figure1.1: Different Biometric features that can be used to generate uniqueness [3].
Some biometric features that can be used to generate uniqueness for a person are shown in Figure
1.1. Not all of them have gained the same level of acceptance in the industry due to their cost and
viability in deployment. Table 1.1 has summarised some of the existing biometric technologies and
their advantages and disadvantages [4].
Technology Advantages Disadvantages

xv
Fingerprint Very high accuracy
Is the most economical
biometric PC user
authentication technique
It is one of the most developed
biometrics
Easy to use.
Small storage space required
for the biometric template,
reducing the size of the
database memory required
It is standardized.
For some people it is very
intrusive, because is still related
to criminal identification
It can make mistakes with the
dryness or dirty of the finger’s
skin, as well as with the age (is
not appropriate with children,
because the size of their
fingerprint changes quickly)
Image captured at 500 dots per
inch (dpi). Resolution: 8 bits per
pixel. A 500 dpi fingerprint
image at 8 bits per pixel
demands a large memory space,
240 Kbytes approximately →
Compression required (a factor
of 10 approximately).
Facial
recognition
Non intrusive or no contact
required
Commonly available sensors
Large amounts of existing data
to allow background and/or
watch list checks
Easy for humans to verify
results
Face can be obstructed by hair,
glasses, hats, scarves etc
Sensitive to changes in lighting,
expression and pose
Faces change over time
Propensity for users to provide
poor-quality video images yet to
expect accurate results
Hand
geometry
Easy to capture
Believed to be a highly stable
pattern over the adult lifespan
User requires some training
Not sufficiently distinctive for
identification over large
databases; usually used for
verification of a claimed
enrolment identity
System requires a large amount
of physical space
Voice
recognition
Public acceptance
No contact required
Difficult to control sensor and
channel variances that

xvi
Commonly available sensors
(telephones, microphones)
Cheap technology
significantly impact capabilities
Not sufficiently distinctive over
large database
Retinal
scanning
Very high accuracy.
There is no known way to
replicate a retina.
The eye from a dead person
would deteriorate too fast to be
useful, so no extra precautions
have to been taken with retinal
scans to be sure the user is a
living human being.
Very intrusive.
It has the stigma of consumer's
thinking it is potentially harmful
to the eye
Comparisons of template
records can take upwards of 10
seconds, depending on the size
of the database.
Very expensive.
Iris
Recognition
Very high accuracy.
Verification time is generally
less than 5 seconds.
The eye from a dead person
would deteriorate too fast to be
useful, so no extra precautions
have to been taken with retinal
scans to be sure the user is a
living human being.
Intrusive.
A lot of memory for the data to
be stored.
Very expensive
Signature
Recognition
Non intrusive
Little time of verification (about
five seconds)
Cheap technology
Signature verification is designed
to verify subjects based on the
traits of their unique signature.
As a result, individuals who do
not sign their names in a
consistent manner may have
difficulty enrolling and verifying
in signature verification
Error rate: 1 in 50
DNA Very high accuracy
It impossible that the system
made mistakes
Extremely intrusive.
Very expensive

xvii
It is standardized.
Table 1.1: Advantages and disadvantages of different biometric technologies.
1.2 Advantages of fingerprint biometrics
Among all biometrics, fingerprint biometrics has proved itself the most promising and cost-effective
solution in security systems. It’s lower cost and accuracy has brought itself in the leading position of
all biometric solutions as can be seen from Figure 1.2. Although other biometric technologies are
gaining popularity, fingerprint is likely to maintain its leading position in the near future. At present,
nearly half of the biometic solutions are being implemented using fingerprint biometrics [1].
Figure 1.2: Global Biometric Market Projections by Technology, 2005-2012 (BCC Research) [5].
In recent years, government and commercial organisations have substantially increased their own
deployment of fingerprint based recognition systems in non forensic applications, including physical
and logical access control due to rising concerns about security and fraud. Automatic fingerprint
recognition systems performs reliably well as far as recognition is concerned [6].
Over the last two decades, research in fingerprint recognition has seen tremendous growth. Several
automatic fingerprint identification systems (AFIS) have been developed for civil, military and
forensic applications. FBI-AFIS, US border security and EU passport/ID system are few examples of
large scale applications of fingerprint biometrics [1].
The main reasons for the popularity of fingerprint recognition are [1]
Its success in various applications in the forensic, government, and civilian domains
The fact that criminals often leave their fingerprint at crime scenes
The existence of large legacy databases and

xviii
The availability of compact and relatively inexpensive fingerprint readers.
1.3 Challenges in automatic fingerprint recognition
Although significant progress has been made in automatic fingerprint identification in recent years,
there are still a number of issues that need to be addressed to improve systems performance and
accuracy. Most of the shortcomings in the accuracy of an automatic fingerprint identification system
can be attributed to the acquisition process:
1.3.1 Inconsistent contact
Human finger is not a rigid object and if projection of the finger surface onto the image acquisition
surface is not precisely controlled, different impressions of a finger can be created by various
transformations. Determined by the pressure and contact of the finger on the glass platen, the
three-dimensional shape of the finger gets mapped onto the two-dimensional surface of the glass
platen. The result of inconsistent contact of finger with the sensor can result in elastic distortion
where different portions of the finger are displaced by different magnitudes in different directions.
1.3.2 Non-uniform contact
In an ideal case, only the ridge lines make contact with the sensing surface and valleys remain
untouched to make a prefect impression of the fingerprint. However, the dryness of the skin,
shallow or worn-out ridges (due to aging or genetics), skin disease, sweat, dirt, and humidity in the
air all confound the situation, resulting in a non-ideal contact situation. In the case of inked
fingerprints, an additional factor may include inappropriate inking of the finger and may results in
noisy, low contrast images, which leads to either spurious or missing minutiae.
1.3.3 Irreproducible contact
Sometimes accidents, manual work, burn etc. inflict injuries to the finger and can permanently
damage the ridge structure of the finger. Further, each impression of a finger may possibly depict a
different portion of its surface, which may introduce additional spurious minutiae.
1.3.4 Small overlapping area and nonlinear distortion
Fingerprint sensors embedded in consumer electronic devices seem to have small sensing area and
the improper placement of user’s finger on the sensor in unsupervised condition may result in a
limited overlapping area between two impressions of the same finger. Given that a very small
number of minutiae in the overlapping area, it is difficult to determine if two fingerprints are from
the same finger.

xix
1.3.5 Latent fingerprint
Latent fingerprints generally suffer from low image quality, small overlapping area, and nonlinear
distortion as well as the presence of a complex background. To overcome this problem, current
automated system needs extensive manual intervention in latent encoding and in verifying a
candidate list returned by the system [1].

xx
1.3.6 Altered/Fake fingerprints
Any unauthorised user may use a fake finger that imitates a legitimate user’s fingerprint to access a
computer system or pass security checks. Rouges can cover their fingerprints by artificial fingerprints
made of glue like substance or they can mutilate their fingers to avoid being identified by automated
systems. To identify fake fingerprints, the hardware based liveness detection technique can be
adopted by measuring and analysing various vital sign of the live finger such as pulse, perspiration
and deformation [1]. To deal with mutilated finger, a mutilation detector can be added, and, when
mutilation is detected, effort should be made to identify the subject either by restoring the original
fingerprints or using the only unaltered areas of the fingerprint. The use of multibiometrics can be a
solution to tackle altered fingerprint [1].
1.3.7 Interoperability
Interoperability is a big issue in a multivendor environment and it can occur in any module of an
AFIS: sensor, feature extractor and matcher. Different sensor types such as Optical, Capacitive, RF
can produce images that shows variations in resolution, size, distortion, contrast, background noise
and so many. The difference in encoding the image into binary may result in varying definition of the
same feature. This diversity makes it difficult to build a fingerprint system with principal components
sourced from different vendors.
To improve the interoperability among multiple fingerprint systems, international standardisation
organisations have established standards for sensors, templates and systems testing- for example,
image quality specifications for fingerprint sensors and data exchange formats for minutiae
templates [1]. However the superiority in matching accuracy of proprietary templates compared to
standard templates in NIST MINEX testing has shown that existing standards must be improved by,
for example, including extended features.
1.3.8 Feature extraction artefacts
The feature extraction algorithms are not always perfect and introduce measurement errors as
discussed in sensor interoperability. Various image processing operations might introduce
inconsistent biases to perturb the location and orientation estimates of the reported fingerprint
structures from their gray-scale counterparts.
1.4 Security issues
The security of biometric data is of paramount importance and must be protected from external
attacks and tampering as when the biometric data is lost, it is lost forever. We cannot change our
face or fingerprint as we can easily change our PIN if our card is lost. Ratha et al. [7] characterize
common attacks in biometric systems as coercive attack, impersonation attack, replay attack, and
attacks on feature extractor, template database, matcher, and matching results. Some key security
issues have also been explored in [8]. Attacks can alter the contents of biometric images or
templates and can degrade the performance of a biometric system. It is therefore required to
protect the biometric templates (fingerprint template) of individuals at all times.
xxi
While system-on-device technology such as built-in sensor, storage and processing modules on a
card is a useful measure in verification application, fingerprint ID systems require centralised storage
of fingerprint information (template) in large enrolment databases. The unauthorised release of such
fingerprint template information from the database poses a serious security and privacy threat. The
stolen fingerprint template can be reverse-engineered to construct a fake finger or replayed into the
system or it can be used for cross matching across different databases to covertly track people
without their consent, thereby compromising their privacy [1].
Two strategies have been proposed in the literature to protect fingerprint templates. One such
method is to apply a noninvertible mathematical transformation to the original template to generate
a cancellable template and to store the cancellable template only in the database. Therefore, even if
the template is lost, the original fingerprint cannot be regenerated. A user can be issued a new
cancellable template in case his/her first template is lost or stolen. In the second method, a
cryptographic key is generated using the biometric sample such as fingerprint.
The problem with both approaches is that there is some loss of information during the
transformation/key generation process that adversely affects the fingerprint recognition system’s
accuracy [9].
1.5 Research aims and objectives
In this research, an effort will be made to develop and test a novel algorithm for template formation
and matching in automatic fingerprint recognition using Level 2 features. The main objectives of this
research will be to
Optimise image enhancement to extract level2 features.
Optimise the distance between adjacent minutiae using heuristic rules to minimise the
number of false or spurious minutiae.
Develop and test the novel algorithm to create a fingerprint template using
multidimentional feature vector.
Compare and contrast the performance of novel algorithm with other benchmark algorithms
such as Cefar, Cept, Utwe, Diti and Ncmi [10].
Some publicly available fingerprint image database in which fingerprints are captured in various
environmental conditions using different sensors will be suitable for the evaluation of the novel
algorithm in terms of checking its performance and testing sensor interoperability. The performance
of any fingerprint matching algorithm is usually determined by two parameters namely False
Acceptance Rate (FAR) and False Rejection Rate (FRR). False acceptance occurs when an
unregistered finger is falsely matched with a registered finger and false rejection occurs when an
already enrolled finger is not recognised by the system. A matching threshold should be carefully
chosen to allow the maximum percentage of false minutiae in the match. The optimum threshold of

xxii
a system is determined by Equal Rate (EER) when FAR and FRR become equal. To calculate FRR, the
images from the same finger captured in different times and environmental conditions will be
checked against each other and to calculate FAR, different images will be checked against each other
to find any false match. The algorithm will be implemented in Matlab as it offers a wide range of
image processing tools and a suitable platform for developing and testing algorithm using C
programming language.
1.6 Contributions to knowledge
This section provides an overview of the algorithm developed to accomplish the above mentioned
research objectives.
Optimising the image enhancement technique to extract level2 features (minutiae).
In a well-defined fingerprint image, the ridge and valley structure stands out in an alternate fashion
with their smooth flow lines. This regularity facilitates the detection of ridge endings and bifurcation
and consequently, allows minutiae to be precisely extracted from the thinned ridges. However, in
practice, a fingerprint image may not always be well defined due to elements of noise that corrupts
the clarity of the ridge structures. This corruption may occur due to variations in skin and impression
conditions such as scars, humidity, dirt, and non-uniform contact with the fingerprint capturing
device [9]. Therefore, image enhancement techniques are often employed to reduce the noise and
enhance the definition of ridges against valleys.
To optimise the enhancement process, the methodology proposed by Hong et al. [11] has been
applied, which is based on the convolution of the image with Gabor filters [12] tuned to the local
ridge orientation and ridge frequency. The enhancement is implemented in several stages namely
normalisation, ridge orientation estimation, ridge frequency estimation and filtering.
The normalisation has been implemented by the method proposed by Hong, Wan, and Jain (1998)
with zero (0) mean and unit (1) standard deviation to bring all the pixels of the image in the range of
0-255. To identify ridge like regions, the image was segmented in square blocks and a carefully
chosen threshold value was used. The region outside the ridge like regions does not contain any
feature and should be discarded before the extraction process begins. After optimising the region of
interest, an estimation of orientation of the ridge lines was completed by the method proposed by
Hong et al. Although pixel wise processing could provide more accurate estimation of the orientation
of ridge lines, it demands a lot of computation and therefore a block wise estimation was
implemented to reduce the processing time by 36 times (apx) in my pixel fingerprint
image.
To estimate the ridge frequency across the whole image, the oriented image was passed to the ridge
frequency function. Al last, both the ridge oriented image and the ridge frequency image were
passed to ridge filter function to smooth the ridge lines. A scale factor of 0.5 for sigma in the x
direction and a value of 0.5 for sigma in the y direction have been used to generate the filtered
image. The sigma in the x direction which is along the filter controls the bandwidth of the filter and
the sigma in the y direction control the orientation selectivity of the filter.

xxiii
The enhancement with Gabor filtering [12] has made it possible for the algorithm to extract features
(valid minutiae) from low quality images.
Optimising the distance between adjacent minutiae using heuristic rules to minimise the number
of false or spurious minutiae.
In feature extraction process, the location of valid minutiae should be figured out as accurately as
possible. In the feature extraction process of the novel algorithm, only termination and bifurcation
were considered as valid minutia points and all other distinguisable features such as crossover,
island and spikes generated from image enhancement were discarded.
To achieve this false minutiae rejection technique, a number of trial and error have been
implemented and an optimum distance of 6 pixels has been set for removing all invalid minutiae.
Therefore, any valid minutie after the image enhacement must be 7 or more pixel away from its
neighbour.
Develop and test the novel algorithm to create a fingerprint template using multidimensional
feature vector.
The efficiency of many of the commercially established systems heavily relies on the detection of the
core and the quality of the image itself. The number of multiple SPs or absence of core on the image
can cause some anomalies in the formation of the template and may result in high false acceptance
or false rejection. The novel algorithm does not rely on any core or singularity point thus makes the
structure invariant to global rotation and translation. Moreover, it does not need orientation of the
minutiae points on which most of the established algorithm are based. The matching methodology is
based on the local features of each minutiae point such as distances to its nearest neighbours and
their internal angle.
The novel algorithm has been tested and evaluated on a publicly available database and has shown
some good results with a low FAR and FRR.
1.7 Thesis outline
Chapter 2 discusses in detail the background of template formation and matching in AFRS. The
development of the novel algorithm, its performance with results and evaluation are discussed in
chapter 3. Finally conclusion and future work are suggested in chapter 4.

xxiv
Fingerprint Biometrics
2.1 Introduction
Fingerprint of an individual is considered as unique and it remains unchanged over a lifetime if it
does not have any severe damage, cut or bruise. Even fingerprints are unique in twins. A fingerprint
impression is formed by the ridge and valley structure on a fingertip epidermis. A ridge is defined as
a single curved segment, and a valley is the region between two adjacent ridges. The ridge and valley
structure on every fingerprint creates some distinguishable features, which are depicted in Figure
2.1.
Figure 2.1: A typical fingerprint with its features [13]
A number of features can be extracted from a processed fingerprint image at three different levels
[14]. At level1, the whole ridge and valley structure constitutes a global pattern, which can be
classified as one of the five major classes as ‘left loop’, ‘right loop’, ‘whorl’, ‘arch’ and ‘tented arch’
(see Figure 2.2).
Figure 2.2: Fingerprints of five major classes [14]
Left Loop Right Loop Whorl Arch Tented Arch
xxv
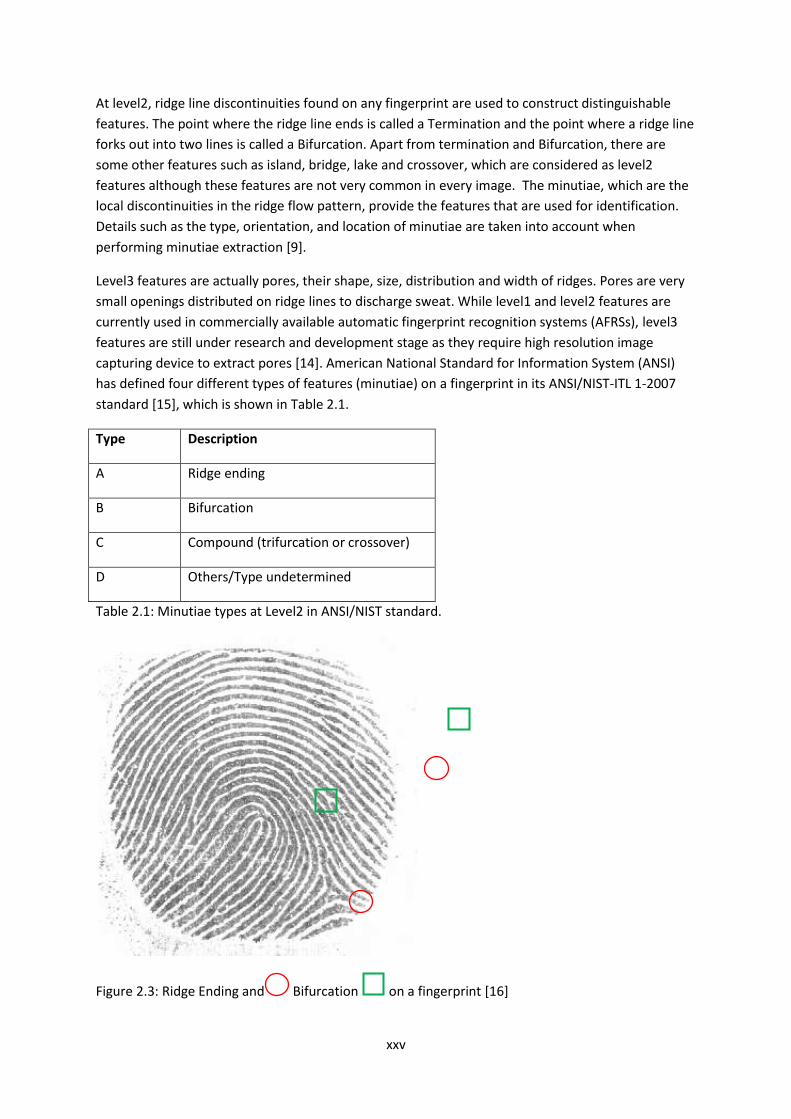
At level2, ridge line discontinuities found on any fingerprint are used to construct distinguishable
features. The point where the ridge line ends is called a Termination and the point where a ridge line
forks out into two lines is called a Bifurcation. Apart from termination and Bifurcation, there are
some other features such as island, bridge, lake and crossover, which are considered as level2
features although these features are not very common in every image. The minutiae, which are the
local discontinuities in the ridge flow pattern, provide the features that are used for identification.
Details such as the type, orientation, and location of minutiae are taken into account when
performing minutiae extraction [9].
Level3 features are actually pores, their shape, size, distribution and width of ridges. Pores are very
small openings distributed on ridge lines to discharge sweat. While level1 and level2 features are
currently used in commercially available automatic fingerprint recognition systems (AFRSs), level3
features are still under research and development stage as they require high resolution image
capturing device to extract pores [14]. American National Standard for Information System (ANSI)
has defined four different types of features (minutiae) on a fingerprint in its ANSI/NIST-ITL 1-2007
standard [15], which is shown in Table 2.1.
Type Description
A Ridge ending
B Bifurcation
C Compound (trifurcation or crossover)
D Others/Type undetermined
Table 2.1: Minutiae types at Level2 in ANSI/NIST standard.
Figure 2.3: Ridge Ending and Bifurcation on a fingerprint [16]
xxvi
In most proprietary AFRS at present, only termination and bifurcation as shown in Figure 2.3 have
been recognised as valid minutiae as these two are more than 95% of all level2 features in a typical
fingerprint. Such systems first detect the minutiae on a fingerprint image and then match the input
minutiae set with minutiae in the stored template [16, 17].
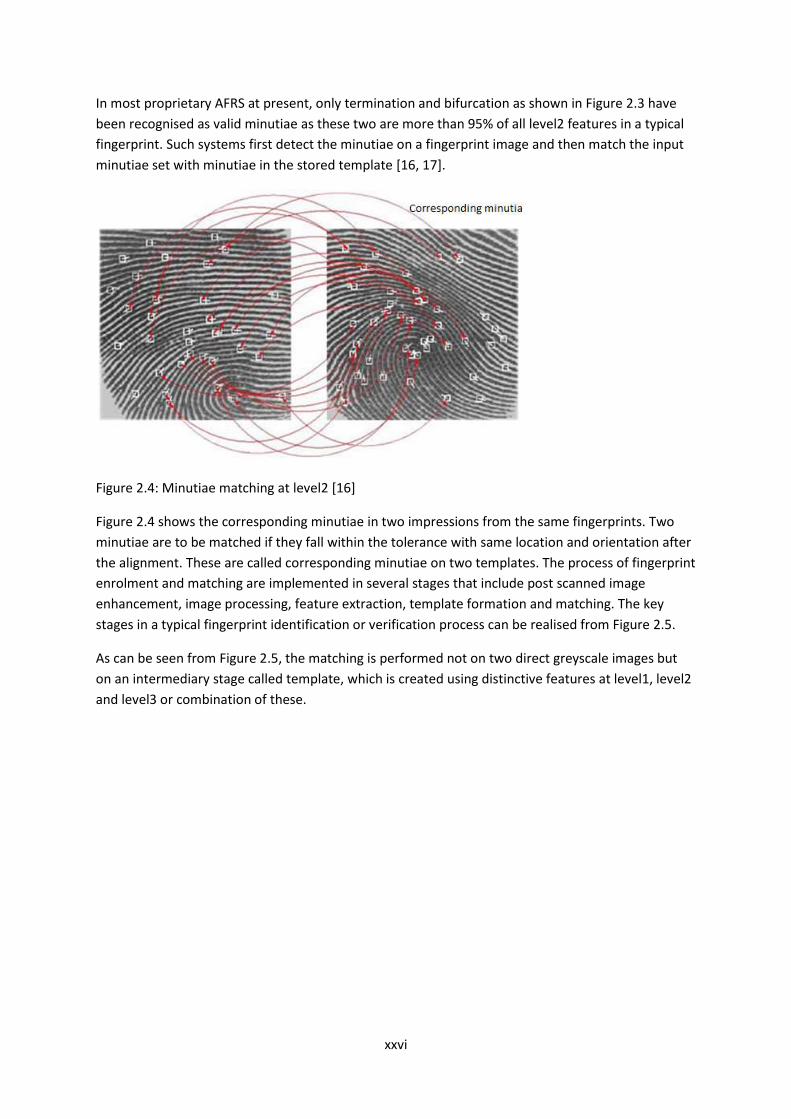
Figure 2.4: Minutiae matching at level2 [16]
Figure 2.4 shows the corresponding minutiae in two impressions from the same fingerprints. Two
minutiae are to be matched if they fall within the tolerance with same location and orientation after
the alignment. These are called corresponding minutiae on two templates. The process of fingerprint
enrolment and matching are implemented in several stages that include post scanned image
enhancement, image processing, feature extraction, template formation and matching. The key
stages in a typical fingerprint identification or verification process can be realised from Figure 2.5.
As can be seen from Figure 2.5, the matching is performed not on two direct greyscale images but
on an intermediary stage called template, which is created using distinctive features at level1, level2
and level3 or combination of these.

xxvii
Figure 2.5: A typical fingerprint identification/verification process
Two different scenario can be arised when one fingerprint template is compared with another
template in an AFRS. These are verification and identification. Verification is a 1:1 (one to one)
matching process where a user provides a token such as ID number or Card and the system checks if
the user is genuine that he/she claims to be. On the other hand, in identification process, the user’s
fingerprint template (query template) is checked against every template stored in the database to
identify who the user is. This is a 1:M (one to many) matching process.
Whether it is identification or verification, the image quality is always a major factor in system’s
reliability. Image quality can vary due to changes in physical and environmental conditions. They
may be degraded and corrupted with elements of noise due to many factors including variations in
skin and impression conditions. Different types of scanner can also render significantly different
impressions based on its resolution and the technology used (such as optical, capacitive or radio
frequency (RF)). This degradation can result in a significant number of spurious minutiae being
created and genuine minutiae being ignored. A critical step in the process of fingerprint enrolment
and matching is to reliably extract minutiae from fingerprint images. Thus, it is necessary to employ
image enhancement techniques prior to minutiae extraction to obtain a more reliable estimate of
minutiae locations (see Figure 2.5).
Any AFRS’s operational performance depends on several factors such as sensor characteristics, the
number of demographic distribution of the population enrolled in the system, the type of sensing
media and various environmental factors- indoor versus outdoor, temperature, humadity and so
many. Also, the quality of an AFRS is measured on how efficiently it can recognise a genuine finger
and how good it is rejecting an unauthorised finger. The parameters are quantised as False
Acceptance Rate (FAR, the ratio of the number of false match to the total number of comparison
Scanned Image Image
Enhancement Feature
Extraction
Template Formation
Matching Decision
(Match or no Match)
Stored templates
in the database

xxviii
when different fingerprint images are checked against each other) and False Rejection Rate (FRR, the
ratio of the number of non- match to the total number of comparison when different impression
from the same fingerprint are checked against each other).
Depending on the application, the FAR and FRR can be adjusted to suit users’ needs [1] - for
example, Disney World’s fingerprint-based entry system operates on low FRR at the expense of high
FAR as they do not want to upset paying customer. On the other hand, an ATM fingerprint
verification system may have very low FAR at the expense of higher FRR.
Although the sensing technology has been improved significantly in recent years; in some cases, a
fingerprint recognition system may fail to capture the user’s fingerprint. Failure to Enrol (FTE) and
Failure to Acquire (FTA) [1] refer to the fraction of users who cannot be enrolled or processed by a
particular system due to the poor quality of their fingerprints as discussed above. The insufficient
number of minutiae present of their finger actually results in the FTA or FTE.
As discussed before, the performance of any AFRS is haviely relied upon the quality of the fingerprint
image as well as the efficiency of the feature extraction and matching algorithm. Many commercially
available systems use singularity point (SP) or core point for fingerprint indexing and template
formation as can be seen from Figure 2.6.
Figure 2.6: Singular regions (white boxes) and core points (small circles) in fingerprint images [9].
These systems use the coordinates and orientation of each minutia on the fingerprint. The accurate
detection of the core and the quality of the image itself are critical in these systems’ performance.
The number of multiple SPs or absence of core on the image can cause real problem in the
formation of the template and may result in high FAR and FRR. Also any translation or rotation of the
image require an alignment process between the stored template and the query template thus put
an overhead on the matching process and the complexity may result in higher FAR or FRR. The
absence of real minutiae or presence of spurious or false minutia can also degrade the systems
performance. Hence, there is a real case of developing a new algorithm to extract level2 features
with minimum error, form a template and match with another template, which is invariant to
translation and rotation and can accommodate the loss of real minutiae or occurrence of false or
spurious minutiae in the query template.
2.2 Fingerprint template formation and matching

xxix
In a well-defined fingerprint image, the ridge and valley structure stands out in an alternate fashion
with their smooth flow lines. This regularity facilitates the detection of ridge endings and bifurcation
and consequently, allows minutiae to be precisely extracted from the thinned ridges. However, in
practice, a fingerprint image may not always be well defined due to elements of noise that corrupts
the clarity of the ridge structures. This corruption may occur due to variations in skin and impression
conditions such as scars, humidity, dirt, and non-uniform contact with the fingerprint capturing
device [9]. Therefore, image enhancement techniques are often employed to reduce the noise and
enhance the definition of ridges against valleys.
This chapter provides discussion on the methodology and implementation of a fingerprint image
enhancement, image binarisation, thinning or skeleton of the image and finally minutiae extraction.
All 1680 images in FVC2006 database had been enhanced utilising all these stages prior to minutiae
extraction process. The results of the experiments involving each stage of the fingerprint
enhancement algorithm and minutiae extraction are then presented and discussed.
2.3 Image enhancement
One of the most widely cited fingerprint enhancement techniques proposed by Hong et al. [11] is
based on the convolution of the image with Gabor filters [12] tuned to the local ridge orientation
and ridge frequency. The enhancement is implemented in several stages namely normalisation,
ridge orientation estimation, ridge frequency estimation and filtering.
As a result of poor image capture, which may result from non-uniform ink intensity or non-uniform
contact with the fingerprint capturing device, a fingerprint image may exhibit distorted levels of
variation in gray-level values along the ridges and valleys. To correct this variation, a normalisation is
employed to bring the intensity to a pre-specified mean and variance.
The next important step in fingerprint image enhancement is ridge orientation. Orientations are
directional vectors representing the ridge flow direction at each location (block) in the image. The
most popular gradient-based approach is used to calculate the orientation [18, 19, 20], which makes
use of the fact that the orientation vector is orthogonal to the gradient. Firstly, the image is
partitioned into square blocks and the gradient is calculated for every pixel, in the x and y directions.
Then the orientation vector for each block is derived by performing an averaging operation on all the
vectors orthogonal to the gradient pixels in the block. Sometimes noise and corrupted elements in
the image may result in incorrect ridge orientation. Assuming that the ridge orientation varies slowly
in a local neighbourhood, the orientation image is then smoothed using a low-pass filter to reduce
the effect of outliers [21].
After calculating the ridge orientation for each block and smoothing the image with low-pass filter,
the image is then processed for frequency estimation. Firstly, the image is divided into square blocks
and an oriented window is calculated for each block. For each block, an x-signature signal is
constructed using the ridges and valleys in the oriented window. The x-signature is the projection of
all the gray level values in the oriented window along a direction orthogonal to the ridge orientation.
Consequently, the projection forms a sinusoidal-shape wave in which the centre of a ridge maps
itself as a local minimum in the projected wave. The distance between consecutive peaks in the x-
signature can then be used to estimate the frequency of the ridges [21].

xxx
A well defined ridge orientation and ridge frequency are important characteristic of a fingerprint
image, which can be enhanced by a bandpass filter. In recent times, such enhancement is
implemented by using a Gabor filter [12]. Gabor filters are bandpass filters that have both
frequency-selective and orientation-selective properties, which mean the filters can be effectively
tuned to specific frequency and orientation values. So far, It has been widely used to facilitate
various application in fingerprint matching [22, 23] and fingerprint classification [24]. Based on the
local orientation and ridge frequency around each pixel, the Gabor filter is applied to each pixel
location in the image. The effect is that the filter enhances the ridges oriented in the direction of the
local orientation, and decreases anything oriented differently. Hence, the filter increases the
contrast between the foreground ridges and the background, whilst effectively reducing noise.
A different approach to fingerprint image enhancement technique that has been employed by
Sherlock [25] is called directional Fourier filtering. The Gabor filter approach that can be
computationally expensive involves spatial convolution of the image with filters. Alternatively,
operating in the frequency domain allows one to efficiently convolve the fingerprint image with
filters of full image size.
In directional Fourier filtering, a set of 16 equispaced directions are used to calculate the
orienrtation [21]. An image window is centred at a point in the raw image, which is used to obtain a
projection of the local ridge information. The image window is then rotated in each of the 16 equally
spaced directions, and in each direction a projection along the window’s y axis is formed. The
projection with the maximum variance is used as the dominant orientation for that point in the
image. This process is then repeated for each pixel to form the orientation image.
After the orientation stage computation, the image is passed through a set of bandpass filters tuned
to match the ridge orinetation. Fourier transformation is used to convert the image from special
domain to frequency domain. Then, it is filtered using a set of 16 Butterworth filters with each filter
tuned to a particular orientation. The number of directional filters corresponds to the set of
directions used to calculate the orientation image [21]. To get the image back into special domain,
an inverse Fourier Transform is used after each directional filter has been independently applied to
the image in frequency domain, which produces a set of directionally filtered images called pre-
filtered images. These pre-filtered images are used with ridge orientation at each pixel of the original
image to construct the final image. Each point in the final image is actually computed by selecting,
from the pre-filtered images the pixel value whose filtering direction most closely matches the actual
ridge orientation. An enhanced version of the image is obtained from the filtering stage that has
been smoothed in the direction of the ridges.
After the directional filtering stage, the image is put for an adaptive thresholding in which each pixel
in the gray level image is set as complete black or complete white depending on its gray level
intensity above or below the threshold level. Now the gray level image is converted into a binary
image where ridge lines are set as black lines whereas valleys are white.
Although both Hong et al [11] and Sherlock’s [25] approach take ridge orientation into account, only
Hong et al’s enhancement method accounts ridge frequency variation whereas Sherlock’s method
considers ridge frequency as constant. By using both the orientation and ridge frequency
information, it allows for accurate tuning of the Gabor filter parameters, which consequently leads

xxxi
to better enhancement results. Therefore, the Gabor filtering approach by Hong et al. has been
utilised to perform fingerprint image enhancement.
2.3.1 Methodology
The methodology for fingerprint image enhancement proposed by Hong et al [11], which has been
adopted in the experiment, consists of four main stages such as:
normalisation,
orientation estimation,
ridge frequency estimation, and
Gabor filtering.
In order to detect the minutiae, the enhanced image is processed in three additional stages that
include:
segmentation,
binarisation, and
thinning.
In this section, the methodology for each stage of the enhancement algorithm has been discussed,
which includes modifications to the original techniques.
2.3.2 Normalisation
It is a process that changes the range of pixel intensity values. The purpose of normalisation is
usually to bring the image, or other type of signal, into a range that is more familiar or normal to the
senses, hence the term normalization.
Normalization is a linear process. If the intensity range of the image is 50 to 180 and the desired
range is 0 to 255, the process entails subtracting 50 from each of pixel intensity, making the range 0
to 130. Then, each pixel intensity is multiplied by 255/130, making the range 0 to 255.
The normalisation approach used by Hong, Wan, and Jain [11] determines the new intensity value
[ ] of each pixel in an image as:
[ ]
{
√( [ ] )
⁄ [ ]
√( [ ] )
⁄
(2.1)
where m and v are the image mean and variance and m0 and v0 are the desired mean and variance
after the normalisation.

xxxii
As can be seen from Figure 2.7, the pixel intensity of the image in (a) is changed to the desired range
(0-255) (image b) that provides a balanced distribution for white and dark pixels hence better output
for further processes.

xxxiii
(a) Before normalisation (b) After normalisation
Figure 2.7: An example of normalisation with zero (0) mean and unit (1) standard deviation. Images
before (a) and after (b) normalisation.
2.3.3 Identification of ridge like region
Identifying ridge like regions thus seperating large variating foreground area from the background is
an important part in image enhancement. Firstly , the image is broken up into blocks and the
standard deviation is calculated for each block. If the standard deviation is above the threshold, it is
deemed part of the fingerprint. During the enhancement process, all the images have been
normalised to have zero mean, unit standard deviation prior to the identification of ridge like region
process so that the threshold specified was relative to a unit standard deviation. A block of
pixels and a threshold of 0.1 have been used to identify ridge like regions in the enhancement
process.
0
1000
2000
3000
4000
5000
Intensity Value
Fre
quency
0 50 100 150 200 250
0
1000
2000
3000
4000
5000
Intensity Value
Fre
quency
0 50 100 150 200 250

xxxiv
(a) Image with large space that does not
contain any information
(b) Area where ridges and valleys are
presented
Figure 2.8: Identifying ridge like region with reliability factor of 0.5 in a typical fingerprint.
As can be seen from Figure 2.8 (a) and (b), the region covered by the ridges only has been identified
by using a threshold value of 0.1. Any part of the image where the pixel intensity is less than 10% has
been considered as the region of no interest.
2.3.4 Orientation estimation
The orientation field actually defines the direction of the ridge lines. Figure 2.9 shows the orientation
of a ridge pixel on a fingerprint. The method proposed by Hong et al [11], sometimes called least
mean square method is an established method to calculate orientation estimation. In this method,
the image can be processed either block wise or pixel wise.
Figure 2.9: Orientation of a ridge pixel.
The steps for calculating the orientation at pixel ( ) are as follows [21]:
1. Firstly, a block of size is centred at pixel ( ) in the normalised fingerprint image.
2. For each pixel in the block, compute the gradients ( ) and ( ), which are the
gradient magnitudes in the and directions, respectively. The horizontal Sobel operator
[26] is used to compute ( ):

xxxv
(
) (2.2)
And the vertical Sobel operator is used to compute ( ):
(
) (2.3)
3. The local orientation at pixel ( ) can then be estimated using the following equations:
( ) ∑ ∑ ( )
( )
(2.4)
( ) ∑ ∑ ( )
( )
(2.5)
( )
( )
( ) (2.6)
where ( ) is the least square estimate of the local orientation at the block centred at pixel ( ).
4. Smooth the orientation field in a local neighbourhood using a Gaussian filter. The
orientation image is firstly converted into a continuous vector field, which is defined as:
( ) ( ( )) (2.7)
( ) ( ( )) (2.8)
where and are the and components of the vector field, respectively. After the vector field
has been computed, Gaussian smoothing is then performed as follows:
( ) ∑ ∑ ( )
( )
(2.9)
( ) ∑ ∑ ( )
( )
(2.10)
where G is a Gaussian low-pass filter of size .
5. The final smoothed orientation field O at pixel ( ) is defined as:
( )
( )
( )
(2.11)
A pixel block wise estimation is done on a finger image that can be seen from Figure 2.10, in
which the arrows are pointing to the direction of the ridge flow.
xxxvi
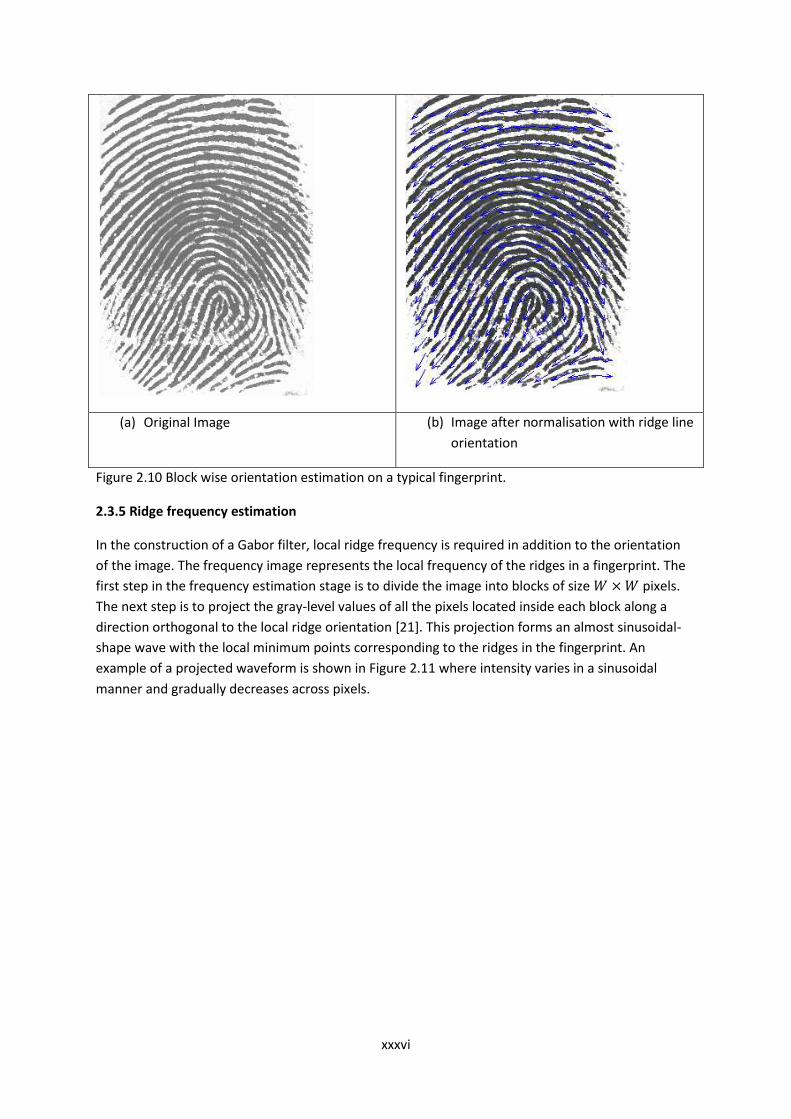
(a) Original Image (b) Image after normalisation with ridge line
orientation
Figure 2.10 Block wise orientation estimation on a typical fingerprint.
2.3.5 Ridge frequency estimation
In the construction of a Gabor filter, local ridge frequency is required in addition to the orientation
of the image. The frequency image represents the local frequency of the ridges in a fingerprint. The
first step in the frequency estimation stage is to divide the image into blocks of size pixels.
The next step is to project the gray-level values of all the pixels located inside each block along a
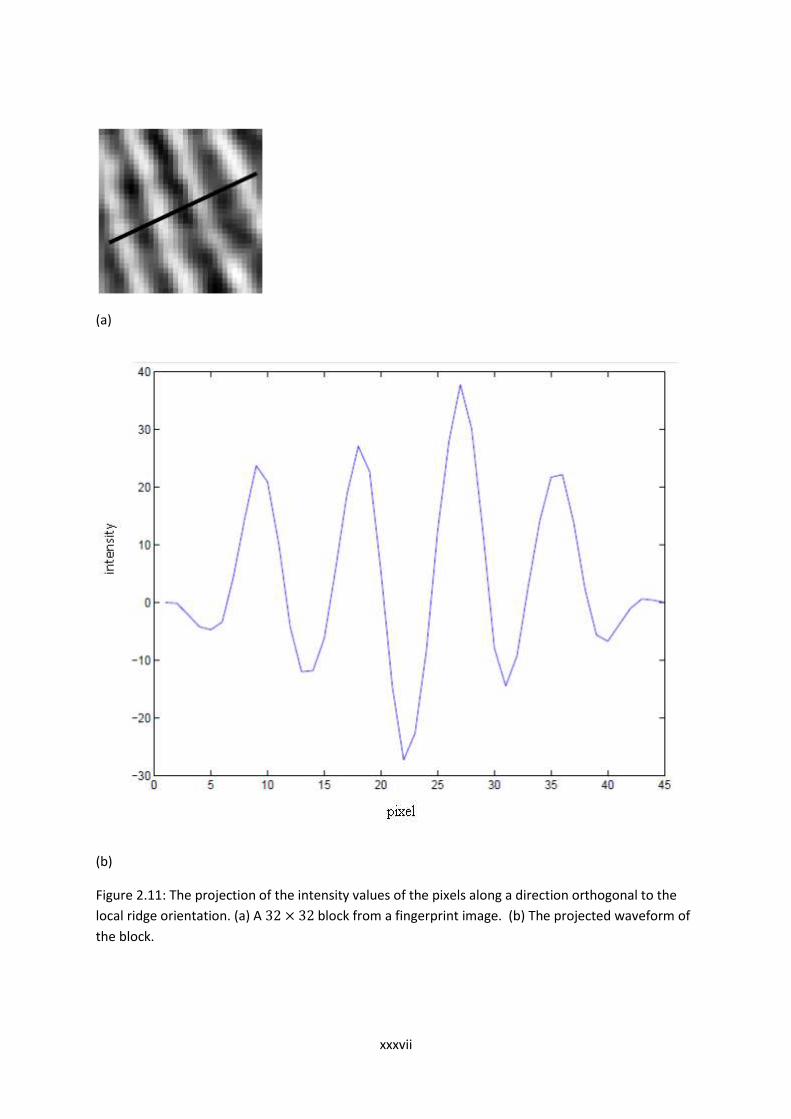
direction orthogonal to the local ridge orientation [21]. This projection forms an almost sinusoidal-
shape wave with the local minimum points corresponding to the ridges in the fingerprint. An
example of a projected waveform is shown in Figure 2.11 where intensity varies in a sinusoidal
manner and gradually decreases across pixels.
xxxvii
(a)
(b)
Figure 2.11: The projection of the intensity values of the pixels along a direction orthogonal to the
local ridge orientation. (a) A block from a fingerprint image. (b) The projected waveform of
the block.

xxxviii
The original frequency estimation stage used by Hong et al [11] can be improved by including an
additional projection smoothing step prior to computing the ridge spacing [21]. This involves
smoothing the projected waveform using a Gaussian lowpass filter of size to reduce the
effect of noise in the projection. The ridge spacing ( ) is then computed by counting the median
number of pixels between consecutive minima points in the projected waveform. Hence, the ridge
frequency ( )for a block centred at pixel ( ) is defined as:
( )
( ) (2.12)
Ideally the ridge frequency values should fall within a certain range given that the fingerprint is
scanned at a fixed resolution. However, there are cases where a valid frequency value cannot be
reliably obtained from the projection. Examples are when no consecutive peaks can be detected
from the projection, and also when minutiae points appear in the block. For the blocks where
minutiae points appear, the projected waveform does not produce a well-defined sinusoidal shape
wave, which can lead to an inaccurate estimation of the ridge frequency. Thus, the out of range
frequency values are interpolated using values from neighbouring blocks that have a well-defined
frequency.
2.3.6 Gabor filtering
Once the ridge orientation and ridge frequency information has been determined, these parameters
are used to construct the even-symmetric Gabor filter. A two dimensional Gabor filter consists of a
sinusoidal plane wave of a particular orientation and frequency, modulated by a Gaussian envelope
[12]. Gabor filters are employed because they have frequency-selective and orientation-selective
properties. These properties allow the filter to be tuned to give maximal response to ridges at a
specific orientation and frequency in the fingerprint image. Therefore, a properly tuned Gabor filter
can be used to effectively preserve the ridge structures while reducing noise. The even-symmetric
Gabor filter is the real part of the Gabor function, which is given by a cosine wave modulated by a
Gaussian envelop as seen by Figure 2.12.

xxxix
Figure 2.12: An even-symmetric Gabor filter in the spatial domain
An even symmetric Gabor filter in the spatial domain is defined as [27]:
( ) {
[
]} ( ) (2.13)
(2.14)
(2.15)
where is the orientation of the Gabor filter, is the frequency of the cosine wave, and are
the standard deviations of the Gaussian envelop along the x and y axes, respectively, and and
define the x and y axes of the filter coordinate frame, respectively.
The Gabor filter is applied to the fingerprint image by spatially convolving the image with the filter.
The convolution of a pixel ( ) in the image requires the corresponding orientation value ( ) and
ridge frequency value ( ) of that pixel. Hence, the application of the Gabor filter G to obtain the
enhanced image E is performed as follows [21],
( ) ∑ ∑ ( ( ) ( )) ( )
(2.16)
where is the orientation image, F is the ridge frequency image, N is the normalised fingerprint
image, and and are the width and height of the Gabor filter mask, respectively.
The filter bandwidth, which specifies the range of frequency the filter responds to, is determined by
the standard deviation parameters and . Since the bandwidth of the filter is tuned to match the
local ridge frequency, then it can be deduced that the parameter selection of and should be
related with the ridge frequency. However, in the original algorithm by Hong et al [11], and
were empirically set to fixed values of 4.0 and 4.0, respectively.
A drawback of using fixed values is that it forces the bandwidth to be constant, which does not take
into account the variation that may occur in the values of the ridge frequency. For example, if a filter
with a constant bandwidth is applied to a fingerprint image that exhibits significant variation in the
frequency values, it could lead to non-uniform enhancement or other enhancement artefacts. Thus,
rather than using fixed values of and these can be a defined as functions of the ridge
frequency parameter, which are defined as
( ) (2.17)
( ) (2.18)
where is the ridge frequency image, is a constant variable for , and is a constant variable
for . This allows a more adaptable approach to be used, as the values of and can now be
specified adaptively according to the local ridge frequency of the fingerprint image.

xl
Furthermore, in the original algorithm, the width and height of the filter mask were both set to fixed
values of 11. The filter size controls the spatial extent of the filter, which ideally should be able to
accommodate the majority of the useful Gabor waveform information. However, a fixed filter size is
not optimal in that it does not allow the accommodation of Gabor waveforms of different sized
bandwidths. Hence, to allow the filter size to vary according to the bandwidth of the Gabor
waveform, the filter size has to be a function of the standard deviation parameters:
(2.19)
(2.20)
where and are the width and height of the Gabor filter mask, respectively. In the above
equation, the width and height of the filter mask are both specified as 6σ due to most of the Gabor
wave information being contained within the region [-3σ, 3σ] away from the y axis. Hence, this
selection of parameters allows the filter mask to capture the majority of the Gabor waveform
information.

xli
(a)
Original Image
(b)
Enhanced Image
Figure 2.13: Results of applying a Gabor filter with kx = 0.5 and ky = 0.5 to a good quality, medium
quality and poor quality fingerprint image.
As can be seen from Figure 2.13, the broken ridge lines have been smoothed and some noises have
been removed in particular with poor images where ridge and valley structures are not well defined.
Although smoothing ridge lines using Gabor Filtering is a great benefit to poor quality images, on
some images it can also remove valuable identifying features such as permanent bruise or cut.
Image enhancement
with Gabor filtering to
a good quality image
Image enhancement
with Gabor filtering to
a medium quality
image
Image enhancement
with Gabor filtering to
a poor quality image

xlii
2.3.7 Binarisation
Binarisation is the process in which a grayscale image is converted into a pure black and white
image. In most minutiae extraction algorithms, there are two levels of interest: the black pixels that
represent ridges and the white pixels that represent valleys. This improves the contrast between the
ridges and valleys in a fingerprint image, and consequently facilitates the extraction of minutiae.
2.3.8 Thinning
The last stage implemented before the minutiae extraction process is thinning. Thinning is a
morphological operation that successively erodes away the foreground pixels until they are one pixel
wide resulting in a skeleton image as shown in Figure 2.14. A standard thinning algorithm [28], which
performs the thinning operation using two sub-iterations, was implemented in Matlab. The skeleton
is the final image in the enhancement process, from which minutiae are extracted.
(a)
(b)
(c)
Figure 2.14: (a) A fingerprint gray-scale image; (b) the image obtained after binarisation of the image
in (a); (c) skeleton image obtained after a thinning of the image.
2.4 Minutiae extraction
Using the skeleton image, the most commonly employed method that is used for minutiae
extraction is the Crossing Number (CN) concept [19, 29, 30]. In this method, a window of 3x3 pixels is
used to examine the local neighbourhood of each pixel in the image and the CN value is computed as
half the sum of the differences between pairs of adjacent pixels in the eight- neighbourhood. Using
the properties of the CN as shown in Table 2.2, the ridge pixel can then be classified as a ridge
ending, bifurcation or non-minutiae point [21]. For example, a ridge pixel with a CN of one
corresponds to a ridge ending, and a CN of three corresponds to a bifurcation.
CN Property
0 Isolated Point
1 Ridge Ending Point
2 Continuing Ridge Point

xliii
3 Bifurcation Point
4 Crossing Point
Table 2.2: Properties of the Crossing Number (CN).
The CN for a ridge pixel P is given by [31]:
∑ (2.21)
where Pi is the pixel value in the neighbourhood of P. For a pixel P, its eight neighbouring pixels are
scanned in an anti-clockwise direction as follows:
P4 P3 P2
P5 P P1
P6 P7 P8
Table 2.3: Orientation of neighbouring pixels around the central pixel.
The CN value for a pixel on the ridge is used to identify whether it is a ridge ending or ridge
bifurcation. A CN value of 1 can corresponds to a ridge ending or termination and a value of 3
corresponds to a ridge bifurcation as can be seen from Figure 2.15.
(a) CN=1 (b) CN=3
Figure 2.15: Examples of a ridge ending and bifurcation pixel. (a) A Crossing Number of one
corresponds to a ridge ending pixel. (b) A Crossing Number of three corresponds to a bifurcation
pixel.
xliv
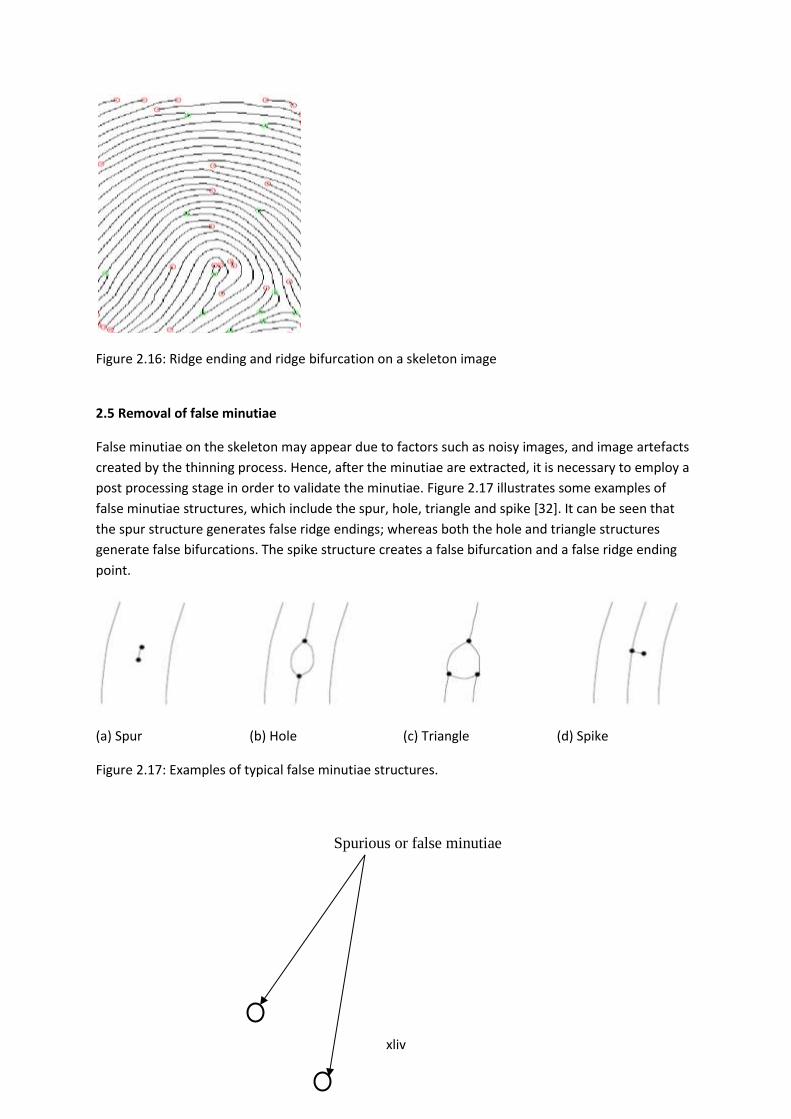
Figure 2.16: Ridge ending and ridge bifurcation on a skeleton image
2.5 Removal of false minutiae
False minutiae on the skeleton may appear due to factors such as noisy images, and image artefacts
created by the thinning process. Hence, after the minutiae are extracted, it is necessary to employ a
post processing stage in order to validate the minutiae. Figure 2.17 illustrates some examples of
false minutiae structures, which include the spur, hole, triangle and spike [32]. It can be seen that
the spur structure generates false ridge endings; whereas both the hole and triangle structures
generate false bifurcations. The spike structure creates a false bifurcation and a false ridge ending
point.
(a) Spur (b) Hole (c) Triangle (d) Spike
Figure 2.17: Examples of typical false minutiae structures.
Spurious or false minutiae
xlv
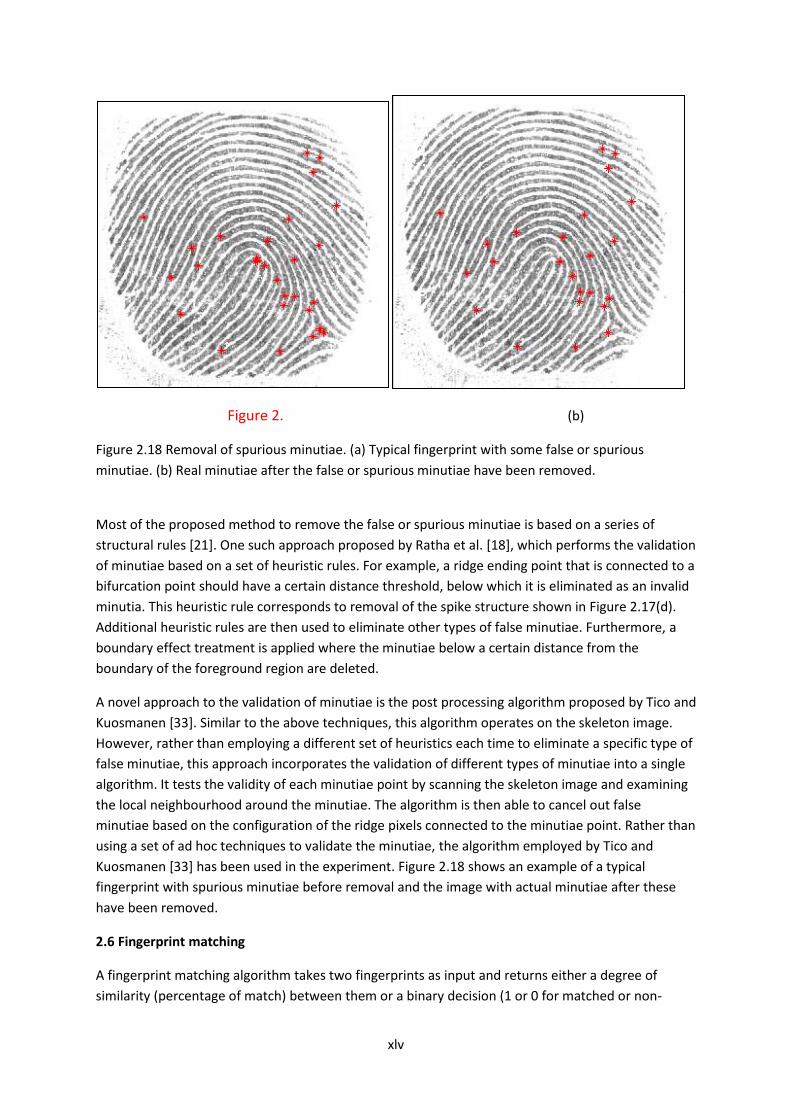
Figure 2. (b)
Figure 2.18 Removal of spurious minutiae. (a) Typical fingerprint with some false or spurious
minutiae. (b) Real minutiae after the false or spurious minutiae have been removed.
Most of the proposed method to remove the false or spurious minutiae is based on a series of
structural rules [21]. One such approach proposed by Ratha et al. [18], which performs the validation
of minutiae based on a set of heuristic rules. For example, a ridge ending point that is connected to a
bifurcation point should have a certain distance threshold, below which it is eliminated as an invalid
minutia. This heuristic rule corresponds to removal of the spike structure shown in Figure 2.17(d).
Additional heuristic rules are then used to eliminate other types of false minutiae. Furthermore, a
boundary effect treatment is applied where the minutiae below a certain distance from the
boundary of the foreground region are deleted.
A novel approach to the validation of minutiae is the post processing algorithm proposed by Tico and
Kuosmanen [33]. Similar to the above techniques, this algorithm operates on the skeleton image.
However, rather than employing a different set of heuristics each time to eliminate a specific type of
false minutiae, this approach incorporates the validation of different types of minutiae into a single
algorithm. It tests the validity of each minutiae point by scanning the skeleton image and examining
the local neighbourhood around the minutiae. The algorithm is then able to cancel out false
minutiae based on the configuration of the ridge pixels connected to the minutiae point. Rather than
using a set of ad hoc techniques to validate the minutiae, the algorithm employed by Tico and
Kuosmanen [33] has been used in the experiment. Figure 2.18 shows an example of a typical
fingerprint with spurious minutiae before removal and the image with actual minutiae after these
have been removed.
2.6 Fingerprint matching
A fingerprint matching algorithm takes two fingerprints as input and returns either a degree of
similarity (percentage of match) between them or a binary decision (1 or 0 for matched or non-

xlvi
matched respectively). Instead of direct grayscale matching between two images based on their
features, most of the algorithms compare intermediary stage of two fingerprints called template,
which is formed through a feature extraction stage as discussed in the previous sections.
Due to the large variability in different impressions of the same finger (i.e., large intra-class
variations), it is a very complex process to match two fingerprint images. The main factors
responsible for intra-class variations are summarized below [16].
Displacement: the same finger may be placed at different locations on a touch sensor during
different acquisitions resulting in a (global) translation of the fingerprint area. A finger displacement
of just 2 mm (imperceptible to the user) results in a translation of about 40 pixels in a fingerprint
image scanned at a resolution of 500 dpi.
Rotation: the same finger may be rotated at different angles with respect to the sensor surface
during different acquisitions. In spite of the finger “guide” mounted in certain commercial scanners,
involuntary finger rotations of up to ±20° with respect to vertical orientation can be observed in
practice.
Partial overlap: finger displacement and rotation often cause part of the fingerprint area to fall
outside the sensor’s “field of view,” resulting in a smaller overlap between the foreground areas of
the template and the input fingerprints. This problem is particularly serious for small-area touch
sensors.
Non-linear distortion: the act of sensing maps the three-dimensional shape of a finger onto the two-
dimensional surface of the sensor. This mapping results in a non-linear distortion in successive
acquisitions of the same finger due to skin plasticity. Often, fingerprint matching algorithms
disregard the characteristic of such a mapping, and consider a fingerprint image as non-distorted by
assuming that it was produced by a correct finger placement; a finger placement is correct when: (i)
the trajectory of the finger approaching the sensor is orthogonal to the sensor surface; (ii) once the
finger touches the sensor surface, the user does not apply traction or torsion. However, due to skin
plasticity, the components of the force that are non-orthogonal to the sensor surface produce non-
linear distortions (compression or stretching) in the acquired fingerprints. Distortion results in the
inability to match fingerprints as rigid patterns.
Pressure and skin condition: the ridge structure of a finger would be accurately captured if ridges of
the part of the finger being imaged were in uniform contact with the sensor surface. However, finger
pressure, dryness of the skin, skin disease, sweat, dirt, grease, and humidity in the air all confound
the situation, resulting in a non-uniform contact. As a consequence, the acquired fingerprint images
are very noisy and the noise strongly varies in successive acquisitions of the same finger depending
on the magnitude of the above cited causes.
Noise: it is mainly introduced by the fingerprint sensing system; for example, residues are left over
on the glass platen from the previous fingerprint capture.
Feature extraction errors: the feature extraction algorithms are imperfect and often introduce
measurement errors. Errors may be made during any of the feature extraction stages (e.g.,
estimation of orientation and frequency images, detection of the number, type, and position of the
singularities, segmentation of the fingerprint area from the background, etc.). Aggressive
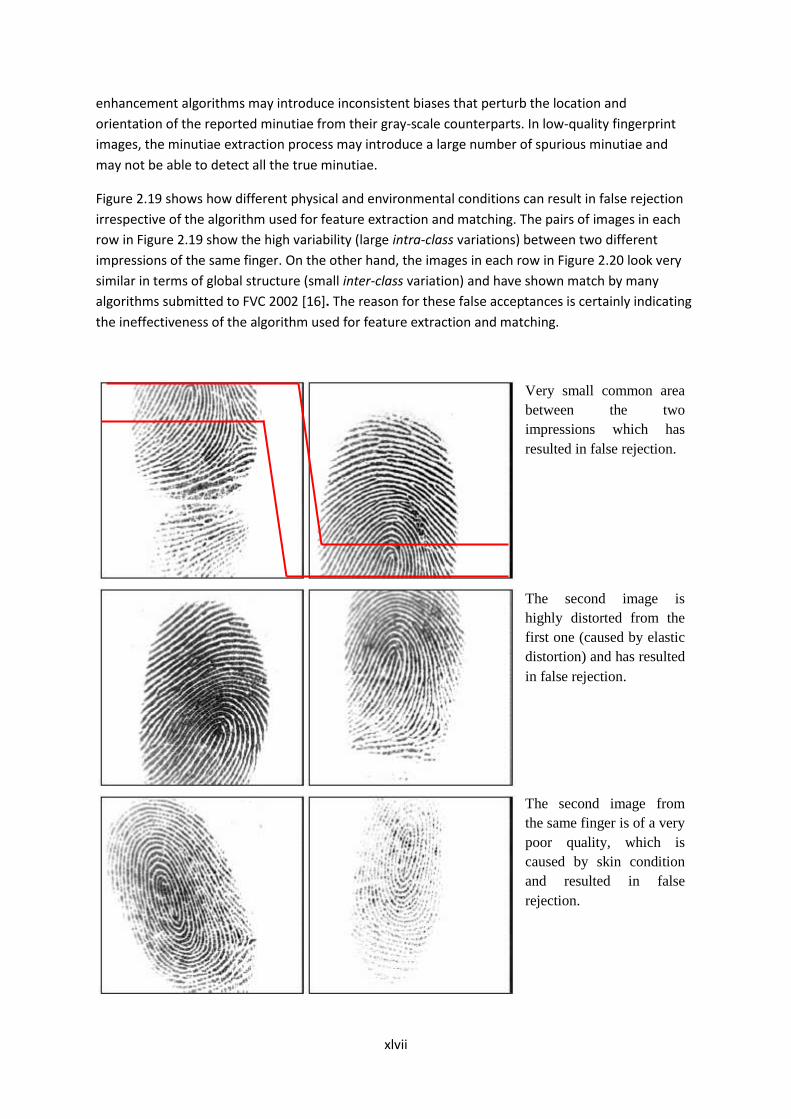
xlvii
enhancement algorithms may introduce inconsistent biases that perturb the location and
orientation of the reported minutiae from their gray-scale counterparts. In low-quality fingerprint
images, the minutiae extraction process may introduce a large number of spurious minutiae and
may not be able to detect all the true minutiae.
Figure 2.19 shows how different physical and environmental conditions can result in false rejection
irrespective of the algorithm used for feature extraction and matching. The pairs of images in each
row in Figure 2.19 show the high variability (large intra-class variations) between two different
impressions of the same finger. On the other hand, the images in each row in Figure 2.20 look very
similar in terms of global structure (small inter-class variation) and have shown match by many
algorithms submitted to FVC 2002 [16]. The reason for these false acceptances is certainly indicating
the ineffectiveness of the algorithm used for feature extraction and matching.
Very small common area
between the two
impressions which has
resulted in false rejection.
The second image is
highly distorted from the
first one (caused by elastic
distortion) and has resulted
in false rejection.
The second image from
the same finger is of a very
poor quality, which is
caused by skin condition
and resulted in false
rejection.

xlviii
Figure 2.19: Falsely matched fingerprints. Each row shows a pair of impressions of the same finger.
The main cause of difficulty is a very small overlap in the first row, high non-linear distortion in the
second row, and very different skin conditions in the third row [16].

xlix
Figure 2.20: Falsely accepted fingerprints. Each pair of impressions in a row is from different fingers,
which were falsely matched by some of the algorithms submitted to FVC2002 [16].
Although, many AFIS algorithm performs very well in matching good quality images, it still remains a
challenge for any algorithm in matching low-quality and partial latent fingerprints. The quality of the
fingerprint can be checked during the enrolment if it is a human-assisted AFIS but human
intervention is not feasible in unattended on-line fingerprint recognition systems, which are being
increasingly deployed in commercial applications. Moreover, many algorithms require a high level of
image processing, which might not be feasible for much smaller stand alone system to
accommodate.
The evidence from FVC2000 showed that most errors were made on about 20% poor quality
fingerprints [16]. In recent years, the state-of-the-art of fingerprint recognition technology has been
perceived throughout different editions of the Fingerprint Verification Competition. Although a
direct comparison across different competitions is not possible due to the use of databases of
unequal difficulty, the performance of the top algorithms on database DB2 of FVC2006 (which was
collected under realistic operating conditions with a large area sensor) are extremely good [16].
However, there is still a need to continually develop more robust systems capable of properly

l
processing and comparing poor quality fingerprint images; this is particularly important when
dealing with large scale applications or when small area and relatively inexpensive low quality
sensors are employed.
Jain et al have classified fingerprint matching into three families [16].
Correlation-based matching: two fingerprint images are superimposed and the correlation between
the corresponding pixels is computed for different alignments (e.g., various displacements and
rotations).
Minutiae-based matching: this is the most popular and widely used technique, being the basis of
the fingerprint comparison made by fingerprint examiners. Minutiae are extracted from the two
fingerprints and stored as sets of points in the two dimensional plane. Minutiae-based matching
essentially consists of finding the alignment between the template and the input minutiae feature
sets that result in the maximum number of minutiae pairings.
Non-Minutiae feature-based matching: minutiae extraction is difficult in extremely low-quality
fingerprint images. While some other features of the fingerprint ridge pattern (e.g., local orientation
and frequency, ridge shape, texture information) may be extracted more reliably than minutiae,
their distinctiveness as well as persistence is generally lower. The approaches belonging to this
family compare fingerprints in terms of features extracted from the ridge pattern. In principle,
correlation-based matching could be conceived of as a subfamily of non-minutiae feature-based
matching, inasmuch as the pixel intensities are themselves features of the finger pattern.
It has been found that minutiae-based methods perform better than correlation based methods
[34]. In the development of the novel algorithm, minutiae-based method in template formation and
matching was adopted.
2.7 Minutiae based fingerprint matching
2.7.1 Introduction
Fingerprint features can be analysed at both global and local level. When analyzed at the global
level, the fingerprint pattern exhibits one or more regions where the ridge lines assume distinctive
shapes (characterized by high curvature, frequent termination, etc.). These regions (called
singularities or singular regions) may be classified into three typologies: loop, delta, and whorl (see
Figure 2.2).
Singular regions belonging to loop, delta, and whorl types are typically characterized by ∩, Δ, and O
shapes, respectively [35]. Several fingerprint matching algorithms pre align fingerprint images
according to a landmark or a centre point, called the core. The core corresponds to the centre of the
north most loop type singularity. For fingerprints that do not contain loop or whorl singularities i.e.,
those belonging to the arch class in Figure 2.2, it is difficult to define the core. In these cases, the
core is usually associated with the point of maximum ridge line curvature. Unfortunately, due to the
high variability of fingerprint patterns, it is difficult to reliably locate a registration (core) point in all
the fingerprint images [35].
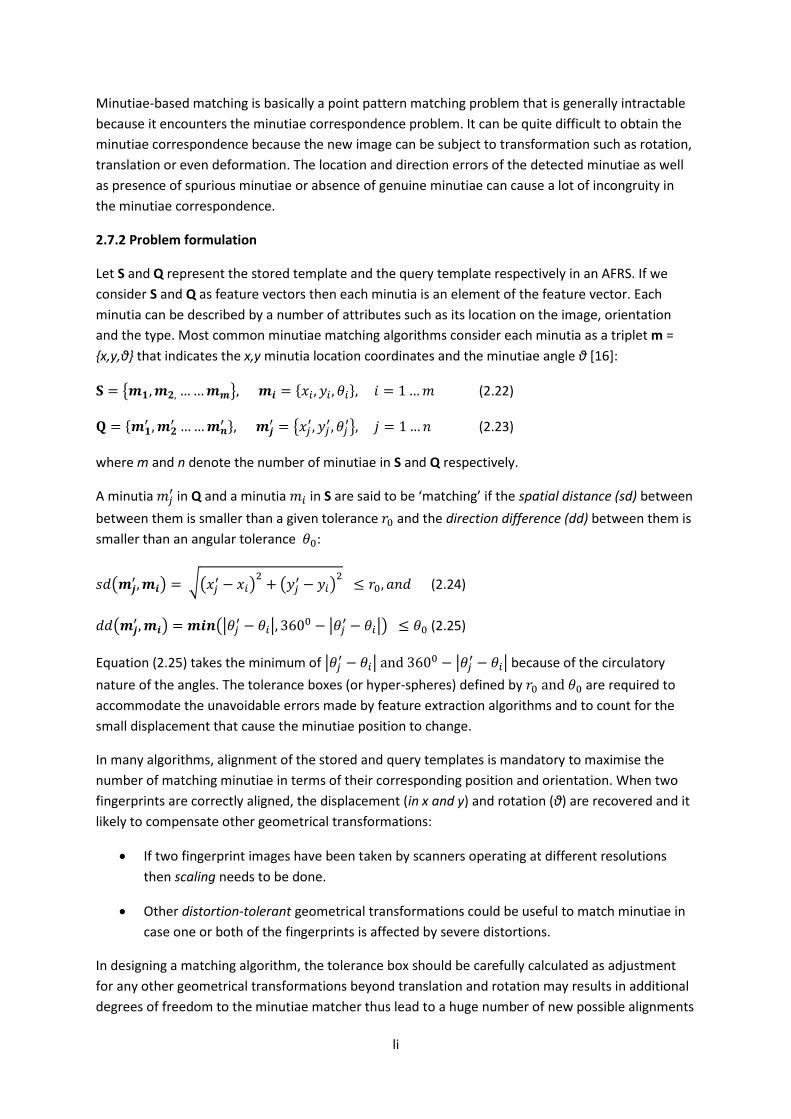
li
Minutiae-based matching is basically a point pattern matching problem that is generally intractable
because it encounters the minutiae correspondence problem. It can be quite difficult to obtain the
minutiae correspondence because the new image can be subject to transformation such as rotation,
translation or even deformation. The location and direction errors of the detected minutiae as well
as presence of spurious minutiae or absence of genuine minutiae can cause a lot of incongruity in
the minutiae correspondence.
2.7.2 Problem formulation
Let S and Q represent the stored template and the query template respectively in an AFRS. If we
consider S and Q as feature vectors then each minutia is an element of the feature vector. Each
minutia can be described by a number of attributes such as its location on the image, orientation
and the type. Most common minutiae matching algorithms consider each minutia as a triplet m =
{x,y,θ} that indicates the x,y minutia location coordinates and the minutiae angle θ [16]:
{ } { } (2.22)
{
}
{
} (2.23)
where m and n denote the number of minutiae in S and Q respectively.
A minutia in Q and a minutia in S are said to be ‘matching’ if the spatial distance (sd) between
between them is smaller than a given tolerance and the direction difference (dd) between them is
smaller than an angular tolerance :
( ) √(
) (
) (2.24)
( ) (|
| |
|) (2.25)
Equation (2.25) takes the minimum of | |
| | because of the circulatory
nature of the angles. The tolerance boxes (or hyper-spheres) defined by are required to
accommodate the unavoidable errors made by feature extraction algorithms and to count for the
small displacement that cause the minutiae position to change.
In many algorithms, alignment of the stored and query templates is mandatory to maximise the
number of matching minutiae in terms of their corresponding position and orientation. When two
fingerprints are correctly aligned, the displacement (in x and y) and rotation (θ) are recovered and it
likely to compensate other geometrical transformations:
If two fingerprint images have been taken by scanners operating at different resolutions
then scaling needs to be done.
Other distortion-tolerant geometrical transformations could be useful to match minutiae in
case one or both of the fingerprints is affected by severe distortions.
In designing a matching algorithm, the tolerance box should be carefully calculated as adjustment
for any other geometrical transformations beyond translation and rotation may results in additional
degrees of freedom to the minutiae matcher thus lead to a huge number of new possible alignments

lii
which significantly increases the chance of incorrectly matching two fingerprints from different
fingers.
If map( ) is a function that maps a minutia (from Q) into
according to a given geometrical
transformation; for example, by considering a displacement of [Δx, Δy] and a anticlockwise rotation
θ around the origin:
( {
} {
}), (2.26)
where [
] [
] [
] [
] (2.27)
Let mm( ) is an indicator function that returns 1 in the case where the minutiae and match
according to equations (2.24) and (2.25):
( ) {
( ) (
)
(2.28)
Then, the matching problem can be formulated as
∑ ( ( ( )
) ) (2.29)
where P(i) is an unknown function that determines the pairing between Q and S minutiae; in
particular, each minutia has either exactly one mate in the other fingerprint or has no mate at all.
The constraints are
1. P(i)=j indicates that the mate of the in S is the minutia in Q.
2. P(i)=null indicates that minutia in S has no mate in Q.
3. A minutia in Q has mo mate in S if P(i)≠j i=1.....m.
4. i=1.....m, k=1.....m, i ≠ k P(i) ≠ P(k) or P(i) = P(k) = null (this means that each minutia in Q
is associated with a maximum of one minutia in S, that is P is a bijective function).
Note that, in general, P(i) = j does not necessarily mean that minutiae and match in the sense
of Equations (2.24) and (2.25) but only that they are the most likely pair under the current
transformation.
Expression (2.29) requires that the number of minutiae mates be maximized, independently of how
strict these mates are; in other words, if two minutiae comply with Equations (2.24) and (2.25), then
their contribution to expression (2.29) is made independently of their spatial distance and of their
direction difference. Alternatives to expression (2.29) may be introduced where the residual (i.e., the
spatial distance and the direction difference between minutiae) for the optimal alignment is also
taken into account.
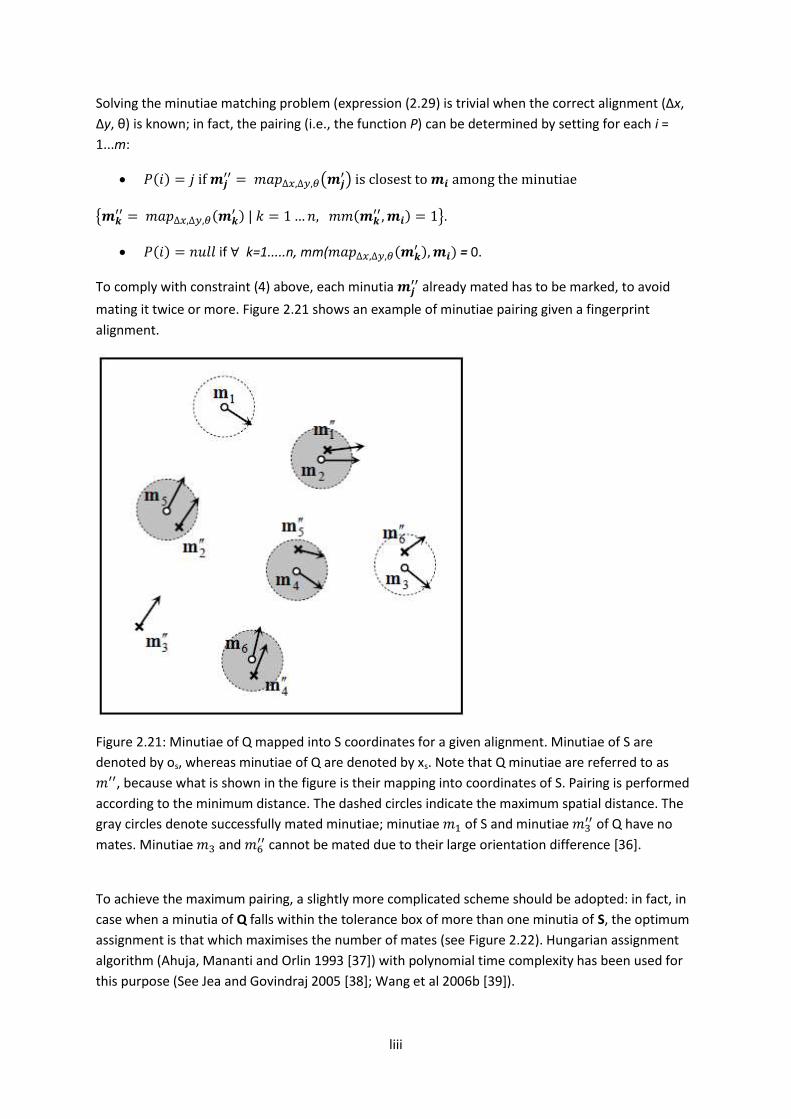
liii
Solving the minutiae matching problem (expression (2.29) is trivial when the correct alignment (Δx,
Δy, θ) is known; in fact, the pairing (i.e., the function P) can be determined by setting for each i =
1...m:
( ) (
)
{ (
) ( ) }.
( ) if k=1.....n, mm( ( ) ) = 0.
To comply with constraint (4) above, each minutia already mated has to be marked, to avoid
mating it twice or more. Figure 2.21 shows an example of minutiae pairing given a fingerprint
alignment.
Figure 2.21: Minutiae of Q mapped into S coordinates for a given alignment. Minutiae of S are
denoted by os, whereas minutiae of Q are denoted by xs. Note that Q minutiae are referred to as
, because what is shown in the figure is their mapping into coordinates of S. Pairing is performed
according to the minimum distance. The dashed circles indicate the maximum spatial distance. The
gray circles denote successfully mated minutiae; minutiae of S and minutiae of Q have no
mates. Minutiae and cannot be mated due to their large orientation difference [36].
To achieve the maximum pairing, a slightly more complicated scheme should be adopted: in fact, in
case when a minutia of Q falls within the tolerance box of more than one minutia of S, the optimum
assignment is that which maximises the number of mates (see Figure 2.22). Hungarian assignment
algorithm (Ahuja, Mananti and Orlin 1993 [37]) with polynomial time complexity has been used for
this purpose (See Jea and Govindraj 2005 [38]; Wang et al 2006b [39]).
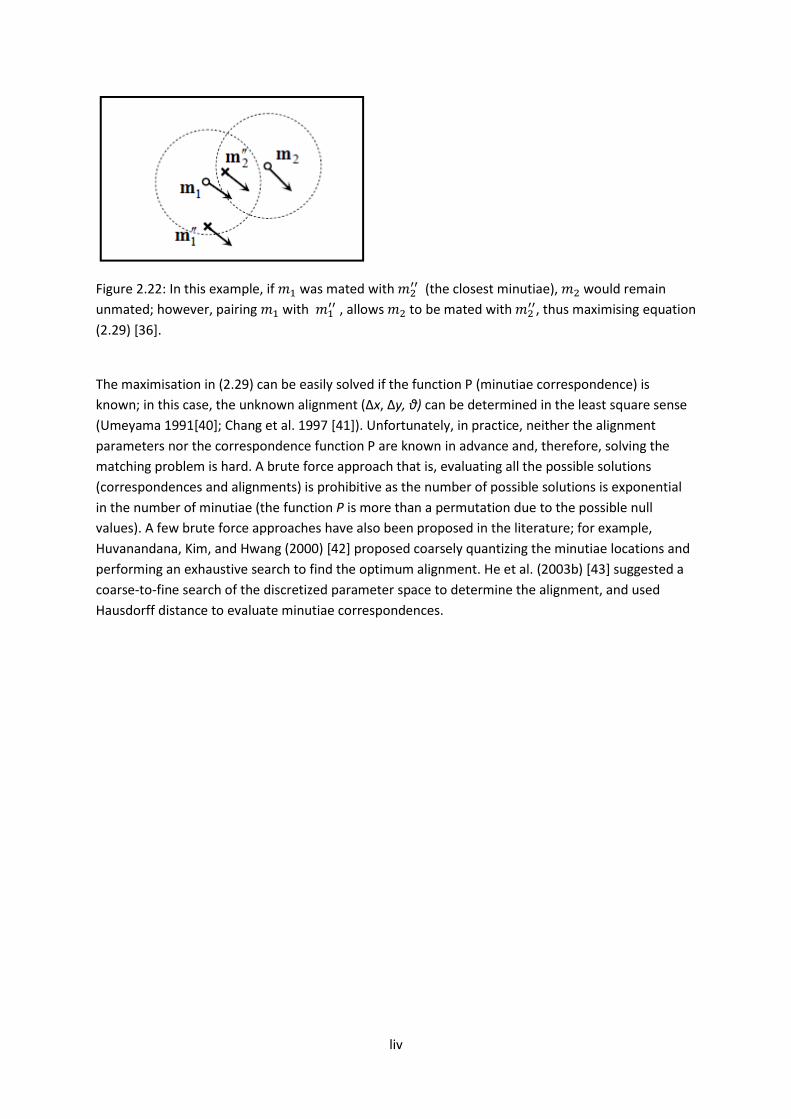
liv
Figure 2.22: In this example, if was mated with (the closest minutiae), would remain
unmated; however, pairing with , allows to be mated with
, thus maximising equation
(2.29) [36].
The maximisation in (2.29) can be easily solved if the function P (minutiae correspondence) is
known; in this case, the unknown alignment (Δx, Δy, θ) can be determined in the least square sense
(Umeyama 1991[40]; Chang et al. 1997 [41]). Unfortunately, in practice, neither the alignment
parameters nor the correspondence function P are known in advance and, therefore, solving the
matching problem is hard. A brute force approach that is, evaluating all the possible solutions
(correspondences and alignments) is prohibitive as the number of possible solutions is exponential
in the number of minutiae (the function P is more than a permutation due to the possible null
values). A few brute force approaches have also been proposed in the literature; for example,
Huvanandana, Kim, and Hwang (2000) [42] proposed coarsely quantizing the minutiae locations and
performing an exhaustive search to find the optimum alignment. He et al. (2003b) [43] suggested a
coarse-to-fine search of the discretized parameter space to determine the alignment, and used
Hausdorff distance to evaluate minutiae correspondences.
lv
2.7.3 Similarity score
Unlike in manual matching performed by forensic experts where the number of matching minutiae is
itself the main output of the comparison, automatic matching systems must convert this number
into a similarity score. This is often performed by simply normalizing the number of matching
minutiae (here denoted by k) by the average number (m + n)/2 of minutiae set in S and Q [36]:
(2.30)
However, further information can be exploited, especially in case of noisy images and limited
overlap between S and Q, to compute a more reliable score; in fact:
Minutiae quality can be used to weight differently reliable and unreliable minutiae pairs: the
contribution from a pair of reliable minutiae should be higher than that from a pair where at
least one the two minutiae are of low quality (Chen, Chan, and Moon, 2007 [44]). The quality
of a minutia (and of a minutia pair) can be defined according to the fingerprint quality in the
region where the minutia lies and/or by keeping into account other local information.
The normalization in Equation (2.30) tends to excessively penalize fingerprint pairs with
partial overlap; a more effective normalization considers the number or minutiae belonging
to the intersection of the two fingerprints after the optimal alignment have been
determined [38].
In general, the definition of optimal rules for combining various similarity contributions into a single
score can be complex; some researchers (Jea and Govindaraju (2005) [38]; Srinivasan et al. (2006)
[45]; Jia et al. (2007b) [46]; Feng (2008) [47]; Lumini and Nanni (2008) [48]) propose to apply
learning- based techniques where the rule and its parameters are optimized to best separate
genuine from impostor scores. Supervised classification is central also in the method proposed by
Mansukhani, Tulyakov, and Govindaraju (2007) [49] and by Mansukhani and Govindaraju (2008) [50]
where a Support Vector Machine (SVM) is trained to distinguish between genuine and false minutiae
pairs. Finally, methods based on the computation of the likelihood ratio to assess the evidential
value of comparisons with an arbitrary number of minutiae are quite popular in forensic
identification (see Neumann et al. (2006) [51]; Bazen and Veldhuis (2004) [52]).
2.7.4 Point pattern matching
The point pattern matching techniques are well established and can be approached from any of the
established classes such as Algebraic Geometry, Hough Transform, Relaxation, Operations Research
Solutions, Energy-Minimization and so on [16].
Algebraic Geometry: Several methods have been proposed in the literature for different versions of
the problem. Bishnu et al. (2006) [53] proposed an algorithm to perform an inexact partial point
pattern matching with O(m2 × n2 × log m) time complexity. However, this algorithm makes some
simplifying assumptions that are not always fulfilled by minutiae points; in fact, the algorithm
requires that: (i) all the points in query template Q have a mate in stored template S, even if some
points in S can have no mate in Q, and (ii) the tolerance boxes around the points do not intersect
each other or, equivalently, that the points in S are not too close to each other. Since, general
purpose algebraic geometry methods do not fit the peculiarity of minutiae matching; some ad-hoc

lvi
algorithms have been designed for fingerprints such as the algorithm proposed by Udupa, Garg, and
Sharma (2001) [54].
Hough Transform: The generalized Hough transform-based approach (Ballard (1981) [55]; Stockman,
Kopstein, and Benett (1982) [56]) converts point pattern matching to the problem of detecting peaks
in the Hough space of transformation parameters. It discretizes the parameter space and
accumulates evidence in the discretized space by deriving transformation parameters that relate
two sets of points using a substructure of the feature matching technique. A hierarchical Hough
transform-based algorithm may be used to reduce the size of the accumulator array by using a multi-
resolution approach. Hough transform-based approaches, also known as “voting-based approaches”
are quite popular for minutiae matching. One such method has been proposed by Ratha et al.(1996)
[57].
Relaxation: The relaxation approach (e.g., Rosenfeld and Kak (1976) [58]; Ranade and Rosenfeld
(1993) [59]) iteratively adjusts the confidence level of each corresponding pair of points based on its
consistency with other pairs until a certain criterion is satisfied. At each iteration r, the method
computes m × n probabilities pij (probability that point i corresponds to point j):
( )
∑ [ { ( )
( )}]
(2.31)
where c(i,j;h,k) is a compatibility measure between the pairing (i,j) and (h,k), which can be defined
according to the consistency of the alignments necessary to map point j into i and point k into h.
Equation (2.22) increases the probability of those pairs that receive substantial support by other
pairs, and decreases the probability of the remaining ones. At convergence, each point i may be
associated with the point j such that pij = maxs{pis}, where s is any other point in the set. Although a
number of modified versions of this algorithm have been proposed to reduce the matching
complexity (Ton and Jain, 1989) [60], these methods are inherently slow due to their iterative
nature.
Operations Research solutions: Tree-pruning approaches attempt to find the correspondence
between the two point sets by searching over a tree of possible matches while employing different
tree-pruning methods (e.g., branch and bound) to reduce the search space (Baird, 1984) [61]. To
prune the tree of possible matches efficiently, this approach tends to impose a number of
requirements on the input point sets, such as an equal number of points (n = m) and no outliers
(points without correspondence). These requirements are difficult to satisfy in practice, especially in
fingerprint minutiae matching. Solutions to point pattern matching may also be derived from some
problems which are known in the field of Operations Research as assignment problems, bipartite
graph matching (Murty (1992) [62]; Gold and Rangarajan (1996) [63]). A minutiae matching
algorithm based on minimum spanning tree matching was proposed by Oh and Ryu (2004) [64].
Energy Minimization: these methods define a function that associates an energy or fitness with each
solution of the problem. Optimal solutions are then derived by minimizing the energy function (or
maximizing fitness) by using a stochastic algorithm such as the Genetic algorithm (Ansari, Chen, and
Hou (1992) [65]; Zhang, Xu, and Chang (2003) [66]) or simulated annealing (Starink and Backer,
1995) [67]. Le, Cheung, and Nguyen (2001) [68] and Tan and Bhanu (2006) [69] provided specific

lvii
Genetic algorithm implementations for global minutiae matching. It has been shown that pure
Genetic Algorithms are not well suited to fine-tuning the search in complex search spaces, and that
hybridization with other local-searches techniques (called Memetic algorithms) can improve their
efficiency. A Memetic algorithm for minutiae matching has been recently proposed by Sheng et al.
(2007) [70]. In general, the methods belonging to this category tend to be slow and are unsuitable
for real-time minutiae matching.
2.8 Minutiae based template formation
There has been proposed several minutiae-based fingerprints matching techniques can be found in
the literature. These include methods based on structure matching (Chen and Kuo, 1991 [71];
Hrechak and McHugh, 1990 [72]; Jiang and Yau, 2000 [73]; Wahab et al., 1998 [74]), alignment
matching (Jain et al., 1997 [75]; Ratha et al., 1996 [57]; Ross et al., 2003 [23]), non-linear
transformation (Almansa and Cohen, 2000 [76]; Bazen and Gerea, 2002 [77]). The principle of all this
methods is to obtain the minutiae correspondence accurately. The method proposed by Jain et al.,
1997 [75]; Ratha et al., 1996 [57]; Ross et al., 2003 [23] make use of ridges associated with each
minutiae to get the correspondence. However, this method may result in inaccurate matching as
local ridge information cannot be considered discriminatory feature because the ridges from
different fingers or different positions in the same fingerprint may be very similar. The local
structure composed of several minutiae close to each other is the basis of the minutiae
correspondence in Chen and Kuo, 1991 [71]; Hrechak and McHugh, 1990 [72]; Jiang and Yau, 2000
[73]; Wahab et al., 1998 [74]; Almansa and cohen, 2000 [76]; Bazen and Gerea, 2002 [77]. It is found
that the representation of local structure based on a group of minutiae is not very reliable because it
relies on the interdependencies between minutiae details, which can be missed or erroneously
detected by a minutiae extraction algorithm [34]. Moreover, it is difficult to detect the similarity of
local structure because the correspondence between the elements of the local structure cannot be
always known.
Dabbah, Woo and Dlay, 2005 [10] have suggested a computationally efficient algorithm in which
they formed the template by considering each minutiae as a vector of three elements as distance of
each minutia point from the core/SP, orientation with respect to SP and type of minutia point (either
Termination or Bifurcation). Each stored template denoted by ‘T’ is made of a set of minutiae points
‘M’ such that
{ }, (2.32)
{ } (2.33)
And each query template denoted by ‘I’ can be made of ‘N’ minutiae points such that
= {
}, (2.34)
{ } (2.35)
Where and are minutiae points in ‘T’ and ‘I’ respectively. For two minutiae to be matched,
both minutiae vectors have to be within the same tolerance box (hyper-spheres) defined by and
which means that

lviii
- (2.36)
and - (2.37)
Where are the Euclidean distances and the orientation differences of the
minutiae and from the SP respectively.
One of the important aspects in Dabbah et al.’s [10] matching algorithm is the introduction of the
type matching of minutiae points from both stored and query templates. By using the type matching
as the third element of each vector, they have increased their matching performance, which has
resulted in significant improvement in Equal Error Rate (EER) to 4.9% [10].
Although M A Dabbah et al. [10] has shown a better performance compared to some other
benchmark algorithm, their algorithm is heavily relying on the accurate detection of the core point
or SP. As discussed previously, it is sometimes difficult to detect the SP or core point accurately or
even they might be absent on some fingerprint.
Qi, Yang and Wang, 2005 [34] have proposed a matching algorithm where they have embedded
global orientation field with each minutiae. They have defined the feature vector F of each minutiae
M that describes its structure characteristics with global fingerprint orientation field as
{{ }
}
(2.38)
Where is the relative direction between minutiae M and the sampling point
.
They have defined the similarity level ( ) between two structure feature vectors ,
feature vector from query fingerprint and stored template respectively, as
( ) { | |
| |
(2.39)
Where is the defined threshold and | | is the Euclidean distance between these two feature
vectors. As the dimensions of the two feature vectors may be different, the Euclidean distance is
only computed only using the corresponding components between them. Therefore, if there is no
corresponding counterpart of some feature vector, the element will be discarded. As the similarity
level ( ) ( ( ) ) describes a matching certainty level between two feature vectors
instead of simply match or not match, the matching score is highly depending on the threshold level
T. A not carefully chosen threshold level T may result in a higher FRR or FAR.
Another recent template formation technique is proposed by Chengfeng Wang and Marina L.
Gavrilova [78], in which they have used Delauney Triangulation structure using minutiae to form
Fingerprint Template. The key characteristics of the Delaunay triangulation of a set of points are that
it is unique. Also, it can be computed efficiently in O(NlogN) time [78]. But the real problem with this
technique is that it is very vulnerable to distortion and noise. One misplaced minutiae or a new
spurious minutia can change all the neighbouring triangles instead of just one triangle. In real life
scenario where it is likely to always have some noise and distortion on the scanned image, the
efficiency of any algorithm based on Delauney Triangulation will be subject to the ability of the
image processing technique to eliminate any false/ spurious minutia and to detect real minutiae.

lix
2.9 Summary
Image enhancement is considered as a pre processing step before feature extraction implemented in
most AFIS. A considerable amount of literature has been reviewed in image processing techniques
and template formation using level2 features. Minutia based matching technique has also been
adapted due to its higher success rate. In the development of the novel algorithm and during the
evaluation, all images in the database had been enhanced before passed on to the feature
extraction stage. The block sizes have been carefully chosen (16×16 pixels) in identifying ridge like
regions and orientation estimation. The technique proposed by Hong et al, [11] which is based on
the convolution of the image with Gabor filters tuned to the local ridge orientation has been
adopted to enhance images prior to feature extraction stage. The removal of false minutiae was also
an important step as it has rendered only the valid termination and bifurcation to the template
formation process. Some processed images from the database during the image enhancement and
feature extraction process have been presented in previous sections.

lx
Novel Structure for Template Formation and Matching
3.1 Introduction
In general, feature vector of detected minutiae from a fingerprint can be described as:
( ) where ( ) is its Cartesian coordinate and is the local ridge direction (known as
orientation).
where { } and is number of minutia points in the fingerprint. Due to translation and
rotation, the coordinates and orientation changes and therefore, alignment between the stored
template and the query template needs to be performed for calculating the matching score. Instead
of using the coordinates and the orientation of the minutia, we use the first nearest neighbours to
form a feature vector; in particular, minutiae and its feature vector is defined as:
( ) (3.1)
where
[ ( ) ] (3.2)
[ [ ] [ ] [( ) ] [ ]] (3.3)
and {
( ) ( ) ( ) ( )}
(3.4)
is the Euclidean distance between the minutia and its nearest neighbour, and [( )
is the angle between lines connecting minutia and it’s ( ) and nearest neighbour. This
feature vector is illustrated in Figure 3.1.
Figure 3.1: Schematic of feature formation of minutiae.
Each stored template denoted by is made of a set of minutiae such that

lxi
{ } (3.5)
and each query template denoted by can be made of a set of minutiae such that
Q={ }, (3.6)
For two minutiae to be matched, both minutiae vectors have to be within the tolerance defined by
and which means that
(3.7)
[ ( ) - ( )] AND [ ( ) - ( )] [ ( ) - ( )] (3.8)
and [ ( ) ( )] [ ( ) ( )] (3.9)
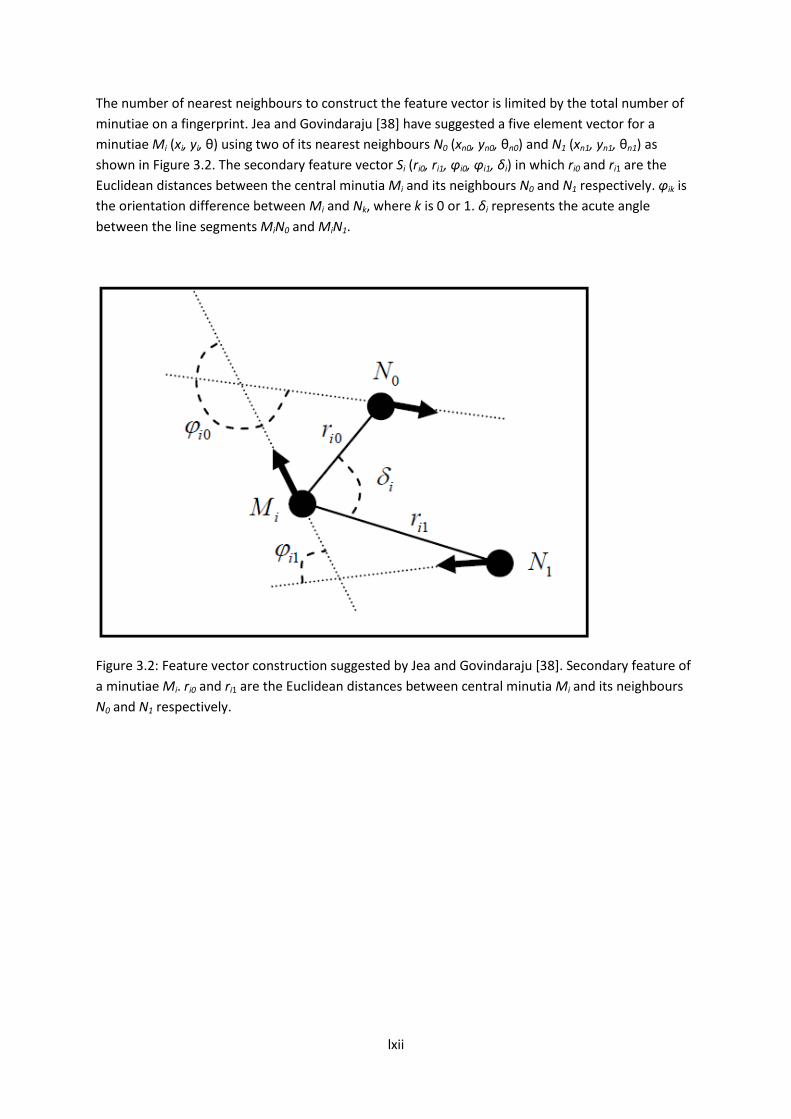
lxii
The number of nearest neighbours to construct the feature vector is limited by the total number of
minutiae on a fingerprint. Jea and Govindaraju [38] have suggested a five element vector for a
minutiae Mi (xi, yi, θ) using two of its nearest neighbours N0 (xn0, yn0, θn0) and N1 (xn1, yn1, θn1) as
shown in Figure 3.2. The secondary feature vector Si (ri0, ri1, φi0, φi1, δi) in which ri0 and ri1 are the
Euclidean distances between the central minutia Mi and its neighbours N0 and N1 respectively. φik is
the orientation difference between Mi and Nk, where k is 0 or 1. δi represents the acute angle
between the line segments MiN0 and MiN1.
Figure 3.2: Feature vector construction suggested by Jea and Govindaraju [38]. Secondary feature of
a minutiae Mi. ri0 and ri1 are the Euclidean distances between central minutia Mi and its neighbours
N0 and N1 respectively.
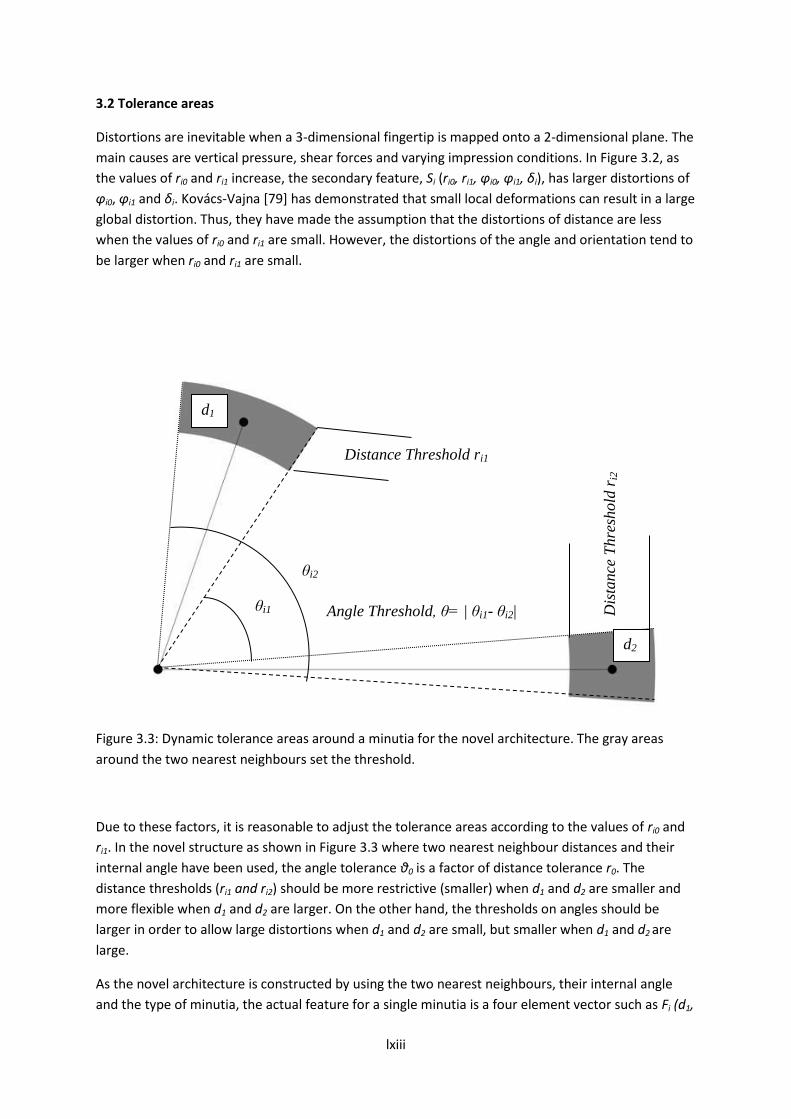
lxiii
3.2 Tolerance areas
Distortions are inevitable when a 3-dimensional fingertip is mapped onto a 2-dimensional plane. The
main causes are vertical pressure, shear forces and varying impression conditions. In Figure 3.2, as
the values of ri0 and ri1 increase, the secondary feature, Si (ri0, ri1, φi0, φi1, δi), has larger distortions of
φi0, φi1 and δi. Kovács-Vajna [79] has demonstrated that small local deformations can result in a large
global distortion. Thus, they have made the assumption that the distortions of distance are less
when the values of ri0 and ri1 are small. However, the distortions of the angle and orientation tend to
be larger when ri0 and ri1 are small.
Figure 3.3: Dynamic tolerance areas around a minutia for the novel architecture. The gray areas
around the two nearest neighbours set the threshold.
Due to these factors, it is reasonable to adjust the tolerance areas according to the values of ri0 and
ri1. In the novel structure as shown in Figure 3.3 where two nearest neighbour distances and their
internal angle have been used, the angle tolerance θ0 is a factor of distance tolerance r0. The
distance thresholds (ri1 and ri2) should be more restrictive (smaller) when d1 and d2 are smaller and
more flexible when d1 and d2 are larger. On the other hand, the thresholds on angles should be
larger in order to allow large distortions when d1 and d2 are small, but smaller when d1 and d2 are
large.
As the novel architecture is constructed by using the two nearest neighbours, their internal angle
and the type of minutia, the actual feature for a single minutia is a four element vector such as Fi (d1,
Distance Threshold ri1
Dis
tance
Thre
shold
ri2
θi1
θi2
Angle Threshold, θ= | θi1- θi2|
d1
d2

lxiv
d2, θ, τ). Tolerance area is determined by three functions as Distance Threshold (r0), Angle Threshold
(θ0) and Type (τ). In case of match, both the first and second nearest neighbours of corresponding
minutiae should fall inside the tolerance box unless there is not much distortion. But if one of the
nearest neighbours is missing or if there is any spurious minutia that comes inside the gray box, the
algorithm will less likely to consider the corresponding minutiae as a match. Therefore, any loss of
actual minutia or appearance of spurious minutia will have an impact on the net matching score
between Q and S.
3.3 Matching score
The matching score can be found by calculating the similarity between two feature vectors in terms
of their corresponding nearest neighbour distances and their internal angles. As formulated in
equation (3.2, 3.3 and 3.4), the match count is increased by one if all the corresponding distances
and their internal angles match on a particular minutia. In real life scenario, it is highly unlikely that
for each corresponding minutiae, all the distances and their internal angles will fall inside the
tolerance. The percentage matching (PM) between two templates S and Q can be calculated by the
total number of match on their corresponding feature vectors, which is defined as
(3.10)
The final decision between match or no match between the query template Q and the stored
template S is determined by PM and the threshold, TH. As discussed in chapter 1, the threshold TH
can be set according to the sensitivity of the application. In highly secure applications such as
financial transaction, a very low value of FAR is required whereas less secure application such as
entry log in a theme park may not require a very low value of FAR. The balance between FAR and
FRR can be optimised by statistical observation as these two parameters are inversely proportional
to each other. In general, a matching algorithm is evaluated by Error Equal Rate (EER), where FAR
and FRR are equal (point of intersection when FRR and FAR are plotted against PM).
As can be seen from Figure 3.4, the matching process of the four elements feature vectors starts
with reading the templates as (Mx4) and (Nx4) vectors; one from the query template Q and another
from the stored template S. The algorithm first compares the size of these two templates and takes
size of the smaller template as the outer control for the iteration where each vector of the smaller
template is compared with each vector of the bigger template element by element. If the fourth
elements (type of minutia) of the corresponding vectors match then only the three remaining
elements are checked. To be a full match, the remaining three elements must be within the
tolerance. As soon as there is a full match between two vectors, the program control exits the inner
loop and takes the next vector from the smaller template and start checking with the vectors in the
bigger template. When there is a match found, the vector is marked so it cannot be checked again.
The program continues until all the vectors in the smaller template are checked with the vectors in
the bigger template.
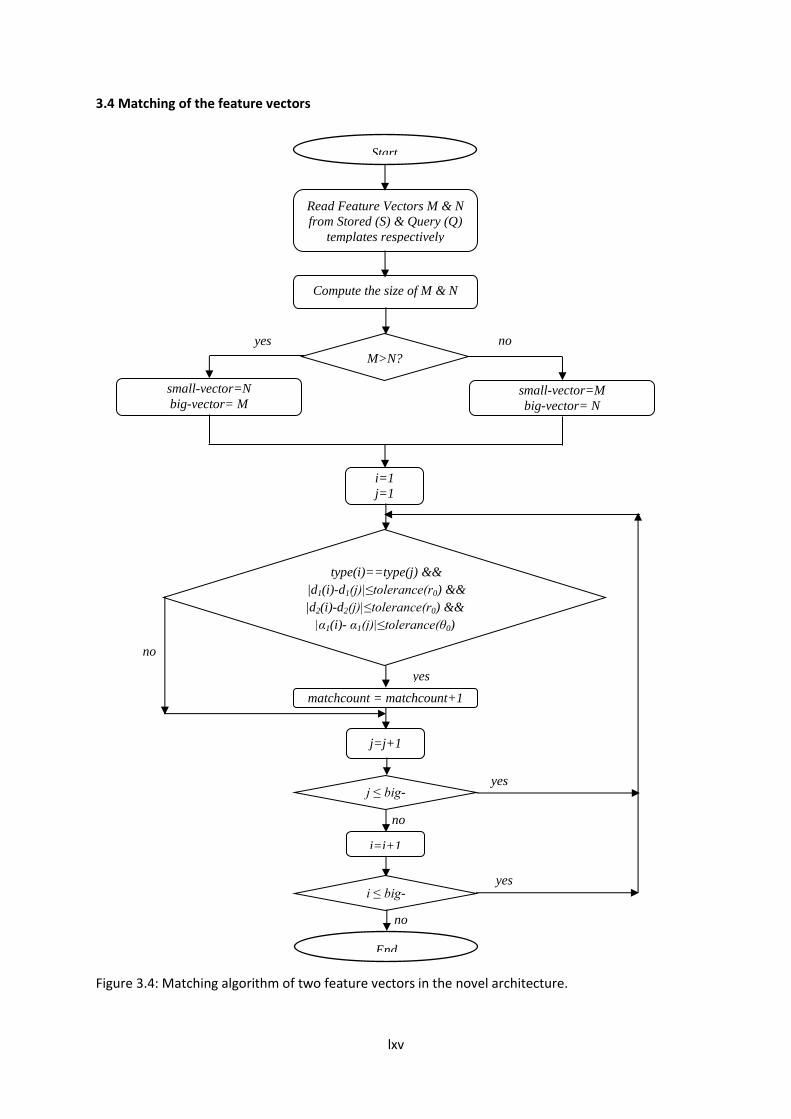
lxv
3.4 Matching of the feature vectors
Figure 3.4: Matching algorithm of two feature vectors in the novel architecture.
no
no
Start
Read Feature Vectors M & N
from Stored (S) & Query (Q)
templates respectively
Compute the size of M & N
M>N?
small-vector=M
big-vector= N
small-vector=N
big-vector= M
i=1
j=1
type(i)==type(j) &&
|d1(i)-d1(j)|≤tolerance(r0) &&
|d2(i)-d2(j)|≤tolerance(r0) &&
|α1(i)- α1(j)|≤tolerance(θ0)
matchcount = matchcount+1
yes
yes no
no
yes
j=j+1
i=i+1
j ≤ big-
vector
i ≤ big-
vector
yes
End

lxvi
Although it is highly unlikely, in some cases there can be multiple matches between the vectors from
query and stored templates. The algorithm takes this into account and it considers the match as a
true match in its first instance and rejects the rest.
3.5 Research methodology
The novel algorithm for the formation of fingerprint template and matching using minutiae at level2
has been developed and tested on publicly available fingerprint database FVC- 2006. A total of 1680
fingerprints (140 fingers with 12 impressions per finger, many of which are of a poor quality) have
been used to evaluate the algorithm. The performance of any fingerprint matching algorithm is
normally determined by Error Equal Rate (EER) when FAR and FRR are equal. To evaluate the FRR,
the images from the same finger were matched against each other and a total of 9,240 checks (66
checks on 12 images from the same finger from 140 users) were performed. The FAR was calculated
on cross match result, i.e., a total of 9,730 matching was performed among different finger images
where the first sample from each set was taken and checked with others. The algorithm was
implemented with Matlab 7.11.0.
Some of the limitations in already established minutiae-based algorithms, which requires accurate
detection of singularity region or core on a fingerprint has been overcome as the novel algorithm
does not rely on any singularity region or core. Also the alignment between the query template and
the stored template is not required during the matching process thus made the novel algorithm
more efficient and eliminates lots of computation overhead and saves time.
3.6 Evaluation of the novel algorithm
In previous chapters, automatic fingerprint identification systems have been discussed in detail. Also
formation of the template and matching using level2 features has been defined in the novel
algorithm. The novel algorithm is defined as Transformation Invariant Algorithm for Automatic
Fingerprint Recognition (TIAAFR). In this chapter the performance evaluation of the developed
system described in detail and obtained results are presented. The algorithm has been implemented
in Matlab 7.11.0.
The publicly available database FVC 2006 (DB2) has been used to evaluate the novel algorithm. The
reason for choosing this database is its diversity of enrolled users and wider acceptability among
developers. This database has been used in the Fourth International Fingerprint Verification
Competition where 53 (27 industrial, 13 academic, and 13 independent developers) participants
tested and evaluated their algorithms [80]. The full database also includes images scanned by
capacitive and thermal sensors, which creates an opportunity to test any algorithm across platforms
and check their interoperability. FVC 2006 (DB2) comes with 1680 images in which 140 fingers have
been scanned with 12 impressions per finger. The images were scanned by an optical sensor with
the resolution of 400x560 pixels at 569 dpi. Each image is available in BMP, 256 grey level formats. A
heterogeneous population including manual workers and elderly people has been used to create the
database. There was no constraint such as minimum quality of the image on the users during the
enrolment. Figure 3.5 shows some sample images from the database. It can be clearly seen from
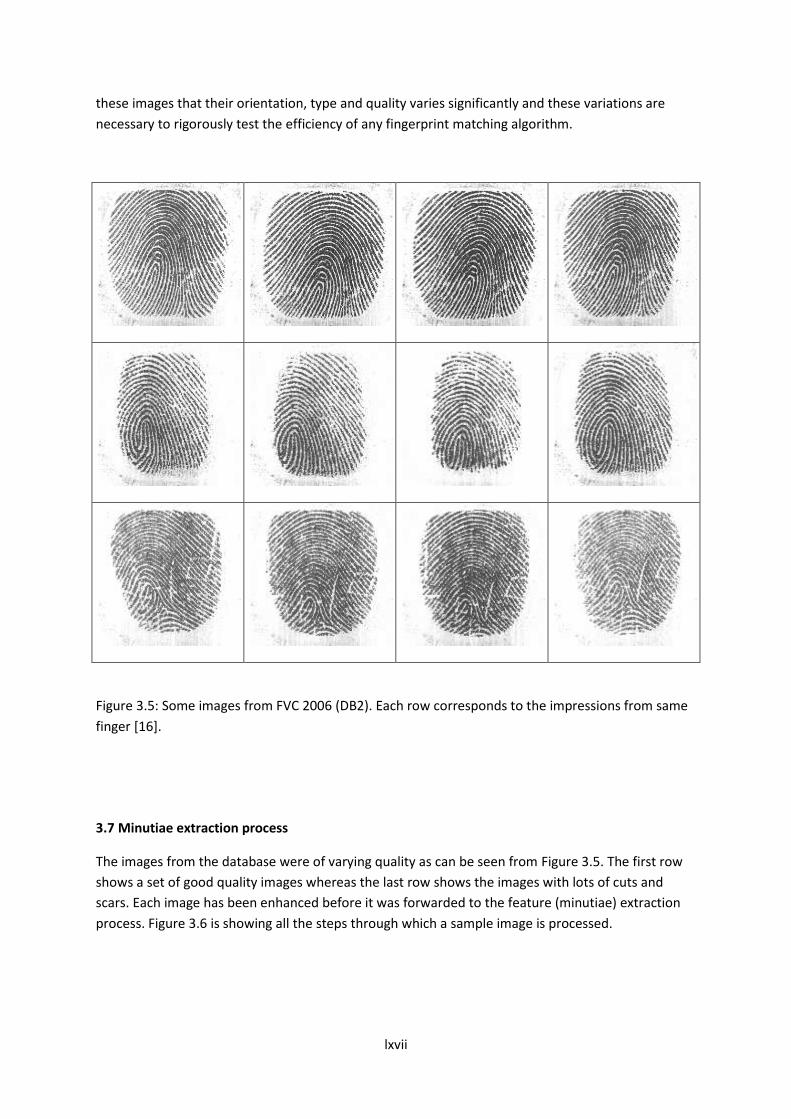
lxvii
these images that their orientation, type and quality varies significantly and these variations are
necessary to rigorously test the efficiency of any fingerprint matching algorithm.
Figure 3.5: Some images from FVC 2006 (DB2). Each row corresponds to the impressions from same
finger [16].
3.7 Minutiae extraction process
The images from the database were of varying quality as can be seen from Figure 3.5. The first row
shows a set of good quality images whereas the last row shows the images with lots of cuts and
scars. Each image has been enhanced before it was forwarded to the feature (minutiae) extraction
process. Figure 3.6 is showing all the steps through which a sample image is processed.
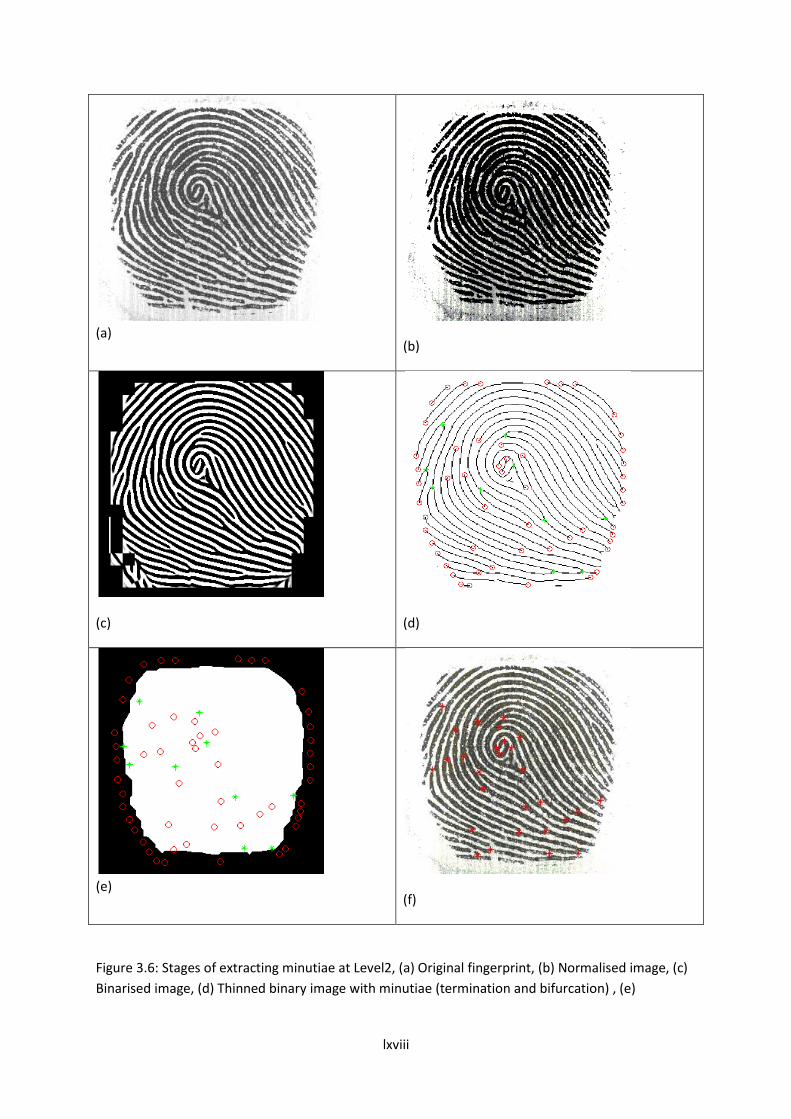
lxviii
(a)
(b)
(c)
(d)
(e)
(f)
Figure 3.6: Stages of extracting minutiae at Level2, (a) Original fingerprint, (b) Normalised image, (c)
Binarised image, (d) Thinned binary image with minutiae (termination and bifurcation) , (e)

lxix
Extracting actual minutiae after applying ROI (region of interest), (f) Original image with actual
minutiae at level2.

lxx
Impression Number of
Termination
Number of Bifurcation Total number of
Minutiae
1
10 19 29
2
10 14 24
3
7 14 21
4
9 14 23
Figure 3.7: Varying number of minutia in different impression from the same finger, which differ in
orientation and position.
As can be seen from Figure 3.7 the number of valid minutiae from the same finger is varying on
numbers and types for different impressions. Any difference in the total number of extracted
minutiae results in non match between the corresponding minutiae of the query and stored
template. When the difference between the total number of extracted minutiae in query and stored
template is higher, the percentage match (PM) is likely to be lower as the distribution of the
minutiae in a fingerprint is considered uniform. Figure 3.8 is showing the normal distribution of
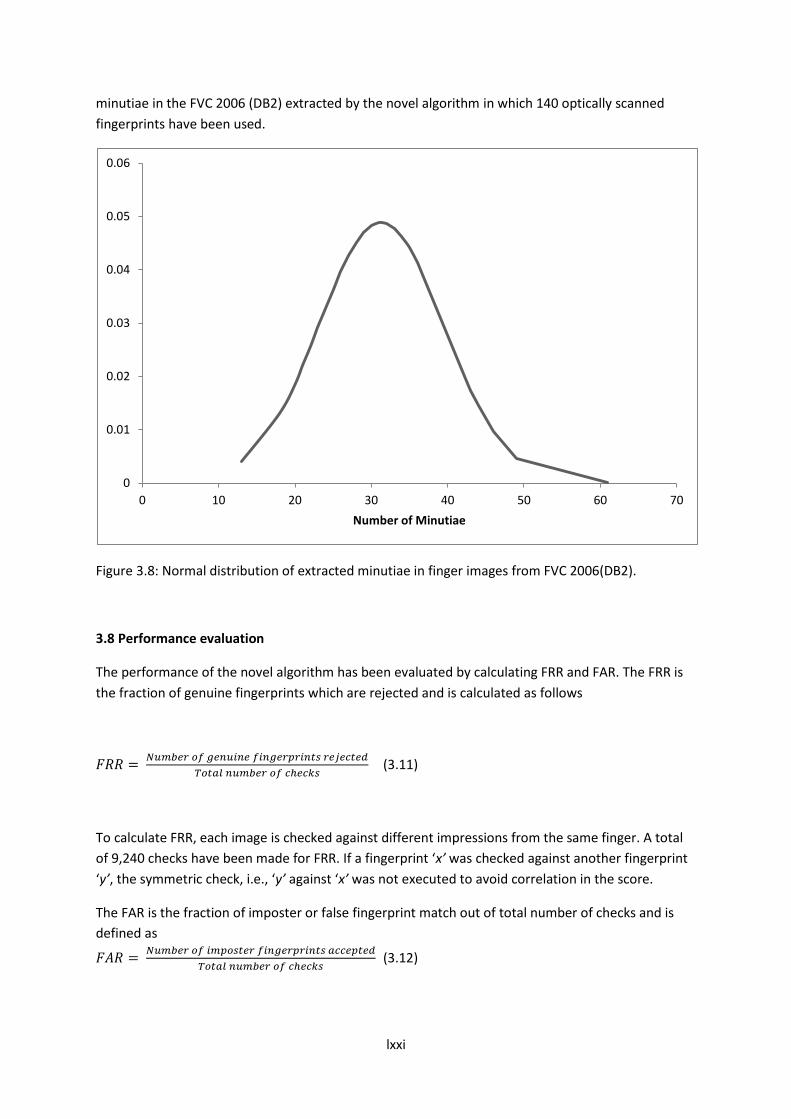
lxxi
minutiae in the FVC 2006 (DB2) extracted by the novel algorithm in which 140 optically scanned
fingerprints have been used.
Figure 3.8: Normal distribution of extracted minutiae in finger images from FVC 2006(DB2).
3.8 Performance evaluation
The performance of the novel algorithm has been evaluated by calculating FRR and FAR. The FRR is
the fraction of genuine fingerprints which are rejected and is calculated as follows
(3.11)
To calculate FRR, each image is checked against different impressions from the same finger. A total
of 9,240 checks have been made for FRR. If a fingerprint ‘x’ was checked against another fingerprint
‘y’, the symmetric check, i.e., ‘y’ against ‘x’ was not executed to avoid correlation in the score.
The FAR is the fraction of imposter or false fingerprint match out of total number of checks and is
defined as
(3.12)
0
0.01
0.02
0.03
0.04
0.05
0.06
0 10 20 30 40 50 60 70
Number of Minutiae

lxxii
Figure 3.9 shows a snapshot of the Matlab function used to calculate FAR and FRR in evaluation of
the algorithm.
Figure 3.9: Matlab function to calculate FAR and FRR
To calculate FAR, the first sample from each finger was checked against the first sample of remaining
fingerprint images in the database and a total of 9,730 checks (fingerprint images) were made.
Again the symmetric match was not executed to avoided correlation in the matching score.
A range of tolerances have been used to observe the performance of the algorithm against
difference thresholds. Table 3.1 summarises the result for EER (%) on different tolerances (α). It can
be seen that the tolerance of 0.15 offers the optimum performance of the novel algorithm with the
minimum EER.
Tolerance, α (%) 5.0 10.0 15.0 20.0
EER (%) 18.2 4.0 3.5 4.6
Threshold (%) 4.8 10.0 25.0 41.0
Table 3.1: EER for a range of tolerances.

lxxiii
If the tolerance is decreased to make the matching more accurate, the number of false rejection
increases. On the other hand, a higher value of tolerance increases the number of false match. As
can be seen from Figure 3.10, the TIAAFR has performed best at α =15% with an EER of 3.5%.
Figure 3.10: Performance of TIAAFR.
Algorithm TIAAFR Cefar Cetp Utwe Diti Ncmi
EER(%) 3.50 4.90 5.06 7.98 23.64 49.11
Table 3.2: Comparison of TIAAFR with other benchmark algorithms [10].
0 10 20 30 40 50 60 70 80 90 1000
10
20
30
40
50
60
70
80
90
100
Matching Threshold
Perc
enta
ge
FAR and FRR Curve w.r.t. Matching Threshold
FRR
FAR
(%)

lxxiv
Table 3.2 shows a comparison of the novel algorithm to other benchmark algorithms. It performs
better than other algorithms and further research is underway to improve EER.
3.9 Performance evaluation of TIAAFR across images from different sensors
In order to evaluate the performance of TIAAFR in terms of sensor interoperability, another publicly
available fingerprint database, ATVS-FFp DB [79], has been used. This database contains fingerprint
samples of the index and middle fingers of both hands of 17 users. Four samples of each fingerprint
have been captured by optical using Biometrica Fx2000 @ 512 dpi, capacitive using Precise 100SC @
500 dpi and thermal using Yubee with Atmel’s Fingerchip @ 500 dpi sensors. This way the dataset
comprises a total of 816 real images (68 fingers x 4 samples/finger x 3 sensors).
Figure 3.11 shows a comparison of images and their extracted minutiae scanned by three different
scanners (capacitive, optical and thermal). As can be seen from this figure, there is a clear difference
between the finger impressions and the number of minutiae. A comparative analysis is also done by
measuring the processing time for minutiae extraction and template formation for each type of
sensor image that can be seen in Table 3.3.

lxxv
Sensor Type Average time for minutiae
extraction from an image
Average time for template
formation of an image
Capacitive 1.79 sec 08.56 msec
Optical 3.67 sec 40.59 msec
Thermal 3.03 sec 19.72 msec
Table 3.3: Comparison of processing times in TIAAFR for images scanned by different sensors
(Capacitive, Optical and Thermal)
Original Image Skeleton image with
extracted minutiae
(real and false)
Minutiae (real and
false) within ROI
Orginal image with
real minutiuae
Cap
acit
ive
Op
tica
l
Ther
mal

lxxvi
Figure 3.11: Comparison of images scanned by different sensors with their processed versions and
extracted minutiae.
As can be seen from Table 3.3 and Figure 3.12, the TIAAFR has performed best on images scanned by
optical sensor and worst on images scanned by thermal sensors. The image quality and the number
of extracted minutiae are the key factors in template formation and matching. A substantial
difference in extracted minutiae, their numbers and corresponding positions can be realised from
Figure 3.12.
(a) Capacitive
(b) Optical
(c) Thermal
Figure 3.12: Comparison of matching performance of TIAAFR across images scanned by different
sensors.
0 10 20 30 40 50 60 70 80 90 1000
10
20
30
40
50
60
70
80
90
100
Matching Threshold
Perc
enta
ge
FAR and FRR Curve w.r.t. Matching Threshold (Capacitive)
FRR
FAR
0 10 20 30 40 50 60 70 80 90 1000
20
40
60
80
100
120
Matching Threshold
Perc
enta
ge
FAR and FRR Curve w.r.t. Matching Threshold (Optical)
FRR
FAR
0 10 20 30 40 50 60 70 80 90 1000
10
20
30
40
50
60
70
80
90
100
Matching Threshold
Perc
enta
ge
FAR and FRR Curve w.r.t. Matching Threshold (Thermal)
FRR
FAR
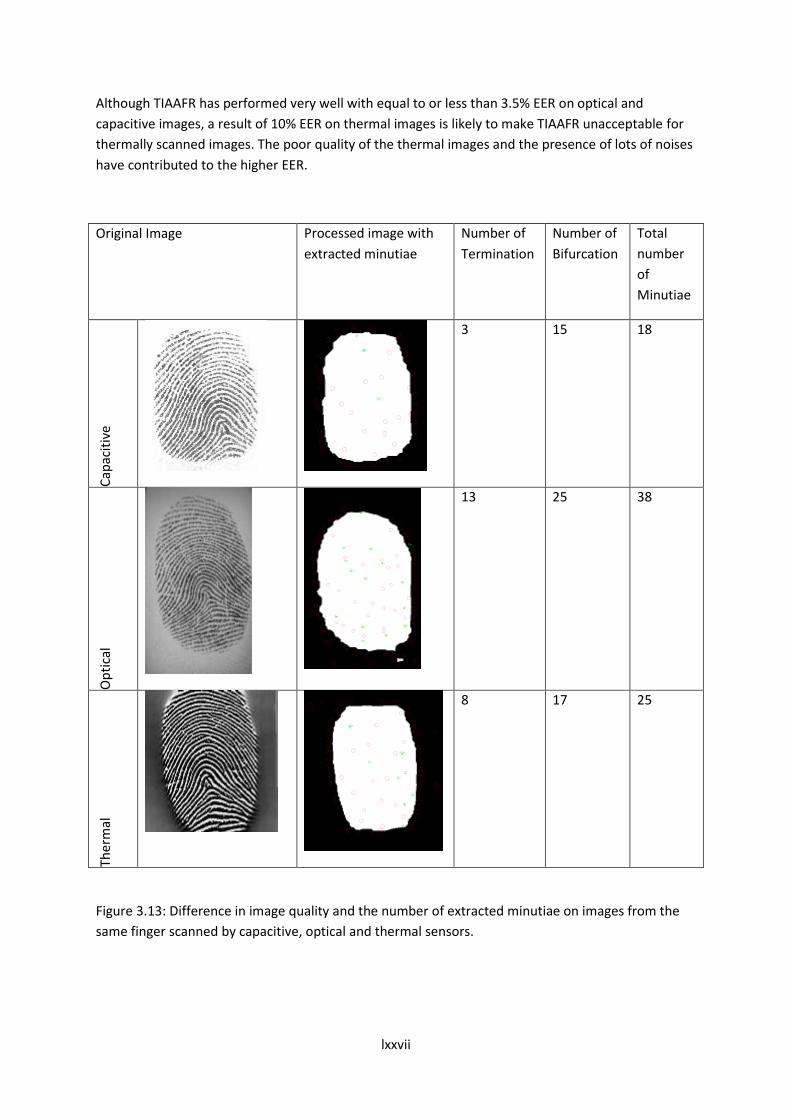
lxxvii
Although TIAAFR has performed very well with equal to or less than 3.5% EER on optical and
capacitive images, a result of 10% EER on thermal images is likely to make TIAAFR unacceptable for
thermally scanned images. The poor quality of the thermal images and the presence of lots of noises
have contributed to the higher EER.
Original Image Processed image with
extracted minutiae
Number of
Termination
Number of
Bifurcation
Total
number
of
Minutiae
Cap
acit
ive
3 15 18
Op
tica
l
13 25 38
Ther
mal
8 17 25
Figure 3.13: Difference in image quality and the number of extracted minutiae on images from the
same finger scanned by capacitive, optical and thermal sensors.

lxxviii
Figure 3.14: Performance of TIAFFR in sensor interoperability (capacitive, optical and thermal).
Another performance check of TIAAFR has also been carried out to see the sensor interoperability
performance of the algorithm. From ATVS-FFp database, 45 images (15 different images with 3
impressions per image (1 optical, 1 capacitive and 1 thermal)) has been randomly picked to form a
small database and matching has been performed across images. Figure 3.14 shows the result of FAR
and FRR in cross platforms in which the EER has resulted at 8%, which is reasonably high. As can be
seen from some good quality sample images in Figure 3.13, there are huge differences in common
areas and the number of valid minutiae across the images. Any appearance of new minutiae or loss
of real minutiae contributes to the low matching scores that are discussed in section 3.8. The
difference between the numbers of minutiae on the same finger has also contributed to the lower
matching score in the calculation of FAR and FRR.
3.10 Summary
The novel algorithm has been designed and tested with publicly available databases to evaluate its
performance. The four element feature vector for each minutia in a fingerprint is constructed using
the attributes of the minutiae and its neighbours. Only the first two nearest neighbour distances and
their internal angle have been taken into consideration as higher number of neighbouring distances
and their internal angles will result into to a higher degree of uncertainty (mismatch) if any of the
higher order distances or angles does not fall in the tolerance box. The other local attributes such as
number of ridge lines between its neighbours as suggested by Jiang and Yau, 2000 [73] have not
0 10 20 30 40 50 60 70 80 90 1000
10
20
30
40
50
60
Matching Threshold
Perc
enta
ge
FAR and FRR Curve w.r.t. Matching Threshold (Cross Platform)
FRR
FAR

lxxix
been taken into consideration because any false or spurious minutia will result in an incorrect
number of ridge lines between two real minutiae. As this novel algorithm is taking only the first two
nearest neighbour distances into account, it is not affected by the distant neighbours and even if
there is a false or missing minutia in any part of the image, it will only affect the limited locality
which is a greater advantage over other algorithm based on structural matching such as template
formed by Delauney Triangulation or the template which uses the core as a reference. In case of non
linear or elastic distortion, the internal angle is likely to be unaffected when the neighbouring
distances are not very small. If the first two nearest neighbours are at the same distance then the
neighbour with the smaller ‘x’ coordinate is considered as the first nearest neighbour.
It has been found that the algorithm has reduced the computation time significantly as it does not
align the query and stored template during the matching process. Any translation or rotation also
does not have any impact on its performance unless the scanned image is unevenly distorted due to
inconsistent contact. Although the simple structure of the novel algorithm saves a lot of
computation time by avoiding image processing overhead, the accuracy might be affected by the
quality of the image where the relative positions of minutiae are severely altered. Also the big
difference in minutiae numbers between the stored and the query template may result in false
match. A number of distance and angle tolerances have been set to optimise the threshold at which
it performs best.
Although this algorithm has performed very well with a 3.5% or less EER on optical and capacitive
images, the performance of the algorithm is not satisfactory on thermal image due to the poor
quality and presence of noise in images. It has also not given a satisfactory result when images on
cross platform have been used to check its interoperability performance. Possible reasons are big
differences in image quality, presence or noise and disparity in image resolution.
However, the usefulness of the algorithm on optical and capacitive images is confirmed in the tests
conducted, which shows a very good performance. The image quality plays an important part in the
quality of the template formation and therefore consistency in fingerprint enrolment, image
resolution and other environmental conditions are suggested for better performance.
lxxx
Conclusion and Recommendation for Future Work
4.1 Conclusion
The main focus of this work has been to develop and test an automated fingerprint recognition
algorithm based on level2 features (minutiae), which can address some issues in some existing
algorithms. As a pre processing step, image enhancement has been performed on all images before
they are passed onto feature extraction stage. The most popular Gabor Filtering technique has been
used in the enhancement process with optimised block size for image orientation and ridge
frequency estimation. The invalid or false minutiae have been removed using some heuristic rules
before the template has been formed.
The test run on 1680 images have shown that the Gabor filter has been able to effectively enhance
the clarity of the ridge structures while reducing noise when accurate estimation of ridge orientation
is combined with ridge frequency. However, for low quality images that exhibit high intensities of
noise, the filter was less effective in smoothing ridge lines due to inaccurate estimation of the
orientation and ridge frequency parameters. Overall, the results have shown that the implemented
enhancement algorithm is a useful step to employ prior to minutiae extraction.
To extract minutiae at level2, the Crossing Number method has been implemented on the skeleton
image. Tests have shown that this method is able to accurately detect all valid bifurcations and ridge
endings from the thinned image. However, there were cases where the extracted minutiae did not
correspond to valid minutia points. Hence, image post processing stage was implemented to validate
the minutiae. The test results from the minutiae validation algorithm indicate that this additional
post processing stage has been effective in eliminating various types of false minutiae structures.
In this novel algorithm the template has been formed using the local attributes of each minutia. The
tolerance for both the distance and the angle has been optimised to address non linear and elastic
distortion. The avoidance of some other local characteristics such as ridge numbers between
adjacent minutiae has made the structure more robust against any spurious minutia that may arise
from noise. Also the computation requirement is reduced significantly as the matching process does
not require any pre alignment between the stored and the query template.
Unlike other geometry based template, this novel structure does not store the actual coordinates
and the orientation of the minutiae, which may pose a threat to identity loss if the template is lost or
stolen. The multidimensional feature vector completely based on local attributes has made the
template cancellable, which is another key advantage of this algorithm in security enhancement.

lxxxi
In cross platform environment, this algorithm has performed well, in particular for optical and
capacitive scanned images. However, the performance on thermal scanned images was not
satisfactory due to poor image qualities and disparity in image resolution. Also the difference in
threshold for optical and capacitive scanned images indicates that its effectiveness can be affected
by the number of valid minutiae on the image itself.

lxxxii
4.2 Recommendation for future work
In order to enhance the efficiency of the novel algorithm for more accurate fingerprint identification,
further work needs to be carried out as follows:
Although the Gabor filter has been successfully used to enhance all the images, in particular, it has
been very useful in enhancing poor quality images, but any error in local frequency estimation or
ridge orientation will result in false or spurious minutiae and consequently results in high FAR and
FRR. Therefore, an investigation is required into a filter whose primary aim is to specifically enhance
the minutiae along with the ridge structure.
In the design of the novel algorithm, the global feature such as finger type has not been taken into
consideration. Global pattern such as loop, whorl, arch etc are used for fingerprint indexing and they
can reduce the search time substantially during identification process. A number of established
algorithms have embedded the global feature in the matching process to improve their matching
score. It would have given a better matching score and significantly reduced the false matching (FAR)
had the global features embedded into the feature vector to categorise the template.
The elastic or non linear distortion can always affect the performance of any algorithm so it has done
on the novel algorithm. Inconsistent pressure on the scanner by the user can result in incoherent
stretching or contraction, which may cause uneven scaling on neighbouring distances and their
internal angles. Further work needs to be done to accommodate the non linear and elastic distortion
in the formation of the feature vector.
The algorithm has been tested on the images scanned by optical sensors but to evaluate its
performance more it can be tested on images scanned by other types of sensors such as capacitive,
thermal or radio frequency sensors. Images taken at different resolution and different size can also
be an issue for this algorithm. Therefore, more research needs to be done if the novel algorithm is to
work across multi vendor platforms where images are taken using different sensors with different
image resolution.

lxxxiii
References
[1] A. K. Jain; F. Jianjiang and K. Nandakumar, "Fingerprint Matching," Computer Vision and Pattern
Recognition , IEEE Computer Society , vol.43, no.2, pp.36-44, Feb. 2010, doi: 10.1109/MC.2010.38
[2] http://www.globalsecurity.org/security/systems/biometrics.htm accessed on 03 November 2011
[3] http://biometrics.pbworks.com accessed on 10 February 2012
[4] http://www.biometrics.gov accessed on 21 January 2011
[5] http://www.bccresearch.com/report/biometrics-global-market-ift042b.html accessed on 09
December 2011.
[6] S. Memon; N. Manivannan; A. Noor and C. Tigli, “Fingerprint Biometrics for Identity
management,” International Journal of Industrial Engineering and Management (IJIEM), vol2, no 2,
pp 39-44, 2011.
[7] N. K. Ratha; J. H. Connell and R. M. Bolle, “Enhancing security and privacy in biometrics-based
authentication systems”, IBM Systems Journal, vol. 40, no. 3, pp. 614-634, 2001.
[8] S. Memon; N. Manivannan; A. Noor and C. Tigli,“Automatic detection of Active Sweat Pores of
fingerprint using high-pass and correlation filtering”, Electronic Letters, Vol. 46, No 18, pp. 1268-
1269, 2010.
[9] A. K. Jain; L Hong; S. Pankanti and R. Bolle, “An identity authentication system using fingerprints,”
Proceedings of the IEEE, vol. 85, no. 9, pp.1365-1388, 1997.
[10] M. A. Dabbah; W. L. Woo and S. S. Dlay, “Computationally Efficient Fingerprint Algorithm for
Automatic Recognition,” Proceedings of the 5th WSEAS Int. Conf. on SIGNAL, SPEECH and IMAGE
PROCESSING, Corfu, Greece, pp. 90-95, Aug 17-19, 2005.
[11] L. Hong; Y. Wan and A. K. Jain, “Fingerprint image enhancement: Algorithm and performance
evaluation”, IEEE Transactions on Pattern Analysis and Machine Intelligence, vol. 20, no. 8, pp. 777–
789, 1998.
[12] D. Gabor, “Theory of communication,” Journal of the Institute of Electrical Engineers, vol. 93,
pp. 429–457, 1946
[13] Jean-François Mainguet, Fingerprint Biometrics (2009, 02 October) [online], Available:
http://fingerchip.pagesperso-orange.fr/biometrics/types/fingerprint.htm
[14] A. K. Jain; Y. Chen and M. Demirkus, “Pores and Ridges: Fingerprint Matching Using Level 3
Features”, Pattern recognition, 18th International Conference on Pattern Recognition (ICPR), vol. 4,
pp, 477-480. ICPR 2006.
[15] NIST Special Publication 500-271, ANSI/NIST-ITL 1-2007 (2008, 17 March), [online] Available:
http://www.nist.gov/itl/ansi/upload/Approved-Std-20070427-2.pdf

lxxxiv
[16] D. Maltoni; D. Maio; A. K. Jain and S. Prabhakar, “Handbook of Fingerprint Recognition”,
Springer-Verlag London Limited 2009.
[17] D. Maio and D. Maltoni, “Direct gray-scale minutiae detection in fingerprints,” IEEE Trans.
Pattern Analysis Machine Intelligence, vol. 19, no 1, pp 27-40, 1997.
[18] N. Ratha; S. Chen and A. K. Jain, “Adaptive flow orientation based feature extraction in
fingerprint image,” Pattern Recognition vol. 28, no. 11, pp. 1657–1672, 1995.
[19] S. Kasaei and B. Boashash, “Fingerprint feature extraction using block-direction on
reconstructed images,” In IEEE region TEN Conf. digital signal Processing applications, TENCON, pp.
303–306, Dec 1997.
[20] D. Simon-Zorita; J. Ortega-Garcia; S. Cruz-Llanas and J. Gonzalez-Rodriguez, “Minutiae extraction
scheme for fingerprint recognition systems,” In Proceedings of the International Conference on
Image Processing, vol. 3, pp. 254–257, Oct 2001.
[21] R. Thai, “Fingerprint Image Enhancement and Minutiae Extraction”, BSc (Honours) Project,
University of Western Australia, Australia, 2003.
[22] S. Prabhakar; J. Wang; A. K. Jain; S. Pankanti and R. Bolle., “Minutiae verification and
classification for fingerprint matching,” In Proc. 15th International Conference Pattern Recognition
(ICPR), vol. 1, pp. 25–29, Sep 2000.
[23] A. Ross; A. K. Jain and J. Reisman, “A hybrid fingerprint matcher,” Pattern Recognition, vol. 36,
no 7, pp.1661–1673, Jul 2003.
[24] A. K. Jain; S. Prabhakar and L. Hong, “A multichannel approach to fingerprint classification,” IEEE
Transactions on Pattern Analysis and Machine Intelligence, vol. 21, no. 4, pp. 348–359, 1999.
[25] D. B. G. Sherlock; D. M. Monro and K. Millard, “Fingerprint enhancement by directional Fourier
filtering,” In IEE Proc. Vis. Image Signal Processing, vol. 141, pp. 87–9, 1994.
[26] I. Sobel, “An Isotropic 3×3 Gradient Operator, Machine Vision for Three – Dimensional Scenes,”
Freeman, H., Academic Pres, NY, 376-379, 1990.
[27] A. K. Jain, and F. Farrokhnia, “Unsupervised texture segmentation using Gabor filters,” IEEE
Pattern Recognition, vol24, no. 12, pp. 167–186, 1991.
[28] Z. Guo and R. W. Hall, “Parallel thinning with two-subiteration algorithms,” Communications of
the ACM 32, vol. 3, pp. 359–373, Mar 1989.
[29] J. C. Amengual; A. Juan; J. C. Prez; F. Prat; S. Sez and J. M. Vilar, “Real-time minutiae extraction
in fingerprint images”. In Proc. of the 6th Int. Conf. on Image Processing and its Applications, pp.
871–875, Jul 1997.
[30] B. M. Mehtre, “Fingerprint image analysis for automatic identification,” Machine Vision and
Applications vol. 6, no. 2 pp. 124–139, 1993.
lxxxv
[31] H Tamura, “A comparison of line thinning algorithms from digital geometry viewpoint”, Proc. of
the 4th Int. Conf. on Pattern Recognition, pp. 715–719, 1978.
[32] Q. Xiao and H. Raafat, “Fingerprint image post processing: a combined statistical and structural
approach,” Pattern Recognition, vol. 24, no. 10, pp. 985–992, 1991.
[33] M. Tico, and P. Kuosmanen, “An algorithm for fingerprint image post processing,” In
Proceedings of the Thirty-Fourth Asilomar Conference on Signals, Systems and Computers, vol. 2, pp.
1735–1739, Nov 2000.
[34] J. Qi; S. Yang and Y. Wang, “Fingerprint matching combining the global orientation field with
minutia”, Pattern Recognition Letters, vol. 26, pp. 2424-2430, 2005
[35] D. Maltoni, “A Tutorial on Fingerprint Recognition”, Biometric Systems Laboratory - DEIS -
University of Bologna, via Sacchi 3, 47023, Cesena (FC) – Italy.
[36] K.M. Kryszczuk; P. Morier and A. Drygajlo, “Study of the Distinctiveness of Level 2 and Level 3
Features in Fragmentary Fingerprint Comparison,” in Proc. Workshop on Biometric Authentication (in
ECCV 2004), LNCS 3087, pp. 124–133, 2004.
[37] R. Ahuja; T. Magnanti and J Orlin, “Network Flows,” Prentice-Hall, Upper Saddle River, NJ, 1993.
[38] T. Y. Jea and V. Govindaraju, “A minutia-based partial fingerprint recognition system,” Pattern
Recognition, vol. 38, no. 10, pp. 1672–1684, 2005.
[39] C. Wang; M. Gavrilova; Y. Luo and J. Rokne, “An Efficient Algorithm for Fingerprint Matching,” in
Proc. Int. Conf. On Pattern Recognition (18th), vol. 1, pp. 1034–1037, 2006.
[40] S. Umeyama, “Least-square estimation of transformation parameters between two point
patterns,” IEEE Transactions on Pattern Analysis Machine Intelligence, vol. 13, no. 4, pp. 76–380,
1991.
[41] S. H. Chang; F. H. Cheng; W. H. Hsu and G. Z. Wu, “Fast algorithm for point pattern matching:
Invariant to translations, rotations and scale changes,” Pattern Recognition, vol. 30, pp. 311–320,
1997.
[42] S. Huvanandana; C. Kim and J. N. Hwang, “Reliable and Fast Fingerprint Identification for
Security Applications,” in Proc. Int. Conf. on Image Processing, 2000.
[43] Y. He; J. Tian; Q. Ren and X. Yang, “Maximum-Likelihood Deformation Analysis of Different-Sized
Fingerprints,” in Proc. Int. Conf. on Audio- and Video-Based Biometric Person Authentication (4th),
pp. 421–428, 2003b.
[44] J. Chen; F. Chan and Y. S. Moon, “Fingerprint Matching with Minutiae Quality Score,” in Proc.
Int. Conf. on Biometrics, LNCS 4642, pp. 663–672, 2007
[45] H. Srinivasan; S. N. Srihari; M. J. Beal; P. Phatak and G. Fang, “Comparison of ROC-Based and
Likelihood Methods for Fingerprint Verification,” in Proc. SPIE Conf. On Biometric Technology for
Human Identification III, 2006.

lxxxvi
[46] J. Jia , L. Cai; P. Lu and X. Lu, “Fingerprint matching based on weighting method and the SVM,”
Neurocomputing, vol. 70, no. 4–6, pp. 849–858, 2007b.
[47] J. Feng, “Combining minutiae descriptors for fingerprint matching,” Pattern Recognition, vol. 41,
no. 1, pp. 342–352, 2008.
[48] A. Lumini A. and L. Nanni, “Advanced methods for two-class pattern recognition problem
formulation for minutiae-based fingerprint verification,” Pattern Recognition Letters, vol. 29, no. 2,
pp. 142–148, 2008.
[49] P. Mansukhani; S. Tulyakov and V. Govindaraju, “Using Support Vector Machines to Eliminate
False Minutiae Matches During Fingerprint Verification,” in Proc. SPIE Conf. on Biometric Technology
for Human Identification IV, 2007.
[50] P. Mansukhani and V. Govindaraju, “Selecting Optimal Classification Features for SVM-Based
Elimination of Incorrectly Matched Minutiae,” in Proc. SPIE Conf. on Biometric Technology for Human
Identification V, 2008.
[51] C. Neumann; C. Champod; R. Puch-Solis; N. Egli; A. Anthonioz; D. Meuwly and A. Bromage-
Griffiths, “Computation of Likelihood Ratios in Fingerprint Identification for Configurations of Three
Minutiae,” in Proc. Journal of Forensic Sciences, vol. 51, no. 6, pp. 1255–1266, 2006.
[52] A. M. Bazen and R. N. J. Veldhuis, “Likelihood-ratio-based biometric verification,” IEEE
Transaction on Circuits and Systems for Video Technology, vol. 14, no. 1, pp. 86–94, 2004.
[53] A. Bishnu; S. Das; S. C. Nandy and B. B. Bhattacharya, “Simple algorithms for partial point set
pattern matching under rigid motion,” Pattern Recognition, vol. 39, no. 9, pp. 1662–1671, 2006.
[54] R. Udupa; G. Garg and P. Sharma, “Fast and Accurate Fingerprint Verification,” in Proc. Int. Conf.
on Audio- and Video-Based Biometric Person Authentication (3rd), pp. 192–197, 2001
[55] D. H. Ballard, “Generalizing the Hough transform to detect arbitrary shapes,” Pattern
Recognition, vol. 3, no. 2, pp. 110–122, 1981
[56] G. Stockman; S. Kopstein and S. Benett, “Matching images to models for registration of and
object detection via clustering,” IEEE Transactions on Pattern Analysis Machine Intelligence, vol. 4,
no. 3, pp. 229–241, 1982.
[57] N. K. Ratha; K. Karu; S. Chen and A. K. Jain, “A real-time matching system for large fingerprint
databases,” IEEE Transactions on Pattern Analysis Machine Intelligence, vol. 18, no. 8, pp. 799–813,
1996.
[58] A. Rosenfeld and A. Kak, “Digital Picture Processing,” Academic, New York, 1976
[59] A. Ranade and A. Rosenfeld, “Point pattern matching by relaxation,” Pattern Recognition, vol.
12, no. 2, pp. 269–275, 1993.
[60] J. Ton and A. K. Jain, “Registering landsat images by point matching,” IEEE Transaction
Geoscience Remote Sensing, vol. 27, no. 5, pp. 642–651, 1989.
lxxxvii
[61] H. Baird, “Model Based Image Matching Using Location,” MIT Press, Cambridge, MA, 1984.
[62] K. G. Murty, Network programming, Prentice-Hall, Englewood Cliffs, NJ, 1992.
[63] S. Gold and A. Rangarajan, “A graduated assignement algorithm for graph matching,” IEEE
Transactions on Pattern Analysis Machine Intelligence, vol. 18, no. 4, pp. 377– 388, 1996.
[64] C. Oh and Y. K. Ryu, “Study on the center of rotation method based on minimum spanning tree
matching algorithm for fingerprint recognition,” Optical Engineering, vol. 43, no. 4, pp. 822–829,
2004.
[65] N. Ansari; M. H. Chen and E. S. H. Hou, “A genetic algorithm for point pattern matching,” in
Dynamic Genetic and Chaotic Programming, B. Souckec and IRIS group (Eds.), Wiley, New York, 1992.
[66] L. H. Zhang; W. L. Xu and C. Chang, “Genetic algorithm for affine point pattern matching,”
Pattern Recognition Letters, vol. 24, no. 3, pp. 9–19, 2003.
[67] J. P. P. Starink and E. Backer, “Finding point correspondence using simulated annealing,” Pattern
Recognition, vol. 28, no. 2, pp. 231–240, 1995.
[68] T. V. Le; K. Y. Cheung and M. H. Nguyen, “A Fingerprint Recognizer Using Fuzzy Evolutionary
Programming,” in Proc. Int. Conf. on System Sciences, 2001.
[69] X. Tan and B. Bhanu, “Fingerprint matching by genetic algorithms,” Pattern Recognition, vol. 39,
no. 3, pp. 465–477, 2006.
[70] W. Sheng; G. Howells; M. C. Fairhurst and F. Deravi, “A memetic fingerprint matching
algorithm,” IEEE Transactions on Information Forensics and Security, vol. 2, no. 3, pp. 402–412,
2007.
[71] Z Chen and C. H. Kuo, “A Topology-Based Matching Algorithm for Fingerprint Authentication,” in
Proc. Int. Carnahan Conf. on Security Technology (25th), pp. 84–87, 1991
[72] A. Hrechak and J. McHugh, “Automated fingerprint recognition using structural matching,”
Pattern Recognition, vol. 23, no. 8, pp. 893–904, 1990
[73] X. Jiang and W. Y. Yau, “Fingerprint Minutiae Matching Based on the Local and Global
Structures,” in Proc. Int. Conf. on Pattern Recognition (15th), vol. 2, pp. 1042–1045, 2000
[74] A. Wahab; S. H. Chin and E. C. Tan, “Novel approach to automated fingerprint recognition,” IEE
Proceedings Vision Image and Signal Processing, vol. 145, no. 3, pp. 160–166, 1998.
[75] A. K. Jain; L. Hong and R. Bolle, “On-line fingerprint verification,” IEEE Transactions on Pattern
Analysis Machine Intelligence, vol. 19, no. 4, pp. 302–313, 1997.
[76] A. Almansa and L. Cohen, “Fingerprint Image Matching by Minimization of a Thin-Plate Energy
Using a Two-Step Iterative Algorithm with Auxiliary Variables,” in Proc. Workshop on Applications of
Computer Vision, pp. 35–40, 2000.

lxxxviii
[77] A. M. Bazen and S. H. Gerez, “Systematic methods for the computation of the directional fields
and singular points of fingerprints,” IEEE Transactions on Pattern Analysis Machine Intelligence, vol.
24, no. 7, pp. 905–919, 2002.
[78] C. Wang and M. L. Gavrilova, “Delaunay Triangulation Algorithm for Fingerprint Matching”,
Proceedings of the 3rd International Symposium on Voronoi Diagrams in Science and Engineering,
IEEE Computer Society Washington, DC, USA ©2006 (ISVD’06).
[79] Z. M. Kov´acs-Vajna. A fingerprint verification system based on triangular matching and dynamic
time warping. IEEE Trans. on PAMI, 22(11):1266–1276, 2000.
[80] http://bias.csr.unibo.it/fvc2006/databases.asp accessed in March 2012
lxxxix
Appendix A
List of publications
1. Noor A., Manivanan N., Balachandran W, “Transformation invariant algorithm for automatic
fingerprint recognition (TIAAFR)”, Electronic Letters, the IET (submitted for publication).
2. Memon S., Manivannan N., Noor A., Tigli C., “Security Issues in Automated Fingerprint
Identification Systems”, Bahria University Journal of Information & Technology, Vol 4, Issue 1, August
2011.
3. Manivannan N., Noor A., Tigli C., Memon Shahzad., “Fingerprint Biometrics for Identity
management”, International Journal of Industrial Engineering and Management (IJIEM), Vol2, No 2,
pp 39-44, 2011.
4. Memon S., Manivannan N., Noor A., Balachadran W., Boulgouris N. V., “Fingerprint Sensors:
Liveness Detection Issue and Hardware based Solutions”, Vol 136, Issue 1 , pp 35-49. January 2012.