a neural network video sensor application for rail … rail program a neural network video sensor...
TRANSCRIPT
High-Speed Rail Program
A Neural Network Video Sensor Application for Rail Crossing Safety Final Report for HSR-IDEA Project 10 Douglas L. Reilly, Nestor Traffic Systems, Inc. Providence, RI December 2001
T R A N S P O R T A T I O N R E S E A R C H B O A R D ● N A T I O N A L R E S E A R C H C O U N C I L
INNOVATIONS DESERVING EXPLORATORY ANALYSIS (IDEA) PROGRAMS MANAGED BY THE TRANSPORTATION RESEARCH BOARD This investigation by Nestor Traffic Systems, Inc., Providence, RI was performed as part of the High-Speed Rail IDEA program, which fosters innovative methods and technology in support of the Federal Railroad Administration’s (FRA) next-generation high-speed rail technology development program.
The High-Speed Rail program is one of four IDEA programs managed by TRB. The other IDEA programs are listed below. • NCHRP Highway IDEA, which focuses on advances in the design, construction,
safety, and maintenance of highway systems, is part of the National Cooperative Highway Research Program.
• Transit IDEA focuses on development and testing of innovative concepts and methods for improving transit practice. The Transit IDEA Program is part of the Transit Cooperative Research Program, a cooperative effort of the Federal Transit Administration (FTA), the Transportation Research Board (TRB) and the Transit Development Corporation, a nonprofit educational and research organization of the American Public Transportation Association. The program is funded by the FTA and is managed by TRB.
• Safety IDEA focuses on innovative approaches to improving motor carrier, railroad, and highway safety. The program is supported by the Federal Motor Carrier Safety Administration and the FRA.
Management of the four IDEA programs is integrated to promote the development and testing of nontraditional and innovative concepts, methods, and technologies for surface transportation. For information on the IDEA programs, contact the IDEA programs office by telephone (202-334-3310); by fax (202-334-3471); or on the Internet at http://www.trb.org/idea IDEA Programs Transportation Research Board 500 Fifth Street, NW Washington, DC 20001
The project that is the subject of this contractor-authored report was a part of the Innovations Deserving Exploratory Analysis (IDEA) Programs, which are managed by the Transportation Research Board (TRB) with the approval of the Governing Board of the National Research Council. The members of the oversight committee that monitored the project and reviewed the report were chosen for their special competencies and with regard for appropriate balance. The views expressed in this report are those of the contractor who conducted the investigation documented in this report and do not necessarily reflect those of the Transportation Research Board, the National Research Council, or the sponsors of the IDEA Programs. This document has not been edited by TRB.
The Transportation Research Board of the National Academies, the National Research Council, and the organizations that sponsor the IDEA Programs do not endorse products or manufacturers. Trade or
f ' h i l l b h id d i l h bj f h
i
EXECUTIVE SUMMARY This is the Final Report to the Transportation Research Board’s IDEA (Innovations Deserving Exploratory Analysis) Program Office for Project HSR-IDEA Project 10, A Neural Network Video Sensor Application for Railroad Crossing Safety. This project was undertaken by Nestor Traffic Systems, Inc. (NTS) of Providence, RI. The principal investigator for the project was Dr. Douglas L. Reilly, Ph.D., Nestor’s Senior Vice President for Strategic Analysis and Technology. The objective of the project was to demonstrate the feasibility of using advanced video image processing to automatically monitor vehicle, train and signalization activity at highway rail intersections to detect grade crossing activity that can be used to monitor grade crossing risk. Among the project conclusions presented in this Final Report are …
Nestor has produced a software/hardware demonstration of an intelligent video-based monitoring system that can perform real-time processing of video images of grade crossings to detect and log vehicle presence on the tracks, train arrival and departure from the crossing and the status of grade crossing signalization (gate arms up/down and signal lights flashing or off).
Nestor has demonstrated the feasibility of performing system setup and configuration for automated grade crossing video processing using an easy-to-use graphical user interface, facilitating deployment of the system for grade crossing monitoring.
Nestor has developed a set of deployment guidelines dealing largely with camera placement as well as lighting issues at the crossing. These guidelines can help ensure an appropriate field of view and image quality for reliable, round-the-clock crossing monitoring.
Drawing upon the knowledge of experts in grade crossing safety, Nestor has identified several categories of applications for using video monitoring to improve grade crossing safety. These categories are 1) systems for collecting operational data on grade crossing utilization by vehicles and trains, as well as the operation of the grade crossing signalization system; 2) video-based enforcement systems to detect, identify and cite vehicles violating the grade crossing signals; and, finally, 3) opportunities for using video monitoring to affect local grade crossing alarms and signalization (both at and nearby the crossing) as a means of identifying in real-time and responding to immediate situations of high risk at the crossing.
The grade crossing events that can be detected by the video monitoring system described in this document, together with information that can be derived from them (e.g., train speed, average time vehicles are stopped on tracks, etc.) can be used to assess patterns of crossing use by vehicles and trains as well as the integrity of crossing signalization. This information is critical in both detecting specific instances of dangerous grade crossing activity as well as in assessing the overall risk at the crossing and the factors contributing to it.
This report describes the objectives and major tasks of the project. Among these was an Expert Panel meeting convened at the outset of the project, assembling a number of experts on grade crossing safety from the FRA, state DOT’s, representatives of the railroad and law enforcement communities and leading research organizations. This panel developed a number of application opportunities for using video-based grade crossing monitoring to improve grade crossing safety. Nestor documented the findings of this meeting in an Interim Project Report which is included as an Appendix to this report.
This report also documents the performance of the demonstration system as tested on samples of video data collected throughout the course of the project from nine different crossings in four different states. The crossings represented a variety of track geometries, vehicle and train usage patterns and signalization equipment (e.g., standard and quad gate arms) and visibility conditions. The tests were conducted on samples of this video data, ground-truthed by human observers to establish vehicle, train and signalization events. The test results
ii
demonstrate the feasibility of using this video monitoring technology to detect the target events. The report also discusses deployment factors that can affect system performance, most notably the location of cameras at the crossing and the role of crossing illumination. The report identifies areas where additional detection algorithm development work is required. This work is ongoing in preparation for a field-deployment of the system.
This project was not able to evaluate detection performance on all crossing events or under all visibility conditions. In particular, the grade crossing video data collected did not contain sufficient examples of foul weather conditions (fog, rain and snow) to report on systematic performance under the reduced visibility conditions that are caused by these weather factors. Furthermore, the detection of some categories of crossing events (e.g., broken gate arms) could not be tested since there were no examples of these conditions in the collected video data. However, in a follow-up to this project, the Rail CrossingGuard system is being installed at a number of grade crossings in the South Florida area. This will provide the opportunity to evaluate the system’s performance on the full range of crossing events and over a long enough time period as to make possible an evaluation of detection performance under a more complete range of weather-related visibility conditions.
Nestor will market a product, Rail CrossingGuard™, based on the capabilities demonstrated in this IDEA project. This report describes the Rail CrossingGuard product family for grade crossing characterization, grade crossing enforcement and real-time warning for signalization and control.
Following the successful conclusion of this IDEA project, Nestor will install Rail CrossingGuard for pilot tests at a number of crossings in Florida and Illinois. A description of these pilot installations and their capabilities is included in this report.
A videotape demonstration of the capabilities of the Rail CrossingGuard system described in this report is under development. Those interested in obtaining a copy of this videotape should contact Nestor at
Nestor Traffic Systems, Inc. One Richmond Square Providence, RI 02906 Phone: 401-331-9640 Fax: 401-331-7319 Internet: www.nestor.com Attn: Carolyn Beaudry
iii
ACKNOWLEDGEMENTS Nestor wishes to acknowledge the support of a number of organizations and individuals in this project. Chief among them are Mr. Robert McCown of the FRA, Dr. K. Thirumali of the IDEA Program Office and Mr. William Browder of the Association of American Railroads (AAR).
Mr. McCown has been an invaluable source of information and contacts at the project outset, both critical to successfully launching the project and generating visibility for it within the grade crossing safety community. As a member of the Project’s Expert Panel meeting, he provided extremely helpful suggestions for the use of video monitoring systems to improve grade crossing safety.
Dr. Thirumali, the former head of the IDEA Program Office, provided the initial vision for the project and helped shape the project’s outreach to industry for guidance and support. Mr. Charles Taylor, assisted by Mr. Keith Gates of the IDEA Program Office, have provided helpful project direction and guidance.
Mr. William Browder, Association of American Railroads, was a member of both the Expert Panel and the project Technical Advisory Panel. He provided a wealth of information on the railroad industry and rail contacts during the course of the project. He helped identify opportunities for data collection as well as individuals in the rail industry with a special interest in grade crossing issues.
Nestor would like to thank the members of the Project Technical Advisory Panel, in particular Mr. Ronald Ries of the FRA who agreed to serve as Panel Chair. Other members of the Panel whom we wish to thank for their participation, review and guidance of the project include Ms. Anne Brewer of the Florida State DOT, Mr. William Browder of the Association of American Railroads, Ms. Anya Carroll of the Volpe Center, Mr. Haji Jameel of the California Public Utilities Commission and Mr. Dennis Hamblet of the Washington State DOT.
Additionally, Nestor wishes to acknowledge and thank those who participated in the Grade Crossing Safety Expert Panel meeting that occurred at the outset of the project. In addition to the members of our Technical Advisory Panel, these include Ms. Anna Barry of the MBTA, Dr. Selwyn Berg of the IDEA Program office, Mr. Michael Coltman of the Volpe Center, Mr. Robert DelCore of the IACP, Mr. Vijay Khawani of the LACMTA, Mr. Robert McCown of the FRA, Mr. Peter Montague of the FRA, Ms. Lorraine Pacocha of the MBTA, Ms. Debra Williams of the Volpe Center, Mr. Kenneth Wood of the Illinois State DOT, Ms. Linda Woodson of Amtrak and Mr. Paul Worley of the North Carolina State DOT.
Finally, the gathering of video data for this project could not have been accomplished without the special support, cooperation and assistance of a number of organizations and individuals. In particular, Nestor would like to thank the following for their support of this effort:
For support of data collection at Los Angeles 124th St. crossing, Mr. Vijay Khawani, Los Angeles Metropolitan Transit Authority.
For support of data collection at Mystic, CT School St. crossing: Ms. Debra Williams, Volpe Transportation Systems Center, Ms. Anya Carroll, Volpe Transportation Systems Center, Amtrak, Connecticut DOT.
For support of data collection from Washington State crossings at University Blvd, Kent and Everett: Mr. Ron Ries, Federal Railroad Administration, Mr. Jeffrey Schultz, Washington DOT, Mr. Jeffrey Webber, Transpo Group, Mr. Bob Brueggeman, Spokane County Public Works Department.
iv
For support of data collection at the Barberville, FL site: Professor Ken Courage, University of Florida, Florida DOT
For support of data collection at the 17th Ave., Summit Blvd. and 54th St crossings in South Florida: Ms. Anne Brewer, Florida DOT, Mr. H. Michael Dowell, Florida DOT, Mr. Ed Radson, Florida DOT, ATC Systems Integrators.
Additionally, Nestor would like to thank those who supported this project by providing copies of video data previously collected, even though this data proved to be unusable for our project. In this regard we would like to thank Mr. Richard McDonough of New York DOT and Ms. Kay Fitzpatrick and Paul J. Carlson of Texas Transportation Institute.

v
TABLE OF CONTENTS
EXECUTIVE SUMMARY ........................................................................................................ I
ACKNOWLEDGEMENTS......................................................................................................III
TABLE OF CONTENTS.......................................................................................................... V
LIST OF FIGURES ..............................................................................................................VII
LIST OF TABLES ................................................................................................................VII
LIST OF ABBREVIATIONS................................................................................................ VIII
1 INTRODUCTION ............................................................................................................ 1
2 PROJECT DESCRIPTION ............................................................................................... 4 2.A Objectives ....................................................................................................................................... 4 2.B Project Milestones/Major Tasks...................................................................................................... 4
2.B.1 Expert Panel Meeting.............................................................................................................. 4 2.B.2 Data Collection ....................................................................................................................... 6 2.B.3 Software Development.......................................................................................................... 10 2.B.4 Interim Meeting of Project Technical Advisory Panel.......................................................... 10 2.B.5 Final Development & Testing............................................................................................... 11 2.B.6 Demonstration & Final Report.............................................................................................. 12
3 PROTOTYPE CAPABILITIES........................................................................................ 13 3.A Graphical User Interface (GUI) for System Setup........................................................................ 13 3.B Event Logging............................................................................................................................... 13
3.B.1 Base Level Events................................................................................................................. 14 3.B.2 Derived Events...................................................................................................................... 14 3.B.3 Alarms................................................................................................................................... 14
3.C Event Detection............................................................................................................................. 15 3.C.1 Detection Objectives ............................................................................................................. 15 3.C.2 Untested Conditions.............................................................................................................. 16 3.C.3 Ground Truth Data................................................................................................................ 17 3.C.4 Detection Results .................................................................................................................. 18 3.C.5 Follow-up On Issues Raised at Interim Meeting of Technical Advisory Panel .................... 22 3.C.6 Additional Detected Events/Conditions................................................................................ 25
4 DEPLOYMENT ISSUES................................................................................................. 27 4.A Self-diagnosis of camera image quality ........................................................................................ 27 4.B Cameras ........................................................................................................................................ 28
4.B.1 Camera Types ....................................................................................................................... 28 4.B.2 Camera Locations ................................................................................................................. 28
4.C Lighting Considerations at the Crossing....................................................................................... 32 4.D Deployment Costs ......................................................................................................................... 33
5 TRANSITION FROM PROTOTYPE TO FIELD TESTS..................................................... 34 5.A Software Productization................................................................................................................ 34

vi
5.B System Components...................................................................................................................... 34 5.B.1 TrackSide Station.................................................................................................................. 34 5.B.2 Rail CrossingGuard ServerNT.............................................................................................. 35 5.B.3 Rail CrossingGuard FieldMonitor ........................................................................................ 35 5.B.4 Cameras................................................................................................................................. 35 5.B.5 Communications ................................................................................................................... 36
5.C Overview of Rail CrossingGuard Product Family ........................................................................ 36 5.D Pilot Installations: Florida and Illinois.......................................................................................... 37
5.D.1 Rail CrossingGuard Monitoring and Enforcement in South Florida .................................... 37 5.D.2 Rail CrossingGuard Enforcement Dupage County, Illinois.................................................. 37
6 SUMMARY & CONCLUSIONS ...................................................................................... 39
7 APPENDIX A – RAIL CROSSINGGUARD PRODUCT FAMILY .................................... 7–1 7.A Common Functionality ............................................................................................................... 7–1 7.B Data Collection ........................................................................................................................... 7–2
7.B.1 Vehicle Crossing Usage Information .................................................................................. 7–2 7.B.2 Portable Enclosure for Rail CrossingGuard Crossing Characterization System................. 7–2
7.C Enforcement................................................................................................................................ 7–3 7.D Real Time Alerts/Signalization Control...................................................................................... 7–3
8 APPENDIX B – GROUND TRUTH DATA .................................................................... 8–1

vii
LIST OF FIGURES Figure 1 US Railroad Network ................................................................................................................................... 1 Figure 2 States Active in High Speed Rail Development ............................................................................................ 1 Figure 3 Ideal Camera Field of View for Video Data Collection at Crossing............................................................ 8 Figure 4 GUI for Rail CrossingGuard...................................................................................................................... 13 Figure 5 Sample Night Time Image from Low-Light Level Sensitive Camera.......................................................... 23 Figure 6 Pedestrian Detected Walking Along Crossing ........................................................................................... 26 Figure 7 Camera pan angle (on left); camera tilt angle (on right)........................................................................... 28 Figure 8 Low Mounted Camera Mounted Suffers More From Projection Effect. .................................................... 29 Figure 9 Typical Camera Configuration Monitoring One Vehicle Direction at Single Track Crossing .................. 32 Figure 10 Rail CrossingGuard TrackSide Station - "Ruggedized" PC..................................................................... 34 Figure 11 Rail CrossingGuard TrackSide Station Communicating Video/Data to Server in Remote Facility ........ 35 Figure 12 Diamond UltraDome KD6 Camera/Dome Tracking System.................................................................... 36
LIST OF TABLES Table 1 Crossing Sites Considered for Data Collection.............................................................................................. 8 Table 2 Summary of Collected Grade Crossing Video Data..................................................................................... 10 Table 3 Table of Events and Event Indices................................................................................................................ 17 Table 4 Ground Truth Data Record Fields ............................................................................................................... 18 Table 5 Detection Results on Ground Truthed Video Clips ...................................................................................... 19 Table 6 Numbers of Cameras Required For Crossing Monitoring ........................................................................... 31 Table 7 17th Ave. FL Grade Crossing Ground Truth Data Segments .................................................................... 8–1 Table 8 54th St. FL Grade Crossing Ground Truth Data Segments ....................................................................... 8–1 Table 9 Barberville, FL Grade Crossing Ground Truth Data Segments ................................................................ 8–2 Table 10 Summit Blvd. FL Grade Crossing Ground Truth Data Segments ............................................................ 8–2 Table 11 Kent, WA Grade Crossing Ground Truth Data Segments........................................................................ 8–3 Table 12 Mystic, CT Grade Crossing Ground Truth Data Segments...................................................................... 8–4 Table 13 Spokane, WA Grade Crossing Ground Truth Data Segments.................................................................. 8–5
viii
LIST OF ABBREVIATIONS AAR – Association of American Railroads
ADT – Average Daily Traffic
CSV – Comma Separated Value
DMV – Department of Motor Vehicles
DOT – Department of Transportation
FOV – Field of View
FRA – Federal Railroad Administration
GUI – Graphical User Interface
HRI – Highway Rail Intersection
HSR – High Speed Rail
IACP – International Association of Chiefs of Police
IDEA – Innovations Deserving Exploratory Analysis
LA MTA – Los Angeles Metropolitan Transit Authority
MBTA – Massachusetts Bay Transit Authority
MPEG – Motion Picture Equivalency Group
NEMA – National Electrical Manufacturer’s Association
NRC – National Research Council
NTS – Nestor Traffic Systems, Inc.
NTSC – National Television Standards Committee
ODBC – Open Data Base Connectivity
S-VHS – Super High Resolution (Videotape format)
TRB – Transportation Research Board
TTI – Texas Transportation Institute

1
1 INTRODUCTION The over 100,000 miles of train tracks throughout the United States give rise to nearly 280,000 at grade highway rail intersections nationwide. A highway-rail crossing is defined as a location where railroad tracks intersect a public or private thoroughfare, side walk or a pathway. The US Federal Railroad Administration (FRA) reports that in 1998 there were 3,502 highway rail incidents at these crossings, involving 428 fatalities. Despite the fact that this represents a 7.2 percent drop in fatalities from 1997, this number still means that, on average, someone is hit by a train every 2 ½ hours, and someone is killed at a grade crossing every day. Combined, highway-rail crossing and trespasser deaths account for 90 percent of all rail-related deaths.1
The FRA is working to upgrade the nation’s rail systems for high-speed passenger travel. (See Figure 2.) The goal of this program is a high-speed rail transportation system in the United States that provides safer, faster, more efficient, more reliable and environmentally sound inter-city travel. However, without making necessary changes to highway and rail infrastructure, increasing the speeds along our nation’s high-speed rail lines will pose yet additional risks to vehicle, train and pedestrian traffic. In the case of highway rail crossings, there is an urgent need for better sensors to monitor activity at a grade crossing to detect and reduce the risk of highway rail incidents.
Nestor Traffic Systems, Inc. has pioneered the development of neural network-based video monitoring sensor technology for traffic safety. The Company has developed
TrafficVision®, a video monitoring system for traffic data collection, live surveillance and automated incident detection. Recently, the Company introduced CrossingGuard®, a video-based red light violation detection and recording system that offers a unique collision avoidance function at roadway intersections. In January, 1998, Nestor Traffic Systems was awarded a grant from the Transportation Research Board’s (TRB’s) IDEA (Innovations Deserving Exploratory Analysis) program to apply its neural-network based video monitoring technology to improve the safety of highway-rail intersections.
In its proposal to the IDEA program, Nestor identified possible extensions of its TrafficVision technology to address grade crossing safety. Specifically, Nestor proposed to develop and demonstrate a prototype video-based grade crossing monitoring system that could identify
• the presence of vehicles or trains within the railway crossing area
• the raised, lowered or altered condition of a rail crossing arm
1 Statistics as published by US DOT Federal Railroad Administration.
Figure 1 US Railroad Network
Based on 1997 National Transportation Atlas Database published by US DOT Bureau of Transportation Statistics
Figure 2 States Active in High Speed Rail Development
2
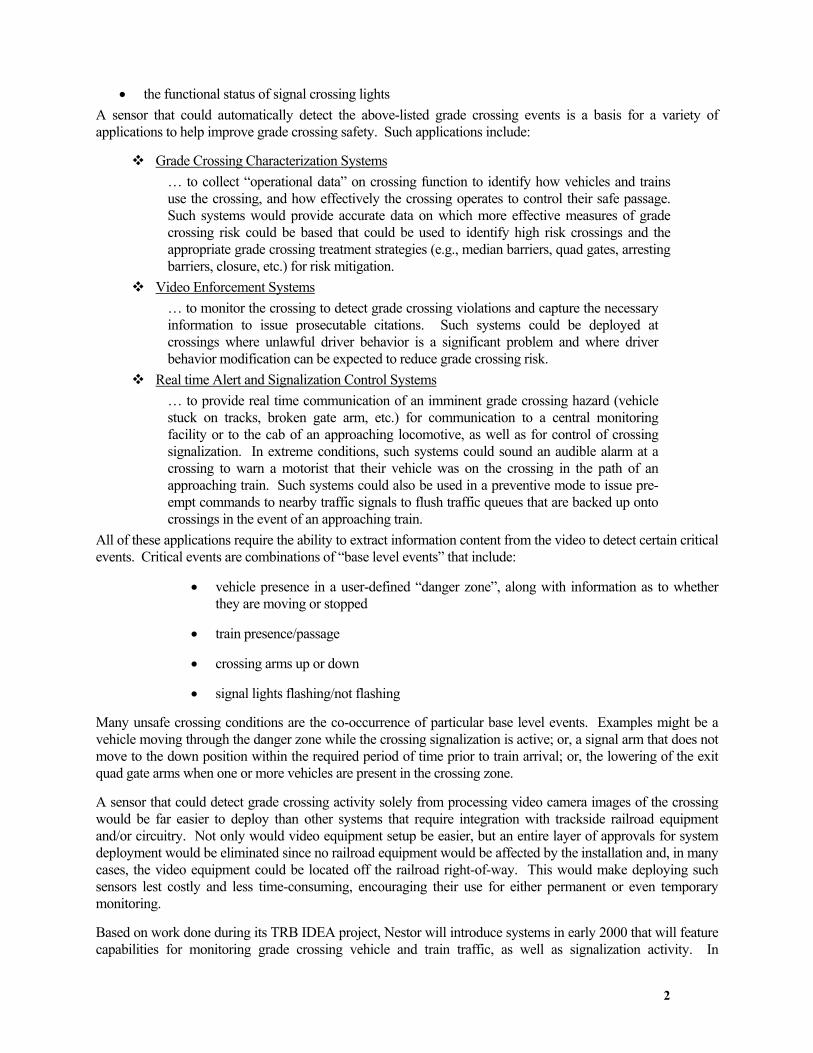
• the functional status of signal crossing lights A sensor that could automatically detect the above-listed grade crossing events is a basis for a variety of applications to help improve grade crossing safety. Such applications include:
Grade Crossing Characterization Systems … to collect “operational data” on crossing function to identify how vehicles and trains use the crossing, and how effectively the crossing operates to control their safe passage. Such systems would provide accurate data on which more effective measures of grade crossing risk could be based that could be used to identify high risk crossings and the appropriate grade crossing treatment strategies (e.g., median barriers, quad gates, arresting barriers, closure, etc.) for risk mitigation.
Video Enforcement Systems … to monitor the crossing to detect grade crossing violations and capture the necessary information to issue prosecutable citations. Such systems could be deployed at crossings where unlawful driver behavior is a significant problem and where driver behavior modification can be expected to reduce grade crossing risk.
Real time Alert and Signalization Control Systems … to provide real time communication of an imminent grade crossing hazard (vehicle stuck on tracks, broken gate arm, etc.) for communication to a central monitoring facility or to the cab of an approaching locomotive, as well as for control of crossing signalization. In extreme conditions, such systems could sound an audible alarm at a crossing to warn a motorist that their vehicle was on the crossing in the path of an approaching train. Such systems could also be used in a preventive mode to issue pre-empt commands to nearby traffic signals to flush traffic queues that are backed up onto crossings in the event of an approaching train.
All of these applications require the ability to extract information content from the video to detect certain critical events. Critical events are combinations of “base level events” that include:
• vehicle presence in a user-defined “danger zone”, along with information as to whether they are moving or stopped
• train presence/passage
• crossing arms up or down
• signal lights flashing/not flashing
Many unsafe crossing conditions are the co-occurrence of particular base level events. Examples might be a vehicle moving through the danger zone while the crossing signalization is active; or, a signal arm that does not move to the down position within the required period of time prior to train arrival; or, the lowering of the exit quad gate arms when one or more vehicles are present in the crossing zone.
A sensor that could detect grade crossing activity solely from processing video camera images of the crossing would be far easier to deploy than other systems that require integration with trackside railroad equipment and/or circuitry. Not only would video equipment setup be easier, but an entire layer of approvals for system deployment would be eliminated since no railroad equipment would be affected by the installation and, in many cases, the video equipment could be located off the railroad right-of-way. This would make deploying such sensors lest costly and less time-consuming, encouraging their use for either permanent or even temporary monitoring.
Based on work done during its TRB IDEA project, Nestor will introduce systems in early 2000 that will feature capabilities for monitoring grade crossing vehicle and train traffic, as well as signalization activity. In

3
particular, Nestor will install a network of these advanced video monitoring systems at five crossings in South Florida in 2000. Nestor plans to introduce a family of grade crossing video monitoring products for grade crossing characterization, real-time crossing alert and crossing violation enforcement.
This document is the Final Project Report for Nestor’s TRB IDEA Project. The Report describes the objectives of the project, summarizes the major project tasks and milestones, describes the nature of the software developed to accomplish the project objectives, reports on the capabilities and performance of the demonstration system that was created, addresses issues raised by the Project’s Technical Advisory Panel and identifies next steps as Nestor prepares for field deployment of the system at multiple crossings in the states of Florida and Illinois. Additionally, interim reports developed during the project are attached as appendices to this document.

4
2 PROJECT DESCRIPTION
2.A OBJECTIVES The goal of this IDEA project was to apply neural network-based video content extraction to improve the safety of highway-rail grade crossings by identifying video content that relates to risk at the grade crossing. The objectives of the investigation are:
• to determine the feasibility of using video for real-time detection of the presence of vehicles and trains at highway rail intersections
• to determine the feasibility of using video for monitoring highway rail intersections equipped with crossing arms/signal lights to ensure that these devices function properly.
In particular, the Nestor IDEA project seeks to automate the detection of unsafe conditions at highway/rail intersections, based upon the detection the “base level events” listed below:
• the presence of vehicles or trains within the grade crossing area • the raised, lowered or altered condition of a rail crossing arm • the functional status (flashing or non-flashing) of signal crossing lights
This project will show the feasibility of achieving these goals by using a single camera suitably located in the vicinity of the grade crossing. The size and geometry of some grade crossings as well as fail-safe considerations may require more than one camera to adequately view all tracks and lanes of traffic in the vicinity of the crossing.
All of the above information is to be extracted directly and solely from video of the crossing and its signal lights. Thus, no interface to the railway signalization will be necessary to provide information about the status of the rail signals or the presence of the train.
Along with this final report, the project has produced a software demonstration of a system that can
• be configured to operate on video images of grade crossing scenes • operate in real time to detect these fundamental grade crossing events/conditions for a variety of
crossings, under a range of visibility conditions as a function of different times of day and weather conditions
• log the detected base level event data, as well as events derived from the base level events, to a data log file that can be easily reviewed to analyze grade crossing operation.
2.B PROJECT MILESTONES/MAJOR TASKS The project was planned around a number of major tasks and milestones. These are described below.
2.B.1 EXPERT PANEL MEETING The kickoff for the project was a meeting of transportation industry leaders familiar with highway-rail grade crossing safety issues. The meeting was held on January 16, 1998 at the IDEA Program offices of the National Research Council’s (NRC) Transportation Research Board (TRB). This Expert Panel meeting was convened to review Nestor’s proposed project approach and to offer critical insight into the functional requirements that an automated video monitoring system would need to satisfy in order to reduce grade crossing risk.
5
Nestor engaged Sakonnet Technology Group of Tiverton, RI to coordinate the meeting, establish a potential list of meeting attendees, and to develop materials for the preparation and conduct of the meeting. Discussions with Mr. Robert McCown of the Federal Railroad Administration, Mr. William Browder of the Association of American Railroads and Mr. Chuck Taylor, of the IDEA program, produced a list of potential candidates for the meeting. Mr. Keith Gates and Mr. Chuck Taylor of the IDEA Program office provided helpful review of meeting plans, objectives and strategies. Ms. Linda Jones of the IDEA Program office was instrumental in facilitating arrangements for the meeting. Mr. Jim Hooper of Sakonnet Technology Group contacted candidate members and others, explained the purpose of the meeting and solicited interest of potential expert panel members. Follow-up with phone and email established a list of interested people by the end of the first week of December 1997.
Organizations represented at the meeting included: the Federal Railroad Administration, various state Departments of Transportation, large city transit and transportation authorities, railroad companies, the International Association of Chiefs of Police, the Volpe Transportation Center, the Association of American Railroads, the IDEA Program office and Nestor. One problem facing meeting organizers was how to establish a forum that would bring approximately 20 people from such diverse organizations together, allow them to become sufficiently familiar with each other and comfortable in the meeting environment to cooperatively interact and produce working requirements, all in a brief time frame.
Meeting time was set aside to provide those attendees who wished to do so with an opportunity to discuss ongoing video projects. A number of attendees took advantage of this segment of the meeting to review their video projects, past, ongoing and planned. This helped initiate discussions and allowed members to establish rapport with each other as they shared experiences, successes and failures.
One of the objectives of the meeting was to identify and generate discussion of a set of requirements or applications for video monitoring of grade crossings. Meeting organizers decided to use small, facilitated group interaction in breakout groups to develop these requirements. The requirements were grouped into three categories: data collection/measurement, enforcement, and signalization/control. These categories are largely separable though not completely exclusive domains of video use. However, this did allow organizers to divide the meeting attendees into three smaller working groups. Prior to arrival, panel members were asked to express their preference for breakout group participation. In nearly all cases, meeting organizers were able to accommodate panel members’ first choices.
Another challenge in planning for the meeting was how to explain the complex technology of neural networks and their role in a system that extracts information from video data streams. Meeting attendees needed a sufficient understanding of these principles in order to understand the objectives of Nestor’s IDEA project and in order to have a context for thinking about the definition of useful video content as it relates to railroad grade crossings. This was facilitated in three ways. First a primer on neural networks and video applications to a traffic scenario was included in the readahead package. Secondly, Dr. Douglas Reilly, Senior Vice President of Strategic Analysis and Technology at Nestor, presented a discussion of the technology. Thirdly, the practical application of video content extraction technology was demonstrated by Nestor, using its TrafficVision system. This allowed the panel members to see video content extraction work on actual, real-world data. This approach brought meeting attendees up to speed quickly on the technology of neural network-based video content extraction.
The requirements developed by the expert panel stand, in large measure, as the conclusions of the meeting. Nonetheless, in addition to the requirements specifically developed by the expert panel breakout groups, the discussions within the breakout groups and within the panel meeting as a whole touched upon a number of important observations regarding the use of video at grade crossings. Among these are:
• There is a significant need to characterize a grade crossing in anticipation of implementing risk mitigation strategies, which might range from adding additional signalization, to roadway infrastructure modifications, or even to crossing elimination.

6
• Vehicle classification, speed, time of day for transit, density and queue length are important features of interest to state DOT and railroad companies as basic information which can help characterize crossing activity and risk.
• Existing video system demonstrations in Los Angeles and North Carolina have demonstrated that enforcement systems can result in changes to driver behavior in the vicinity of the crossing, as violations are observed to decrease as a result of installation.
• Local jurisdictions desire enforcement systems that are automated and interface to existing databases and court criminal justice systems.
• Video monitoring systems must be flexible, employ an open-architecture design, and be able to communicate data across existing phone lines.
• A video sensor capability to provide signal condition monitoring at signalized crossings is of interest to railway companies.
• Video is not yet proven in cases for fail-safe application, all-weather operation and critical signal or train control functions.
• The future of video systems in supporting technology improvements in high-speed rail applications is good.
• Video can be used as a research tool to document driver behavior before and after implementation of prototypes of new crossing warning systems such as low-cost passive systems, new traffic median configurations, and LED arrays.
Following the meeting, a summary report was drafted and circulated to meeting attendees for review and comment. The final report, entitled Requirements for the Use of Video Content Extraction at Highway-Railroad Grade Crossings, is included as Appendix B of this Final Report. Although the Expert Panel meeting did not establish any new requirements within the scope of this project, it served several critical purposes; among them …
• verifying the nature of the opportunities for applying video to improve grade crossing safety; • verifying important performance requirements that such systems would need to meet for market
acceptance; • generating interest and visibility for the project within the rail community; and • introducing Nestor to state DOT’s and other industry participants (e.g., Association of American
Railroads, Volpe Transportation Center) who were able and willing to play a supportive role in the project either through continued participation as technical reviewers or through facilitating or directly supporting Nestor in the collection of much needed video of grade crossings for project development and testing
2.B.2 DATA COLLECTION To develop a demonstration of a video grade crossing monitoring system, Nestor needed to collect video data of grade crossing activity. The limited project budget precluded Nestor’s deploying cameras at multiple crossings to collect video data of crossing activity. Instead, Nestor adopted a strategy of identifying crossings in the United States where video cameras were deployed and seeking the cooperation of the relevant authorities to record video from these cameras. In most cases, these cameras were installed for crossing studies that both precede and follow crossing engineering treatments (e.g., equipping a crossing with median barriers, extended gate arms, quad gates, etc.). The aim of the video studies was to assess the nature of crossing risk before and after the modification in order to gauge the effectiveness of the crossing treatment.
7
Because Nestor made use of existing camera installations, we had little or no control over the placement of the cameras or their fields of view. Consequently, the video data captured was often far from ideal in terms of showing an image of the crossing that allowed for testing of all detection functions for vehicle presence, train presence, gate arm and signal light operation. For example, in some cases, a gate arm was visible in the field of view, but the signal lights were not visible, or only visible at certain times of day. In another instance, the gate arm and crossing lights were visible, but a passing train was only partially visible in the foreground. In yet another case, the combination of camera distance from the crossing and choice of camera lens did not provide enough image pixels on the crossing itself for reliable vehicle presence detection. Some videotapes collected from crossing video installations that occurred prior to Nestor’s IDEA project had fields of view that were completely unsuitable for use in system development or testing. In several cases, Nestor’s requirements for camera positioning could be generally accommodated by the state agency about to undertake the video crossing study. This was more likely to result in video footage that was usable for some aspect of detection development and testing.
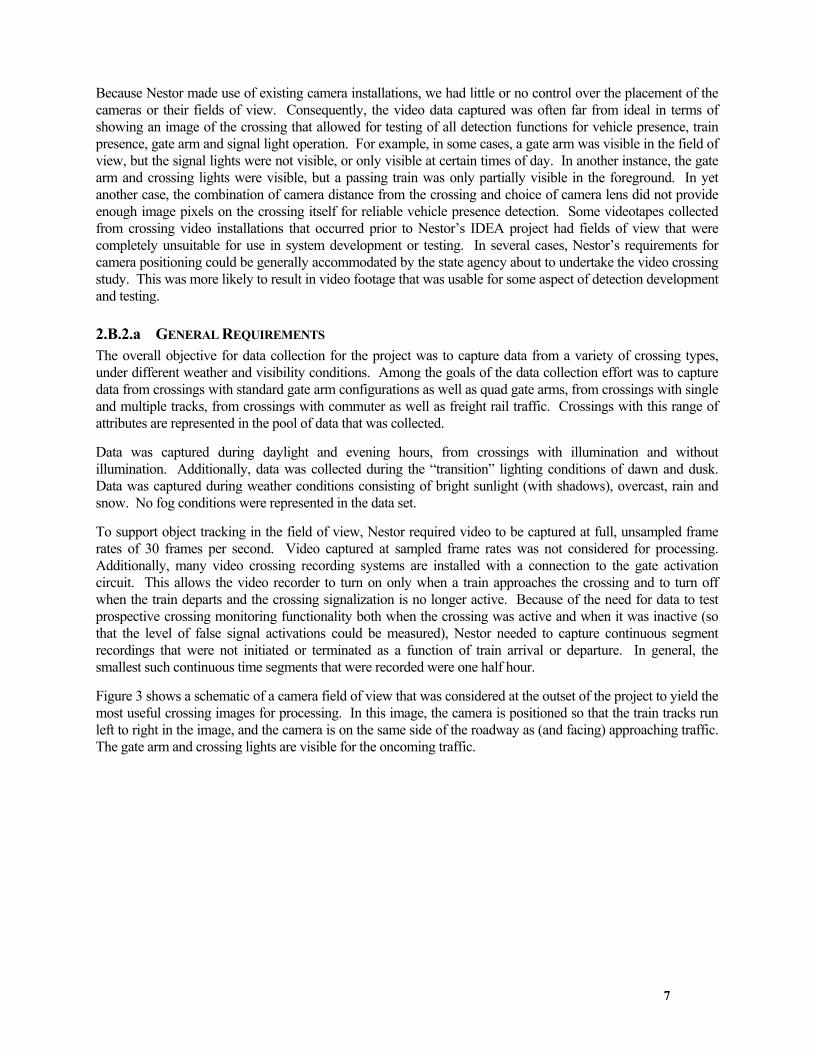
2.B.2.a GENERAL REQUIREMENTS The overall objective for data collection for the project was to capture data from a variety of crossing types, under different weather and visibility conditions. Among the goals of the data collection effort was to capture data from crossings with standard gate arm configurations as well as quad gate arms, from crossings with single and multiple tracks, from crossings with commuter as well as freight rail traffic. Crossings with this range of attributes are represented in the pool of data that was collected.
Data was captured during daylight and evening hours, from crossings with illumination and without illumination. Additionally, data was collected during the “transition” lighting conditions of dawn and dusk. Data was captured during weather conditions consisting of bright sunlight (with shadows), overcast, rain and snow. No fog conditions were represented in the data set.
To support object tracking in the field of view, Nestor required video to be captured at full, unsampled frame rates of 30 frames per second. Video captured at sampled frame rates was not considered for processing. Additionally, many video crossing recording systems are installed with a connection to the gate activation circuit. This allows the video recorder to turn on only when a train approaches the crossing and to turn off when the train departs and the crossing signalization is no longer active. Because of the need for data to test prospective crossing monitoring functionality both when the crossing was active and when it was inactive (so that the level of false signal activations could be measured), Nestor needed to capture continuous segment recordings that were not initiated or terminated as a function of train arrival or departure. In general, the smallest such continuous time segments that were recorded were one half hour.
Figure 3 shows a schematic of a camera field of view that was considered at the outset of the project to yield the most useful crossing images for processing. In this image, the camera is positioned so that the train tracks run left to right in the image, and the camera is on the same side of the roadway as (and facing) approaching traffic. The gate arm and crossing lights are visible for the oncoming traffic.

8
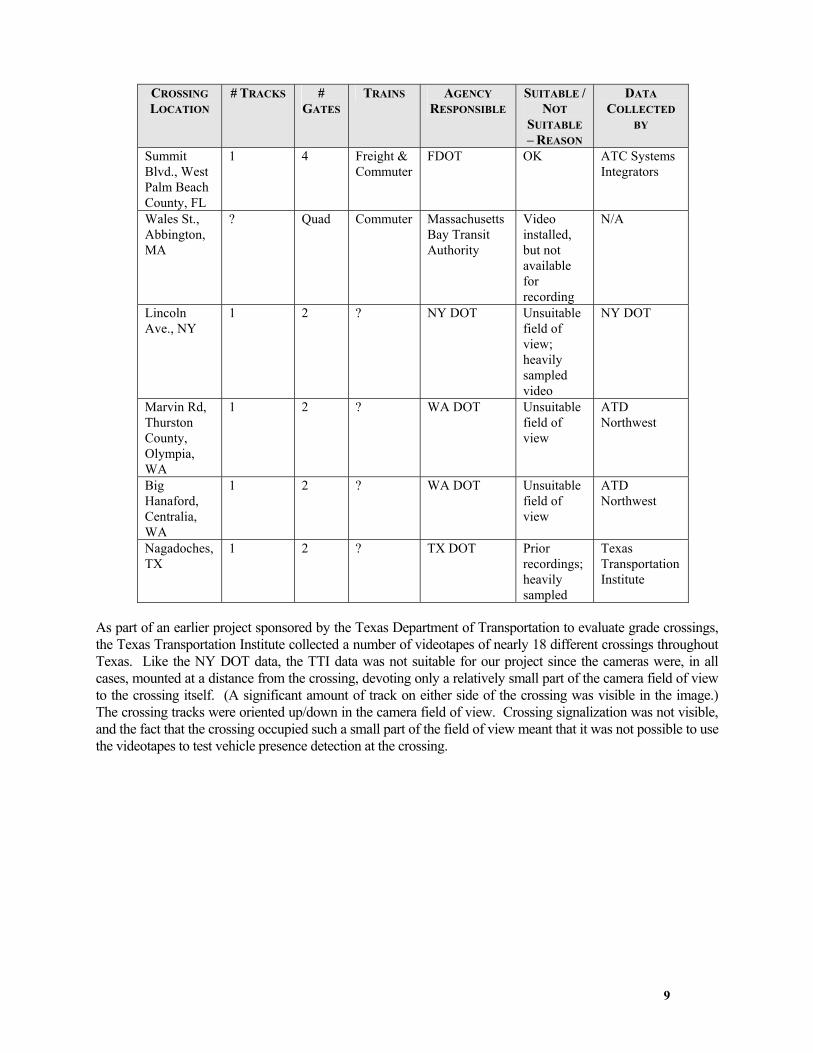
2.B.2.b COLLECTED VIDEO DATA Table 1 below presents a list of grade crossing sites that were considered for video data collection during the course of the project. In all but the last two cases, these sites had video cameras that were deployed during the course of the project’s data collection effort, but for the purposes of other crossing video studies. Additional video recordings were done from these cameras for the express purpose of being provided to Nestor for this project. In the case of data made available by New York DOT and Texas Transportation Institute, the video recordings had been captured during an earlier installation of video cameras that was no longer in operation at the time of this project. In the case of the New York DOT data, the videotape was captured at a high sampling rate, and since the cameras were no longer installed at the crossing, it was not possible to re-record at full frame rates.
Table 1 Crossing Sites Considered for Data Collection
CROSSING LOCATION
# TRACKS # GATES
TRAINS AGENCY RESPONSIBLE
SUITABLE / NOT
SUITABLE – REASON
DATA COLLECTED
BY
Mystic, CT – School St.
Quad Passenger CT DOT & Volpe Center
OK Nestor
Los Angeles, CA 124th St.
3 Quad Commuter & Freight
Los Angeles Metropolitan Transit Authority
OK, but quad gates not functional at time of data recording
Nestor & LA MTA
Pacific Ave., Everett, WA
1 2 Freight WA DOT OK ATD Northwest
South 228th St., Kent, WA
2 2 Passenger & Freight
WA DOT OK ATD Northwest
University Blvd., Spokane, WA
2, separated
2 for each track
Freight WA DOT OK Nestor
Barberville, FL
1 2 Commuter FDOT OK Univ. of Florida
N. W. 54th St., Dade County, FL
3 2 Freight & Commuter
FDOT OK ATC Systems Integrators
N. 17th Ave., West Palm Beach County, FL
2 4 Freight & Commuter
FDOT OK ATC Systems Integrators
R R
75 ~ 100 ft
RAIL ROADCROSSING
RAIL ROADCROSSING
Track
Figure 3 Ideal Camera Field of View for Video Data Collection at
Crossing
9
CROSSING LOCATION
# TRACKS # GATES
TRAINS AGENCY RESPONSIBLE
SUITABLE / NOT
SUITABLE – REASON
DATA COLLECTED
BY
Summit Blvd., West Palm Beach County, FL
1 4 Freight & Commuter
FDOT OK ATC Systems Integrators
Wales St., Abbington, MA
? Quad Commuter Massachusetts Bay Transit Authority
Video installed, but not available for recording
N/A
Lincoln Ave., NY
1 2 ? NY DOT Unsuitable field of view; heavily sampled video
NY DOT
Marvin Rd, Thurston County, Olympia, WA
1 2 ? WA DOT Unsuitable field of view
ATD Northwest
Big Hanaford, Centralia, WA
1 2 ? WA DOT Unsuitable field of view
ATD Northwest
Nagadoches, TX
1 2 ? TX DOT Prior recordings; heavily sampled
Texas Transportation Institute
As part of an earlier project sponsored by the Texas Department of Transportation to evaluate grade crossings, the Texas Transportation Institute collected a number of videotapes of nearly 18 different crossings throughout Texas. Like the NY DOT data, the TTI data was not suitable for our project since the cameras were, in all cases, mounted at a distance from the crossing, devoting only a relatively small part of the camera field of view to the crossing itself. (A significant amount of track on either side of the crossing was visible in the image.) The crossing tracks were oriented up/down in the camera field of view. Crossing signalization was not visible, and the fact that the crossing occupied such a small part of the field of view meant that it was not possible to use the videotapes to test vehicle presence detection at the crossing.

10
Table 2 Summary of Collected Grade Crossing Video Data
State Location # T
rack
s
# G
ates
Trains Age
ncy
Res
pons
ible
Dat
a C
olle
cted
by #
of V
iew
s
# T
apes
Tot
al m
inut
es
California Los Angeles - 124th St 3 Quad*Freight & Commuter LA MTA
LA MTA & Nestor 1 3 360
Connecticut Mystic - School St. 2 Quad Passenger
CT DOT & Volpe Center Nestor 2 10 1,248
FloridaDade County - N. W. 54th St. 3 2
Freight & Commuter FDOT
ATC Systems
Integrators 1 2 210
West Palm Beach - N. 17th Ave. 2 Quad
Freight & Commuter FDOT
ATC Systems
Integrators 1 3 327
West Palm Beach - Summit Blvd. 1 Quad
Freight & Commuter FDOT
ATC Systems
Integrators 1 3 363
Barberville 1 2 Commuter FDOTUniv. of Florida 1 36 4,878
Washington Everett - Pacific Ave. 1 2 Freight WA DOTATD
Northwest 1 3 205
Kent - South 228th St. 2 2Passenger & Freight WA DOT
ATD Northwest 1 6 664
Spokane - University Blvd 2* 4 Freight WA DOT Nestor 2 10 1,191
Total 73 9,086
Table 2 lists the locations from which project video data was collected, along with summary characteristics of those crossings and the amount of video data recorded at each site. As the table shows, a total of nearly 150 hours of video recordings were collected from 9 different crossings in 4 states. An interim project report was written describing the data collection effort, the characteristics of the crossings and the video data gathered from them. This report is available from the IDEA Program or directly from Nestor.
2.B.3 SOFTWARE DEVELOPMENT The software development plan for this project was to develop extensions to the base level TrafficVision software which implements functions for configuration/setup, neural network-based vehicle detection and tracking, event/alarm condition detection and event logging. The extensions required for this project include
• Extensions to the GUI setup/configuration functions • Extensions to the neural network/model-based target detection and tracking modules • Extensions to the event and alarm logging functions
No other software development was performed for the project.
2.B.4 INTERIM MEETING OF PROJECT TECHNICAL ADVISORY PANEL Nestor held a meeting of its Project Technical Advisory Panel in conjunction with the Grade Crossing Safety Conference held at Texas Transportation Institute in College Station, Texas on October 18, 1999. Members of the panel included Ron Ries (Panel Chairman) of the FRA, Anya Carroll of the Volpe Center, Anne Brewer of Florida DOT, Dennis Hamblet of Washington DOT, Haji Jameel of the California Public Utilities Commission and William Browder of the Association of American Railroads. Others present at this meeting included Chuck Taylor of the IDEA Program, V. J. Khawani of the Los Angeles MTA and Lorraine Pacocha of the Massachusetts MBTA.
11
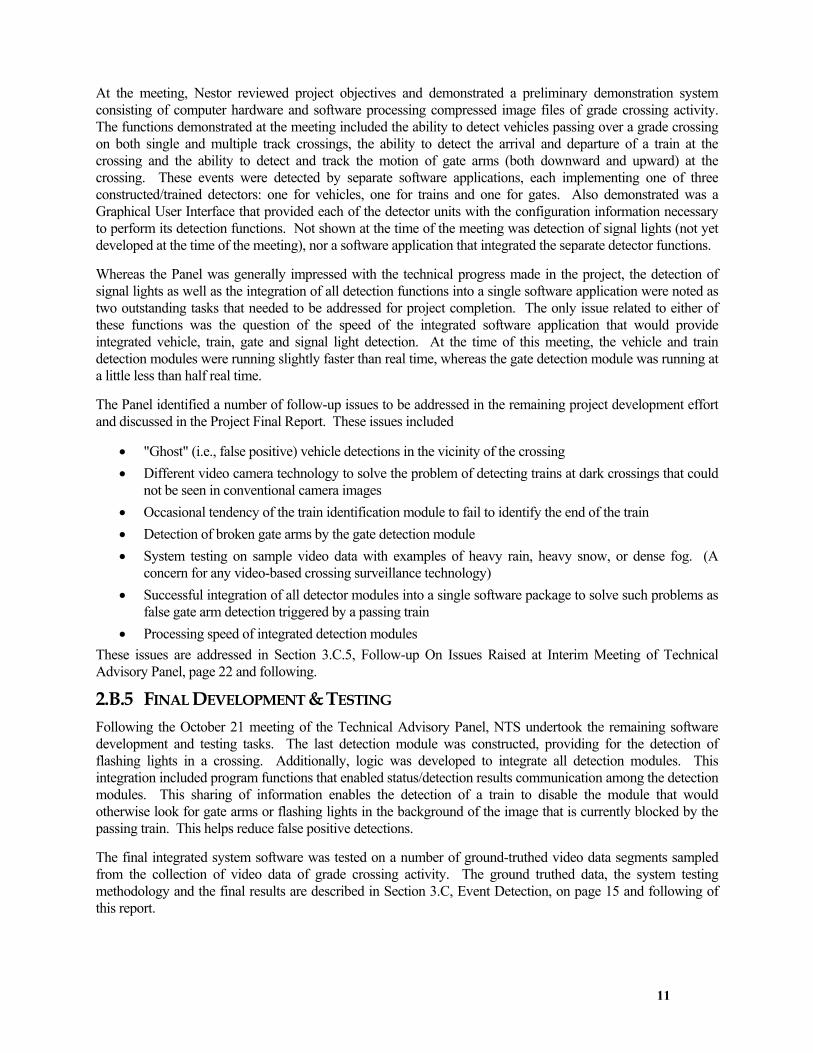
At the meeting, Nestor reviewed project objectives and demonstrated a preliminary demonstration system consisting of computer hardware and software processing compressed image files of grade crossing activity. The functions demonstrated at the meeting included the ability to detect vehicles passing over a grade crossing on both single and multiple track crossings, the ability to detect the arrival and departure of a train at the crossing and the ability to detect and track the motion of gate arms (both downward and upward) at the crossing. These events were detected by separate software applications, each implementing one of three constructed/trained detectors: one for vehicles, one for trains and one for gates. Also demonstrated was a Graphical User Interface that provided each of the detector units with the configuration information necessary to perform its detection functions. Not shown at the time of the meeting was detection of signal lights (not yet developed at the time of the meeting), nor a software application that integrated the separate detector functions.
Whereas the Panel was generally impressed with the technical progress made in the project, the detection of signal lights as well as the integration of all detection functions into a single software application were noted as two outstanding tasks that needed to be addressed for project completion. The only issue related to either of these functions was the question of the speed of the integrated software application that would provide integrated vehicle, train, gate and signal light detection. At the time of this meeting, the vehicle and train detection modules were running slightly faster than real time, whereas the gate detection module was running at a little less than half real time.
The Panel identified a number of follow-up issues to be addressed in the remaining project development effort and discussed in the Project Final Report. These issues included
• "Ghost" (i.e., false positive) vehicle detections in the vicinity of the crossing • Different video camera technology to solve the problem of detecting trains at dark crossings that could
not be seen in conventional camera images • Occasional tendency of the train identification module to fail to identify the end of the train • Detection of broken gate arms by the gate detection module • System testing on sample video data with examples of heavy rain, heavy snow, or dense fog. (A
concern for any video-based crossing surveillance technology) • Successful integration of all detector modules into a single software package to solve such problems as
false gate arm detection triggered by a passing train • Processing speed of integrated detection modules
These issues are addressed in Section 3.C.5, Follow-up On Issues Raised at Interim Meeting of Technical Advisory Panel, page 22 and following.
2.B.5 FINAL DEVELOPMENT & TESTING Following the October 21 meeting of the Technical Advisory Panel, NTS undertook the remaining software development and testing tasks. The last detection module was constructed, providing for the detection of flashing lights in a crossing. Additionally, logic was developed to integrate all detection modules. This integration included program functions that enabled status/detection results communication among the detection modules. This sharing of information enables the detection of a train to disable the module that would otherwise look for gate arms or flashing lights in the background of the image that is currently blocked by the passing train. This helps reduce false positive detections.
The final integrated system software was tested on a number of ground-truthed video data segments sampled from the collection of video data of grade crossing activity. The ground truthed data, the system testing methodology and the final results are described in Section 3.C, Event Detection, on page 15 and following of this report.
12
2.B.6 DEMONSTRATION & FINAL REPORT The last phase of the project involved a live software demonstration of the final prototype system processing sample video collected from different grade crossings. The software demonstration is to show
• the ability through a graphical user interface, to accomplish the necessary setup/configuration functions to enable the system to process grade crossing video images
• the ability to detect vehicle, train and signalization events as set forth in the project objectives • the ability to log the detected events to a data file.
The final software demonstration was performed by Nestor for representatives of the TRB IDEA Program office on January 12, 2000 during the TRB Annual meeting in Washington, DC. This demonstration system consisted of software running on a 450 MHz Pentium III workstation. The demonstration system was shown processing digitized video clips captured from a variety of crossings for which project video data was collected. The demonstration system showed the full range of detection capabilities, the GUI for system setup and the capability to log detected events to a datafile.
The Project Final Report summarizes the Project objectives, activities, results and conclusions, in addition to identifying additional work that needs to be accomplished prior to deploying the system for field testing.
13
3 PROTOTYPE CAPABILITIES
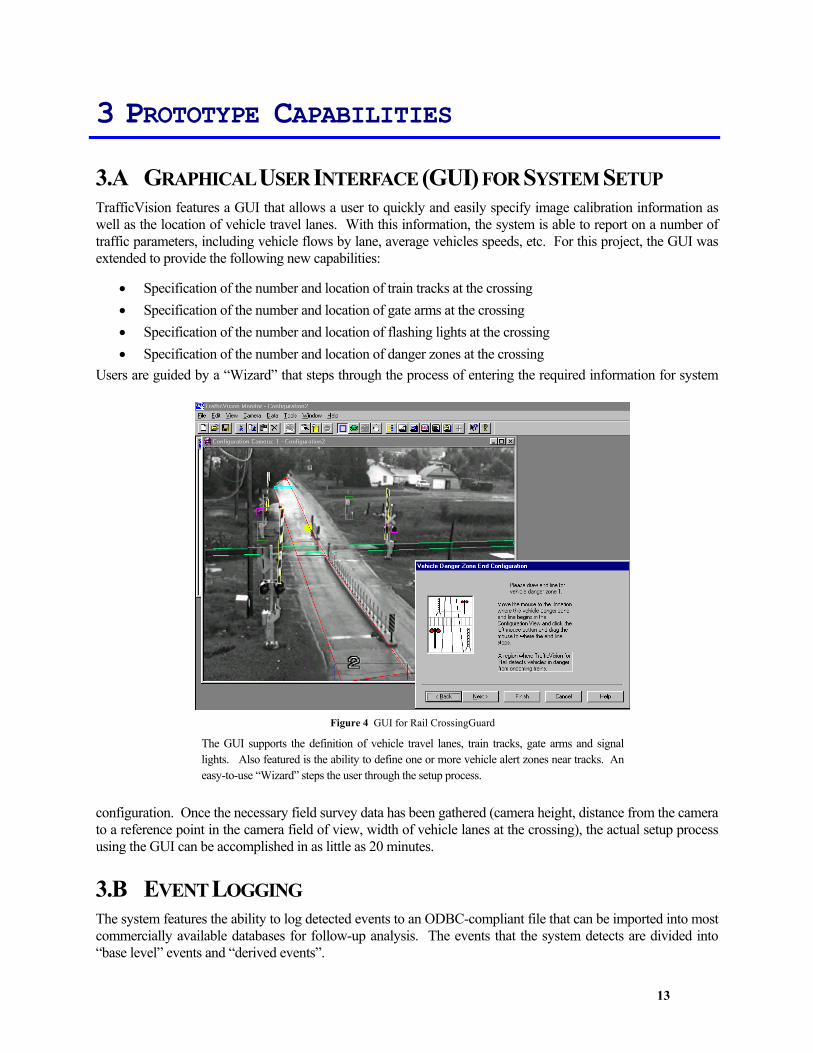
3.A GRAPHICAL USER INTERFACE (GUI) FOR SYSTEM SETUP TrafficVision features a GUI that allows a user to quickly and easily specify image calibration information as well as the location of vehicle travel lanes. With this information, the system is able to report on a number of traffic parameters, including vehicle flows by lane, average vehicles speeds, etc. For this project, the GUI was extended to provide the following new capabilities:
• Specification of the number and location of train tracks at the crossing • Specification of the number and location of gate arms at the crossing • Specification of the number and location of flashing lights at the crossing • Specification of the number and location of danger zones at the crossing
Users are guided by a “Wizard” that steps through the process of entering the required information for system
configuration. Once the necessary field survey data has been gathered (camera height, distance from the camera to a reference point in the camera field of view, width of vehicle lanes at the crossing), the actual setup process using the GUI can be accomplished in as little as 20 minutes.
3.B EVENT LOGGING The system features the ability to log detected events to an ODBC-compliant file that can be imported into most commercially available databases for follow-up analysis. The events that the system detects are divided into “base level” events and “derived events”.
Figure 4 GUI for Rail CrossingGuard
The GUI supports the definition of vehicle travel lanes, train tracks, gate arms and signal lights. Also featured is the ability to define one or more vehicle alert zones near tracks. An easy-to-use “Wizard” steps the user through the setup process.
14
3.B.1 BASE LEVEL EVENTS The base level events that the system detects are the primitive events that constitute the basis for all other higher level event detections. The base level events consist of the following:
• Vehicle Entry - Detection of vehicle entering a user-specified danger zone • Vehicle Exit - Detection of vehicle departing a user-specified danger zone • Train Entry - Detection of train arrival at the crossing • Train Exit - Detection of train departure from the crossing • Light Flash On - Detection of signal light beginning flashing • Light Flash Off - Detection of signal light ending flashing • Gate Arm Full Down - Detection of gate arm completing downward motion • Gate Arm Full Up - Detection of gate arm completing motion upward
Detection of these events causes an entry into the system’s event log file for the event type in question, along with the time of the event detection and, where appropriate, the track number associated with the event.
3.B.2 DERIVED EVENTS Derived events consist of events that are calculated from base level events. Like base level events, all derived events are logged to the system log file and available for review and analysis.
Derived events consist of
• Track Signals Started – triggered whenever the first signal for a track is activated (gate arm down or signal light started)
• Track Signals Ended – triggered whenever the last signal for a track ends (gate arm up or signal light stops)
• Train Entry Speed – arrival speed of the train at the crossing • Train Exit Speed – departure speed of the train at the crossing • Vehicle Stop Time – length of time that a vehicle was stopped in any of the crossing danger zones. • Average Vehicle Stop Time – average stopping time for vehicles stopped in any of the crossing danger
zones over a user-specified data accumulation period. • Gate Down After Light – time between onset of crossing flashing lights and the lowering of crossing
gate crossing arms. • Gate Down Before Train – time between the lowering of crossing gate arms and the arrival of the train • Gate Up After Train – The time between the departure of the train and the raising of the gate crossing
arms. • Light Off After Gate –The time between the raising of the gate crossing arms and the termination of the
gate signal light flashing.
3.B.3 ALARMS Derived events are the basis for “alarms” that can be defined by the user. The system can be configured to cause alarm conditions to trigger a visual/audible display on a computer monitor. Additionally, alarms are logged to the system database. A list of alarms is provided below.
• Vehicle In Danger Zone (Low Priority)
15
This alarm allows a user to enter a maximum amount of time that a vehicle may be stopped in the danger zone as long as no crossing signals are active. If a vehicle stays longer than this amount the alarm will be initiated.
• Vehicle In Danger Zone (High Priority) This alarm will be triggered if a vehicle is stopped in the danger zone and the crossing signals are active.
• Vehicle Entered Danger Zone and Signals Active This alarm will be triggered if the crossing signals are active and a vehicle enters the danger zone. This is defined as a “gate running” violation.
• Train Entered and No Signals This alarm will be triggered if a train enters the FOV on a particular track but no crossing signals are active for this track.
• Signals Started Before Train This alarm allows a user to enter an amount of time as well as a condition (< or >) that specifies the time that signals started with respect to the train arrival. If the signals start less than the time specified before train arrives (for < condition) or signals start more than the time specified before the train arrives (for > condition) the alarm will be activated.
• Signals Stopped After Train This alarm allows a user to enter an amount of time as well as a condition (< or >) that specifies the time that signals stopped after the train departs the crossing. If the signals stop less than the time specified after train departs (for < condition) or signals stop more than the time specified after the train departs (for > condition) the alarm will be activated.
• Signal Light Not Flashing and Train Detected This alarm will be activated if a train is detected and any of the crossing lights are not flashing. This is defined as a “light burned out” condition.
• Gate Arm Not Down and Train Detected This alarm will be activated if a train is detected and any of the gate arms are not in their down position. This is defined as a “gate arm stuck/broken” condition.
3.C EVENT DETECTION 3.C.1 DETECTION OBJECTIVES The objective of this project was to show the ability of a system to detect from video images alone the following crossing events
• Vehicles on the crossing tracks (whether the crossing was active or not) • The arrival and departure of trains from the crossing • The status of crossing signalization, including the position of gate arms (up, down, broken) and the
status of crossing signal lights (on, flashing or off). These events were to be detected under a range of visibility conditions as might be encountered in normal operation of crossings including day (bright sunshine with shadows, solar glare conditions, overcast with passing clouds), night and poor weather conditions (rain, snow, fog).
These events were to be detected at different kinds of crossings, featuring different track geometries and signalization equipment; in particular,
• Single and multi-track crossings

16
• Crossings equipped with standard paired gates as well as quad gates • Crossings with passenger, commuter and freight rail traffic
A further objective of this project is to establish the number of cameras and camera locations required to support the targeted crossing event detection.
3.C.2 UNTESTED CONDITIONS It was not possible to either test or report on the system’s ability to detect crossing events for which there were no incidents or tape sequences among the video data collected for the project. These conditions and events included the following:
Visibility conditions – Fog
Gate conditions – Broken gates
Vehicle Activity – Vehicles stopped on the tracks while the signalization was active
– Gate violations (vehicles moving across the tracks while the crossing signalization was active)
Of the above conditions that were not present in the collected crossing video data, the vehicle activity data is of less concern since it consists of a derived event; i.e., the detection of vehicle presence on the tracks and co-occurrence of the detection of active crossing signalization. System testing did demonstrate the ability of the system to detect both of these base level events.
Although it may be possible to alter the video images to simulate a broken gate arm, such testing would probably not reflect true image conditions and the resultant testing would not be a reliable indicator of how the system would respond to such an event. This testing will be deferred to a follow-on field deployment. It will be done under controlled conditions (i.e., staged events). However, some of the crossings where the system is to be installed for an upcoming pilot demonstration have a history of frequent broken gate events that should also provide a good opportunity for testing of the system’s capacity.
The need to establish performance testing under poor visibility conditions such as fog and heavy rain or snow is really part of another issue. Regardless of how well the sensor performs during such conditions for any particular bad-weather day, it is always possible to ask, “How will it do if the weather got worse? If the rain becomes heavier? If the fog becomes thicker?”
The sensor system must provide accurate data under the broadest possible range of conditions. It must also be able to automatically detect when conditions are not “in spec” and report that it is no longer able to function. (This requirement was raised in discussions at Nestor’s Expert Panel meeting at the outset of the project.) Because it was beyond the proposed scope of Nestor’s IDEA project, a development effort to create this functionality will be undertaken prior to field deployment and in-field testing of the system.
Reliable testing of this component will require gathering of data on an installed system using appropriately mounted cameras meeting target specifications over a prolonged period of time. This will ensure that multiple instances of bad weather will occur to test the system’s ability to self-detect image quality. Each instance of bad weather will need to be characterized by an objective measure of weather conditions (e.g., for rain, number of inches per hour; for fog, a measure of fog density, etc.) This will enable system performance to be measured against an objective measure of weather conditions. The system must demonstrate an ability to maintain reliable performance over a range of objectively measured weather conditions and, further, the ability to automatically suspend operation when conditions worsen, storing to a data log the fact that it no longer has the video image quality necessary for reliable grade crossing event detection.

17
3.C.3 GROUND TRUTH DATA Data ground truthing was done on MPEG video segments (“clips”) that were extracted from S-VHS video tapes gathered from the crossings. Ground truth data was established for approximately 100 different segments of MPEG video data, each consisting of tape segment that was between 1 and 2 minutes in duration. (A complete listing of these segments is found in Section 8, Appendix B – Ground Truth Data, pages 8–1 and following.) The procedure consisted of two steps. First, an appropriate segment of video was selected and recorded as a digital MPEG file. The second step involved review this MPEG video clip to identify and label relevant rail events.
3.C.3.a VIDEO GROUND TRUTH SEGMENT SELECTION Following are a list of criteria for selecting a particular section of tape to convert to MPEG:
1) Rail Crossing site – decide on a rail crossing to use and a camera direction if more than one is available.
2) Time of day – decide if a time of day/night is desired (dusk, dawn, day, night, camera glare, shadows, etc.)
3) Weather condition – sun, clouds, rain, snow, wet pavement, etc. 4) Traffic or train events – each MPEG segment should contain a significant volume of vehicle traffic, a
complete train crossing sequence (including all signal activation and deactivations), or a significant traffic/rail event (vehicles stopped on track, vehicle running gates, train stopped on track, maintenance vehicles on track, etc.)
3.C.3.b GROUND TRUTHING CROSSING EVENTS The first step in performing ground truthing for a new rail crossing is to assign object indices to the various types of rail objects (lanes, tracks, gate arms, signal lights). The assignment of these indices is recorded in a bitmap that is stored with each rail site. These indices were consistently used for all subsequent video/MPEG segments that correspond to this rail crossing.
The following types of rail events were recorded with the indicated event type index.
Event Index Event Name
1 Vehicle Entering Danger Zone 2 Vehicle Exiting Danger Zone 3 Rail Signals Start 4 Rail Signals End 5 Signal Light Starts Flashing 6 Signal Light Stops Flashing 7 Gate Arm Reaches Up Position 8 Gate Arm Reaches Down Position 9 Train Enters Field of View
10 Train Exits Field of View Table 3 Table of Events and Event Indices
Each time one of the events above was observed for a particular MPEG files, a record was entered into an Excel spreadsheet corresponding to this particular MPEG file. This record had the following fields:
Field #1 Field #2 Field #3
Name Time Object Number Event Index
18
Description Time that the event occurred relative to start of MPEG file in min:sec format
Object number associated with the event: for event type 1 or 2, a lane number; for event 3, 4, 9 or 10, a track number; for event 5 or 6, a signal light number; for event 7 or 8, a gate number. (These object numbers must correspond to those found in the bitmap mentioned above for this grade crossing.)
From the list above
Table 4 Ground Truth Data Record Fields
A complete listing of the ground truth data segments may be found in Section 8, Appendix B – Ground Truth Data, pages 8–1 and following. Each segment is listed in a table that also includes descriptive details of the grade crossing event content found in the ground-truthed segment.
3.C.4 DETECTION RESULTS The ground truthed MPEG video segments were used to evaluate Rail CrossingGuard system performance. Rail CrossingGuard processed each of the ground truthed segments, storing detected grade crossing events to its output log file. This file was then compared against the actual ground truthed data file (whose data was established by human observation and recording of the grade crossing events seen in the video clip, using the process and data fields described above). As there was no easy way to automate this comparison process, the comparison was done manually. Results are shown in Table 5.
Ground truth video segments from a subset of the grade crossing locations were evaluated. Some locations were not suitable for meaningful processing due to the nature of their fields of view. In particular, the Summit, 54th St., Everett, Kent and LA 124th St. crossings did not present suitable fields of view for processing. At the Summit Ave crossing, the camera was located on the “receding traffic” side of the crossing. Given this location, the camera height was not high enough to overcome vehicle occlusions created by having to look across the receding traffic lanes at the oncoming vehicles. The camera located at 54th St. did not afford a good view of either gate arms or lights. The camera was positioned too far to the side of the road and too distant from the tracks, with the crossing tracks oriented at too much of a diagonal and too “high up” in the image. The Everett and Kent crossings had cameras that were located at very low heights (on the order of 12 feet), too low for adequate vehicle detection. Addtionally, the Everett crossing contained only a portion of the crossing in the camera field of view. Finally, the LA 124th St crossing, although presenting a workable field of view for vehicle detection, did not present a good field of view either for gate or light detection, since the camera was mounted too close to the crossing for these objects to be reliably visible. (Sample images showing the camera fields of view for these crossings may be found in the Interim Project Report on Data Collection, available from the IDEA Program or directly from Nestor.)

19
CROSSING LOCATION FL 17th Ave Barberville, FL Mystic, CT (S) Mystic, CT (N) Spokane, WA (N) Spokane, WA (S) Totals# of Clips 16 32 8 9 9 10 84Clip Time 0:25:24 0:58:40 0:14:47 0:18:12 0:19:15 0:29:20 3:12:29
Camera Height 17'3" 35'4" 35' 35' 28' 28'Camera Distance to Crossing 70' 102' 42' 35' 180' 200'
Camera Viewing Angle 76° 71° 50° 45° 81° 82°VEHICLES Included Included Included Included Included Included
Total Included Clip Time 2:45:38# of Vehicle Events 44 194 4 12 53 22 329Correct Detections 42 186 4 12 53 22 319
False Negatives 2 8 10False Positives 3 2 1 4 10
Event Accuracy 97%Reliability 97%Comments False positive
detections generated in wake of passing train
TRAINS Included Included Included Included Included IncludedTotal Included Clip Time 2:45:38
# of Train Events 5 19 7 6 3 8 48Correct Detections 5 19 7 3 3 8 45
False Negatives 3 3False Positives 1 1 2
Event Accuracy 94%Reliability 96%
GATES Included Included Included Excluded Excluded ExcludedTotal Included Clip Time 1:38:51
# of Gate Events 26 38 7 71Correct Detections 25 33 2 60
False Negatives (Missed) 1 5 5 11False Positives 0
Event Accuracy 85%Reliability 100%Comments
LIGHTS Included Excluded Included Included Included ExcludedTotal Included Clip Time 1:17:38
# of Light Events 12 14 12 3 41Correct Detections 6 14 12 3 35
False Negatives 6 6False Positives 6 6
Event Accuracy 85%Reliability 85%Comments Lights too dim for
accurate detectionLights too dim for accurate detection
Tracker responded twice several times
Lights too distant & dim for accurate detection
Hooded, dim/distant lights too small for reliable detection
Table 5 Detection Results on Ground Truthed Video Clips

20
In the case of each event category (trains, vehicles, gates and lights), there were a number of locations for which the given camera field of view did not present a clear enough image of the crossing to detect the target events. Such scenes were excluded from meaningful testing for certain parameters and their results were not included in the overall results for that event. A given scene may qualify for testing on one or more types of events and be excluded for testing on others. For example, the Barberville, FL crossing presented a camera field of view that was sufficient for reasonable detection of vehicles, trains and gates, but inadequate for detection of crossing lights.
Table 5 shows the results of processing on video segments from the other crossing locations where at least several of the target events to be detected were adequately visible in the camera field of view. The table is divided into sections showing results for detection of vehicles, trains, gates and lights.
Whatever the event being detected (i.e., gates, trains, lights, vehicles), the table lists the number of events that occurred in the ground truthed video segments, followed by the number of “correct detections”. This is the number of ground-truthed events that were correctly detected by the system. Additionally, the table lists the number of missed detections (false negatives.) This is the number of ground truthed events in a specific category that the system failed to detect. The ratio of correct detections to the number of events is defined as the Detection Accuracy. (This number is sensitive to the number of false negatives, since the number of correct detections plus the number of false negatives equals the number of ground-truthed detections.)
The table lists false positives, defined as the number of instances when the system generated a detection for an event that did not actually occur. The total number of detections generated by the system for a particular class of events is, then, the sum of the correct detections and the false positives. The ratio of the number of actual ground-truthed events to this total number of responses is reported as the “Detection Reliability”. The reliability is a measure of the percent of times that the system generates a detection response for which an event actually occurred. The Detection Reliability is sensitive to the number of correct detections and the number of false positives. The larger the number of false positives, the lower the Detection Reliability.
By itself, Detection Reliability does not tell the whole story about how the system is operating. It must be taken together with Detection Accuracy. For example, it is possible to have a 100% Reliability measure if the Number of Correct Detections is zero and the number of false positive detections equals the number of actual ground-truthed events. However, this same scenario would yield a Detection Accuracy of 0. At the same time, it is possible to have a Detection Accuracy of 100%, but such a large false positive rate that the Detection Reliability is effectively 0.
3.C.4.a VEHICLE DETECTION Vehicle detection was evaluated by testing on 84 video clips from 6 different crossing scenes, consisting of 2 hours 45 minutes and 38 seconds of data. Overall accuracy and reliability are both reported at 97%. As was the case with most of the crossings for which we recorded video, vehicle traffic volumes were not high. The total number of vehicles moving across the crossing for these 84 video clips consisted of 329 vehicles. Since vehicles rarely stopped on the crossing, the system was evaluated by comparing its reporting of vehicles entering/exiting the danger zone vs. the number of such occurences as established by human observation of the tapes.
Nearly all the missed detections occurred in the Barberville, FL video segments. In these segments a single approach lane fanned out into three lanes on the other side of the crossing. All of the missed vehicles were in either the far right or far left lanes. The video image configuration utility of the demo program assumes lanes of nearly constant width in the field of view of the camera. We suspect that this created a problem for the accurate detection of some of the vehicles that moved into these lanes in the Barberville segment. This can be addressed through a future modification to the configuration utility that allows for lanes of non-constant width.
Nearly all the false positive detections (8 out of 10) were the result of improper filtering of a suspected area of motion in the image. This can be addressed either through refinement of the motion detection algorithm or

21
through additional training of the neural network to filter out the suspect shapes. Although the suspected areas of the image had some edge features (due to stop bars on the road and train tracks at the crossing) that are also present in vehicle shapes, the arrangement of these edges ought to be able to be discriminated by a properly trained neural network. Additional investigation is underway to determine how to improve the application of a neural network shape filter to eliminate these false positives. Nominally, these issues can be addressed through either training on additional data or refinements to the feature extraction algorithm to better represent higher-order relationships among the extracted features.
3.C.4.b TRAIN DETECTION Train detection was evaluated in the same set of video sequences as vehicle detection: 84 video clips from 6 locations consisting of 2 hours, 45 minutes and 38 seconds of video. Overall detection accuracy for train detection on these segments was 94% with detection reliability measured at 96%. The total number of train events occuring on these video segments (where an event consisted of the arrival/departure of a train at the crossing) was 48. The system detected trains moving in either direction (left to right or right to left) equally well.
All the missed train detections (3) occurred in processing images from the Mystic, CT crossing, North view. These detections were missed detections of the train departure (the train arrival was detected with 100% accuracy.) All missed detections occurred in conditions of relatively poor visibility – either rain or snow. This caused widespread image pixel changes that were detected as possible regions of significant and coordinated motion in the image. The underlying target areas failed to be discriminated as lacking the sufficient shape information to be classified as trains. This problem will be addressed through a combination of i) improvement to the underlying feature extraction capability to ensure that it operates as well as possible even in the video conditions that exist during bad weather; ii) additional neural network training; and iii) introduction of image-quality monitoring function that will measure image quality to determine when the image characteristics indicate that the video input is unsuitable for reliable processing by this detector function.
3.C.4.c GATE DETECTION Full evaluation of gate detection performance was done on 56 video clips from three different locations, consisting of 1 hour, 38 minutes and 51 seconds of video. In a number of crossing videos, the gates were too far in the distance to be accurately detected. In those videos in which the gates were accurately detected (and this included a quad gate installation where both gates on one side were adequately in the field of view for detection and tracking purposes), the overall detection accuracy for gates was 85%.
In the case of gates, the ground truthed entry for “number of gate events” is the sum of the number of gate up-to-down transitions plus the number of gate down-to-up transitions. Thus, the arrival/departure of a single train at the crossing would cause 2 gate events to be logged in the ground truth file. Gates were detected and reported to be either in the up position or the down position. Thus, a system that missed the detection of a gate down event could be interpreted as a false positive for a gate up. This would have led to double counting of the same incorrect detection (once as a missed detection and once as a false positive.) Accordingly, all incorrect gate detections are reported as missed detections (false negatives.)
In all cases, the missed gate detections were transitions from the up to the down position. The large number of missed detections in Mystic were due to marginal-to-poor camera viewing angle. The camera is located across the road from the gate being viewed for detection. This resulted in only a few correct detections. By contrast, camera views of the Spokane crossing (either the north or south views) were too distant to provide sufficient number of pixels on the gates for accurate detection and tracking.
The Barberville crossing exhibited 85% accuracy. Missed detections in this field of view are thought to be related to insufficient resolution in the detection of edge features. This problem is under further investigation to determine improved edge detection resolution that can support real time detection requirements. In the FL 17th Ave. scenes, the system was configured to detect and track 2 of the 4 quad gates deployed at the crossing.
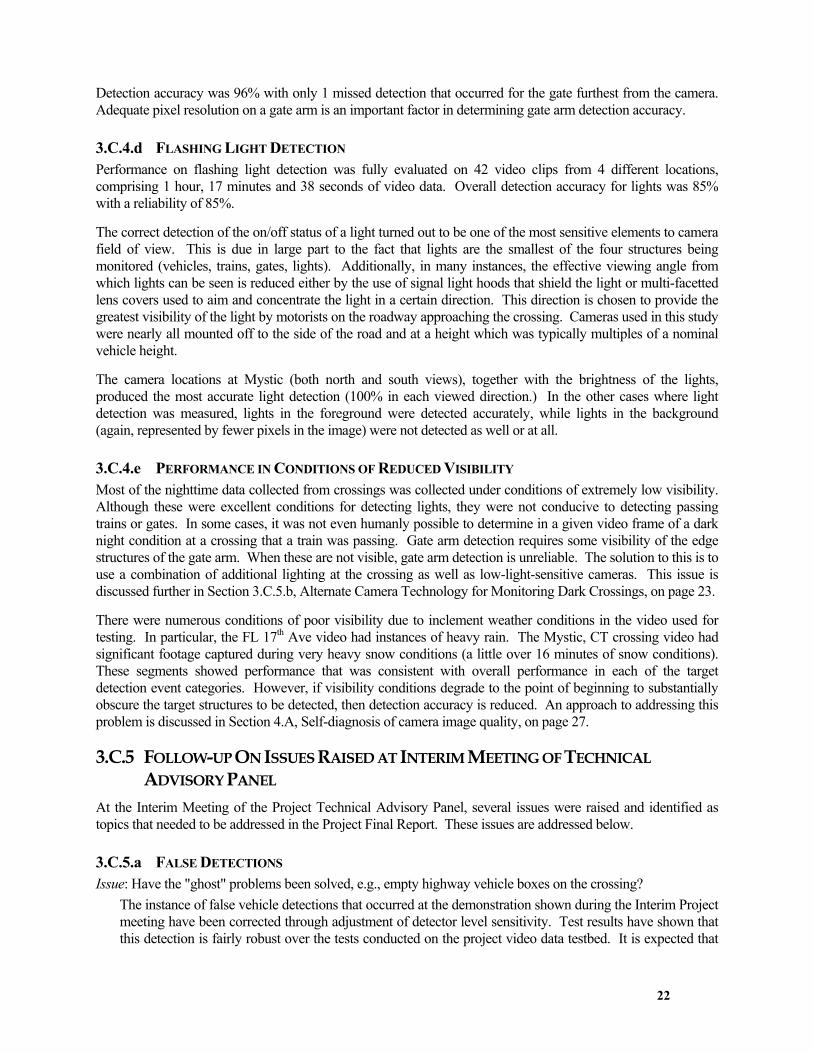
22
Detection accuracy was 96% with only 1 missed detection that occurred for the gate furthest from the camera. Adequate pixel resolution on a gate arm is an important factor in determining gate arm detection accuracy.
3.C.4.d FLASHING LIGHT DETECTION Performance on flashing light detection was fully evaluated on 42 video clips from 4 different locations, comprising 1 hour, 17 minutes and 38 seconds of video data. Overall detection accuracy for lights was 85% with a reliability of 85%.
The correct detection of the on/off status of a light turned out to be one of the most sensitive elements to camera field of view. This is due in large part to the fact that lights are the smallest of the four structures being monitored (vehicles, trains, gates, lights). Additionally, in many instances, the effective viewing angle from which lights can be seen is reduced either by the use of signal light hoods that shield the light or multi-facetted lens covers used to aim and concentrate the light in a certain direction. This direction is chosen to provide the greatest visibility of the light by motorists on the roadway approaching the crossing. Cameras used in this study were nearly all mounted off to the side of the road and at a height which was typically multiples of a nominal vehicle height.
The camera locations at Mystic (both north and south views), together with the brightness of the lights, produced the most accurate light detection (100% in each viewed direction.) In the other cases where light detection was measured, lights in the foreground were detected accurately, while lights in the background (again, represented by fewer pixels in the image) were not detected as well or at all.
3.C.4.e PERFORMANCE IN CONDITIONS OF REDUCED VISIBILITY Most of the nighttime data collected from crossings was collected under conditions of extremely low visibility. Although these were excellent conditions for detecting lights, they were not conducive to detecting passing trains or gates. In some cases, it was not even humanly possible to determine in a given video frame of a dark night condition at a crossing that a train was passing. Gate arm detection requires some visibility of the edge structures of the gate arm. When these are not visible, gate arm detection is unreliable. The solution to this is to use a combination of additional lighting at the crossing as well as low-light-sensitive cameras. This issue is discussed further in Section 3.C.5.b, Alternate Camera Technology for Monitoring Dark Crossings, on page 23.
There were numerous conditions of poor visibility due to inclement weather conditions in the video used for testing. In particular, the FL 17th Ave video had instances of heavy rain. The Mystic, CT crossing video had significant footage captured during very heavy snow conditions (a little over 16 minutes of snow conditions). These segments showed performance that was consistent with overall performance in each of the target detection event categories. However, if visibility conditions degrade to the point of beginning to substantially obscure the target structures to be detected, then detection accuracy is reduced. An approach to addressing this problem is discussed in Section 4.A, Self-diagnosis of camera image quality, on page 27.
3.C.5 FOLLOW-UP ON ISSUES RAISED AT INTERIM MEETING OF TECHNICAL ADVISORY PANEL
At the Interim Meeting of the Project Technical Advisory Panel, several issues were raised and identified as topics that needed to be addressed in the Project Final Report. These issues are addressed below.
3.C.5.a FALSE DETECTIONS Issue: Have the "ghost" problems been solved, e.g., empty highway vehicle boxes on the crossing?
The instance of false vehicle detections that occurred at the demonstration shown during the Interim Project meeting have been corrected through adjustment of detector level sensitivity. Test results have shown that this detection is fairly robust over the tests conducted on the project video data testbed. It is expected that
23
further systematic improvements in detector accuracy and reliability (which is sensitive to false positive detections) will result from continued refinement of the detector feature extraction algorithms and additional neural network training.
3.C.5.b ALTERNATE CAMERA TECHNOLOGY FOR MONITORING DARK CROSSINGS Issue: Any further developments with regard to the use of different video camera technology to solve the problem of detecting trains at dark crossings that the conventional cameras were missing?
In this IDEA project, Nestor was not able to explore the use of alternate camera technologies that might provide better image crossings under extremely low light conditions. Nestor’s data collection strategy was to take advantage of crossings with existing video camera installations, and these installations all made use of fairly conventional camera equipment. However, outside the scope of this project, Nestor is making use of extremely high sensitivity cameras for imaging intersections equipped with its CrossingGuard traffic signal light violation system. The cameras in question are referred to in the industry as “Zero-Lux cameras”. An example is the Diamond UltraDomeTM KD6, with optional color/black&white camera, featuring a sensitivity of 0.015 Lux in monochrome mode. These cameras can operate in two modes either color or black and white. In their black and white mode, they are very sensitive to illumination in the near infrared region of the spectrum. This sensitivity can be used to “see” better under conditions of near total darkness. Figure 5 presents an image of a license plate captured by such a camera at an intersection under conditions of near total darkness. In the Nestor’s CrossingGuard system for video-based detection of red light running vehicles, the Company has developed software that can automatically switch the camera between the two different modes (color vs. monochrome). This allows the camera to operate as color camera by day and as a very sensitive black and white camera by night. A similar approach can be used at grade crossings. At the same time, a strong argument can be made that crossings, by the very nature of the risk to motorist presented by train traffic, should all be well illuminated. Certainly, flashing crossing lights should be a visible signal to any motorist. However, many freight trains have absolutely no sources of light on any of their cars. At a completely dark crossing, the flashing signal lights are not designed to illuminate the train cars. Consequently, motorists may see the flashing lights, but not the train. To a motorist tempted to “beat the train”, this may look like a crossing that can be safely violated before the train arrives. The result of this conclusion can be fatal. Like the crossing signal lights, constant white light crossing illumination systems could be activated only when the crossing is active. This would reduce needless power consumption as well as the extent to which crossing illumination might bleed into unwanted areas close to the crossing. It would also permit effective video monitoring of the crossing, since the only events that are difficult for a video system to see at a dark crossing largely relate to train presence and departure.
Figure 5 Sample Night Time Image from Low-Light Level Sensitive Camera
24
3.C.5.c END OF TRAIN DETECTION Issue: Have the problems with the train identification module identifying certain freight car profiles been solved (e.g., empty flat cars, and missing the last car in some solid passenger trains)?
No problems exist in falsely detecting the end of train condition as a result of seeing empty flat cars. The system looks for the presence of train structures close to the trackbed and even empty flat cars have wheel structures that are detected as they move by. The instance of missing the end car of a train as shown at the Interim Project meeting has been corrected through adjustment of detector level sensitivity. Test results have shown that this detection is fairly robust over the tests conducted on the project video data testbed. The only issue that can compromise this detection is extremely low level light illumination at the crossing or poor weather conditions. The low-light level situation can be addressed either through the use of newer generation Zero-Lux cameras or through additional constant level white light illumination at the crossing, as discussed above. Issues related to visibility in poor weather have been discussed in Section 3.C.4.b, Train Detection, page 21.
3.C.5.d BROKEN GATE ARM DETECTION Issue: Has the arm module been modified to identify broken arms?
Broken gate arm detection remains an untested system capability. Although it may be possible to alter the video images to simulate a broken gate arm, such testing would probably not reflect true image conditions and the resultant testing would not be a reliable indicator of how the system would respond to such an event. This testing will be deferred to a follow-on field deployment. It will be done under controlled conditions (i.e., staged events). However, some of the crossings where the system is to be installed for an upcoming pilot demonstration have a history of frequent broken gate events that should also provide a good opportunity for testing of the system’s capacity.
3.C.5.e TESTING UNDER ALL WEATHER CONDITIONS Issue: Sample video data used to develop and test the software had no examples of very heavy rain/snow or fog. This is a concern for any video-based crossing surveillance technology, and needs to be addressed.
Sample video data used for development and testing did have instances of heavy rain (FL 17th Ave. crossing) and heavy snow (Mystic, CT crossing.) Testing on the data captured under these specific conditions indicated that only end-of-train detection was affected. However, the larger issues related to this topic are addressed Section 3.C.2, Untested Conditions, page 16 as well as Section 4.A, Self-diagnosis of camera image quality, page 27.
3.C.5.f DETECTION MODULE INTEGRATION Issue: Have all the modules been successfully integrated into a single software package to solve such problems as ghost arms identified on the other side of a passing train?
Yes. Since the meeting of the Technical Advisory Panel, the individual event detection modules have been integrated in a way that allows them to share status information between modules. Thus, when a train has been detected, the gate arm detection module knows this and suspends the effort to detect gate arms that it knows will be hidden in the background by a passing train. Providing the overall context of what is currently detected to all detection modules enhances the performance of individual detection modules. This capability was demonstrated in the final software system shown at the TRB Annual Meeting in January, 2000.
3.C.5.g PROCESSING SPEED OF INTEGRATED DETECTION MODULES Issue: At the time of the Interim Project meeting, the gate detection module was running in half real-time speed. Have the detection modules been optimized for processing so that the final, integrated system is able to process video in real time?

25
Yes. Processing speed optimizations were identified and implemented for the edge detection processing components of the gate arm detection module. As shown during demonstrations at the TRB Annual Meeting, the prototype system features all detection modules running in an integrated system and processing video at real time speeds.
3.C.6 ADDITIONAL DETECTED EVENTS/CONDITIONS
3.C.6.a PEDESTRIANS Although not an objective of this project, the system did display a rudimentary capability to detect pedestrian travel over the crossing. (See Figure 6 for an example of this detection.) These detections generally did not match the object matching criteria established for the detection of either vehicles, trains, gates or flashing lights. Consequently, they were filtered out as uninteresting detections that were not tracked or logged to any report file. Pedestrian detection could be the subject of a follow-on development project to make the detection of pedestrians robust under a variety of target object conditions (single/multiple pedestrians) as well as visibility conditions.
3.C.6.b VEHICLE APPROACH TRAJECTORIES Although not an objective of this project, the neural network based vehicle detection technology used supports the tracking of vehicles as they approach the crossing, given a camera field of view that shows the lanes of vehicle travel approaching the crossing. The system is able to determine the position, speed and acceleration/deceleration of vehicles as they approach the crossing. This capability can be used to control the deployment of a vehicle arresting barrier in the event that the system detects that the crossing signalization is active and that the trajectory of an approaching vehicle indicates that it will not stop in advance of the crossing.
3.C.6.c SIGNAL MAINTENANCE The ability of the system to not only detect the position of gate arms but to monitor their upward and downward motion could provide the basis for reporting on gate arms whose motion indicates that they are in a pre-failure mode. This would allow the deployment of maintenance personnel to function in a preventive mode to either correct the condition (perhaps fixing the problem before a more expensive repair or replacement is necessary) or to replace the defective mechanism before a complete gate arm failure occurs, thus eliminating the risk of an unmonitored crossing. A follow-on project could be aimed at establishing the trajectories that are correlated with proper gate arm function and the ability of the system to discriminate between such “normal” trajectories and all others.

26
Figure 6 Pedestrian Detected Walking Along Crossing
27
4 DEPLOYMENT ISSUES
4.A SELF-DIAGNOSIS OF CAMERA IMAGE QUALITY A number of participants in Nestor’s Expert Panel meeting at the outset of the project emphasized the need for a video monitoring system to contend with reduced visibility conditions caused by extreme weather (heavy snow, fog or rain). Discussions pointed out the obvious need to function in as broad a range of visibility conditions as possible, but also the realization that there are some visibility conditions that will simply not permit capture of a video with sufficient image quality to allow the computer system to perform the necessary crossing event detection. It is possible that some detection functions may degrade sooner than others. In fact as shown by some of the testing done in this project, poor weather conditions affected the ability to accurately detect end-of-train events before they affected other detections of vehicles, gates and crossing lights.
Systems that automatically interpret raw sensor data, whether video or any other modality, provide more reliable measurements when they have a means of detecting, adjusting for and reporting on conditions that compromise the quality of the incoming raw signal. When the image quality degrades, the target detection capability of the sensor is impaired. Such a degraded image condition is different from a “no video signal” condition that may arise as a result of camera power loss or malfunction. In the case of a degraded image, the sensor logic is still presented with an image that is processable, but one whose content is significantly or partially obscured. What is required is a means of detecting either from the image properties themselves whether the image quality has degraded to the point of causing unreliable sensor function.
This is an important additional requirement that will be addressed prior to deploying a system at a crossing for field testing. There are a number of approaches that can be taken to solve this problem. The simplest may be to simply deploy an object (e.g., a flashing light) at the crossing that is designed to be seen by the cameras at all times. If the light cannot be seen, the system will report the failure as an indication that the camera image has degraded to the point of no longer supporting the required video monitoring function.
A different approach to the problem is suggested by work done by Carnegie Mellon researchers Pomerleau et al., who recently proposed a metric that could be used to gauge the visibility of a traffic scene.2 Their work involved vehicle-mounted cameras for autonomous vehicle control. (The CMU Navlab test vehicle has driven itself across country, with explicit driver intervention required for only a small portion of the trip.) The vision system in this autonomous vehicle is looking at the road ahead, and so it usually has lane lines in sight. The system computes the median intensity of lane markers in different bands of the image and uses this to define a contrast attenuation between the top and bottom of the image. Contrast attenuation is reduced as a function of distance from the bottom (near field) of the picture, so the measured contrast attenuation can be scaled by the distance (in real world terms, not pixel terms) between the top and bottom of the viewing area. The resulting value is a measure of contrast attenuation per meter that is subsequently normalized so that the rate of attenuation on a bright, clear day is equivalent to a visibility of 1.0.
Pomerleau collected camera data from the autonomous vehicle driving under a variety of visibility conditions to generate visibility measures for multiple weather-specific scenes. They were able to show a reliable correlation between the amount of image attenuation and different weather/visibility conditions. Thus, from image attenuation alone, it is possible to detect not only when the image conditions have degraded beyond an acceptable level, but even the kind of weather conditions responsible for the degradation.
2 Visibility Estimation from a Moving Vehicle Using the RALPH Vision System, D. Pomerleau, IEEE Conference on Intelligent Transportation Systems, Boston, MA, Nov. 1997.
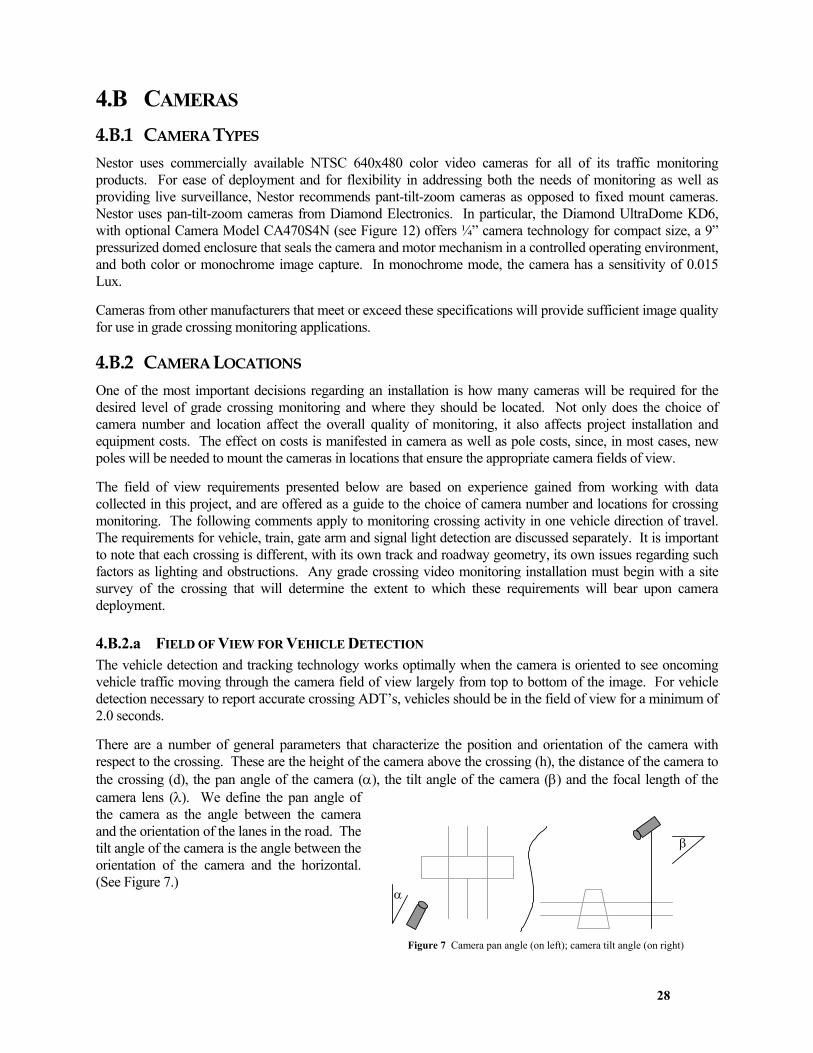
28
4.B CAMERAS 4.B.1 CAMERA TYPES Nestor uses commercially available NTSC 640x480 color video cameras for all of its traffic monitoring products. For ease of deployment and for flexibility in addressing both the needs of monitoring as well as providing live surveillance, Nestor recommends pant-tilt-zoom cameras as opposed to fixed mount cameras. Nestor uses pan-tilt-zoom cameras from Diamond Electronics. In particular, the Diamond UltraDome KD6, with optional Camera Model CA470S4N (see Figure 12) offers ¼” camera technology for compact size, a 9” pressurized domed enclosure that seals the camera and motor mechanism in a controlled operating environment, and both color or monochrome image capture. In monochrome mode, the camera has a sensitivity of 0.015 Lux.
Cameras from other manufacturers that meet or exceed these specifications will provide sufficient image quality for use in grade crossing monitoring applications.
4.B.2 CAMERA LOCATIONS One of the most important decisions regarding an installation is how many cameras will be required for the desired level of grade crossing monitoring and where they should be located. Not only does the choice of camera number and location affect the overall quality of monitoring, it also affects project installation and equipment costs. The effect on costs is manifested in camera as well as pole costs, since, in most cases, new poles will be needed to mount the cameras in locations that ensure the appropriate camera fields of view.
The field of view requirements presented below are based on experience gained from working with data collected in this project, and are offered as a guide to the choice of camera number and locations for crossing monitoring. The following comments apply to monitoring crossing activity in one vehicle direction of travel. The requirements for vehicle, train, gate arm and signal light detection are discussed separately. It is important to note that each crossing is different, with its own track and roadway geometry, its own issues regarding such factors as lighting and obstructions. Any grade crossing video monitoring installation must begin with a site survey of the crossing that will determine the extent to which these requirements will bear upon camera deployment.
4.B.2.a FIELD OF VIEW FOR VEHICLE DETECTION The vehicle detection and tracking technology works optimally when the camera is oriented to see oncoming vehicle traffic moving through the camera field of view largely from top to bottom of the image. For vehicle detection necessary to report accurate crossing ADT’s, vehicles should be in the field of view for a minimum of 2.0 seconds.
There are a number of general parameters that characterize the position and orientation of the camera with respect to the crossing. These are the height of the camera above the crossing (h), the distance of the camera to the crossing (d), the pan angle of the camera (α), the tilt angle of the camera (β) and the focal length of the camera lens (λ). We define the pan angle of the camera as the angle between the camera and the orientation of the lanes in the road. The tilt angle of the camera is the angle between the orientation of the camera and the horizontal. (See Figure 7.)
α
β
Figure 7 Camera pan angle (on left); camera tilt angle (on right)
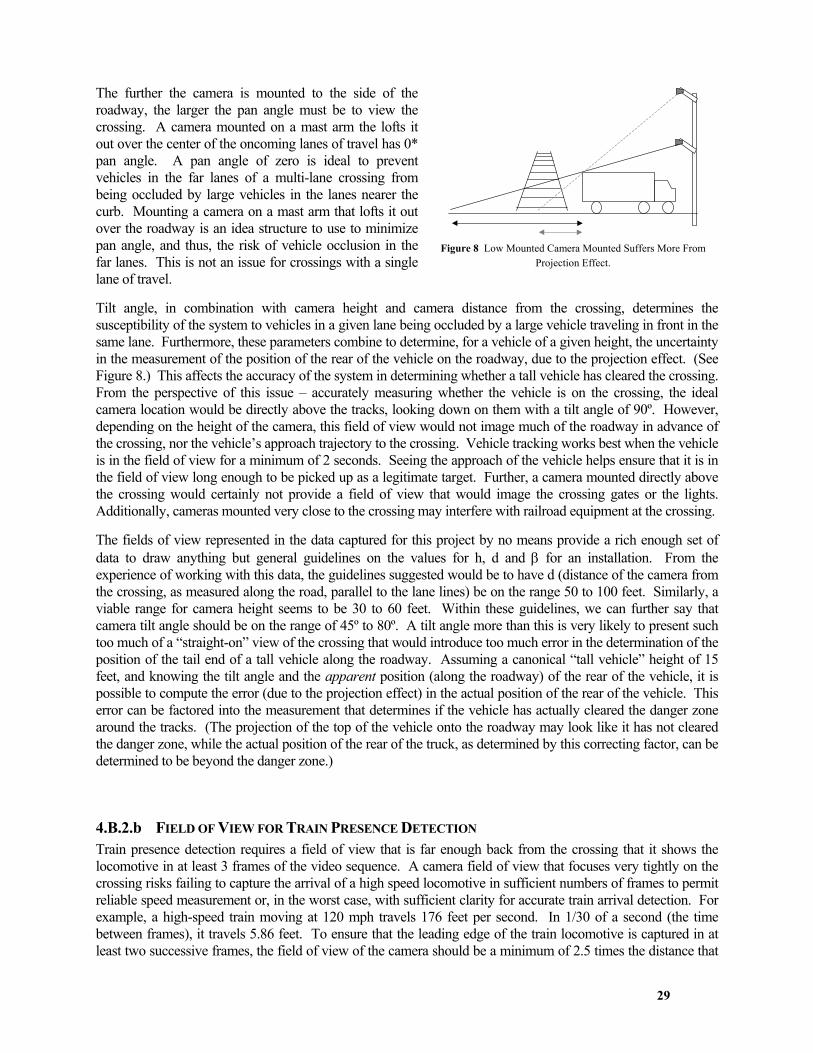
29
The further the camera is mounted to the side of the roadway, the larger the pan angle must be to view the crossing. A camera mounted on a mast arm the lofts it out over the center of the oncoming lanes of travel has 0* pan angle. A pan angle of zero is ideal to prevent vehicles in the far lanes of a multi-lane crossing from being occluded by large vehicles in the lanes nearer the curb. Mounting a camera on a mast arm that lofts it out over the roadway is an idea structure to use to minimize pan angle, and thus, the risk of vehicle occlusion in the far lanes. This is not an issue for crossings with a single lane of travel.
Tilt angle, in combination with camera height and camera distance from the crossing, determines the susceptibility of the system to vehicles in a given lane being occluded by a large vehicle traveling in front in the same lane. Furthermore, these parameters combine to determine, for a vehicle of a given height, the uncertainty in the measurement of the position of the rear of the vehicle on the roadway, due to the projection effect. (See Figure 8.) This affects the accuracy of the system in determining whether a tall vehicle has cleared the crossing. From the perspective of this issue – accurately measuring whether the vehicle is on the crossing, the ideal camera location would be directly above the tracks, looking down on them with a tilt angle of 90º. However, depending on the height of the camera, this field of view would not image much of the roadway in advance of the crossing, nor the vehicle’s approach trajectory to the crossing. Vehicle tracking works best when the vehicle is in the field of view for a minimum of 2 seconds. Seeing the approach of the vehicle helps ensure that it is in the field of view long enough to be picked up as a legitimate target. Further, a camera mounted directly above the crossing would certainly not provide a field of view that would image the crossing gates or the lights. Additionally, cameras mounted very close to the crossing may interfere with railroad equipment at the crossing.
The fields of view represented in the data captured for this project by no means provide a rich enough set of data to draw anything but general guidelines on the values for h, d and β for an installation. From the experience of working with this data, the guidelines suggested would be to have d (distance of the camera from the crossing, as measured along the road, parallel to the lane lines) be on the range 50 to 100 feet. Similarly, a viable range for camera height seems to be 30 to 60 feet. Within these guidelines, we can further say that camera tilt angle should be on the range of 45º to 80º. A tilt angle more than this is very likely to present such too much of a “straight-on” view of the crossing that would introduce too much error in the determination of the position of the tail end of a tall vehicle along the roadway. Assuming a canonical “tall vehicle” height of 15 feet, and knowing the tilt angle and the apparent position (along the roadway) of the rear of the vehicle, it is possible to compute the error (due to the projection effect) in the actual position of the rear of the vehicle. This error can be factored into the measurement that determines if the vehicle has actually cleared the danger zone around the tracks. (The projection of the top of the vehicle onto the roadway may look like it has not cleared the danger zone, while the actual position of the rear of the truck, as determined by this correcting factor, can be determined to be beyond the danger zone.)
4.B.2.b FIELD OF VIEW FOR TRAIN PRESENCE DETECTION Train presence detection requires a field of view that is far enough back from the crossing that it shows the locomotive in at least 3 frames of the video sequence. A camera field of view that focuses very tightly on the crossing risks failing to capture the arrival of a high speed locomotive in sufficient numbers of frames to permit reliable speed measurement or, in the worst case, with sufficient clarity for accurate train arrival detection. For example, a high-speed train moving at 120 mph travels 176 feet per second. In 1/30 of a second (the time between frames), it travels 5.86 feet. To ensure that the leading edge of the train locomotive is captured in at least two successive frames, the field of view of the camera should be a minimum of 2.5 times the distance that
Figure 8 Low Mounted Camera Mounted Suffers More From
Projection Effect.
30
the fastest train moving through the crossing can travel in 1/30 of a second. For a high-speed train moving at 120 mph this amounts to a minimum distance of approximately 15 feet of train track shown in the camera field of view.
The camera field of view monitoring train detection should have the tracks oriented largely left to right in the camera image. The field of view should ensure that the wheel structures of the locomotive are visible in the camera image. The camera field of view should also ensure that a train passing on one track does not obscure a track behind it from being visible in the camera field of view. To avoid this, it may be required to mount an additional camera on the other side of the track so that this track is in the foreground of the second camera. Crossings with 3 or more tracks may require additional cameras.
4.B.2.c FIELD OF VIEW FOR GATE ARM DETECTION The camera mounting requirements for gate arm detection are similar to those for vehicle and train presence detection. However, whereas the train detection camera field of view can suffer from being too close to the tracks, the field of view required for gate arm detection can suffer from being too far away. The gate arms must be visible in the field of view with sufficient resolution for detection and tracking purposes. Good performance on gate detection occurred for gate arms whose smallest dimension (i.e., width) measured from 15 to 31 pixels, with specific instances at 15, 18 and 31. Erratic performance (gate arms tracked but occasionally missing a gate up or down event) occurred for gate arms whose smallest dimension measured from 12 to 15 pixels, with specific instances at 12 and 15 pixels. No gate arm detection occurred for gate arms whose smallest dimension measured less than 9 pixels, with specific instances at 7 and 9 pixels. Functions can be included in the GUI which advise the user during the setup procedure if there is sufficient image resolution on the gate arms for accurate and reliable detection.
The system can reliably monitor gates on the same side of the crossing as the camera. In the case of quad gate-equipped crossings, care must be taken with the camera field of view to ensure that the distant gate is not obstructed in the camera image. Additionally, the camera field of view should show the entire gate in the upright position. Failure to show the entire gate can compromise the ability of the system to detect broken gates.
4.B.2.d SIGNAL LIGHT DETECTION FIELD OF VIEW If vehicle presence detection is better served by a camera mounted high (30’ or above) to minimize projection effects, crossing signal light detection is best served by a camera mounted at lower heights to ensure that the crossing lights are visible during the day. Crossbuck-mounted crossing signal lights often employ hoods and filters that both shield and aim the light in the direction of traffic approaching the crossing. Whereas these light-aiming devices do not pose a problem for light visibility in the camera image at night, they do cause problems for visibility during the day.
The ideal camera position for detecting these lights is at a height of about 15-20 feet, mounted facing along the direction of travel (as opposed to toward the direction of travel) of vehicles approaching the crossing. Thus, unlike the camera used for vehicle detection, the signal light detection camera is looking at receding vehicle traffic at the crossing. If the crossbuck-mounted lights can be seen from a position beyond the crossing and looking back at it, then the signal-light monitoring camera can be mounted on the same pole as the vehicle and train presence detection camera, but at a lower height. As is the case for the gate arm detection, there is a requirement on the size of the lights for adequate visibility in the camera image. For adequate monitoring, the crossing should be imaged so that the diameter of a signal light measures a minimum of 11 pixels. This is based on analysis of signal light detection accuracy which showed good performance (lights detected when bright, with no false positives) for lights ranging in size from 11 to 29 pixels, with specific instances at 11, 12 and 29. Poor performance was observed for lights smaller than 10 pixels in diameter, with specific instances of 8 and 10 pixels.

31
4.B.2.e NUMBER OF CAMERAS NEEDED FOR CROSSING MONITORING It is important to note that the numbers of cameras required at a crossing depends upon i) the complexity/size of the crossing area to be monitored and ii) the events to be monitored at the crossing. If a system is deployed for the single purpose of monitoring the tracks themselves for vehicle presence detection, then, generally two cameras are required (one for each direction of vehicle travel across the crossing). A typical location for each of these cameras is on the far side of the crossing, looking back at the crossing and approaching traffic. For many crossings, these same two cameras can also monitor the arrival and passage of trains at the crossing as well as the status of gate arms. However, if the crossing is equipped with quad gates, it may be necessary to mount an additional camera on the same pole, but at a lower height, in order to see the quad exit gate in the camera field of view, with a view of it that is at all times unobstructed, even for multi-track crossings. This same, lower-mounted camera, will be able to see and monitor some of the crossing lights, though not likely all of them.
If enforcement is required at a crossing, then it is likely that 4 cameras will need to be deployed. These cameras may be deployed in a configuration that places one at each of the four “corners” of the crossing or a pair on each side of the crossing, where each of the cameras in a pair are looking back at oncoming vehicle traffic. For enforcement purposes, camera placement will depend at least in part on the content of the image that is legally required to be captured in order to issue a citation. Camera location is discussed in more detail in the Section 4.B.2.
Table 6 summarizes the information presented above. This table is offered only as a rough guideline. Specific numbers of cameras for a given site can only be determined once a site survey has been performed that identifies opportunities for as well as any constraints on camera location and fields of view.
4.B.2.f DESIRABLE CAMERA CONFIGURATIONS AT A CROSSING
Crossing Configuration
Monitoring Functions: Vehicle & Train Presence,
Gate Status and Signal Lights*
Monitoring Functions + Enforcement
2 4Variations:
"Standard crossing", with 3+ tracks 3 5"Standard crossing", with quad gates 4 4
"Standard crossing", with 6+ vehicle approach lanes 4 6
"Standard" Crossing: 1-2 tracks, Standard gates, 5 or less roadway lanes per vehicle approach direction
Table 6 Numbers of Cameras Required For Crossing Monitoring
*Note: If signal lights are equipped with hoods/shields and focusing lenses, not all signal lights are likely to be visible. “Enforcement” means capturing vehicle identifying information required for issuing citations.

32
Figure 9 depicts a desirable camera configuration for monitoring a single track crossing. A single camera can be located on a pole within 50-100’ of the crossing and at a height of about 40-50’ above the crossing to monitor vehicle presence detection, train detection and gate arm motion. If the crossbuck-mounted lights do not have shields and are visible on the far side of the crossing (looking back at the crossing in the direction of oncoming traffic), then it is possible to monitor the crossing lights with a second camera mounted at a lower height (15-20’) from this same pole. Mast arms may or may not be required to guarantee a field of view that is clear of any obstructions (e.g., trees) near the crossing.
If the crossbuck-mounted lights are not visible looking back from the far side of the crossing, then monitoring of all the crossing lights will require that the second camera be mounted on a second pole looking toward the crossing along the direction of traffic flow. This camera should be mounted at a distance from the crossing that allows the crossing lights to be visible in the image with at least the minimum pixel size.
This same consideration can be given to monitoring vehicles, gate arms and signal lights for the other direction of vehicle travel at the crossing.
In the case of a two-track crossing, it is advisable to monitor train presence using two cameras, one on either side of the crossing. One camera can be the vehicle/gate arm detector in one direction of vehicle travel. The other camera can be the vehicle/gate arm detector in the other direction of vehicle travel. Each camera will be assigned to monitor trains moving along the track in the foreground of its crossing view.
4.C LIGHTING CONSIDERATIONS AT THE CROSSING Low level crossing illumination does not affect the ability of the system to monitor the crossing lights at night. Nor does it affect the ability of the system to monitor most aspects of nighttime vehicle travel over the crossing or train arrival at the crossing at night. However, it can affect the ability of the system to accurately detect the presence of unlighted vehicles or train cars stopped on or moving through the crossing at night. To this extent, reliable night-time monitoring of a grade crossing cannot be performed unless the light sensitivity of the monitoring cameras is properly matched to the level of illumination at the crossing.
As part of a field survey of the crossing prior to system installation, the level of nighttime crossing illumination should be measured so that a proper camera can be chosen for crossing monitoring. In the case of crossings where night illumination is very low, either of two possible remedies can be taken. First, a camera can be chosen for installation from among those now available on the market which exhibit extremely good sensitivity to low levels of illumination at night. However, as discussed in Section 3.C.5.b, Alternate Camera Technology for Monitoring Dark Crossings (page 23) of this report, there is a strong argument to be made for illuminating a crossing with sufficient white light so that unlit vehicles and train cars can always be seen. Apart from
Camera 1Camera 2(alternative)
Camera 2FOV 1
FOV 2
Figure 9 Typical Camera Configuration Monitoring One Vehicle Direction at
Single Track Crossing
Camera 1 monitors vehicle and train presence as well as gate arm status. Camera 2 monitors signalization. If signal lights are visible from the far side of the crossing, Camera 2 may be mounted on same pole as Camera 1.
33
facilitating video monitoring with more standard camera technologies, such illumination can of itself directly help reduce grade crossing risk.
4.D DEPLOYMENT COSTS Without the experience of field deployment, it is not yet possible to give very accurate estimates of the costs for equipping a crossing with video monitoring capabilities. Certainly, the factors that can contribute to costs are the desired monitoring functionality, the number of cameras, the number and location of new poles needed for camera mounting, the need for real-time communications vs. a standalone monitoring system and the available infrastructure at the crossing (e.g., existing conduit, cabinet space, etc.) to support the installation.
At one end of the spectrum is a simple standalone monitoring system with two cameras, using existing poles. Such a system ought to be fielded for a total cost under $50,000, including engineering surveys and permits. At the other end of the spectrum is a system that includes monitoring and enforcement functions with a real-time communications link, whose cost could range in the neighborhood of $100,000 to $150,000. It is important to note that engineering design and construction costs are a significant component of these estimates, since the video cameras proposed for use are available on the market from such companies as Ultrak/Diamond at per-camera costs of $3000-$4000. Such engineering and construction costs can vary substantially, dependent on region of the country and time of year. The experience gained from multiple field deployments of grade crossing video monitoring systems will provide better information on which to estimate installation costs on a narrower and more accurate range.
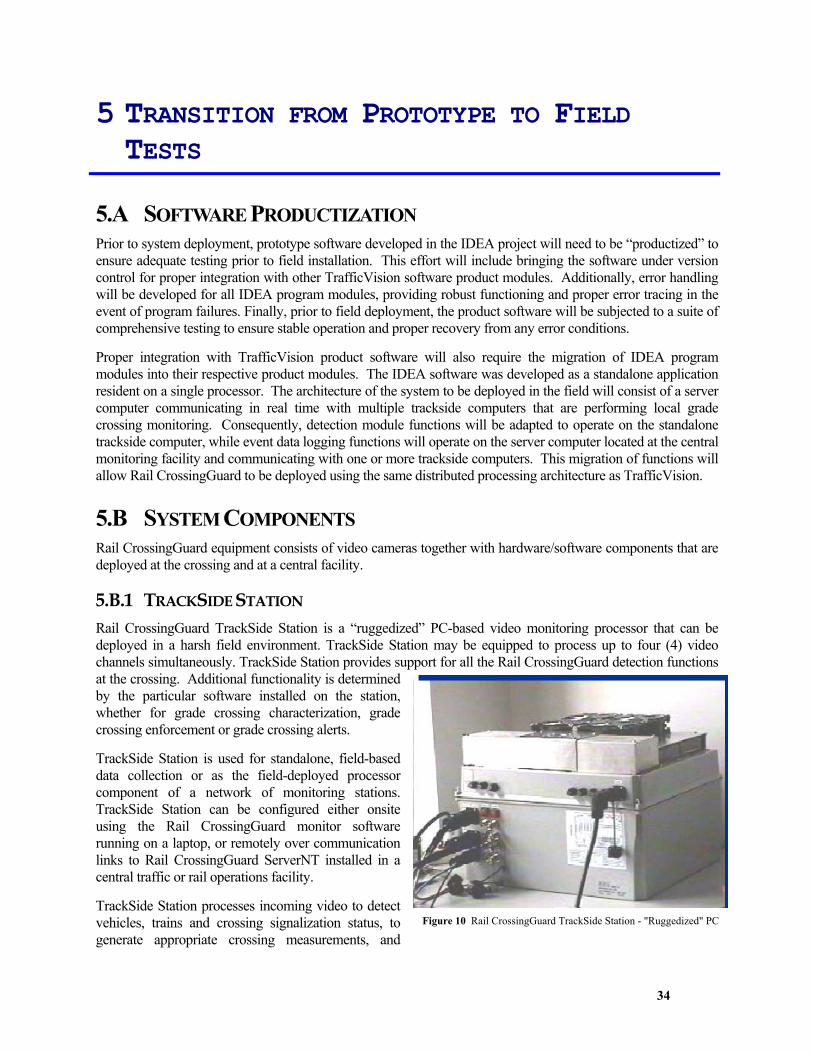
34
5 TRANSITION FROM PROTOTYPE TO FIELD TESTS
5.A SOFTWARE PRODUCTIZATION Prior to system deployment, prototype software developed in the IDEA project will need to be “productized” to ensure adequate testing prior to field installation. This effort will include bringing the software under version control for proper integration with other TrafficVision software product modules. Additionally, error handling will be developed for all IDEA program modules, providing robust functioning and proper error tracing in the event of program failures. Finally, prior to field deployment, the product software will be subjected to a suite of comprehensive testing to ensure stable operation and proper recovery from any error conditions.
Proper integration with TrafficVision product software will also require the migration of IDEA program modules into their respective product modules. The IDEA software was developed as a standalone application resident on a single processor. The architecture of the system to be deployed in the field will consist of a server computer communicating in real time with multiple trackside computers that are performing local grade crossing monitoring. Consequently, detection module functions will be adapted to operate on the standalone trackside computer, while event data logging functions will operate on the server computer located at the central monitoring facility and communicating with one or more trackside computers. This migration of functions will allow Rail CrossingGuard to be deployed using the same distributed processing architecture as TrafficVision.
5.B SYSTEM COMPONENTS Rail CrossingGuard equipment consists of video cameras together with hardware/software components that are deployed at the crossing and at a central facility.
5.B.1 TRACKSIDE STATION Rail CrossingGuard TrackSide Station is a “ruggedized” PC-based video monitoring processor that can be deployed in a harsh field environment. TrackSide Station may be equipped to process up to four (4) video channels simultaneously. TrackSide Station provides support for all the Rail CrossingGuard detection functions at the crossing. Additional functionality is determined by the particular software installed on the station, whether for grade crossing characterization, grade crossing enforcement or grade crossing alerts.
TrackSide Station is used for standalone, field-based data collection or as the field-deployed processor component of a network of monitoring stations. TrackSide Station can be configured either onsite using the Rail CrossingGuard monitor software running on a laptop, or remotely over communication links to Rail CrossingGuard ServerNT installed in a central traffic or rail operations facility.
TrackSide Station processes incoming video to detect vehicles, trains and crossing signalization status, to generate appropriate crossing measurements, and
Figure 10 Rail CrossingGuard TrackSide Station - "Ruggedized" PC

35
either store these on non-volatile local storage or transmit them periodically over a variety of communications networks to a Rail CrossingGuard ServerNT located at a central facility. Subject to the availability of appropriate communications, an optional surveillance package can equip TrackSide Station to transmit live compressed digital video as well as crossing operational and vehicle/train traffic data back to a central facility. TrackSide Station meets NEMA TS-2 environmental and electrical specifications. TrackSide Station will be optionally equipped with hardware/software interfaces to grade crossing controller and traffic controller devices in the vicinity of the crossing.
5.B.2 RAIL CROSSINGGUARD SERVERNT Rail CrossingGuard ServerNT consists of software executing on an office-environment PC workstation at a central traffic or rail operations facility. It provides an easy-to-use GUI for rapid remote setup and control of multiple TrackSide Station systems, plus data gathering, live video display, incident alarms and chart displays. Rail CrossingGuard ServerNT collects data from multiple TrackSide Station systems and stores the data on a central Rail CrossingGuard database. With network-based communications, ServerNT can provide communications for up to 64 TrackSide Station systems. This means that a total of 256 cameras may be controlled from a single ServerNT system. With suitable communications links to remote stations, Rail CrossingGuard Server can provide real time video surveillance of a user-selected crossing on the network of monitored crossings. The Server will receive alerts of vehicle presence on the crossing tracks and display information about the conditions of the detection. It will also be the repository for violation data when installed as part of Rail CrossingGuard Enforcement System.
When installed as part of an enforcement system, the Server will provide a version of the CrossingGuard CitationManagerTM software that can be used to review grade crossing violations, enter citation decisions, initiate the citation issuing process, including accessing registered owner vehicle information from the state Department of Motor Vehicles and preparing a citation from the recorded violation video data and registered owner information received from the DMV.
5.B.3 RAIL CROSSINGGUARD FIELDMONITOR Rail CrossingGuard FieldMonitor is software which is configured to run on a standard laptop PC for field-configuration and setup of standalone TrackSide PC stations. Rail CrossingGuard FieldMonitor will communicate with any TrackSide PC over an Ethernet connection. Rail CrossingGuard FieldMonitor will also support in field data retrieval from standalone TrackSide PC’s, and maintain a database of all crossing data collected from field stations.
5.B.4 CAMERAS
TrackSide StationPC in Controller
Cabinet
Rail CrossingGuardServer in Central
ProcessingFacilityHigh Speed
PhoneLines
ANALOGVIDEO
DIGITAL
Figure 11 Rail CrossingGuard TrackSide Station Communicating Video/Data to Server in Remote
Facility

36
Rail CrossingGuard products will use NTSC 640x480 color, pan-tilt-zoom video cameras similar to the surveillance camera shown in Figure 12. (Optionally, fixed mount cameras can also be used for basic grade crossing monitoring, but without the ability to provide remote control of the video camera for adjustable field of view surveillance.) The number of cameras required at a crossing will be a function of the complexity of the grade crossing. To support violation enforcement, one or more fast-PTZ cameras will be needed to support the task of imaging the violation to provide a human-readable picture of the violating vehicle’s license plate and, where required, of the vehicle operator.
Nestor uses PTZ cameras including those provided by Diamond Electronics, an Ultrak Company. Diamond is a well-established manufacturer of high quality PTZ surveillance systems for the security and traffic markets, serving both indoor and outdoor surveillance needs.
5.B.5 COMMUNICATIONS Rail CrossingGuard’s communications architecture is built on top of the Qwest national fiber-optic communications backbone. High transmission rate (equivalent to T1 speed) land-based phone lines or wireless LAN’s connect each Rail CrossingGuard-equipped grade crossing to the Qwest fiberoptic backbone. Over this network, grade crossing video and data flow securely to Rail CrossingGuard workstations installed at traffic and/or rail operations monitoring facilities. Additionally, the NTS Network Operations Center is a node on this network, linked with all Rail CrossingGuard TrackSide Stations, Workstations, and camera equipment to provide 24 hour / 7 day a week remote diagnostics and equipment troubleshooting.
5.C OVERVIEW OF RAIL CROSSINGGUARD PRODUCT FAMILY Rail CrossingGuard will consist of a family of related products. All product members will share a common platform of functions, with each member distinguished by additional capabilities targeted at grade crossing characterization, enforcement or real-time signalization/control. Among the common product functions will be the GUI for system configuration, detection functions for vehicle/train/signalization event registration, data logging capabilities and the definition and logging of grade crossing “alert” conditions.
Nestor anticipates introducing three types of Rail CrossingGuard systems to the market. One will be a Grade Crossing Characterization System, whose primary purpose will be to gather data on grade crossing operation and vehicle/train behavior. The Characterization System functions will be available either as part of permanently deployed systems (standalone or networked to an Operations Center) or as part of portable systems that can be moved from crossing to crossing for temporary data gathering activity.
The second product family member will be a Rail CrossingGuard Enforcement System that will combine the crossing monitoring functions with additional software, hardware and cameras specifically focused on capturing vehicle-identifying information for vehicles that violate the crossing. This system will leverage the Rail CrossingGuard crossing monitoring functions with the violator digital video recording capabilities native to Nestor’s CrossingGuard product for traffic signal violation detection and enforcement.
Finally, Nestor anticipates integration of Rail CrossingGuard with communications to signalization, train control centers and trains to provide real-time alerts of hazardous grade crossing conditions in order to affect local signalization and/or to provide information as appropriate to help respond to instances of clear and present danger. Communication to devices at the crossing could include an interface to the wayside controller to delay quad exit gate closure if a vehicle is present on the tracks, or to a nearby traffic signal controller to flush a traffic queue to prevent vehicle backup on the tracks, or to a local alarm/siren at the crossing to warn of vehicle presence on the tracks when the crossing is activated.
Figure 12 Diamond UltraDome KD6
Camera/Dome Tracking System
37
A more complete discussion of the Rail CrossingGuard product family may be found in Section 7, Appendix A – Rail CrossingGuard Product Family, page 7–1 and following.
5.D PILOT INSTALLATIONS: FLORIDA AND ILLINOIS This IDEA Project will be followed in early 2000 with pilot installations of the Rail CrossingGuard system to demonstrate and test system performance in the field. Nestor has signed contracts for these pilot installations with the Florida Department of Transportation and with DuPage County Department of Transportation, Illinois.
5.D.1 RAIL CROSSINGGUARD MONITORING AND ENFORCEMENT IN SOUTH FLORIDA
In a 15-month pilot project set to begin in January 2000, Nestor will install a network of Rail CrossingGuard monitoring systems at 5 consecutive crossings along the South Florida corridor. This project is being funded by a 1036 Grant to the Florida Department of Transportation.
The crossings to be equipped are all in the Ft. Lauderdale area and include Prospect Ave (ADT 27,000), Powerline Road (ADT 27,000), Commercial Blvd (ADT 55,000), Cypress Creek (ADT 50,500) and McNab Road (ADT 15,500). Prospect Avenue and Powerline Roads intersect at right angles, and the railroad tracks cut diagonally across both roads very close to this intersection. Each of these two crossings will be monitored in one direction only. All other crossings will be monitored in both directions. McNab Road has quad gates installed. All crossings have either two or three active tracks; commuter (TriRail), passenger (Amtrak) and freight (CSX) train traffic move through the crossings daily.
Nestor will install grade crossing characterization systems at all five crossings. These monitoring stations will use high-speed communications to transmit real-time data and, optionally, video of grade crossing activity to a central server located at the Florida DOT district office. (The district office is no more than 4 miles from the most distant crossing.) Each crossing will be equipped with the capability to detect vehicle, train and signalization status, as shown in the IDEA project demonstration system. Further, one of the crossings will be equipped with additional cameras for automated enforcement. At this crossing, gate violations will be detected and violating vehicles will be imaged in order to record a close up of the license plate of the violating vehicle. No citations will be issued in this program, but this part of the project will serve to document the kinds of grade crossing violations that are occurring as well as the feasibility of using automated video monitoring technology for effective and fair enforcement of grade crossing violations. The project will conclude with a report on the effectiveness of the systems and the lessons learned in the course of the pilot program.
5.D.2 RAIL CROSSINGGUARD ENFORCEMENT DUPAGE COUNTY, ILLINOIS In early 2000, Nestor will install a Rail CrossingGuard enforcement system at the Sunset Avenue crossing in Winfield Township in DuPage County, Illinois. The project is sponsored by the Illinois Commerce Commission as part of a pilot program to evaluate digital automated grade crossing enforcement technology. Nestor will install Rail CrossingGuard with enforcement extensions to monitor both directions of travel at the crossing. The system will detect grade crossing violations and control the Pan-Tilt-Zoom video cameras deployed at the crossing to automatically zoom in on the violating vehicle to record a close-up of the vehicle license plate and as well as the driver image. The violation videos captured at the crossing will be digitized and transmitted in real time over high speed telephone connections to the DuPage County Sheriff’s offices for follow-on review. Nestor will provide DuPage County law enforcement officials with a software application to review violation video clips, extract relevant image frames and to prepare a citation. DuPage County officials expect to issue tickets using the system throughout the course of the two-year pilot program.
In the first phase of the program, the system will directly interface with the crossing wayside controller to derive information on grade crossing signalization status. Once the capability to determine signalization status directly
38
from video images alone has been successfully piloted in the South Florida project, the DuPage County system software will be upgraded to include this functionality and the interface with the wayside controller will be disconnected. This will allow the system to function as a completely video-based grade crossing enforcement system.
39
6 SUMMARY & CONCLUSIONS This IDEA project has demonstrated the feasibility of using Nestor’s advanced neural network-based video processing technology to reliably detect a number of grade crossing events that are the basis for improving grade crossing safety. The prototype system developed in this project performs detection of vehicles present on the crossing tracks, the arrival and departure of trains from the crossing, and the status of grade crossing signalization (gates and flashing lights) accurately and in real time, under a variety of crossing, illumination and visibility conditions.
Nestor has also demonstrated the feasibility of performing system setup and configuration for automated grade crossing video processing using an easy-to-use graphical user interface. The setup process requires a minimal amount of site survey data, and can typically be accomplished within 20 minutes. It requires no special computer skills. Ease of system setup and deployment will facilitate use of the system at grade crossings on either a permanent or temporary basis.
In the course of this project, Nestor has also identified opportunities for using video monitoring to improve grade crossing safety. These include systems for collecting operational data on grade crossing utilization by vehicles and trains, as well as the operation of the grade crossing signalization system. Additionally, automated video monitoring can be the basis for automated grade crossing enforcement systems that can reduce grade crossing risk by helping to modify driver behavior. Finally, opportunities also exist for using video monitoring to affect local grade crossing alarms and signalization (both at and nearby the crossing) as a means of identifying in real-time and responding to immediate situations of high risk at the crossing. Drawing upon the knowledge and experience of a number of experts in grade crossing safety, this project has also identified a number of very specific requirements for grade crossing video monitoring in each of these application areas.
As a result of this project, Nestor has developed a set of deployment specifications that can serve as guidelines for initial system installations. These specifications deal largely with camera placement as well as lighting issues at the crossing. Taken together, these guidelines aim to ensure an appropriate field of view and image quality for reliable, round-the-clock crossing monitoring.
The prototype system that has been developed in the context of this project needs further in-field testing to determine levels of equipment reliability and accuracy of sensor performance over extended periods of time and under a larger range of weather, visibility and traffic conditions. This testing will occur at multiple crossing installations in 2000.
7–1
7 APPENDIX A – RAIL CROSSINGGUARD PRODUCT FAMILY
Rail CrossingGuard will consist of a family of related products. Family members will share a common platform of functions, with each member distinguished by additional capabilities targeted at either grade crossing characterization, enforcement or real time signalization/control.
7.A COMMON FUNCTIONALITY Rail CrossingGuard will be designed to provide reliable detection of vehicles and trains within presence alert zones at the crossing specified by the user during setup and configuration. Separate alert zones will be defined for vehicles in the neighborhood of one or more tracks at the crossing. The system will also be able to detect and track vehicles outside the alert zone in the vicinity of the crossing. (This full field-of-view tracking enables other functions, such as the software-controlled camera vehicle tracking used for vehicle grade crossing violation recording.) The presence of vehicles in the vehicle alert zone will be the basis for generating alert/warning messages in the event of an approaching train or if vehicle presence in the alert zone exceeds some user-specified time period. The system will also be able to detect the status of grade crossing signalization; in particular, the gates and lights, as visible in the camera field of view. Broken gates will be detected if they result in a substantive change in the appearance of the gate arm. These detection capabilities will apply to all grade crossing monitoring products.
All Rail CrossingGuard grade crossing monitoring product family members will feature an easy-to-use graphical user interface (GUI) for rapid setup of the system for processing video from one or more cameras deployed at a grade crossing. For a given camera field of view, the GUI will support the specification of vehicle travel lanes at the crossing as well as the specification of multiple train tracks at the crossing. (Note: It is assumed that the camera can be oriented so that the direction of vehicle travel is largely up/down in the image and the direction of train travel is largely left/right.) The GUI will support the specification of the distances from the camera to a user-chosen reference point in the camera field of view so that physical measurements (i.e., length and speed) of objects in the crossing can be determined from video image properties.
Additionally, the GUI will support the entry of a crossing label that will serve as a unique crossing identifier, as well as other physical parameters that characterize the crossing (e.g., number of tracks, presence and type of signalization, etc.) The GUI will provide the user with a means to enter the time intervals for traffic data accumulation during the day (i.e., a count of vehicles passing over the crossing by lane of travel collected in successive 5-minute intervals, or 60-minute intervals, etc.) and the specification of user defined “vehicle alert zones” for use by the detection function to generate alert signals.
The GUI will support the definition of grade crossing alerts that can be generated by the system in the event that certain crossing conditions are detected, such as vehicle presence in the vehicle alert zone when crossing signalization is active, and failure of one or more signal controls (gates and/or lights) when signalization is active.
All products that capture crossing operational and vehicle/train traffic flow information will store data in a database-ready format. The user will have the option of storing the information in a CSV (comma separated value) file that can be readily imported into nearly all database applications. Alternatively, the information can be stored in an ODBC-compliant database table, which is also directly accessible by many database applications. A set of Microsoft Access queries, reports and graphical displays will be available to profile the information for review and analysis, and these can serve as templates for additional user-defined database queries, reports and graphs.
7–2
The Rail CrossingGuard Enforcement System will store all violation video and text data as part of a violation record in a violation database maintained on the central server. A facility will exist to review the violation video and text data, enter violation decisions and profile trends in violations by time of day, location, etc.
7.B DATA COLLECTION Gathering operational data of grade crossing events is critical to accurately assess and monitor ongoing crossing risk. Such data may include crossing signal functional status, false signal or gate activations, train and vehicle traffic, classification of vehicles, the number of crossing signal violations, violation trends by time of day etc. The data could be captured by a passive video monitoring system that is either permanently or temporarily deployed at a crossing. Having access to this valuable information, and a convenient means of maintaining it, will enable local and federal authorities to develop and maintain an up-to-date database of statistics to assist in improving highway-rail grade crossing safety and management.
Based upon its vehicle, train and signalization detection capabilities, the Rail CrossingGuard Crossing Characterization System will capture and store a number of measurements that characterize the operation of the grade crossing as well as the nature of vehicle and train traffic through the crossing.
Rail CrossingGuard Crossing Characterization System will detect and measure vehicle and train activity at a crossing, capturing such information as vehicle flows, average vehicle speeds and detecting risk-related events such as vehicle violations. Each violation will be characterized by crossing location, lane of travel, direction of travel, time of day, elapsed time of violation after onset of crossing activation, elapsed time between violation and train arrival at the crossing, and vehicle speed.
Train travel at the crossing will be measured in terms of train arrival and departure times, and train speed will be measured by cab-front speed and last car speed. Events that involve stopped trains at a crossing will be noted with the time when the train stopped and the time when the train resumed travel through the crossing.
Signalization status will be reported in terms of a log of times when the signals were activated and when activation was ended. Each activation will be further characterized by the elapsed time between activation and train arrival and the elapsed time between train departure and termination of activation. Any failure of particular crossing equipment (gate or flashing light) to activate will be noted for each listed event.
7.B.1 VEHICLE CROSSING USAGE INFORMATION Rail CrossingGuard Crossing Characterization System will be available with an option to create and maintain a Vehicle Crossing Usage File. This function will capture and store images of any vehicle that matches one of a set of possible target vehicle classes (e.g., bus, small truck, large truck) specified by the user. When the system detects one of these vehicles at the crossing, it will capture an image of the vehicle at a predefined position in the crossing. When Rail CrossingGuard Crossing Characterization System operates as a standalone system, these images will be stored to disk for later retrieval to a laptop PC running software that communicates with the TrackSide PC. A software utility will be available to view the captured images and to assign them to user-defined vehicle classifications to profile crossing usage by particular vehicle types (e.g., school buses, emergency vehicles, gasoline trucks, boat haulers, etc.) This detailed information on vehicles using the crossing will assist in determining a more accurate assessment of crossing risk.
7.B.2 PORTABLE ENCLOSURE FOR RAIL CROSSINGGUARD CROSSING CHARACTERIZATION SYSTEM
Nestor Traffic Systems plans to offer a portable enclosure suitable for deploying a Rail CrossingGuard Crossing Characterization System consisting of a standalone TrackSide PC station together with one or two video cameras for temporary grade crossing monitoring and data collection. Candidates for such an enclosure are a

7–3
tow-able trailer-sized vehicle or a lightweight cabinet the size of a small traffic controller cabinet. This portable enclosure will be designed to support the rapid deployment and re-deployment of standalone Crossing Characterization System for use in profiling grade crossing vehicle/train traffic and signalization operation to assess grade crossing risk. Nestor Traffic Systems has applied to the Federal Railroad Administration for support for the engineering effort to construct and field-test such portable video enclosure systems, with the initial objective of using them to profile heavy vehicle usage at crossings along High Speed Rail corridors. A description of the goals of this proposed development project is available from Nestor.
7.C ENFORCEMENT The Rail CrossingGuard Enforcement System is a networked system that allows a ruggedized PC installed at the crossing to communicate violation data over high speed communications lines (phone lines configured to transmit at either DSL or T1 communication rates) to an enforcement server PC operating at a central facility. The PC at the crossing controls pan-tilt-zoom cameras installed at the crossing to detect violations and record violation data. The central Server will manage communications with one or more Trackside PC systems and will provide violation storage and reviewing functionality.
The Rail CrossingGuard Enforcement System will feature many of the capabilities currently supported by CrossingGuard for automated enforcement of red light violations at intersections. It will provide for video-based violation detection and recording, capturing one or more digital violation video clips showing close-up images of the violating vehicle license plate and, optionally, operator image. The violation video will be transmitted over high speed phone line communications to a central facility. At the central facility, Rail CrossingGuard Server software will manage all video and data communication with the trackside equipment. It will also provide the ability to view candidate violation video files, enter decisions about whether or not to issue citations, and initiate the citation issuing process.
The availability of high-speed communications between a Trackside PC and a central server provides the most efficient use of resources, avoiding the need for routine in-field retrieval of violation data. It also ensures the highest level of information security by avoiding the requirement of storing any violation data on the Trackside PC. Sensitive violation data is quickly transferred to a secure facility for authorized review and permanent storage.
High speed communications networking a Trackside PC to a central server also provide the ability for live monitoring of crossing conditions and events. This live monitoring functionality, which includes remote control of pan-tilt-zoom cameras at the crossing through the Rail CrossingGuard Server PC, affords the central facility with the greatest opportunity for monitoring crossing activity to assess the true nature of any reported incidents or hazardous conditions and to most effectively allocate and direct maintenance and/or emergency response units.
7.D REAL TIME ALERTS/SIGNALIZATION CONTROL A third opportunity to reduce grade crossing risk involves real-time integration of Rail CrossingGuard video-based monitoring with signalization, train control centers and trains. Combining the system’s ability to reliably detect hazardous conditions with real-time communications with crossing signals and/or trains and control centers can help avoid potentially life-threatening situations. If a vehicle or obstacle is detected on the tracks when a train is approaching, communication with a signal controller could, for example, delay quad exit closure, purge a traffic queue that is causing traffic to back up onto the crossing, or activate local warning devices deployed at the crossing to alert drivers to the dangerous condition. Ample warning with real-time information may be the crucial capability that helps avert a potentially fatal crash.
The third member of the product family, Rail CrossingGuard Alert will provide an ability to define grade crossing alerts on the basis of certain detection conditions, including the presence of certain input signals from

7–4
an external device such as a crossing controller or other application which might communicate train location information. (Specific interfaces will be available to support input communications with such devices.) If an alert is triggered by a TrackSide PC that is networked over a communications line to a central server, it will cause an audible alarm and/or visual display to occur at the Server PC in the central facility. Alerts will also be stored in the measurement log file and will be available for output over a data communication port to an external device.
The definition, detection and recording of alert conditions will be supported in the Rail CrossingGuard Crossing Characterization Systems. Rail CrossingGuard Alert will provide a user interface function to implement an alert-handling function to assign priorities to alerts, how they will be displayed, where they will be communicated and the follow-on actions that are to result. Some follow-on actions may take advantage of interfaces to specific devices at or in the vicinity of the crossing (e.g., local warning lights or horns, gate crossing arm controllers, traffic signal light controllers at nearby intersections.)
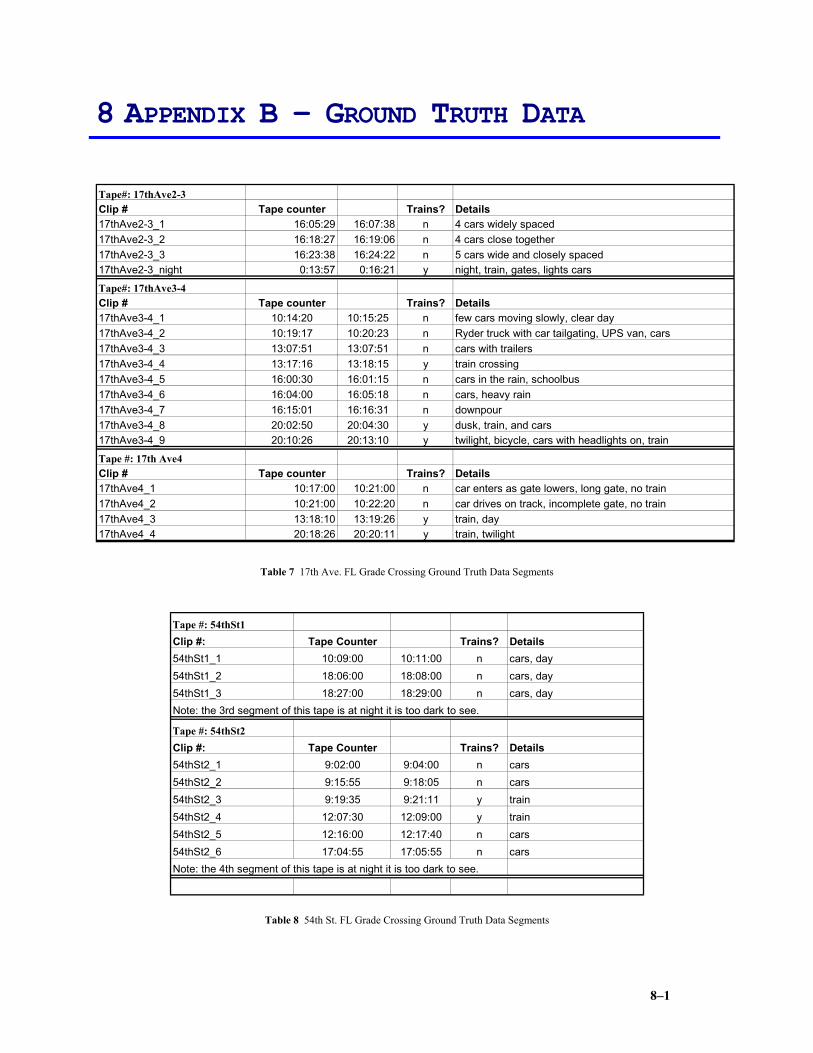
8–1
8 APPENDIX B – GROUND TRUTH DATA
Tape#: 17thAve2-3Clip # Tape counter Trains? Details17thAve2-3_1 16:05:29 16:07:38 n 4 cars widely spaced17thAve2-3_2 16:18:27 16:19:06 n 4 cars close together17thAve2-3_3 16:23:38 16:24:22 n 5 cars wide and closely spaced17thAve2-3_night 0:13:57 0:16:21 y night, train, gates, lights cars
Tape#: 17thAve3-4Clip # Tape counter Trains? Details17thAve3-4_1 10:14:20 10:15:25 n few cars moving slowly, clear day17thAve3-4_2 10:19:17 10:20:23 n Ryder truck with car tailgating, UPS van, cars17thAve3-4_3 13:07:51 13:07:51 n cars with trailers17thAve3-4_4 13:17:16 13:18:15 y train crossing17thAve3-4_5 16:00:30 16:01:15 n cars in the rain, schoolbus17thAve3-4_6 16:04:00 16:05:18 n cars, heavy rain17thAve3-4_7 16:15:01 16:16:31 n downpour17thAve3-4_8 20:02:50 20:04:30 y dusk, train, and cars17thAve3-4_9 20:10:26 20:13:10 y twilight, bicycle, cars with headlights on, train
Tape #: 17th Ave4Clip # Tape counter Trains? Details17thAve4_1 10:17:00 10:21:00 n car enters as gate lowers, long gate, no train17thAve4_2 10:21:00 10:22:20 n car drives on track, incomplete gate, no train17thAve4_3 13:18:10 13:19:26 y train, day17thAve4_4 20:18:26 20:20:11 y train, twilight
Table 7 17th Ave. FL Grade Crossing Ground Truth Data Segments
Tape #: 54thSt1Clip #: Tape Counter Trains? Details54thSt1_1 10:09:00 10:11:00 n cars, day 54thSt1_2 18:06:00 18:08:00 n cars, day 54thSt1_3 18:27:00 18:29:00 n cars, day Note: the 3rd segment of this tape is at night it is too dark to see.
Tape #: 54thSt2Clip #: Tape Counter Trains? Details54thSt2_1 9:02:00 9:04:00 n cars54thSt2_2 9:15:55 9:18:05 n cars54thSt2_3 9:19:35 9:21:11 y train54thSt2_4 12:07:30 12:09:00 y train54thSt2_5 12:16:00 12:17:40 n cars54thSt2_6 17:04:55 17:05:55 n carsNote: the 4th segment of this tape is at night it is too dark to see.
Table 8 54th St. FL Grade Crossing Ground Truth Data Segments
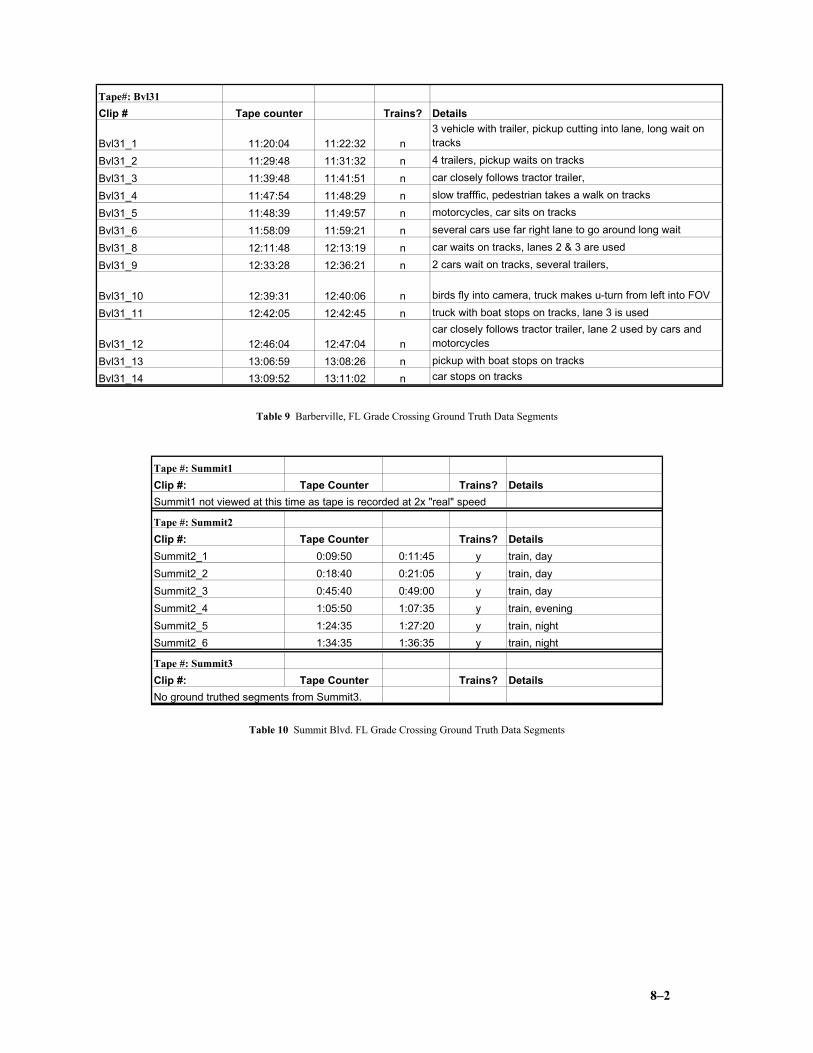
8–2
Tape#: Bvl31Clip # Tape counter Trains? Details
Bvl31_1 11:20:04 11:22:32 n3 vehicle with trailer, pickup cutting into lane, long wait on tracks
Bvl31_2 11:29:48 11:31:32 n 4 trailers, pickup waits on tracks
Bvl31_3 11:39:48 11:41:51 n car closely follows tractor trailer,
Bvl31_4 11:47:54 11:48:29 n slow trafffic, pedestrian takes a walk on tracks
Bvl31_5 11:48:39 11:49:57 n motorcycles, car sits on tracks
Bvl31_6 11:58:09 11:59:21 n several cars use far right lane to go around long wait
Bvl31_8 12:11:48 12:13:19 n car waits on tracks, lanes 2 & 3 are used
Bvl31_9 12:33:28 12:36:21 n 2 cars wait on tracks, several trailers,
Bvl31_10 12:39:31 12:40:06 n birds fly into camera, truck makes u-turn from left into FOV
Bvl31_11 12:42:05 12:42:45 n truck with boat stops on tracks, lane 3 is used
Bvl31_12 12:46:04 12:47:04 ncar closely follows tractor trailer, lane 2 used by cars and motorcycles
Bvl31_13 13:06:59 13:08:26 n pickup with boat stops on tracks
Bvl31_14 13:09:52 13:11:02 n car stops on tracks
Table 9 Barberville, FL Grade Crossing Ground Truth Data Segments
Tape #: Summit1Clip #: Tape Counter Trains? DetailsSummit1 not viewed at this time as tape is recorded at 2x "real" speed
Tape #: Summit2Clip #: Tape Counter Trains? DetailsSummit2_1 0:09:50 0:11:45 y train, daySummit2_2 0:18:40 0:21:05 y train, daySummit2_3 0:45:40 0:49:00 y train, daySummit2_4 1:05:50 1:07:35 y train, eveningSummit2_5 1:24:35 1:27:20 y train, nightSummit2_6 1:34:35 1:36:35 y train, night
Tape #: Summit3Clip #: Tape Counter Trains? DetailsNo ground truthed segments from Summit3.
Table 10 Summit Blvd. FL Grade Crossing Ground Truth Data Segments

8–3
Tape#: Kent 2Clip# VCR Counter Trains? DetailsKent2_1 0:06:44 0:08:44 n cars in both lanesKent2_2 0:29:30 0:31:00 n cars in both lanesKent2_3 0:55:55 0:58:05 n cars in both lanesKent2_4 1:55:10 1:56:40 y train
Tape#: Kent 3Clip# VCR Counter Trains? DetailsKent3_1 0:39:20 0:40:50 y night trainKent3_2 0:16:10 0:18:10 n two trucks block view, interesting problem?
Tape#: Kent 4Note: Kent 4 not viewed at this time because no signals or gate arms are visible.
Tape#: Kent 5Clip# VCR Counter Trains? DetailsKent5_1 0:29:40 0:31:50 n cars at daybreak, headlightsKent5_2 0:47:05 0:49:35 n mixed on and off headlightsKent5_3 1:33:42 1:32:35 n mixed on and off headlightsKent5_4 1:49:20 1:51:10 n cars day no lights
Tape#: Kent 6Clip# VCR Counter Trains? DetailsKent6_1 0:22:50 0:24:05 n cars, funky lane changeKent6_2 0:34:40 0:36:15 y train, signal lights not visibleKent6_3 0:51:10 0:52:10 n cars and trucks lane changesKent6_4 0:55:10 0:58:55 y train, signal lights not visibleKent6_5 1:31:00 1:33:30 n trucks in lane 2 block views of veh. in lane 1
Tape#: Kent 7Clip# VCR Counter Trains? DetailsKent7_1 0:10:25 0:12:10 y evening, train, only signals 1&2 visibleKent7_2 0:46:10 0:47:21 y evening, train, all signals visibleNote: the 2nd 1/2 of Kent 7 is at night, very few cars pass & no trains, no clips taken
Table 11 Kent, WA Grade Crossing Ground Truth Data Segments
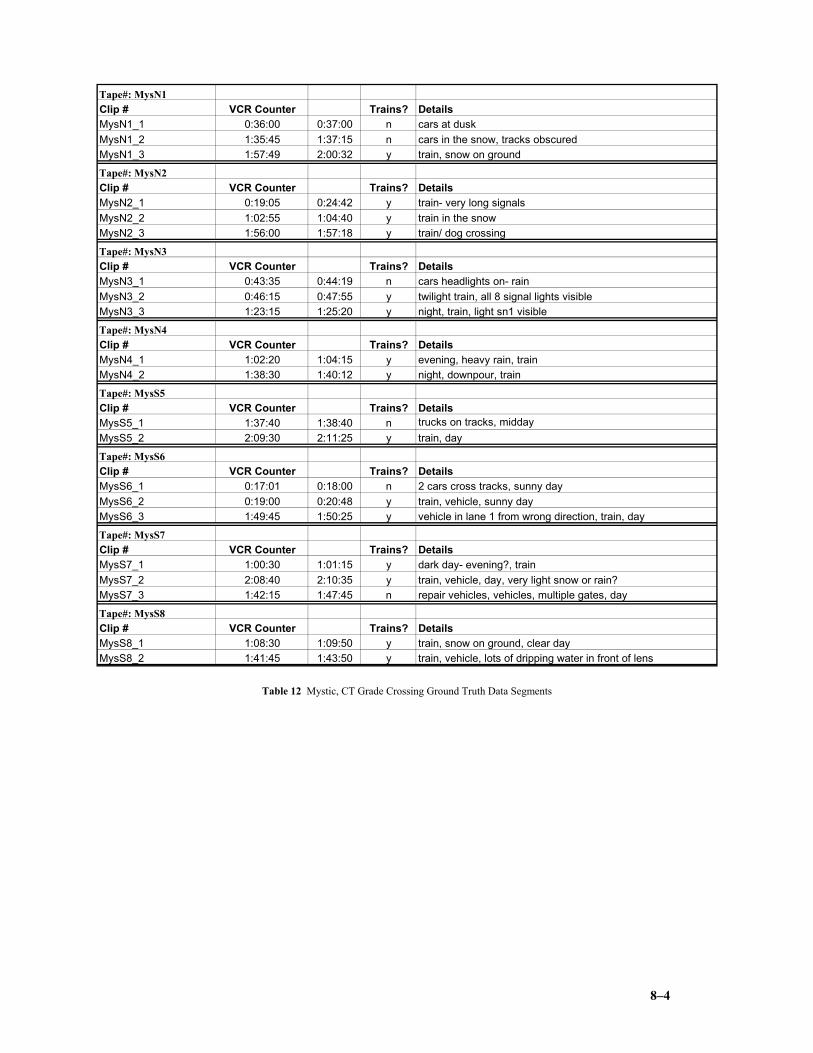
8–4
Tape#: MysN1Clip # VCR Counter Trains? DetailsMysN1_1 0:36:00 0:37:00 n cars at duskMysN1_2 1:35:45 1:37:15 n cars in the snow, tracks obscuredMysN1_3 1:57:49 2:00:32 y train, snow on ground
Tape#: MysN2Clip # VCR Counter Trains? DetailsMysN2_1 0:19:05 0:24:42 y train- very long signalsMysN2_2 1:02:55 1:04:40 y train in the snowMysN2_3 1:56:00 1:57:18 y train/ dog crossing
Tape#: MysN3Clip # VCR Counter Trains? DetailsMysN3_1 0:43:35 0:44:19 n cars headlights on- rainMysN3_2 0:46:15 0:47:55 y twilight train, all 8 signal lights visibleMysN3_3 1:23:15 1:25:20 y night, train, light sn1 visible
Tape#: MysN4Clip # VCR Counter Trains? DetailsMysN4_1 1:02:20 1:04:15 y evening, heavy rain, trainMysN4_2 1:38:30 1:40:12 y night, downpour, train
Tape#: MysS5Clip # VCR Counter Trains? DetailsMysS5_1 1:37:40 1:38:40 n trucks on tracks, middayMysS5_2 2:09:30 2:11:25 y train, day
Tape#: MysS6Clip # VCR Counter Trains? DetailsMysS6_1 0:17:01 0:18:00 n 2 cars cross tracks, sunny dayMysS6_2 0:19:00 0:20:48 y train, vehicle, sunny dayMysS6_3 1:49:45 1:50:25 y vehicle in lane 1 from wrong direction, train, day
Tape#: MysS7Clip # VCR Counter Trains? DetailsMysS7_1 1:00:30 1:01:15 y dark day- evening?, trainMysS7_2 2:08:40 2:10:35 y train, vehicle, day, very light snow or rain?MysS7_3 1:42:15 1:47:45 n repair vehicles, vehicles, multiple gates, day
Tape#: MysS8Clip # VCR Counter Trains? DetailsMysS8_1 1:08:30 1:09:50 y train, snow on ground, clear dayMysS8_2 1:41:45 1:43:50 y train, vehicle, lots of dripping water in front of lens
Table 12 Mystic, CT Grade Crossing Ground Truth Data Segments

8–5
Tape#:Spourd 1Clip # VCR Counter Trains? DetailsSpourd1_1 0:07:55 0:09:40 n clear day, carsSpourd1_2 0:21:10 0:22:50 y train and carsSpourd1_3 0:49:00 0:50:50 y train and carsSpourd1_4 1:40:30 1:44:20 n cars only
Tape#:Spourd 2Clip # VCR Counter Trains? DetailsSpourd2_1 0:23:45 0:25:20 n vehicle on tracks, clear daySpourd2_2 1:21:05 1:22:50 n vehicles
Tape#:Spourd 3Clip # VCR Counter Trains? DetailsSpourd3_1 0:06:00 0:08:00 n cars, man on tracksSpourd3_2 0:47:30 0:50:00 n tractor trailerSpourd3_3 1:23:50 1:26:10 y train, cars
Tape#:Spourd 4Clip # VCR Counter Trains? DetailsSpourd4_1 1:39:50 1:45:10 y night, very long train crossing*note: very uneventful tape, 1 train and very few cars crossing.
Tape#:SpourdS5Clip # VCR Counter Trains? DetailsSpourdS5_1 0:21:05 0:24:10 y train, day, carsSpourdS5_2 1:52:55 1:54:40 y train, day, cars
Tape#:SpourdS6Clip # VCR Counter Trains? DetailsSpourdS6_1 0:12:40 0:19:00 y very long freight trainSpourdS6_2 1:10:10 1:12:15 n carsSpourdS6_3 1:12:30 1:15:00 y train & cars
Table 13 Spokane, WA Grade Crossing Ground Truth Data Segments