a network infrastructure for real-time monitoring of
TRANSCRIPT

Scholars' Mine Scholars' Mine
Masters Theses Student Theses and Dissertations
Fall 2007
A network infrastructure for real-time monitoring of campus A network infrastructure for real-time monitoring of campus
energy consumption energy consumption
Sandeep Kunchum
Follow this and additional works at: https://scholarsmine.mst.edu/masters_theses
Part of the Computer Engineering Commons
Department: Department:
Recommended Citation Recommended Citation Kunchum, Sandeep, "A network infrastructure for real-time monitoring of campus energy consumption" (2007). Masters Theses. 4587. https://scholarsmine.mst.edu/masters_theses/4587
This thesis is brought to you by Scholars' Mine, a service of the Missouri S&T Library and Learning Resources. This work is protected by U. S. Copyright Law. Unauthorized use including reproduction for redistribution requires the permission of the copyright holder. For more information, please contact [email protected].

A NETWORK INFRASTRUCTURE FOR REAL-TIME MONITORING OF
CAMPUS ENERGY CONSUMPTION
by
SANDEEP KUNCHUM
A THESIS
Presented to the Faculty of the Graduate School of the
UNIVERSITY OF MISSOURI–ROLLA
In Partial Fulfillment of the Requirements for the Degree
MASTER OF SCIENCE IN COMPUTER ENGINEERING
2007
Approved by
Sahra Sedigh Sarvestani, Advisor Scott Smith
Badrul Chowdhury


iii
ABSTRACT
Pressing environmental concerns and rising energy costs have led many orga-
nizations to carefully review their energy consumption. Conservation requires that
energy use be monitored accurately and continuously, to identify areas with higher
energy consumption. Lighting has repeatedly been identified as such an area. A
simple, yet effective method for reducing lighting energy consumption is retrofitting
existing light fixtures with modern energy-efficient versions.
The University of Missouri-Rolla is currently carrying out a lighting retrofit of
all fixtures on campus. The pilot building for this project is McNutt Hall, as it has
the single highest consumption of lighting energy. The results of the pilot study will
be used to guide the remainder of the retrofit project.
The focus of the research described in this thesis is the development and de-
ployment of an automated, networked system for real-time monitoring of lighting
energy. The specific contributions of the research involve the design of the lighting
monitoring system architecture and the communication network that links it to the
campus building automation system. The system has been deployed in McNutt Hall,
and will be scaled to cover the entire campus in the immediate future.
By providing real-time high-resolution data, the system enables accurate calcu-
lation of the energy savings achieved by the lighting retrofit project. Early estimates
indicate that the retrofits in McNutt Hall will achieve close to 70% savings in lighting
energy consumption over one year. The payback time for this building is estimated
to be close to four years, for an approximate project cost of $141,000. The figures
highlight the considerable savings achieved, and further underscore the necessity for
lighting retrofits across campus. The monitoring system developed will facilitate ac-
curate accounting, identification of energy sinks, and decision making regarding future
investments in energy conservation.

iv
ACKNOWLEDGEMENTS
I would like to express my deepest gratitude to my advisor Dr. Sahra Sedigh
Sarvestani for her immense encouragement and support throughout my research in
particular. She has always extended her helping hand in order to solve my problems
and her constant motivation throughout my graduate level education has inspired me
to put in my best efforts.
I would also like to thank Mr. Jim Packard for his insightful comments and
guidance throughout this research. His experience in the field has been extremely
helpful to my work. I sincerely thank Mr. Marvin Patton, Mr. Wade Jadwin and
Mr. Clarence Gregory for their help and support.
Thanks are also due to Dr. Scott Smith and Dr. Badrul Chowdhury for serving
on my committee and providing insightful comments.
Special thanks go to my parents Narsing Rao and Jayasree, and my sister
Shilpa who have always believed in me and kept supporting me although a long
distance away. A special thanks to all my friends here in Rolla who have continuously
supported me throughout my endeavors.
The research presented in this thesis was supported by grants from the UMR
Physical Facilities Department.
v
TABLE OF CONTENTS
Page
ABSTRACT . . . . . . . . . . . . . . . . . . . . . . . . . . . . . . . . . . . . iii
ACKNOWLEDGEMENTS . . . . . . . . . . . . . . . . . . . . . . . . . . . . iv
LIST OF ILLUSTRATIONS . . . . . . . . . . . . . . . . . . . . . . . . . . . . vii
LIST OF TABLES . . . . . . . . . . . . . . . . . . . . . . . . . . . . . . . . . viii
SECTION
1 INTRODUCTION . . . . . . . . . . . . . . . . . . . . . . . . . . . . . 1
2 BACKGROUND AND RELATED WORK . . . . . . . . . . . . . . . . 5
2.1 SUBMETERING . . . . . . . . . . . . . . . . . . . . . . . . . . . 5
2.2 RELATED LIGHTING RETROFIT PROGRAMS . . . . . . . . . 6
2.3 RELATED ENERGY MANAGEMENT SYSTEMS . . . . . . . . 7
3 REQUIREMENTS AND DESIGN CONSIDERATIONS . . . . . . . . 12
3.1 PROBLEM STATEMENT . . . . . . . . . . . . . . . . . . . . . . 12
3.2 SHORT-TERM SOLUTION: INDEPENDENT ARCHITECTURE 14
3.3 LONG-TERM SOLUTION: NETWORKED ARCHITECTURE . . 16
3.4 SUMMARY . . . . . . . . . . . . . . . . . . . . . . . . . . . . . . 18
4 PROPOSED MONITORING ARCHITECTURE . . . . . . . . . . . . 20
4.1 EXISTING JOHNSON CONTROLS INFRASTRUCTURE . . . . 20
4.2 SYSTEM COMPONENTS AND COST STRUCTURE . . . . . . 22
4.3 THREE-TIER ARCHITECTURAL DESIGN . . . . . . . . . . . . 23
5 PROJECTION OF SAVINGS IN LIGHTING ENERGY . . . . . . . . 28
6 CONCLUSIONS AND FUTURE WORK . . . . . . . . . . . . . . . . . 40
APPENDICES
A PRE- AND POST-RETROFIT DATA. . . . . . . . . . . . . . . . . . . 42
B SNAPSHOTS FROM THE METASYS® SOFTWARE. . . . . . . . . 76

vi
C FIXTURES RETROFITTED BY OCTOBER 1, 2007. . . . . . . . . . 78
BIBLIOGRAPHY . . . . . . . . . . . . . . . . . . . . . . . . . . . . . . . . . 83
VITA . . . . . . . . . . . . . . . . . . . . . . . . . . . . . . . . . . . . . . . . 85
vii
LIST OF ILLUSTRATIONS
Figure Page
3.1 The Enercept� meters. . . . . . . . . . . . . . . . . . . . . . . . . . . . 14
4.1 The NAE-35 Network Automation Engine. . . . . . . . . . . . . . . . . 21
4.2 Three-tier UMR lighting monitoring system architecture. . . . . . . . . 24
4.3 Field controller level of monitoring architecture. . . . . . . . . . . . . . 25
4.4 Automation level of monitoring architecture. . . . . . . . . . . . . . . . 26
4.5 Management level of monitoring architecture. . . . . . . . . . . . . . . . 27
5.1 Nighttime snapshot of data updates from the server. . . . . . . . . . . . 32
5.2 Daytime snapshot of data updates from the server. . . . . . . . . . . . . 33
5.3 Impact of retrofit on the load of Panel L2A. . . . . . . . . . . . . . . . 37
5.4 Impact of retrofit on the load of Panel LB. . . . . . . . . . . . . . . . . 38
B.1 Snapshot of the Johnson Controls Metasys® software. . . . . . . . . . 77
B.2 Another Snapshot of the Johnson Controls Metasys® software. . . . . . 77
viii
LIST OF TABLES
Table Page
3.1 Comparison of available solutions. . . . . . . . . . . . . . . . . . . . . . 19
4.1 Initial cost estimate. . . . . . . . . . . . . . . . . . . . . . . . . . . . . . 22
4.2 Final cost structure. . . . . . . . . . . . . . . . . . . . . . . . . . . . . . 23
A.1 Panel L3 pre-retrofit. . . . . . . . . . . . . . . . . . . . . . . . . . . . . 43
A.2 Panel L3 post-retrofit. . . . . . . . . . . . . . . . . . . . . . . . . . . . . 46
A.3 Panel L2A pre-retrofit. . . . . . . . . . . . . . . . . . . . . . . . . . . . 49
A.4 Panel L2A post-retrofit. . . . . . . . . . . . . . . . . . . . . . . . . . . . 52
A.5 Panel LB pre-retrofit. . . . . . . . . . . . . . . . . . . . . . . . . . . . . 55
A.6 Panel LB post-retrofit. . . . . . . . . . . . . . . . . . . . . . . . . . . . 60
A.7 Panel L1A pre-retrofit. . . . . . . . . . . . . . . . . . . . . . . . . . . . 64
A.8 Panel L1A post-retrofit. . . . . . . . . . . . . . . . . . . . . . . . . . . . 65
A.9 Panel L2 pre-retrofit. . . . . . . . . . . . . . . . . . . . . . . . . . . . . 67
A.10 Panel L2 post-retrofit. . . . . . . . . . . . . . . . . . . . . . . . . . . . . 68
A.11 Panel L1 pre-retrofit. . . . . . . . . . . . . . . . . . . . . . . . . . . . . 70
A.12 Panel L1 post-retrofit. . . . . . . . . . . . . . . . . . . . . . . . . . . . . 72
A.13 Panel L2B pre-retrofit. . . . . . . . . . . . . . . . . . . . . . . . . . . . 74
A.14 Panel L2B post-retrofit. . . . . . . . . . . . . . . . . . . . . . . . . . . . 74
C.1 Fixtures retrofitted by Oct. 1, 2007. . . . . . . . . . . . . . . . . . . . . 79

1 INTRODUCTION
Pressing environmental concerns and rising energy costs have led many orga-
nizations to carefully review their energy consumption. Conservation requires that
energy use be monitored accurately and continuously, to identify areas with higher
energy consumption. Moreover, deregulatory policies of the electric industry and the
peak demand charges have necessitated the collection of accurate information about
usage patterns. Building automation systems with integrated facilities are the most
efficient means of gathering energy data, but are prohibitively expensive, and as such,
rarely used. Metering products equipped with communication protocols serve as a
more cost-effective alternative for a broad range of monitoring applications.
University campuses are no exception to the ongoing energy conservation drive.
One of the main sources of energy consumption on a campus is lighting. In a university
environment, numerous lighting appliances and fixtures operate continually, beyond
regular business hours, resulting in considerably higher energy costs as compared to
commercial organizations or residences.
A simple, yet effective method for reducing lighting energy consumption is
retrofitting existing light fixtures with modern energy-efficient versions. The Univer-
sity of Missouri-Rolla (UMR) is currently carrying out a lighting retrofit of all fixtures
on campus. The pilot building for this project is McNutt Hall, as it has the single
highest consumption of lighting energy. The results of the pilot study will be used to
guide the remainder of the retrofit project.
The focus of the research described in this thesis is the development and de-
ployment of an automated, networked system for real-time monitoring of lighting
energy. The system provides high-resolution, continually updated information about
energy usage, which is critical to post-retrofit assessment of the project. The specific

2
contributions of the research involve the design of the lighting monitoring system
architecture and the communication network that links it to the campus building au-
tomation system. The system has been deployed in McNutt Hall, and will be scaled
to cover the entire campus in the immediate future.
An electric meter or energy meter is a device that measures the energy con-
sumption of a business or residence. The most common type is the watt-hour meter,
where a rotor element is driven to revolve at a speed proportional to the power. The
total energy consumption, measured in watt-hours, is determined by counting the
number of revolutions of the rotor element. Meter installations are classified into
two types: direct-metered and master-metered [1]. In a master-metered installation,
the utility company installs a main meter at the service entrance of the building, and
measures the total energy consumed. This poses a problem for multi-tenant buildings,
as accounting for the individual energy consumption of each tenant is not possible.
Direct-metered installations are more appropriate for multi-tenant buildings,
or any situation where more detailed accounting of energy usage is required. In
such installations, a separate meter is installed for each tenant or other entity whose
energy usage is to be monitored at an individual level. The main disadvantages of
this approach are the number of meters required, as well as the space needed for their
installation. An additional problem is the cost and feasibility of installing home-run
wiring for the meters, which necessitates the connection of every meter to a single
central panel. This can be a primary concern for larger entities, such as a university
campus.
Submetering is a solution that allows for monitoring individual usage, while
eliminating the space and wiring concerns associated with direct metering. In con-
trast to direct metering, submetering takes a distributed approach, by using smaller,
less expensive meters to monitor individual entities. These submeters are connected
to each other, but are not required to be wired to a central panel. This is a prudent
3
approach for monitoring lighting energy consumption, where information is required
for a large number of physically distributed entities throughout a building, e.g., lab-
oratories and classrooms.
A lighting monitoring system encompasses the tasks of collecting energy usage
data at regular intervals and reporting this data to one or more repository databases.
An additional task is interfacing with the main building automation system (BAS).
A BAS uses autonomous monitoring to coordinate, organize, and optimize the var-
ious control subsystems of a building, including HVAC equipment, security and fire
systems, and electric meters. The BAS software aggregates data from all of these
systems and presents this information in a variety of formats.
Low cost, interoperability, and conformance to standards are among the main
criteria for any monitoring system [2]. Advances in communication technology have
facilitated automation and remote maintenance of monitoring systems [3], enabling a
broad range of tasks, from a reporting of a single faulty device to managing an entire
network of meters [4]. One of the major tasks facilitated by monitoring systems is low-
ering of demand charges [5], [6], which are levied based on rate of energy consumption,
rather than the total energy consumed. Spreading out demanding tasks throughout
the day lowers the peak demand rate, and as a result, the demand charges. This is
referred to as demand peak shaving. The typical approach is load shifting, where non-
essential device or units with high power consumption are operated in shifts rather
than in tandem, and are shut off during peak times. Modern energy monitoring sys-
tems can accurately predict the demand peak and schedule the equipment or units
accordingly.
As detailed in the remainder of this thesis, the proposed monitoring system
fulfills all of these requirements. As an initial application, the data collected by the
system was used to assess the lighting retrofit of McNutt Hall. It is estimated that this
retrofit will result in a 70% reduction in lighting energy consumption over a period

4
of one year. From the financial perspective, the payback time for the investment is
just under four years. Both figures highlight the considerable savings achieved, and
further underscore the necessity for lighting retrofits across campus.
The remainder of this thesis is organized as follows. Section 2 provides a
background and describes related literature. Section 3 elaborates on the problem
statement and requirements, and compares two approaches to the overall system
design. The architecture proposed for the lighting monitoring system is discussed
in Section 4. The energy and cost savings achieved by the retrofit are presented in
Section 5. Section 6 concludes the thesis and describes possible extensions to the
research.

5
2 BACKGROUND AND RELATED WORK
This section provides a background to concepts relevant to the research, and
discusses related work. Submetering, which was introduced in Section 1, is elaborated
upon and a number of related energy conservation projects are discussed. Finally,
a number of case studies on building automation systems are presented, including
applications to university campuses and industrial plants.
2.1 SUBMETERING
As described in Section 1, submetering is an effective technique for gaining
detailed information about energy usage. The increased granularity offered by this
type of measurement system facilitates calculation of energy expenditures and savings
related to retrofit programs. In addition, submetering allows each tenant to incur a
service charge corresponding to only their own energy usage. Furthermore, it can
measure the energy consumption associated with a particular task, such as lighting.
Normally, a main electrical meter is installed in each building to monitor the total
consumption of electrical energy. This meter is typically located at the main circuit
breaker panel, where the electrical mains feed into the building. If lighting energy is
monitored, the corresponding submeters are located near the circuit breaker panels
into which the lighting circuits are wired. A university campus is a very appropri-
ate scenario for submetering, due to the high number of buildings that need to be
monitored individually.
The drive to reduce the amount of energy consumption in UMR has been the
propelling factor behind the lighting retrofit project described in Section 1. Accurate
estimation of lighting energy consumption necessitates submetering of the lighting
circuits. The submeters chosen, which are described in greater detail in Section

6
3, have networking capability. This facilitates their connection to the supervisory
HVAC controllers in the building, as well as the BAS network and eventually to
the campus backbone or LAN. This facilitates the acquisition of their data by the
operator workstation or server. Facility managers can use the information generated
by the submeters to generate trend analysis reports of lighting energy consumption
patterns. The BAS software can generate reports in various user-friendly formats for
specified periods of times, i.e., for a day or week.
2.2 RELATED LIGHTING RETROFIT PROGRAMS
Many organizations in the United States are undergoing lighting retrofit pro-
grams aimed at reducing energy consumption and universities are no exception. Most
of the university buildings in the country are very old, and contain older, inefficient
lighting fixtures that are not compatible with modern building automation technolo-
gies. Extensive lighting retrofit projects are being carried out to replace the older
fixtures and lighting appliances with newer fixtures that are more energy efficient.
One such lighting retrofit project is reported in [7], where the building in
question is the library of the University of Technology in Malaysia. The various
lighting fixtures in the library were retrofitted with newer ones capable of providing
the same amount of luminance and performance at lower wattage. These retrofits
included replacing the magnetic ballasts with electronic varieties, and installing high
quality reflectors and compact fluorescent lamps instead of incandescent lamps. A
data acquisition and monitoring system called Enflex® was also installed, and was
responsible for logging data from as many as 576 electrical data logger points. The
end devices range from HVAC equipment to meters and Air-Handling Unit (AHU)
coils. These devices send the data through the serial communications protocol to a
data logger that monitors as many as twelve electrical points. The retrofit exercise
carried out by this university library has resulted in savings of approximately 40%

7
of the entire building load, with more than 70% of the savings attributed to lighting
retrofits [7].
In a similar project at Yale University, the physical facilities department is
gathering real-time data from numerous meters installed around campus [8] [9]. The
university has older buildings, as well as new construction. Similar to the situation
at UMR, the metering in the old campus buildings was not compliant with mod-
ern industry standards, and did not have an integrated communications interface.
Therefore, the university decided to install a Modbus interface for the older meters
to communicate with each other and also to the building automation network.
The newer buildings at Yale, including the School of Medicine, and the Yale
New Haven Hospital are connected to a building automation network comprised of
a Johnson Controls BAS, the Ethernet backbone of the university, various servers
and the operator workstations. As a result, the university has a completely net-
worked utilities metering system and significant energy savings have been obtained
by regular monitoring of energy consumption on campus. This system has helped
facility managers to optimize power plant parameters and flatten the peak demand
by continuous analysis of building operations.
2.3 RELATED ENERGY MANAGEMENT SYSTEMS
The BAS or Energy Information System [10] is the heart of any modern energy
monitoring system. Most modern structures, especially those on the scale of a uni-
versity campus, employ such systems to facilitate easier management of their energy
resources. This subsection discusses a number of case studies on the deployment and
use of BASs.
In [11], the SISGEN Energy Management System is used for efficient control
of the energy supply and consumption in all campuses of the University of Sao Paulo,
Brazil. SISGEN is based on the dual network architecture of Modbus RS-485 and

8
TCP/IP communication protocols. This system, which has its own autonomous su-
pervision module software, is able to constantly trend the required data and present
it in graphical form. The study documents an annual reduction of 8000 MWh in
the university’s energy consumption. Newbold and Agarwal present a study carried
out at the University of Nebraska Lincoln, where an energy management and control
system has been developed in-house [12]. The system implementation began in the
1980s, with the primary aim of adapting to newer building automation standards.
The developed control system has an interactive Java user interface that is used to
trend data obtained from various monitoring points around the campus, and is based
on an architecture that is comprised of networked controllers and servers running
the software. This system underscores the need for an effective software solution for
presentation of large amounts of data in user-friendly formats.
Electrical energy monitoring in an industrial scenario is described by Dorhofer
and Heffington in [13]. The essential elements of the monitoring system and the
network architecture are typically the same as that of a university. The difference
arises in the monitoring needs of the facility managers. An industrial plant typically
includes very large equipment with high power consumption. A small defect in these
machines could lead to ineffective operation, thereby raising the potential energy
expenditures. The use of current transducers for monitoring equipment such as large
plasma cutters, air compressors and large press brakes is described in [13]. New
monitoring points have also been proposed to control the operation of the press brakes
and the plasma cutters.
The development of an Internet-based electric energy monitoring system is
described in [14]. The data logger used in this study is of higher intelligence, as it
facilitates time synchronization through the use of GPS signals. A data logger known
as the Network Computing Terminal (NCT) is used to gather both digital and analog
9
information. The NCT then transfers data to a database server or web server through
an intranet or the Internet.
Of greatest relevance to the research presented in this thesis is the study de-
scribed in [15]. The architecture described, which forms the basis for the architecture
of the McNutt Hall lighting control system, breaks down the BAS structure into a
hierarchy. This facilitates easier understanding of the entire system by facility man-
agers and other users. The same hierarchical architecture has been used to enable
communication among circuit breaker units. Engel and Murphy, in [16], present the
idea of controlling all important breaker information by networking the circuit break-
ers to intelligent control systems. The circuit breakers communicate via twisted pair
wires through an accessory bus to a variety of slave devices. Circuit breakers are
daisy chained to one another for effective control and communication among them. A
similar network is described in [17], where circuit breaker trip units communicate via
RS-485 protocol to a display and monitoring unit. The trip units are small auxiliary
contacts mounted on top of the circuit breakers. These units are daisy chained to a
power meter that is also connected to the monitoring unit for the acquisition of data
to a central location.
Pitzer College, a private undergraduate institution in Claremont, California,
is also undertaking load curtailment programs that make power monitoring a strin-
gent requirement [18]. The same basic principles have been applied; modern power
meters are coupled with an Ethernet Gateway that communicates the data over a
LAN, as well as powerful data analysis software. RS-485 protocols are being used
to connect the lighting panels to be monitored. Advised by the utilities company to
reduce its peak demand, Pitzer College has entered into a tariff agreement with the
utility company. The agreement stipulates that Pitzer reduce its lighting loads during
emergency periods, such as outage declarations by the utility company, which occur

10
when the peak demand increases to a state where it cannot be met by the existing
reserves of generated power.
The energy management and utility monitoring system (UMS) being used by
the Hyatt Hotels Corporation is described in [19]. This paper discusses the issues in-
volved in corporate enterprise-level energy management, and the steps taken by Hyatt
in order to keep a validated account of their energy consumption. The corporation
maintains a utility monitoring system, with a ThinServer [19] as the central element.
This ThinServer gathers data from various metering points around the hotel buildings
over various communication channels. The data is then sent to workstations where
it is analyzed and reports are generated with EnerTel® software. The data analysis
includes continuous load profiling. Any deviation from the normal is captured and
analyzed to determine the root causes of the disparity. The ThinServer also transfers
the collected data to a backup database. Insight into the complexity of managing
energy consumption on a very large scale is given in [19], which describes network
monitoring solutions with a UMS architecture, both at the enterprise level and at the
local level, within a hotel building.
The interesting case of a retail store 1 in the Northeastern United States is
presented in [20]. A submetering program was carried out to identify a dramatic in-
crease in energy bills. Lighting energy, provided by a combination of incandescent and
fluorescent bulbs, was found to be responsible for the bulk of the energy consumption,
and a retrofit was carried out. Enercept� meters and their associated data acquisition
server have been used as a solution. The Enercept� meters are digital meters that
are capable of communicating with each other through serial communication. The
Building Manager Online (BMO)� software by Obvius� has been used as reporting
software. Given start and end dates of the period being investigated, the software
plots various power quality characteristics, such as real and reactive power, phase
1Name withheld in paper.

11
imbalances, and harmonic distortions for each day during the specified period. The
configuration and data patterns of the control panels for which the data acquisition
server collects the data can be viewed in the BMO window.
In conclusion, any modern monitoring application requires standard monitor-
ing devices conforming to industry standards, appropriate monitoring software, and
network connectivity among the monitoring devices. The reporting software of the
BAS should be configurable, and capable of presenting data in a variety of user-
friendly formats, as well as generating alerts in case of emergency situations such as
the power demand exceeding the peak level. The data can be used by facility man-
agers to assess and validate retrofit projects. Continuous commissioning is vital to
energy conservation, and requires periodic refinement of building operations with the
help of specialized energy analysis software.

12
3 REQUIREMENTS AND DESIGN CONSIDERATIONS
This section provides a more detailed description of the problem statement,
and articulates short- and long-term solutions to the monitoring of lighting energy.
The section concludes with a comparison of the two approaches.
3.1 PROBLEM STATEMENT
The objective of the UMR lighting retrofit program is replacement of old and
inefficient lighting fixtures with their modern energy-efficient counterparts, with the
ultimate goal of reducing lighting energy consumption. Assessing the success of the
program necessitates accurate measurement of energy consumption. To this end, the
autonomous monitoring system described in this thesis was designed and deployed.
As described in Section 1, McNutt Hall is the pilot building for the study. This
building originally had three independent metering substations with GE 700X66G1�
meters. Throughout this thesis, the term substation is used to refer to a hub that
connects two or more meters. The substations are not connected and cannot directly
communicate with each other. Autonomous monitoring necessitated that these me-
ters be connected to each other, and to the campus LAN. Similar connectivity was
previously added to the CM 3350 Power Logic® meters at the campus power plant.
These meters communicate with a server, but are running outdated trending software.
In contrast, the modern Enercept� meters installed in the Havener Center
building across from McNutt Hall and the power plant, have Ethernet connectivity,
but are incompatible with the outdated software. The solution desired for McNutt
Hall was a networked monitoring system linked to real-time data analysis software.
Furthermore, the meters comprising the system were required to be compatible with
industry automation protocols and device driver standards.

13
One of the initial designs conceived for monitoring the lighting energy in Mc-
Nutt Hall involved the replacement of existing meters with Enercept� meters, which
offer the advantages enumerated below.
� Ease of installation, because of their split core current transformer [21] tech-
nology, which eliminates the need for the conductors to be removed before
installation.
� Choice of two forms, the first of which is the 8035/8036 [21] with a Modbus
communication interface. The second form is the H8025/8026 [21] series, which
communicates on a Metasys N2® [22] bus.
Devices connected to the BAS are often associated with proprietary protocols,
and hence, it is critical to select metering products that facilitate the use of open
protocols and standards. Another important factor is ease of integration and forward
compatibility with the changing building automation technologies. This again under-
scores the importance of support for open building automation standards, the most
common of which are BACnet and LONWorks. The Enercept� meters, depicted in
Figure 3.1 are compatible with these protocols. This support for the major open
communication protocols, and the reasonable costs of Enercept� meters made them
the products of choice for the McNutt Hall monitoring system. What makes them
unique is their serial communication capability through the Modbus RS-485 proto-
col. The higher version of the Enercept� meters, known as the Enhanced Enercept�
meters, is being used for the project at UMR. These meters can gather information
about a range of parameters such as power factor, reactive power, apparent power
and real power, and are comprised of a microprocessor-based electric meter and split
core transducers. Each meter can monitor up to 63 electrical loads on a single RS-
485 drop. The problem of incorrect CT load orientation during the meter installation

14
is also rectified, as the meters can automatically detect and compensate for phase
reversals [21].
Figure 3.1. The Enercept� meters.
3.2 SHORT-TERM SOLUTION: INDEPENDENT ARCHITECTURE
One of the short-term monitoring solutions identified was the deployment of a
lighting monitoring infrastructure as an independent entity, with no connection to the
BAS. This solution was rejected in favor of the networked architecture described in
the next subsection and subsequent sections of the thesis. The description provided
here is for reference only.
The main task associated with the implementation of an independent metering
architecture is installation of the H8035/8036 meters, which should be daisy-chained
and connected to the serial port of a server or data acquisition device. The Enercept�

15
meters were Ethernet-ready, but were not connected to the LAN, as they were in-
compatible with the outdated software running on the server that would be the final
recipient of their data.
One solution to this problem was to connect a new data acquisition server
(DAS) to the Enercept� meters in different buildings, and tie them into the campus
LAN. This approach required the procurement of two different servers, one for the
UMR power plant and another for the Havener Center and McNutt Hall. In some
cases, the DAS is accompanied with a trending software. This software can be used
on any web-enabled server for analysis of the collected data. The DAS also includes
a modem.
The other solution to the software incompatibility issue was upgrade of the
existing software running on the server used for processing of the power plant data.
This would provide a single point of access to the data from all three buildings, the
power Plant, the Havener Center and McNutt Hall. Such an upgrade is costly, and
would require an investment of approximately $20,000 towards purchasing packages
such as Power Logic�’s System Management Software®, which is interoperable with
the CM3350® meters situated at the power plant.
Implementation of an independent lighting monitoring system requires the
following tasks:
� Laying down Ethernet cabling in McNutt Hall to connect the DAS to the server.
� Laying down RS-485 cabling to connect the daisy chained meters to the data
acquisition device.
� Replacing the existing GE� meters in the building with the new Enercept�
meters.
� Connecting these meters via RS-485 cable to a DAS compatible with the Ener-
cept� meters to gather and record the data from all meters.

16
� Connecting the DAS to the campus LAN. The data from the DAS is transported
via Ethernet to the server hosting the trending software.
� Accessing the data from this server using any web browser.
3.3 LONG-TERM SOLUTION: NETWORKED ARCHITECTURE
The short-term approach of deploying an independent lighting monitoring sys-
tem provides a temporary solution, but falls short of providing connectivity to the
BAS, which provides a central point of control for the power, fire and security, and
HVAC systems, regardless of their respective vendors. Any long-term solution to the
monitoring of lighting energy requires incorporation of the monitoring system into
the BAS architecture. The solution proposed in this thesis and implemented at UMR
facilitates this integration by supporting the major open communication protocols,
such as BacNet and LONWorks.
Among these protocols, as of the date of publication of this thesis, BACnet [23]
was gaining wide popularity. Its main advantage is that it supports five different LAN
technologies [24]. It is compatible with high-speed Ethernet, as well as low speed
LAN technologies such as the ARCnet. It is also compatible with the proprietary
LONTalk protocol, which enables BACnet and LONWorks controller products to
share the LONTalk LAN. Nonetheless, these devices cannot interoperate, as this
would necessitate the conformance of all the controller products to the standard
LONMark agreement. This could be a factor of hindrance to an open architecture
and the easy integration that is desired from a building control system. Typically,
under these circumstances, the use of a gateway is required to facilitate interfacing
of the two communication protocols.
BAS controllers can be connected to the Ethernet through their built-in-serial-
to-Ethernet interface. The BAS-compatible software would be running on all servers
17
to analyze the data received from various controllers across the campus. This would
include all the lighting system controllers, the HVAC controllers and the controllers
associated with building security.
The H8035/8036 meters proposed above require a gateway device for connec-
tion to the BAS. Other options include H8025/8026 Enercept� meters, which can be
directly connected to a Johnson Controls (JCI) Metasys® N2 bus, the proprietary
cabling standard for connecting JCI controllers. Another option is to use BACnet®
-compatible Enercept� meters. This option was chosen for the UMR lighting moni-
toring project.
The following tasks were associated with deployment of the networked moni-
toring system at UMR. These tasks were carried out between July and October 2007
per the guidelines determined by the research described in this thesis.
The steps discussed below have been implemented for the UMR lighting mon-
itoring system installation.
� Laying down Ethernet cabling in McNutt Hall to connect the DAS to the server.
� Laying down RS-485 cabling to connect the daisy chained meters to the data
acquisition device.
� Installation of suitable gateways (if necessary) to integrate the power meters
into the BAS network.
� Initial installation of building automation system controllers at different points
in the building.
� Laying down either proprietary LAN or Ethernet cabling for the building au-
tomation system to connect the controllers.

18
� Connecting all application-specific controllers, supervisory controllers and servers
to the BAS network. The next step would be to interconnect the BAS servers
using the campus network.
� Replacing the existing old GE meters in the building with the new Enercept�
meters.
� Connecting these meters to the building automation system.
3.4 SUMMARY
McNutt Hall occupies an area of 145,000 square feet. A typical BAS costs
between $100,000 and $130,000 for an area of approximately 200,000 square feet
[10]. Considering energy rebates, and the annual savings offered by BAS providers,
the payback period tends to be between five and seven years. A pared-down BAS,
which could be procured at lower cost, would suffice for UMR’s needs, as the main
requirements are networking capability and the availability of a suitable software
interface.
The most significant costs associated with a campus BAS are installation,
operation, and maintenance costs. Such systems are usually procured with a 5-10 year
maintenance contract. Contract costs are weighed against resulting energy savings to
select the provider and solution with the greatest return on investment. A bidding
process is required, with preference given to vendors with a long-standing relationship
with the university. Typical unit pricing must be included in the bid, which includes
the costs of the initial installation, maintenance and operation. The bid must also
specify unit prices for future expansion. Table 3.1 summarizes the discussion and
provides a comparison between the short- and long-term solutions described in this
section.

19
Table 3.1. Comparison of available solutions.
SHORT-TERM (NO BAS) LONG-TERM
Meters Enercept� Enercept�Installation Costs Low (only meters) Low (existing JCI BAS)Cabling RS-485 and Ethernet N2 and EthernetSoftware costs Procurement of DAS Commissioning for JCIInteroperability Low High

20
4 PROPOSED MONITORING ARCHITECTURE
The focus of this section is the architecture proposed for the lighting monitor-
ing system. Details are given about the BAS already deployed on the UMR campus,
components of the proposed architecture are described, and the integration of these
components into a unified system is discussed.
4.1 EXISTING JOHNSON CONTROLS INFRASTRUCTURE
The BAS currently deployed on the UMR campus is the Johnson Controls�
Infrastructure (JCI), specifically, the Metasys® architecture. This simple, hierarchi-
cal architecture integrates numerous controllers manufactured by Johnson Controls,
including air volume controllers, air handling units, and zone temperature controllers
in the form of HVAC equipment.
The integral element of a Metasys® architecture is the network automation
engine (NAE). These application engines are the intermediate supervisory controllers
that control all of the field equipment devices installed at various points on campus.
The NAE is able to provide the integration required between the Metasys® Archi-
tecture and the BACnet, LONworks and N2 devices. For example, if the Metasys®
features field equipment controllers that use BACnet as their data communications
protocol, then these controllers can be connected to web servers or user interfaces
through the NAE. In brief, outstanding features of the Metasys® system include the
following.
� High scalability
� Ease of integration of devices from various third party vendors
� Suitability for the size and layout of university campuses

21
� Inclusion of intelligent stand alone-controllers
� Compatibility with BACnet, LONWorks and Modbus protocols
� Ease of configuration
The automation engines from Johnson Controls come in various configurations,
such as NAE-35 and NAE-55. The NAE-35 currently installed in McNutt Hall is
shown in Figure 4.1.
Figure 4.1. The NAE-35 Network Automation Engine.
For the UMR campus, selection of Johnson Controls products would facilitate a
clean architecture that uses N2 cabling to directly interconnect the Enercept� meters
with its NAE-35, without requiring an intermediate gateway device. The NAE is
similar in function to any DAS, as an authorized user is able to access the collected

22
data through an interactive and user-friendly GUI. The GUI can be reached and
executed from Java-enabled web browser on any computer.
4.2 SYSTEM COMPONENTS AND COST STRUCTURE
Table 4.1 depicts the initial cost estimate provided to the university by Johnson
Controls. The lighting panels in McNutt Hall house circuits for the lighting fixtures in
various offices, classrooms, laboratories and corridors of the building. The maximum
switch breaker current rating associated with the lighting panels is 225 A, and the
minimum rating is 100 A.
The AH08 coils are needed at each substation to step up the current transduc-
ers to the level of the primary current being carried on the conductors. For instance,
the primary current rating on substation three in McNutt Hall is of the order of
2000-3000 A, and using a 2000:5 current transducer would necessitate a step-up coil
to accommodate current ratings of more than 2000 A.
Commissioning and software support are very important to ensure that the
system operates continuously and according to specifications. The associated fees
charged by the vendor include annual maintenance visits.
Table 4.1. Initial cost estimate.
QUANTITY DESCRIPTION UNIT PRICE TOTAL
8 100 A Enercept� meters $759 $60722 225 A Enercept� meters $781 $15623 Shunting terminal blocks $55 $1653 AH08 Step-up coils $123 $3691 NAE-35 $2742 $274212 Commissioning/software support $93.50 $1122
GRAND TOTAL - - $12,032

23
However, Johnson Controls has a long-standing business relationship with
UMR, and the majority of the controllers on campus have been manufactured and
are maintained by them. In light of this positive association, and the high levels of
scalability and interoperability provided by the NAE-35, this server was selected as
the computational core of the system.
Table 4.2 shows the final cost structure, which differs from the original quote
only in the price of the NAE-35, which was reduced from $2742 to $1895. The
relationship with Johnson Controls was leveraged to negotiate a substantial discount
on this cost, bringing it closer to the price of other comparable data acquisition
devices. The final cost of the complete system was $11,185.
Table 4.2. Final cost structure.
QUANTITY DESCRIPTION UNIT PRICE TOTAL
8 100 A Enercept� meters $759 $60722 225 A Enercept� meters $781 $15623 Shunting terminal blocks $55 $1653 AH08 Step-up coils $123 $3691 NAE-35 $1895 $189512 Commissioning/software support $93.50 $1122
GRAND TOTAL - - $11,185
4.3 THREE-TIER ARCHITECTURAL DESIGN
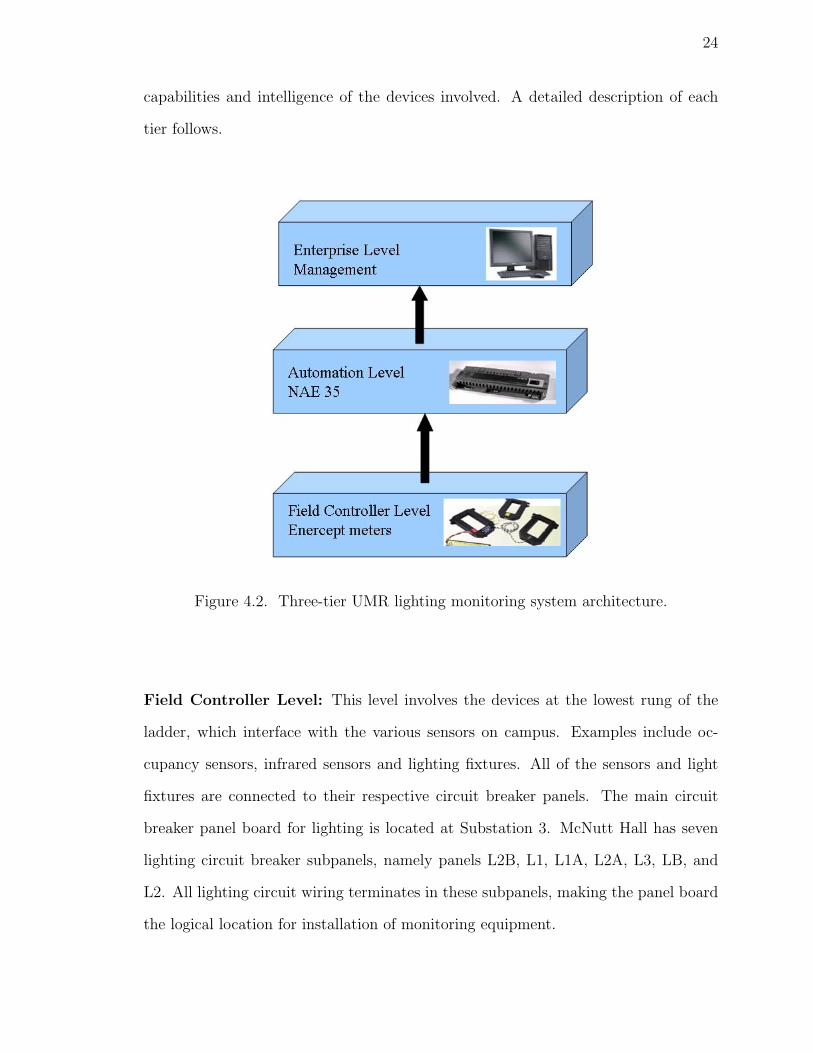
The three-tier architecture depicted in Figure 4.2 is proposed for the lighting
monitoring system in McNutt Hall. The three tiers, from bottom to top, represent the
field controller, automation, and management levels in accordance with the framework
in [25], respectively. Each tier differs from the other two in the level of networking
24
capabilities and intelligence of the devices involved. A detailed description of each
tier follows.
Figure 4.2. Three-tier UMR lighting monitoring system architecture.
Field Controller Level: This level involves the devices at the lowest rung of the
ladder, which interface with the various sensors on campus. Examples include oc-
cupancy sensors, infrared sensors and lighting fixtures. All of the sensors and light
fixtures are connected to their respective circuit breaker panels. The main circuit
breaker panel board for lighting is located at Substation 3. McNutt Hall has seven
lighting circuit breaker subpanels, namely panels L2B, L1, L1A, L2A, L3, LB, and
L2. All lighting circuit wiring terminates in these subpanels, making the panel board
the logical location for installation of monitoring equipment.
25
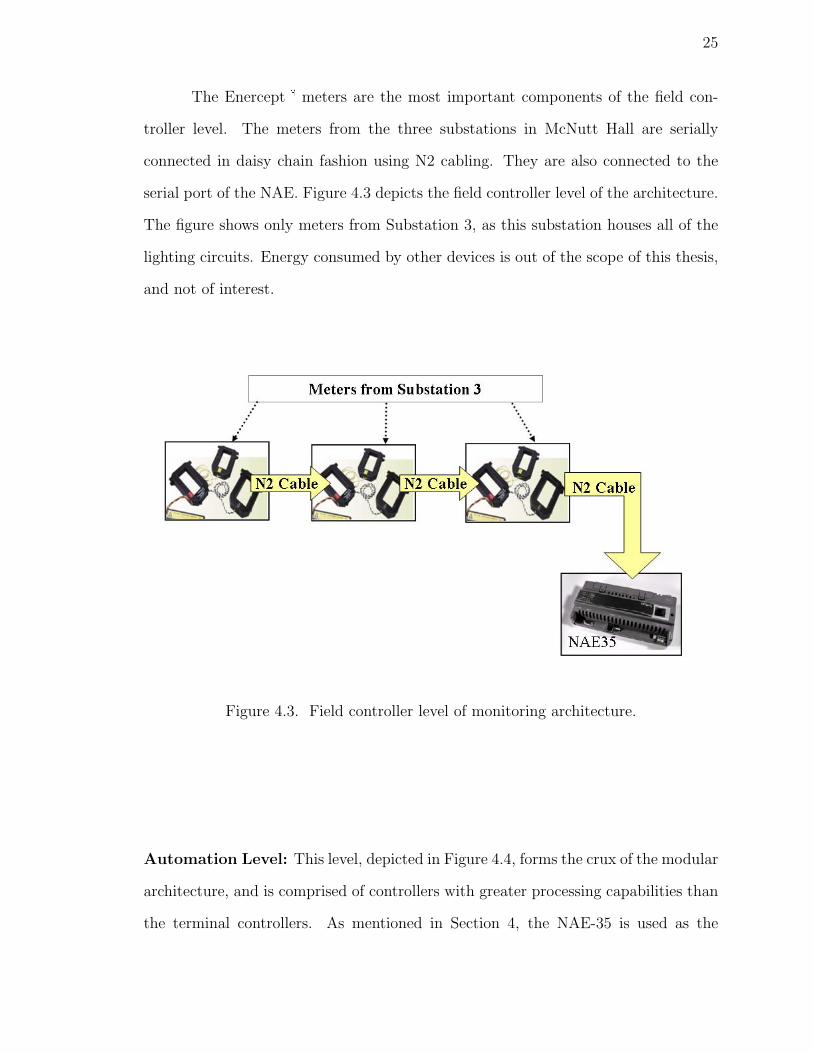
The Enercept� meters are the most important components of the field con-
troller level. The meters from the three substations in McNutt Hall are serially
connected in daisy chain fashion using N2 cabling. They are also connected to the
serial port of the NAE. Figure 4.3 depicts the field controller level of the architecture.
The figure shows only meters from Substation 3, as this substation houses all of the
lighting circuits. Energy consumed by other devices is out of the scope of this thesis,
and not of interest.
Figure 4.3. Field controller level of monitoring architecture.
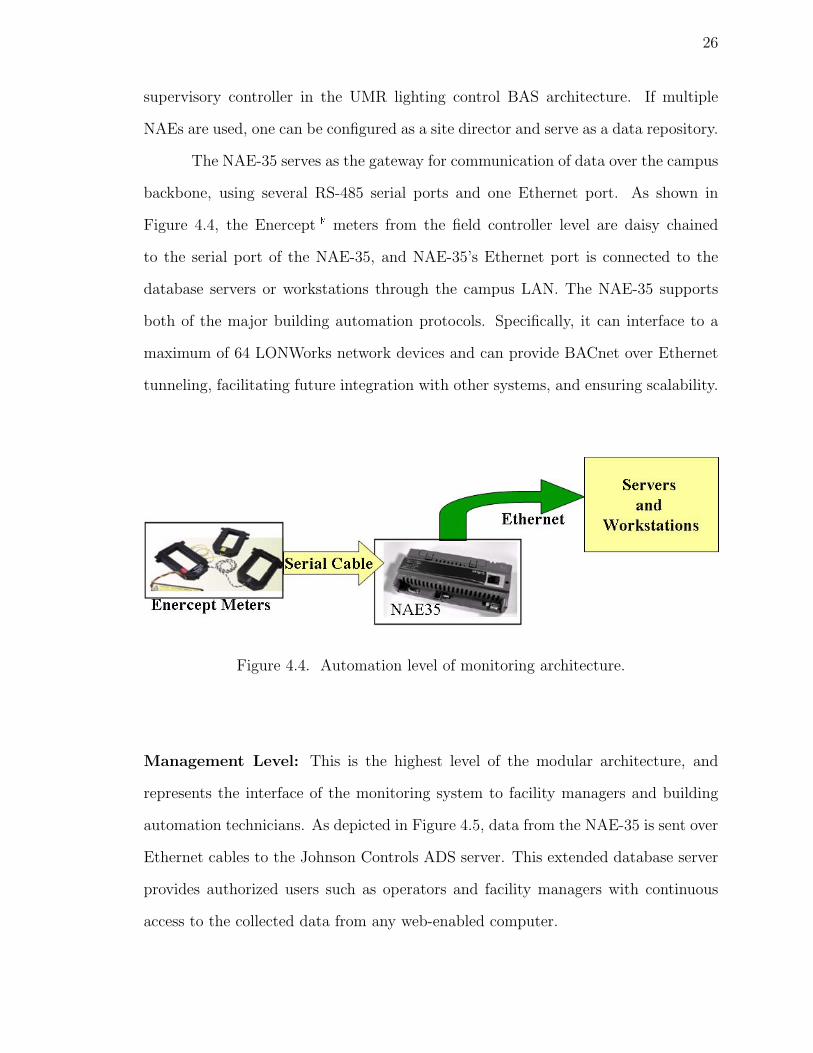
Automation Level: This level, depicted in Figure 4.4, forms the crux of the modular
architecture, and is comprised of controllers with greater processing capabilities than
the terminal controllers. As mentioned in Section 4, the NAE-35 is used as the
26
supervisory controller in the UMR lighting control BAS architecture. If multiple
NAEs are used, one can be configured as a site director and serve as a data repository.
The NAE-35 serves as the gateway for communication of data over the campus
backbone, using several RS-485 serial ports and one Ethernet port. As shown in
Figure 4.4, the Enercept� meters from the field controller level are daisy chained
to the serial port of the NAE-35, and NAE-35’s Ethernet port is connected to the
database servers or workstations through the campus LAN. The NAE-35 supports
both of the major building automation protocols. Specifically, it can interface to a
maximum of 64 LONWorks network devices and can provide BACnet over Ethernet
tunneling, facilitating future integration with other systems, and ensuring scalability.
Figure 4.4. Automation level of monitoring architecture.
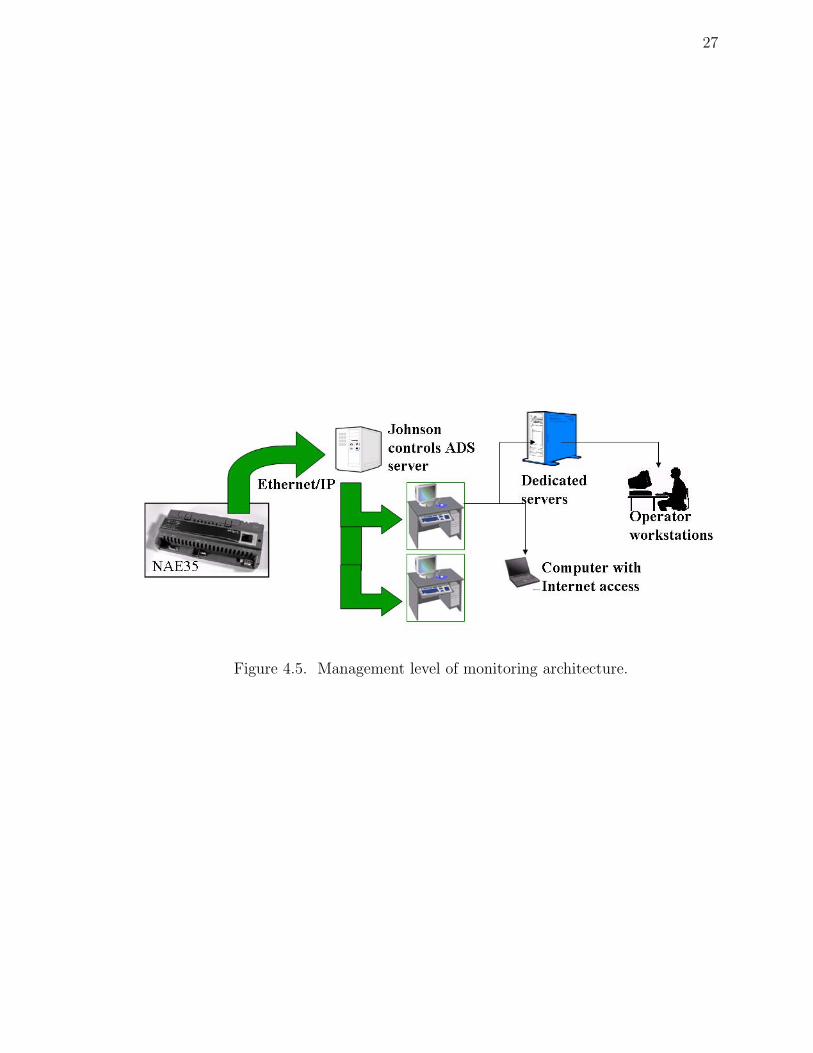
Management Level: This is the highest level of the modular architecture, and
represents the interface of the monitoring system to facility managers and building
automation technicians. As depicted in Figure 4.5, data from the NAE-35 is sent over
Ethernet cables to the Johnson Controls ADS server. This extended database server
provides authorized users such as operators and facility managers with continuous
access to the collected data from any web-enabled computer.
27
Figure 4.5. Management level of monitoring architecture.
28
5 PROJECTION OF SAVINGS IN LIGHTING ENERGY
The ultimate goals of the lighting monitoring system are collection of data
to be used in profiling the consumption of lighting energy, identifying areas where
savings can be achieved, and calculating these savings. This section presents the
energy savings projected for the lighting retrofit of McNutt Hall. Throughout this
section, any figure representing power or energy refers to these values for lighting
alone. Other energy-consuming devices and systems are outside the scope of this
thesis.
The first step in calculating the lighting energy savings is to determine the total
nominal pre- and post-retrofit power consumption. The lights in McNutt Hall fall
into three categories: room (office, laboratory and classroom), corridor, and outdoor
lights. Any circuit used for room lighting is connected to one of seven lighting panels:
L1, L1A, L2, L2A, LB, L2B, and L3. Appendix A details the energy consumption of
the lighting circuits on each panel, both before and after the retrofits.
Equation 5.1 can be used with data from Tables A.1, A.3, A.5, A.7, A.9,
A.11, and A.13, to determine the total pre-retrofit wattage for the lighting panels.
Similarly, Tables A.2, A.4, A.6, A.8, A.10, A.12, and A.14 are used to calculate the
total post-retrofit wattage. The tables provide the nominal values.
Total wattage of room lights =∑
power rating of each fixture (5.1)
=
218.189 kW pre-retrofit
92.5 kW post-retrofit
The lighting monitoring system was deployed on July 31, 2007. Fall classes began
on August 20, 2007. The intent was to measure power consumption for a full month
when classes are in session, specifically, September 1 to October 1, 2007. By this

29
time, only a subset of the light fixtures had been retrofitted, specifically, the fixtures
identified in Appendix C. The total pre- and post-retrofit wattage of the room fixtures
in this subset, as of October 1, 2007, are 65,442 W and 28,893 W, respectively. This
data is used in Equation 5.2 to refine the estimate for the total wattage of all room
fixtures. As of October 1, 2007:
Total wattage of room lights = Total pre-retrofit wattage of room lights (5.2)
− Pre-retrofit wattage of retrofitted room lights
+ Post-retrofit wattage of retrofitted room lights
= 218, 189 − 65, 442 + 28, 893 W
= 181, 640 W
Based on an estimated annual operating time of 3000 hours for rooms (laboratories,
classrooms and offices), the annual and monthly energy consumption of the retrofitted
room fixtures are calculated using Equations 5.4 and 5.5, respectively.
Annual kWh =Operating hours/day ∗ 365 ∗ Total wattage
1000(5.3)
Total annual kWh of room lights =3000 ∗ 181, 640
1000(5.4)
= 544, 920 kWh
Total monthly kWh of room lights =544, 920
12(5.5)
= 45, 410 kWh
In addition to room lights, energy is also consumed by corridor fixtures, which can be
divided into two groups based on their estimated annual operating time. Some of the

30
corridor lights are on for 24 hours a day, resulting in an annual operating time of 8760
hours. The annual operating time for the rest of the corridor fixtures is estimated to
be 4680 hours. During the monitored period of September 1 to October 1, 2007, the
total nominal wattage of the continually operating corridor lights was 5860 W. The
total wattage of the remaining fixtures during the same period was 4940 W.
Total wattage of corridor lights = 5860 + 4940 (5.6)
= 10, 800 W
The resulting annual and monthly energy consumption of the corridor fixtures is given
by Equations 5.7 and 5.8, respectively.
Total annual kWh of corridor lights =4680 ∗ 4940
1000+
8760 ∗ 5860
1000(5.7)
= 74, 452 kWh
Total monthly kWh of corridor lights =74, 452
12(5.8)
= 6204 kWh
Equations 5.2 and 5.6 can be used to determine the total wattage of room and corridor
lights as of October 1, 2007:
Total wattage of room and corridor lights = 181, 640 + 10, 800 (5.9)
= 192, 440 W

31
The estimated total energy consumption for room and corridor lighting over the period
of September 1 to October 1, 2007 is given by the sum of Equations 5.5 and 5.8.
Estimated monthly kWh of room and corridor lights = 45, 410 + 6204(5.10)
= 51, 614 kWh
The next step in calculating the energy savings is to compare the estimated monthly
kWh of lighting energy, given by Equation 5.10, to the actual value reported by
the Johnson Controls server for the period of September 1 to October 1, 2007. If
these readings are close, it shows that the estimated operating times are a good
approximation of the actual usage patterns.
Figures 5.1 and 5.2 show the data updates sent every 15 minutes from the
Johnson Controls extended architecture server. Snapshots from the Metasys® soft-
ware are provided in Appendix B. This software is used by facility managers located
in the Physical Facilities building to track data from McNutt Hall.
The first row of the Johnson Controls server readings in Figure 5.1 shows
that the total lighting energy consumed from installation of the monitoring system
to 12:00:00 AM on September 1, 2007 is 52,629 kWh. The figure also shows that the
total energy consumed by 12:00:00 AM on October 1st is 103,517 kWh. Therefore, the
total lighting energy consumed between September 1 and October 1, 2007, according
to the server readings, is:
Energy consumption reported for Sept. 2007 = 103, 517 − 52, 629 (5.11)
= 50, 888 kWh
The calculations in Equation 5.10 have not taken outdoor fixtures into account, but
the server readings include them. Thus, in order to have a correct estimate, it is

32
Time
Consumption (AI1).Present Value (kWh)
Real Power (AI2).Present Value
(kW)
Real Power, Phase A
(AI12).Present Value
(kW)
Real Power, Phase B
(AI13).Present Value (kW)
Real Power, Phase C
(AI14).Present Value (kW)
9/1/07 12:00:00 AM CDT
52,629.72 59.00 17.78 20.30 20.90
9/1/07 12:15:00 AM CDT
52,644.17 57.00 17.81 18.29 20.88
9/1/07 12:30:00 AM CDT
52,658.41 57.03 17.81 18.31 20.91
9/1/07 12:45:00 AM CDT
52,672.70 57.06 17.82 18.33 20.94
9/1/07 1:00:00 AM CDT
52,686.88 56.21 16.94 18.31 20.97
9/1/07 1:15:00 AM CDT
52,700.94 56.12 16.92 18.30 20.92
9/1/07 1:30:00 AM CDT
52,715.00 55.81 16.49 18.37 20.96
9/1/07 1:45:00 AM CDT
52,728.95 55.69 16.42 18.31 20.93
9/1/07 2:00:00 AM CDT
52,742.83 55.84 16.49 18.36 20.97
9/1/07 2:15:00 AM CDT
52,756.82 55.64 16.43 18.28 20.91
9/1/07 2:30:00 AM CDT
52,770.77 55.81 16.49 18.33 20.99
9/30/07 11:30:00 PM CDT
103,490.98 52.36 15.60 14.83 21.80
9/30/07 11:45:00 PM CDT
103,504.12 52.18 15.64 14.64 21.85
10/1/07 12:00:00 AM CDT
103,517.19 52.13 15.04 15.21 21.87
10/1/07 12:15:00 AM CDT
103,530.17 51.21 15.13 14.91 21.83
10/1/07 12:30:00 AM CDT
103,542.67 49.71 13.62 14.28 21.80
10/1/07 12:45:00 AM CDT
103,555.00 49.46 13.66 14.04 21.86
10/1/07 1:00:00 AM CDT
103,567.44 49.57 13.63 14.06 21.88
10/1/07 1:15:00 AM CDT
103,579.33 46.45 12.92 14.08 19.44
10/1/07 1:30:00 AM CDT
103,590.83 46.48 12.94 14.08 19.43
10/1/07 1:45:00 AM CDT
103,602.50 45.97 12.83 14.06 19.05
10/1/07 2:00:00 AM CDT
103,613.81 44.89 12.82 14.01 18.05
Figure 5.1. Nighttime snapshot of data updates from the server.

33
Figure 5.2. Daytime snapshot of data updates from the server.
necessary to deduct the consumption by outdoor fixtures from the total energy of
Equation 5.11. McNutt Hall has 35 outdoor fixtures of 80W each. Eight of these
35 fixtures operate continually, for an annual total of 8760 hours. The remaining 27
fixtures are on for 13 hours per day, for a total of 4745 hours per year. The nominal
and reported monthly energy consumption of the outdoor light fixtures is calculated

34
in Equation 5.12.
Total monthly kWh of outdoor lights =8760 ∗ 8 ∗ 80 + 4745 ∗ 27 ∗ 80
12, 000(5.12)
= 1321 kWh
The actual monthly energy consumption reported by the server, given in Equation
5.11 is adjusted by this value to facilitate comparison of the estimated and reported
values of lighting energy.
Reported monthly kWh of room and corridor lights = 50, 888 − 1321 (5.13)
= 49, 567 kWh
Comparison of the estimated and reported values of monthly lighting energy, given in
Equations 5.10 and 5.13, respectively, indicates that the values are within 4% of each
other. This validates the assumptions made regarding the operating times of room
and corridor lights.
Complete characterization of the energy savings achieved by the lighting retrofit
requires examination of the peak demand. The total power consumption of the room
and corridor lights during September 2007 is estimated to be 192.44 kW, as given
in Equation 5.9. After the retrofit is completed, the total power consumption of the
room lights is estimated to be 92.5 kW, according to Equation 5.1. Using this value
and Equation 5.6:
Wattage of room and corridor lights after full retrofit = 92.5 + 10.8 (5.14)
= 103.3 kW
The peak demand reported by the server for the room and corridor lights during the
month of September 2007 is 124.7 KWD, corresponding to 64.7% of the total power

35
estimated for these lights during the same period. This measurement was taken during
daylight hours, when the outdoor fixtures are switched off. Assuming the same ratio
will hold when all retrofits are completed, the peak demand is projected to be:
Peak demand after full retrofit = .647 ∗ 103.3 (5.15)
= 66.8 KWD
This leads to annual peak demand savings of:
Annual peak demand savings of full retrofit = 124.7 − 66.8 (5.16)
= 57.9 KWD
The peak demand savings are calculated on an annual basis, as shown in Equation
5.17, where $8.73311 is assumed to be the monthly KWD rate.
Peak demand cost savings of full retrofit = (57.9) ∗ 12 ∗ 8.73311 (5.17)
= $6068 per year
The total power savings achieved by retrofitting the room lights is, from Equation
5.1:
Total power savings of room light retrofit = 218.189 − 92.5 (5.18)
= 125.689 kW
This corresponds to estimated annual energy savings of 377,067 kWh:
Total annual savings of room light retrofit = 125.689 ∗ 3000 (5.19)
= 377, 067 kWh

36
Retrofit of the continually operating and intermittently operating corridor fixtures is
estimated to achieve annual savings of 3630 W and 4281 W, respectively. Hence:
Total power savings of corridor retrofit = 3.630 + 4.281 (5.20)
= 7.911 kW
Total annual savings of corridor retrofit =4680 ∗ 3630 + 8760 ∗ 4281
1000(5.21)
= 52, 489 kWh
From Equations 5.19 and 5.21:
Total annual energy savings = 377, 067 + 52, 489 (5.22)
= 429, 556 kWh
Equation 5.10 can be used to express these savings as a percentage, which better
demonstrates the magnitude of the impact:
Percentage energy savings of retrofit =Total savings
Total pre-retrofit consumption(5.23)
= 100 ∗ 429, 556
12 ∗ 51, 614
= 69.4%
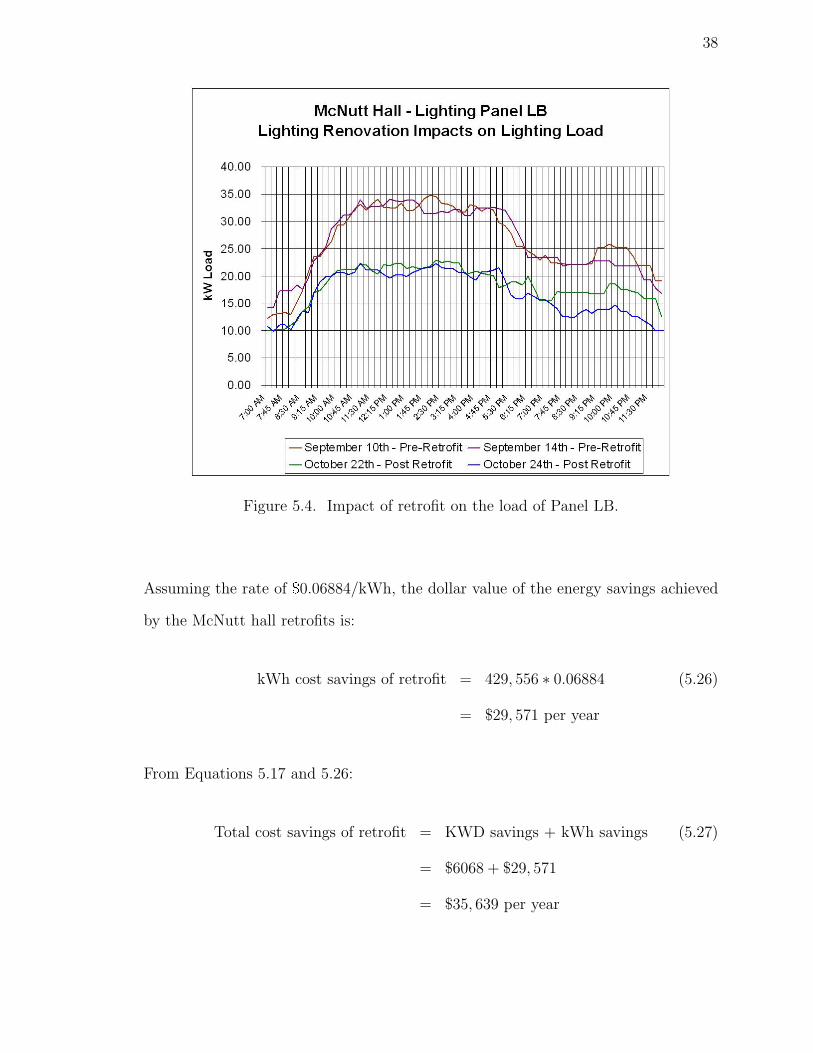
Figures 5.3 and 5.4 depict the changes in the lighting load between 7 am and midnight
on several different dates. Both pre- and post-retrofit dates have been chosen to
illustrate the impact of the retrofit.

37
Figure 5.3. Impact of retrofit on the load of Panel L2A.
As an aside, the total power savings achieved by the retrofit can be calculated
from Equations 5.18 and 5.20:
Total power savings of retrofit = room savings + corridor savings (5.24)
= 125.689 + 7.911
= 133.6 kW
Expressing power savings as a percentage underscores the impact of the retrofit:
Percentage power savings of retrofit =Total savings
Total pre-retrofit consumption(5.25)
= 100 ∗ 133.6
218.189 + 10.8
= 58.3%
38
Figure 5.4. Impact of retrofit on the load of Panel LB.
Assuming the rate of $0.06884/kWh, the dollar value of the energy savings achieved
by the McNutt hall retrofits is:
kWh cost savings of retrofit = 429, 556 ∗ 0.06884 (5.26)
= $29, 571 per year
From Equations 5.17 and 5.26:
Total cost savings of retrofit = KWD savings + kWh savings (5.27)
= $6068 + $29, 571
= $35, 639 per year

39
Additional savings are achieved through reductions in air conditioning, as the new
fixtures generate less heat than the older fixtures. These savings are not reflected in
the calculations of this section, due to the difficulty of accurately measuring them.
The total retrofit cost of a given fixture is due to replacement of the ballast and bulbs,
recycling of the tube and ballast, labor, and overhead charges. The total retrofit cost
for all lighting panels other than panel L2B is $125,226. The total retrofit costs for
the corridor fixtures and panel L2B are $15,128. Both figures include the costs of
purchasing the fixtures, as well as installing and maintaining them. Therefore, the
total retrofit costs for McNutt Hall are:
Total cost of McNutt Hall retrofits = $125, 226 + $15, 128 (5.28)
= $140, 195
Payback time, which is an important factor in determining the success of a retrofit
project, is calculated as:
Payback time =Total retrofit cost
Annual savings in energy costs(5.29)
=$140, 195
$35, 639
= 3.93 years
Equation 5.29 does not consider net present values resulting from inflation, but pro-
vides a good approximation. This estimate indicates that the investment made in full
lighting retrofit of McNutt Hall has a payback time of less than four years, which is
an impressive result considering the magnitude of the project.
40
6 CONCLUSIONS AND FUTURE WORK
The objective of the research described in this thesis was the development and
deployment of an automated, networked system for real-time monitoring of light-
ing energy. These objectives have been fulfilled, and the system developed per the
guidelines of this thesis was deployed in McNutt hall on July 31, 2007. This system
helps the facility managers monitor energy consumption throughout the building, by
collecting data from power meters, communicating them to a server, and reporting
trends and analysis results through user-friendly software. The networked architec-
ture of the system presents a suitable channel for data communication among the
power meters, serves as an interface to the campus LAN, and facilitates transfer of
data among servers running the monitoring software, meters, and controllers.
The tiered design of the lighting monitoring system provides separation of
concerns and facilitates understanding of the different stages involved in monitoring
power consumption. The power data is gathered from numerous metering points
around the building and transported to the facility managers’ servers, where analysis
is carried out to determine usage patterns and identify opportunities for conservation.
Submetering is essential to this goal.
Lighting fixtures, as any other category of electric devices, should be periodi-
cally upgraded to benefit from advances in technology. The lighting retrofit program
at UMR is carried out with this goal, specifically seeking to reduce energy consump-
tion through the use of new, efficient lighting fixtures. Due to the scale of the UMR
campus, this retrofit program promises considerable reduction in energy costs. Pre-
liminary estimates of these savings were given in Section 5, where the payback time
of retrofitting every fixture in McNutt Hall was determined to be less than four years.

41
The retrofit was also shown to result in a 69.4% reduction in annual energy con-
sumption. Both results underscore the impact of the retrofit project, as well as the
importance of a monitoring system capable of accurately measuring power consump-
tion.
The success of the retrofit of McNutt Hall provides motive and justification for
pursuing the ultimate goal of full campus retrofit, which is projected to save 2.1 mil-
lion kWh of energy. This program also encourages further investment in occupancy
sensors, which can considerably reduce the operating time of lights. Future exten-
sions to this work may include projections that include the installation of occupancy
sensors in any location undergoing lighting retrofit. Another interesting extension to
the work is the addition of a simple availability monitor that indicates whether each
submeter is functional, and generates alerts as needed. Finally, the network connec-
tivity of the monitoring system can be used for full interfacing to building automation
systems across campus, facilitating automatic generation of alerts and actuation of
countermeasures.

APPENDIX A
PRE- AND POST-RETROFIT DATA

43
Table A.1: Panel L3 pre-retrofit.
ROOM WATTAGE/FIXTURE NUMBER OF TOTAL WATTAGE
NUMBER FIXTURES
115 16 2976
308 115 8
72 3
307A 115 2 230
307 115 19 2674
307BD 115 3
72 2
310 115 7 1035
115 2
309 115 18 2070
312 115 16
312BD 115 8 2976
72 3
72 2 2099
317 115 12
115 3
115 2
317A 115 8 920
314 115 9 1035
319 144 8 1152
115 16 2976
316 115 8

44
Table A.1: Panel L3 pre-retrofit (cont.)
ROOM WATTAGE/FIXTURE NUMBER OF TOTAL WATTAGE
NUMBER FIXTURES
72 3
304 115 3 345
305 115 9 1560
175 3
305L 115 2 230
115 6 1034
305A 72 2
100 2
115 4 1385
305F 175 1
150 5
305G 115 4 635
175 1
305H 115 4 635
175 1
305J 115 4 635
175 1
319A 72 6 432
319B 72 2 144
317B 72 2 144
317C 72 1 72
313 45 1 45
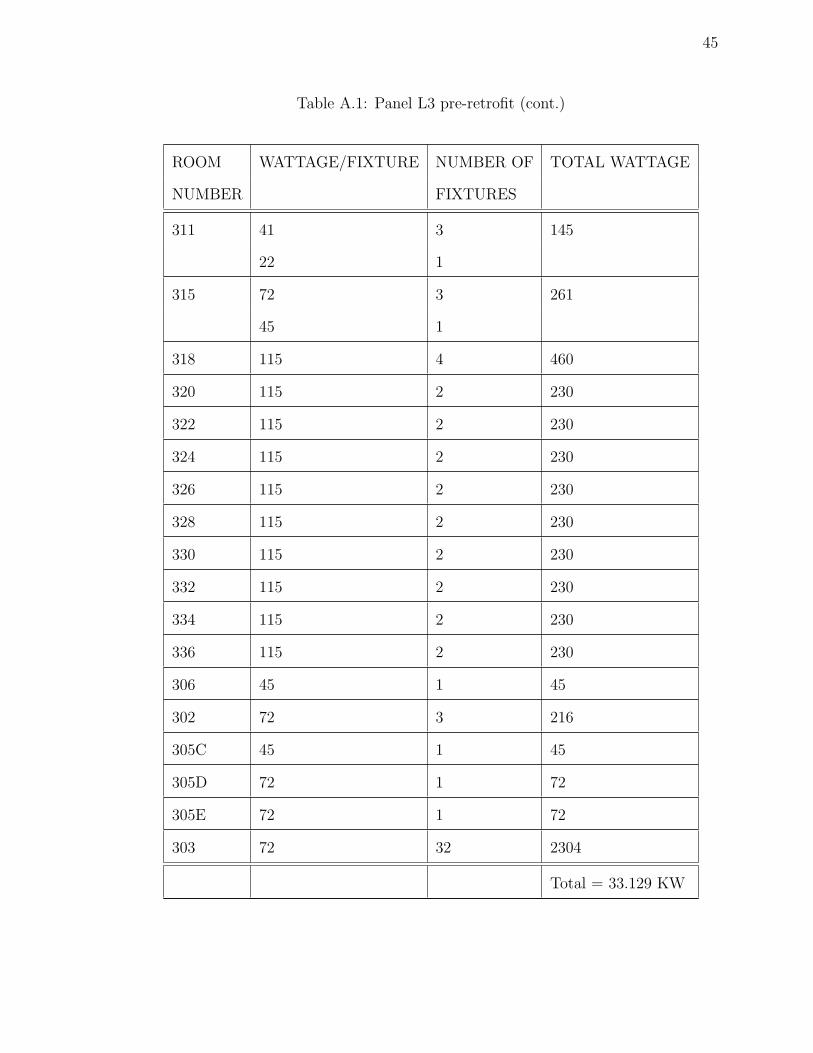
45
Table A.1: Panel L3 pre-retrofit (cont.)
ROOM WATTAGE/FIXTURE NUMBER OF TOTAL WATTAGE
NUMBER FIXTURES
311 41 3 145
22 1
315 72 3 261
45 1
318 115 4 460
320 115 2 230
322 115 2 230
324 115 2 230
326 115 2 230
328 115 2 230
330 115 2 230
332 115 2 230
334 115 2 230
336 115 2 230
306 45 1 45
302 72 3 216
305C 45 1 45
305D 72 1 72
305E 72 1 72
303 72 32 2304
Total = 33.129 KW

46
Table A.2: Panel L3 post-retrofit.
ROOM WATTAGE/FIXTURE NUMBER OF TOTAL WATTAGE
NUMBER FIXTURES
72 8 1056
308 60 8
40 3
307A 48 2 96
307 60 19 1220
307BD 40 2
310 40 7 280
309 60 18 1080
312 72 8 1176
312BD 60 8
40 3
60 12 980
317 60 3
40 2
317A 48 8 384
314 48 6 288
319 71 8 568
72 8 1176
316 60 8
40 3
304 60 3 180
305 60 9 621

47
Table A.2: Panel L3 post-retrofit (cont.)
ROOM WATTAGE/FIXTURE NUMBER OF TOTAL WATTAGE
NUMBER FIXTURES
27 3
305L 60 2 120
60 6 524
305A 40 2
42 2
60 4 417
305F 42 1
27 5
305G 48 4 234
42 1
305H 48 4 234
42 1
305J 48 4 234
42 1
319A 61 6 366
319B 61 2 122
317B 61 2 122
317C 48 1 48
313 22 1 22
311 41 3 145
22 1
315 40 3 142
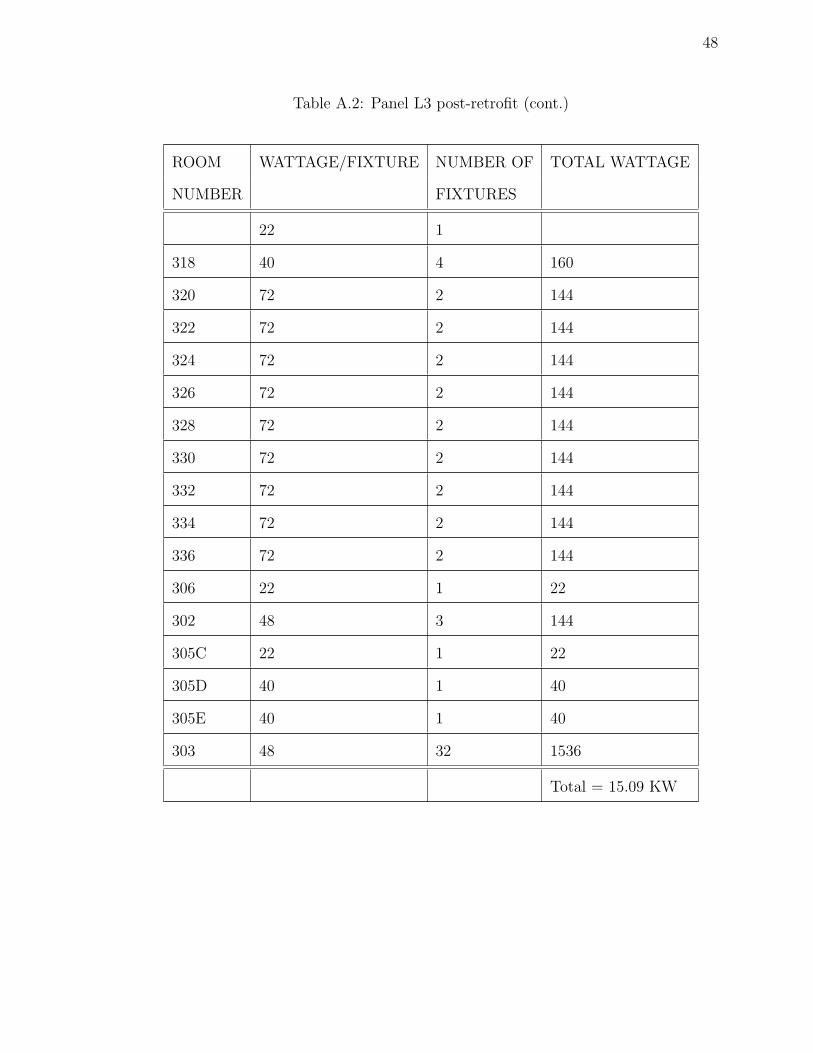
48
Table A.2: Panel L3 post-retrofit (cont.)
ROOM WATTAGE/FIXTURE NUMBER OF TOTAL WATTAGE
NUMBER FIXTURES
22 1
318 40 4 160
320 72 2 144
322 72 2 144
324 72 2 144
326 72 2 144
328 72 2 144
330 72 2 144
332 72 2 144
334 72 2 144
336 72 2 144
306 22 1 22
302 48 3 144
305C 22 1 22
305D 40 1 40
305E 40 1 40
303 48 32 1536
Total = 15.09 KW

49
Table A.3: Panel L2A pre-retrofit.
ROOM WATTAGE/FIXTURE NUMBER OF TOTAL WATTAGE
NUMBER FIXTURES
254 154 45 6930
253 144 9 1296
251 144 1 144
249 144 16 2304
241 144 12 2448
144 5
239 144 7 1008
238 62 18 1116
238A 114 2 228
238B 115 3 345
236 144 10 1440
268 115 8 920
266A 87 2 174
266B 72 6 432
233B 115 3 345
231 115 8 920
230 87 6 522
232 115 6 690
267 144 2 288
267A 87 4 348
254D 115 5 575
254C 115 8 920
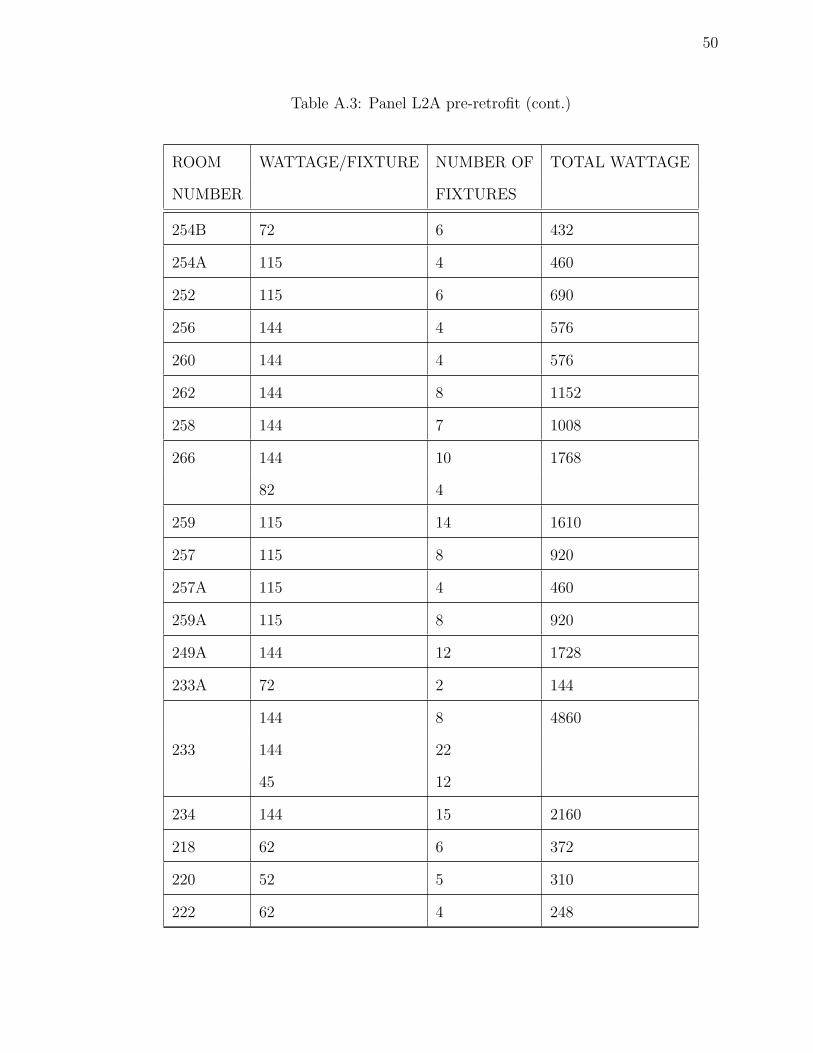
50
Table A.3: Panel L2A pre-retrofit (cont.)
ROOM WATTAGE/FIXTURE NUMBER OF TOTAL WATTAGE
NUMBER FIXTURES
254B 72 6 432
254A 115 4 460
252 115 6 690
256 144 4 576
260 144 4 576
262 144 8 1152
258 144 7 1008
266 144 10 1768
82 4
259 115 14 1610
257 115 8 920
257A 115 4 460
259A 115 8 920
249A 144 12 1728
233A 72 2 144
144 8 4860
233 144 22
45 12
234 144 15 2160
218 62 6 372
220 52 5 310
222 62 4 248

51
Table A.3: Panel L2A pre-retrofit (cont.)
ROOM WATTAGE/FIXTURE NUMBER OF TOTAL WATTAGE
NUMBER FIXTURES
224 115 4 460
226 87 4 348
228 115 4 460
223 115 3 345
225 115 3 345
227 62 3 186
271 115 2 230
273 45 1 45
270 115 2 230
272 115 2 230
274 115 2 230
278 115 2 230
280 115 2 230
282 115 2 230
284 115 2 230
288 115 2 230
290 115 2 230
292 115 2 230
219A 45 3 135
221 72 2 219
75 1
294 72 2 144

52
Table A.3: Panel L2A pre-retrofit (cont.)
ROOM WATTAGE/FIXTURE NUMBER OF TOTAL WATTAGE
NUMBER FIXTURES
217 72 3 216
214 45 1 45
204B 144 1 144
Total = 49.139 KW
Table A.4: Panel L2A post-retrofit.
ROOM WATTAGE/FIXTURE NUMBER OF TOTAL WATTAGE
NUMBER FIXTURES
254 48 45 2160
253 71 9 639
253A 48 6 288
251 48 1 48
249 61 16 376
241 71 12 1092
48 5
239 61 7 427
238 62 18 1116
238A 71 2 142
238B 60 3 180
236 48 10 480

53
Table A.4: Panel L2A post-retrofit (cont.)
ROOM WATTAGE/FIXTURE NUMBER OF TOTAL WATTAGE
NUMBER FIXTURES
268 60 8 480
266A 76 2 152
266B 48 6 288
233B 60 3 180
231 60 8 480
230 76 6 456
232 48 6 288
267 48 2 96
267A 76 4 304
254D 40 5 200
254C 40 8 320
254B 48 6 288
254A 40 4 160
252 40 6 240
256 40 4 160
260 48 4 192
262 48 8 384
258 61 7 427
266 61 14 854
259 60 14 840
257 48 8 384
257A 40 4 160

54
Table A.4: Panel L2A post-retrofit (cont.)
ROOM WATTAGE/FIXTURE NUMBER OF TOTAL WATTAGE
NUMBER FIXTURES
259A 40 8 320
249A 48 12 576
233A 48 2 96
71 8 1888
233 48 22
22 12
234 61 5 915
218 40 6 240
220 48 5 240
222 62 4 248
224 60 4 240
226 76 4 304
228 60 4 240
223 60 3 180
225 60 3 180
227 62 3 186
271 72 2 144
273 22 1 22
270 48 6 288
272 72 2 144
274 72 2 144
278 72 2 144

55
Table A.4: Panel L2A post-retrofit (cont.)
ROOM WATTAGE/FIXTURE NUMBER OF TOTAL WATTAGE
NUMBER FIXTURES
280 72 2 144
282 72 2 144
284 72 2 144
288 72 2 144
290 72 2 144
292 72 2 144
219A 22 3 66
221 40 2 102
22 1
294 48 2 96
217 40 3 120
214 22 1 22
204B 80 1 80
Total = 22.370 KW
Table A.5: Panel LB pre-retrofit.
ROOM WATTAGE/FIXTURE NUMBER OF TOTAL WATTAGE
NUMBER FIXTURES
27 115 14 1727
27BD 72 1

56
Table A.5: Panel LB pre-retrofit (cont.)
ROOM WATTAGE/FIXTURE NUMBER OF TOTAL WATTAGE
NUMBER FIXTURES
45 1 836
115 5
23 72 1
72 2
45 1
21 115 8 920
9 115 5 575
11 115 7 1265
115 4
5 115 7 805
5A 115 4 460
12A 115 2 230
12B 115 3 460
115 1
12C 115 12 1380
12D 115 6 690
12 115 14 1810
200 1
18A 115 3 745
200 2
18B 115 2 630
200 2

57
Table A.5: Panel LB pre-retrofit (cont.)
ROOM WATTAGE/FIXTURE NUMBER OF TOTAL WATTAGE
NUMBER FIXTURES
18C 115 2 230
18D 115 2 230
18 115 9 1035
18E 115 3 945
200 3
18F 115 3 945
200 3
18G 115 4 460
22 144 18 2592
26 144 12 1728
32 72 8 576
34A 72 1 72
34 144 9 2496
200 6
36 144 8 1152
36A 115 4 460
38A 115 4 460
38 115 12 1380
25 115 12 2580
200 6
19A 115 4 460
19B 115 4 460

58
Table A.5: Panel LB pre-retrofit (cont.)
ROOM WATTAGE/FIXTURE NUMBER OF TOTAL WATTAGE
NUMBER FIXTURES
19 144 11 1584
19D 144 3 432
19C 72 1 72
7 144 9 1431
45 3
8 115 4 460
10 115 18 2214
72 2
10A 115 2 230
115 12 3524
14 72 2
200 10
16 115 7 877
72 1
20 144 8 1152
20A 115 4 460
20B 115 2 230
115 3 1635
24 200 3
115 6
24A 115 2 630
200 2

59
Table A.5: Panel LB pre-retrofit (cont.)
ROOM WATTAGE/FIXTURE NUMBER OF TOTAL WATTAGE
NUMBER FIXTURES
24B 115 2 230
24C 115 4 460
24D 115 4 460
28 144 12 1728
42 144 14 2016
115 12 2559
40 115 9
72 2
40A 115 2 230
40B 115 4 460
44 144 16 2304
2 72 2 144
33 45 1 45
59 72 1 72
35 115 2 230
37 115 2 230
39 115 2 230
43 115 2 230
45 115 2 230
47 115 2 230
49 115 2 230
53 115 2 230

60
Table A.5: Panel LB pre-retrofit (cont.)
ROOM WATTAGE/FIXTURE NUMBER OF TOTAL WATTAGE
NUMBER FIXTURES
55 115 2 230
57 115 6 690
6 72 7 504
4 40 3 142
22 1
31 22 9 198
3 22 1 22
Total = 60.059 KW
Table A.6: Panel LB post-retrofit.
ROOM WATTAGE/FIXTURE NUMBER OF TOTAL WATTAGE
NUMBER FIXTURES
27 40 14 622
27BD 40 1
22 1
60 5 362
23 40 1
22 1
21 60 8 480
9 60 5 300

61
Table A.6: Panel LB post-retrofit (cont.)
ROOM WATTAGE/FIXTURE NUMBER OF TOTAL WATTAGE
NUMBER FIXTURES
11 60 7 420
5 72 7 504
5A 72 4 288
12A 60 2 120
12B 60 3 180
12C 48 12 576
12D 60 4 240
12 60 14 840
18A 60 3 180
18B 72 2 144
18C 72 2 144
18D 72 2 144
18 60 9 540
18E 40 3 120
18F 40 3 120
18G 40 4 160
22 48 18 864
26 61 12 732
32 48 8 384
34A 48 1 48
34 40 9 522
27 6

62
Table A.6: Panel LB post-retrofit (cont.)
ROOM WATTAGE/FIXTURE NUMBER OF TOTAL WATTAGE
NUMBER FIXTURES
36 48 8 384
36A 40 4 160
38A 40 4 160
38 60 12 720
25 40 12 642
27 6
19A 40 4 160
19B 40 4 160
8 60 4 240
10 48 18 944
40 2
10A 72 2 144
14 60 12 800
40 2
16 60 7 460
40 1
20 61 8 488
20A 40 4 160
20B 60 2 120
24 48 6 288
24A 115 2 630
200 2

63
Table A.6: Panel LB post-retrofit (cont.)
ROOM WATTAGE/FIXTURE NUMBER OF TOTAL WATTAGE
NUMBER FIXTURES
24B 48 2 96
24C 40 4 160
24D 40 4 160
28 71 12 852
42 71 14 994
40 76 12 992
40 2
40A 72 2 144
40B 40 4 160
44 71 16 1136
2 48 2 96
33 22 1 22
19 61 11 671
19D 48 3 144
19C 48 1 48
7 48 9 498
22 3
6 72 7 504
4 40 3 142
22 1
31 22 9 198
3 22 1 22
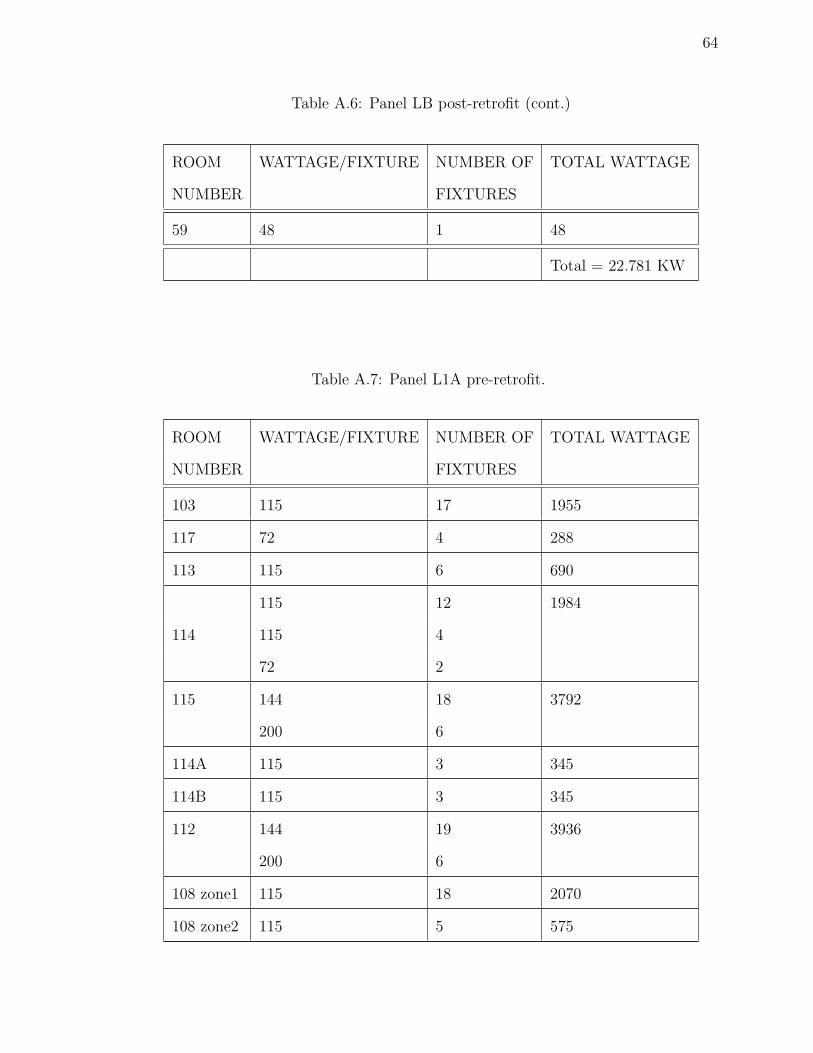
64
Table A.6: Panel LB post-retrofit (cont.)
ROOM WATTAGE/FIXTURE NUMBER OF TOTAL WATTAGE
NUMBER FIXTURES
59 48 1 48
Total = 22.781 KW
Table A.7: Panel L1A pre-retrofit.
ROOM WATTAGE/FIXTURE NUMBER OF TOTAL WATTAGE
NUMBER FIXTURES
103 115 17 1955
117 72 4 288
113 115 6 690
115 12 1984
114 115 4
72 2
115 144 18 3792
200 6
114A 115 3 345
114B 115 3 345
112 144 19 3936
200 6
108 zone1 115 18 2070
108 zone2 115 5 575

65
Table A.7: Panel L1A pre-retrofit (cont.)
ROOM WATTAGE/FIXTURE NUMBER OF TOTAL WATTAGE
NUMBER FIXTURES
108 zone3 200 2 400
110A 144 1 144
112A 144 2 288
110 144 9 1368
72 1
106 115 12 1495
115 1
104 144 18 2592
104A 115 3 345
101 72 1 72
105 72 2 234
45 2
109 72 1 72
Total = 22.99 KW
Table A.8: Panel L1A post-retrofit.
ROOM WATTAGE/FIXTURE NUMBER OF TOTAL WATTAGE
NUMBER FIXTURES
103 - 14 -
117 40 4 160
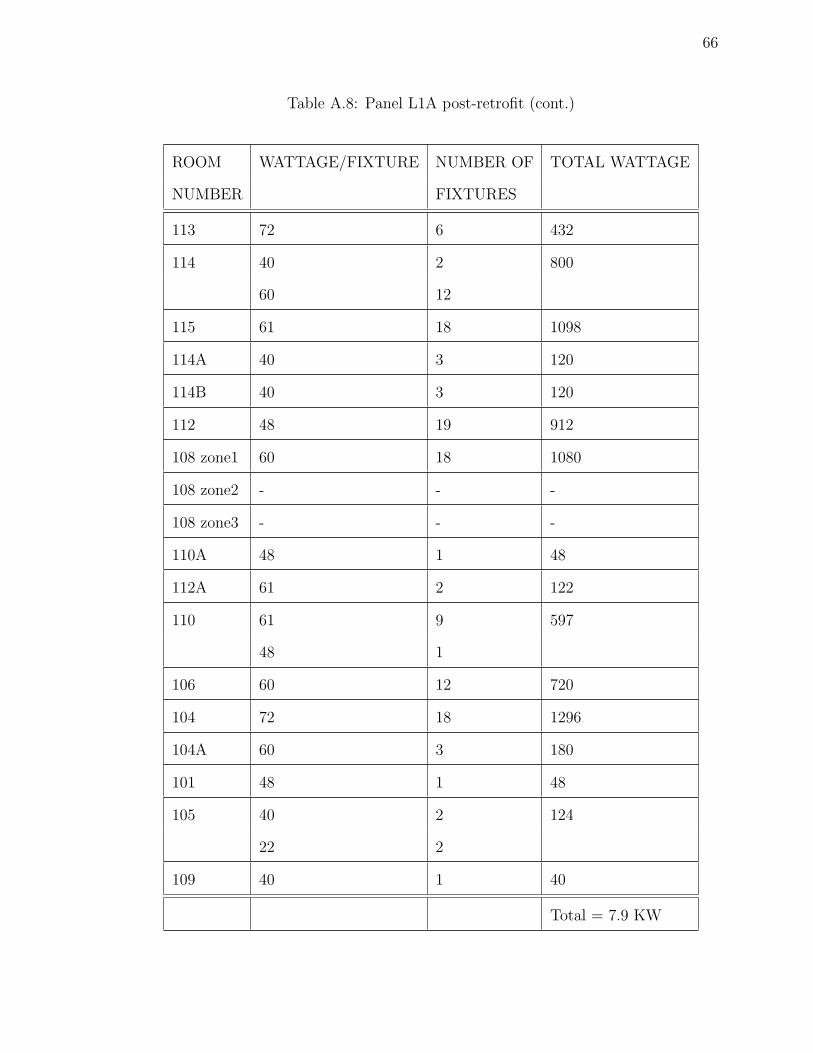
66
Table A.8: Panel L1A post-retrofit (cont.)
ROOM WATTAGE/FIXTURE NUMBER OF TOTAL WATTAGE
NUMBER FIXTURES
113 72 6 432
114 40 2 800
60 12
115 61 18 1098
114A 40 3 120
114B 40 3 120
112 48 19 912
108 zone1 60 18 1080
108 zone2 - - -
108 zone3 - - -
110A 48 1 48
112A 61 2 122
110 61 9 597
48 1
106 60 12 720
104 72 18 1296
104A 60 3 180
101 48 1 48
105 40 2 124
22 2
109 40 1 40
Total = 7.9 KW

67
Table A.9: Panel L2 pre-retrofit.
ROOM WATTAGE/FIXTURE NUMBER OF TOTAL WATTAGE
NUMBER FIXTURES
242C 77 12 924
242B 154 16 2618
154 1
242D 62 2 239
115 1
242E 72 4 288
242F 72 3 216
71 6 4104
77 1
242 135 5
154 3
154 16
242G 72 3 216
244D 154 6 924
244E 154 8 1232
244G 154 6 924
244H 115 2 538
54 2
244 77 19 5791
154 32
248B 115 1 115

68
Table A.9: Panel L2 pre-retrofit (cont.)
ROOM WATTAGE/FIXTURE NUMBER OF TOTAL WATTAGE
NUMBER FIXTURES
244K 115 4 460
248A 115 2 230
248 115 11 1840
115 5
240A 100 1 100
240B 100 1 100
240C 100 1 100
246 115 1 115
Total = 21.074 KW
Table A.10: Panel L2 post-retrofit.
ROOM WATTAGE/FIXTURE NUMBER OF TOTAL WATTAGE
NUMBER FIXTURES
242C 48 12 576
242B 61 16 1024
48 1
242D 62 2 184
60 1
242E 48 4 192
242F 72 3 216

69
Table A.10: Panel L2 post-retrofit (cont.)
ROOM WATTAGE/FIXTURE NUMBER OF TOTAL WATTAGE
NUMBER FIXTURES
71 6 1890
61 1
242 61 5
61 2
61 16
242G 72 3 216
244D 40 6 240
244E - - -
244G 48 6 288
244H 60 2 242
61 2
244 48 19 2864
61 32
248B 60 1 60
244K 48 4 192
248A 60 2 120
248 60 11 660
240A 42 1 42
240B 42 1 42
240C 42 1 42
246 62 1 62
Total = 9.152 KW

70
Table A.11: Panel L1 pre-retrofit.
ROOM WATTAGE/FIXTURE NUMBER OF TOTAL WATTAGE
NUMBER FIXTURES
146D 154 5 770
146A 154 4 616
144A 154 9 1386
146 154 9 1386
144 154 6 924
142 154 18 2772
130 - - -
126 115 6 690
124 115 8 920
140 115 15 1725
138 115 15 1725
118 115 2 230
120 115 4 460
122 115 4 460
128 115 4 460
139 115 2 230
141 115 2 230
143 115 2 230
147 115 2 230
149 115 2 230
151 115 2 230

71
Table A.11: Panel L1 pre-retrofit (cont.)
ROOM WATTAGE/FIXTURE NUMBER OF TOTAL WATTAGE
NUMBER FIXTURES
153 115 2 230
157 115 2 230
159 115 2 230
161 115 6 690
144B 144 2 288
144C 115 1 115
146B 115 115 115
146C 115 1 115
135 72 3 216
134 45 1 45
137 45 1 45
127 115 6 690
129 115 6 690
132 45 1 45
132A 72 3 216
136 72 2 144
Total = 20.008 KW

72
Table A.12: Panel L1 post-retrofit.
ROOM WATTAGE/FIXTURE NUMBER OF TOTAL WATTAGE
NUMBER FIXTURES
146D 61 5 305
146A 61 4 244
144A 61 9 549
146 61 9 549
144 48 6 288
142 71 18 1278
130 - - -
126 60 6 360
124 72 8 576
140 60 15 900
138 48 15 720
118 60 2 120
120 48 4 192
122 48 4 192
128 40 4 160
139 72 2 144
141 72 2 144
143 72 2 144
147 72 2 144
149 72 2 144
151 72 2 144
153 72 2 144

73
Table A.12: Panel L1 post-retrofit (cont.)
ROOM WATTAGE/FIXTURE NUMBER OF TOTAL WATTAGE
NUMBER FIXTURES
157 72 2 144
159 72 2 144
161 48 6 288
144B 61 1 61
144C 60 1 60
146B 60 1 60
146C 60 1 60
135 48 3 144
134 22 1 22
137 22 1 22
127 40 6 240
129 40 6 240
132 22 1 22
132A 40 3 120
136 40 2 102
22 1
Total = 9.17 KW

74
Table A.13: Panel L2B pre-retrofit.
ROOM WATTAGE/FIXTURE NUMBER OF TOTAL WATTAGE
NUMBER FIXTURES
204 108 32 3681
45 5
206 108 19 2232
45 5
212 108 15 1845
45 5
216 108 16 1973
45 5
211 108 17 2061
45 5
Total = 11.79 KW
Table A.14: Panel L2B post-retrofit.
ROOM WATTAGE/FIXTURE NUMBER OF TOTAL WATTAGE
NUMBER FIXTURES
204 60 32 2022
20.4 5
62 1
206 20 4 1220
77 14

75
Table A.14: Panel L2B post-retrofit (cont.)
ROOM WATTAGE/FIXTURE NUMBER OF TOTAL WATTAGE
NUMBER FIXTURES
212 60 13 882
20.4 5
216 60 14 942
20.4 5
211 60 15 1002
20.4 5
Total = 6.06 KW

APPENDIX B
SNAPSHOTS FROM THE METASYS® SOFTWARE
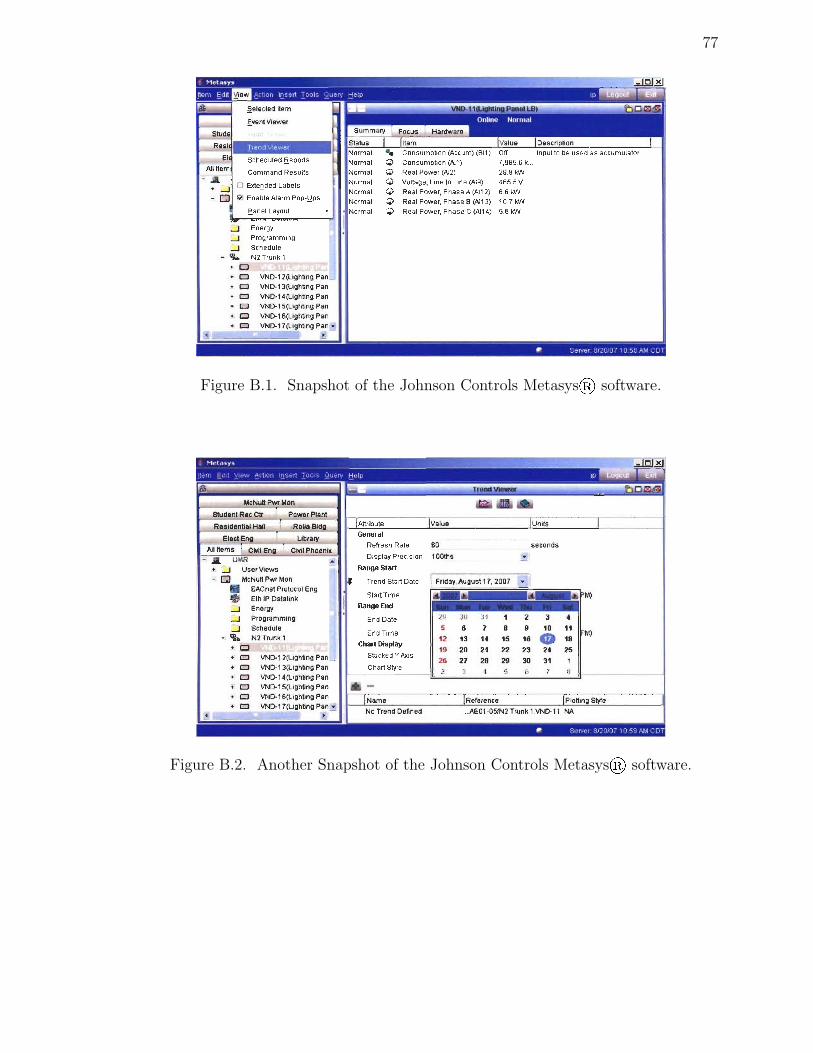
77
Figure B.1. Snapshot of the Johnson Controls Metasys® software.
Figure B.2. Another Snapshot of the Johnson Controls Metasys® software.

APPENDIX C
FIXTURES RETROFITTED BY OCTOBER 1, 2007

79
Table C.1: Fixtures retrofitted by Oct. 1, 2007.
ROOM WATTAGE/FIXTURE NUMBER OF TOTAL WATTAGE
NUMBER FIXTURES
4 40 3 142
22 1
105 40 2 124
22 2
109 40 1 40
132 45 1 45
132A 40 3 216
48 2
136 40 2 102
22 1
140 60 15 900
219 66 1 66
221 40 2 102
22 1
233 71 8
48 22 1888
22 12
233A 48 2 96
233B 60 3 180
238 62 18 1116
238A 71 2 142
238B 60 3 180

80
Table C.1: Fixtures retrofitted by Oct. 1, 2007 (cont.)
ROOM WATTAGE/FIXTURE NUMBER OF TOTAL WATTAGE
NUMBER FIXTURES
239 61 7 427
241 71 12 1092
48 5
242 - - 1890
242B 61 16 1024
48 1
242C 48 12 576
242D 62 2 184
60 1
242E 48 8 192
242F 72 3 216
242G 72 3 216
244 48 19 2864
61 32
244D 40 6 240
244G 48 6 288
244H 60 2 242
61 2
244K 48 4 192
254 48 45 2160
305 27 3 81
305A 42 2 84

81
Table C.1: Fixtures retrofitted by Oct. 1, 2007 (cont.)
ROOM WATTAGE/FIXTURE NUMBER OF TOTAL WATTAGE
NUMBER FIXTURES
305F 42 1 177
27 5
305G 42 1 42
305H 42 1 42
305J 42 1 42
308 60 8
72 8 1056
40 3
309 60 8 1080
311 71 2 142
312 - - 1176
315 40 3 142
22 1
316 - - 1176
319 71 8 568
204 60 32 2022
20.4 5
206 71 12 1092
48 5
212 60 13 882
20.4 5
216 60 14 942

82
Table C.1: Fixtures retrofitted by Oct. 1, 2007 (cont.)
ROOM WATTAGE/FIXTURE NUMBER OF TOTAL WATTAGE
NUMBER FIXTURES
20.4 5
211 60 15 1002
20.4 5
Total = 28.893 KW

83
BIBLIOGRAPHY
[1] L. Mane, “Submetering: A practical approach,” GE ESL Magazine, pp. 1–13,2005.
[2] T. D. Baenziger, “Energy management in lighting sytems,” in Proc. of the IEEEIndustry Applications Conference, vol. 5, pp. 3452–3459, Oct. 2000.
[3] T. Chandler, “The technology development of automatic metering and monitor-ing systems,” in Proc. of the IEEE International Power Engineering ConferenceIPEC, pp. 1–4, Nov. 29 - Dec. 2 2005.
[4] J. B. Hoover, “The changing world of power monitoring,” in Proc. of the IEEEInternational Telecommunications Energy Conference (INTELEC), pp. 103–108,Sept. 2000.
[5] A. P. Stublen, C. M. Wellman, S. A. Kell, and T. W. Langston, “Justifying andplanning an energy management system in an existing plant,” in Proc. of theIEEE Petroleum and Chemical Industry Applications Society, pp. 13–19, Sept.1995.
[6] A. P. Stublen, C. M. Wellman, S. A. Kell, and T. W. Langston, “Justifying andplanning an energy management system,” IEEE Industry Applications Magazine,vol. 3, pp. 54–61, April-May 1997.
[7] M. S. Majid, F. M. Taha, N. M. Maricar, and S. Rahman, “Impact of demand-side retrofit on the energy savings at the Universiti Teknologi Malaysia,” in IEEEPower Engineering Society Winter Meeting, vol. 1, pp. 534–539, Jan. 2000.
[8] V. Boed, “Central building utilities metering systems at Yale University,” EnergyEngineering, vol. 97, no. 3, pp. 57–77, 2000.
[9] V. Boed, “Advanced systems earn an Ivy League A+ for innovation,” whitepaper, Yale University, 1997.
[10] N. Motegi, M. A. Piette, S. Kinney, and J. Dewey, “Case studies of energy infor-mation systems and related technology: Operational practices, costs, and ben-efits,” in Proc. of International Conference for Enhanced Building Operations,Oct. 2003.
[11] M. A. Saidel, A. L. V. Gimenes, and L. H. L. Rosa, “Requirements of an au-tonomous information system for support to the energy management,” in Proc. ofthe IEEE/PES Transmission and Distribution Conference and Exposition:LatinAmerica, pp. 390–395, Nov. 2004.
84
[12] S. Newbold and L. Agarwal, “Design and implementation of a non-proprietarycampus energy management and control system(EMCS),” in Proc. of the IEEEInternational Conference on Electro Information Technology, vol. 5, pp. 1–10,May 2005.
[13] F. J. Dorhofer and W. M. Heffington, “Electrical energy monitoring in an indus-trial plant,” in Proc. of the IEEE Annual Industrial Energy Technology Confer-ence, pp. 269–274, June 1994.
[14] T. Nagata, “An electric power energy monitoring system in campus using aninternet,” in Proc. of the IEEE Power Engineering Society Meeting, pp. 1–6,June 2006.
[15] W. Granzer, G. Neugschwandtner, W. Kastner, and F. Praus, “A modular ar-chitecture for building automation systems,” in Proc. of the IEEE InternationalWorkshop on Building Automation, pp. 99–102, June 2006.
[16] J. C. Engel, W. J. Murphy, and D. M. Oravetz, “Remote monitoring of cir-cuit breakers,” in Proc. of the IEEE Industry Applications Conference, vol. 4,pp. 2344–2347, Oct. 1999.
[17] B. G. Bailey, “Power system protection-power monitoring-data logging-remoteinterrogation system,” in Proc. of the IEEE Industrial and Commerical PowerSystems Technical Conference, pp. 109–112, May 1989.
[18] J. Kinsley, “Understanding modern power monitoring and control,” ElectricalConstruction and Maintenance (EC & M), Aug. 2003.
[19] B. Burke, J. R. McBride, and M. K. Kemble, “Development of an enterprise-wideenergy information and utility monitoring system in a major hotel chain: HyattHotels Corporation experience,” in Proc. of the National Conference on BuildingCommissioning, pp. 1–13, May 2005.
[20] J. Lewis, “Using WAGES information for benchmarking and operational analy-sis,” The Facility Managers’ Institute, 2005.
[21] Veris Industries, “H8025/8026 series.” Technical document, 2004.
[22] Johnson Controls, “Network automation engine (NAE) product bulletin.” Tech-nical document, May 2007.
[23] J. Piper, “Finding a path to interoperability,” Building Operation Management,Aug. 2000.
[24] M. H. Newman, “BACnet: Answers to frequently asked questions,” March 1997.
[25] ISO 16484-2, “Building Automation and Control Systems (BACS)-Part 2: Hard-ware,” 2004.

85
VITA
Sandeep Kunchum was born in Hyderabad, India on May 31, 1984. In April
2005, he received his Bachelor of Technology in Electronics and Communication En-
gineering from the Jawaharlal Nehru Technological University in Hyderabad, India.
In December 2007, he received his M.S. in Computer Engineering from the University
of Missouri-Rolla.