a natural user interaction for e-learning...
TRANSCRIPT

1
A Natural User Interaction for E-learning Learners :
Focused on the Automatic Speed Control of
E-learning video by learner's head gesture
Minjae Park
Dept. of Human ICT Convergence
Thesis Supervisor :
Kyung-hyun Lee
Committee:
Jun-dong Cho, Jong-pil Jung

Contents
1. Introduction
2. Literature Review 1. Interaction in E-learning
2. User Centered Interaction design
3. Research Questions 1. Service Description
2. Research Questions
4. Methodology
5. Experiments 1. Experiment 1
2. Experiment 1 result
3. Experiment 2
4. Experiment 2 result
5. Questionnaire
6. Questionnaire result
7. Interview
8. Interview result
6. Prototyping
7. Conclusion
2

Introduction
3
• The global e-learning market will grow 7.9% over the period 2012-2016
T.Navio, “Global E-learning Market 2013-2016”, (2013)

Introduction
4
• The global e-learning market will grow 7.9% over the period 2012-16
- T.Navio, “Global E-learning Market 2013-2016”, (2013)

Introduction
5
• The global e-learning market will grow 7.9% over the period 2012-16
- T.Navio, “Global E-learning Market 2013-2016”, (2013)
Problem : In order to take a note during watch the lecture,
Leaners often pause a video or use a backward !

- Interaction is one of the key elements that influence learning
- There are four types of interaction exist : learner-content
interaction, learner-instructor interaction, learner-learner
interaction and also learner-interface interaction
1. Interactions in E-learning
6
G. Kearsley and M. Moore, “Distance Education:
a System View”, Wadsworth, California, (1996).
D. C. Hillman, et al “Learner-interface Interaction in Distance Education: An Extension of Contemporary
Models and Strategies for Practitioners”, American J. Distance Education, vol. 8, no. 2, (1994), pp. 30-42.
M. Williams, “Learner Control and Instructional Technologies”, Handbook of Research on Educational
Communications and Technology, Scholastic, New York (1996), pp. 957-983.
Literature Review : 1. Interaction in E-learning

7
Literature Review : 2. Natural User Interaction
D. Wigdor and D. Wixon, “Brave NUI World: Designing Natural User
Interfaces for Touch and Gesture”, Elsevier, USA,
- Interface with computer was changed :
command-line interface (CLI) → graphical user interface (GUI)
- Now, Because the gesture recognition connects between human motions and
a computer very naturally, it is considered as a representative example of Natural
User Interface (NUI)

8
Service Description
• The speed of the e-learning multimedia materials, is changed by learner’s head gesture.
When learner take a note, the speed of the multimedia materials slow down.

9
Research Question
• Research Question 1 : Does the leaners' head angle distinguish situations of note taking
from those of watching to a lecture?
• Research Question 2 : Does the automatic speed control of multimedia materials by the
learners' head angle have an effect on learners’ satisfaction?
User Satisfaction
Distinguish

10
Methodology
Experiment 2 : Comparing regular E-learning condition(A) and Automatic control by head gesture(B) condition
Experiment 1 :
Measuring the participants’ nodding time(taking a note) and head angle
In-depth interview
Questionnaire : Usefulness, Ease of use, Flow, Satisfaction, Intention to use after experiments
11
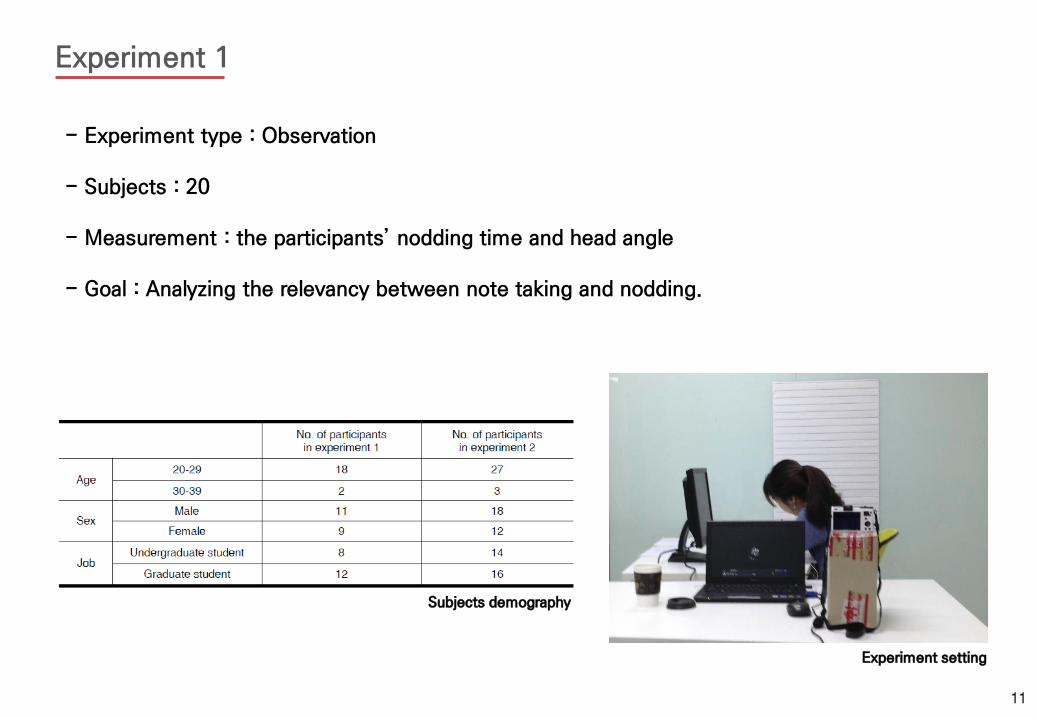
Experiment 1
- Experiment type : Observation
- Subjects : 20
- Measurement : the participants’ nodding time and head angle
- Goal : Analyzing the relevancy between note taking and nodding.
Experiment setting
Subjects demography

12
Experiment 1 : Result
- In experiment 1, I counted the number of participants’ nodding. In addition, it was verified whether
the participants took notes when they lowered their head.
- There was significant relevancy between the participants’ action of lowering their head and note taking.
(Participants were taking notes, confirming the spelling and grammar, or preparing their next note
taking).
- The participants’ nodding duration and frequency varied from each other. However,
the participants lowered their head longer than two seconds when taking notes.
Relationship between the Duration of Lowered Head and Amount of Note Taking
Duration of lowered head (t: seconds)
t ≤ 2 2 < t ≤ 5 5 < t
No. of times head was lowered 182 116 148
No. of times notes were taken 11 67 134
No. of times notes were taken / No. of times head was lowered
6% 58% 91%

13
After learners lower their head over 2 seconds, the speed of video slows down to 0.2x
• After finish the experiment1, I set a specific function of the system(control variables)
Experiment 1 : Result

14
Experiment 2
- Subjects : 30
- Measurement : Comparison two type of condition
- Independent variables : Both A, B condition
- Dependent variables : No. of pause and rewind buttons learner clicked
Condition A ( Regular e-learning system
: Direct Manipulation condition )
Condition B ( Automatic speed control of
E-learning condition )

15
Experiment 2 : Result
Comparisons between Two Sessions on Average Number of Pause and Rewind Buttons Clicked
Direct Manipulation condition (Condition A) Automatic speed control condition (Condition B)
Average number of pause and rewind buttons clicked
Standard deviation Average number of pause and rewind
buttons clicked Standard deviation
1.63 1.16 0.23 0.50
- In the A session, the average number of pause and rewind buttons clicked is 1.63 times
per participant and a standard deviation is 1.16.
- In the B session, the average number of pause and rewind buttons clicked is 0.23 times
per participant and a standard deviation is 0.50.

Experiment 2 : Result Direct Manipulation condition
(Condition A)
Automatic speed control condition
(condition B)
No. of pause
button clicked
No. of rewind
button clicked
Total no. of
buttons clicked
No. of pause
button clicked
No. of rewind
button clicked
Total no. of
buttons clicked
Participant 1 (23, male) 1 0 1 0 0 0
Participant 2 (25, female) 0 0 0 0 0 0
Participant 3 (28, female) 1 0 1 0 0 0
Participant 4 (28, female) 0 0 0 0 0 0
Participant 5 (25, male) 2 0 2 0 0 0
Participant 6 (25, male) 0 0 0 0 0 0
Participant 7 (26, male) 2 0 2 0 0 0
Participant 8 (26, female) 0 3 3 0 0 0
Participant 9 (28, male) 0 2 2 0 0 0
Participant 10 (28, male) 1 0 1 1 0 1
Participant 11 (27, male) 1 3 4 0 0 0
Participant 12 (28, male) 2 1 3 0 0 0
Participant 13 (30, male) 1 0 1 0 0 0
Participant 14 (25. female) 2 0 2 0 0 0
Participant 15 (32, male) 0 1 1 0 0 0
Participant 16 (28, male) 0 0 0 0 0 0
Participant 17 (30, male) 1 0 1 0 0 0
Participant 18 (22, female) 2 1 3 0 1 1
Participant 19 (28, male) 1 0 1 0 0 0
Participant 20 (26, female) 2 0 2 0 0 0
Participant 21 (24, female) 0 1 1 0 0 0
Participant 22 (23, female) 0 2 2 1 0 1
Participant 23 (28, female) 2 0 2 0 0 0
Participant 24 (26, male) 0 0 0 0 0 0
Participant 25 (28, male) 1 2 3 0 0 0
Participant 26 (25, female) 1 2 3 2 0 2
Participant 27 (27, male) 2 0 2 0 1 1
Participant 28 (28, male) 1 0 1 0 0 0
Participant 29 (24, male) 3 1 4 0 1 1
Participant 30 (25, female) 1 0 1 0 0 0
Total 28 19 49 4 3 7
Average 1 0.63 1.63 0.13 0.1 0.23
- In the A session : total
number of pause button
which participants clicked
is twenty eight times and
total number of rewind
button which participants
clicked is nineteen times.
- In the B session : total
number of a pause button
which participants clicked
is four and total number of
a rewind button which
participants clicked is three.

17
Questionnaire
- Subjects : 30
- Questionnaire type : 7 points Likert scale
- Measurement : Usefulness, Ease of use, User flow, User satisfaction, Intention of use
- Procedure : After experiments 2, all participants surveyed questionnaire of 15 items
Variable No. of items Reference
Perceived Usefulness (PU) 5 Davis. 1989
Perceived Ease of Use (PEOU) 3 Davis. 1989
Flow (FLO) 3 Shin, N. 2006
User Satisfaction (SAT) 2 Taylor, S. 1995
Intention to use (IU) 2 Davis. 1989

18
Questionnaire : specific question
Criteria Items Specific Question
Flow (FLO) 3
나는 동영상 강의를 듣는 것에 온전히 집중할 수 있었다.
나는 필기활동에 온전히 집중할 수 있었다.
학습을 하는 동안, 나는 주변의 다른 상황에 대해 신경이 쓰이지 않았다.
Perceived Usefulness (PU) 5
상호작용 시스템은 나의 학습 성취도를 높였다.
상호작용 시스템은 나의 학습 효율을 높였다.
나는 동영상 강의 학습 중, 필기를 하는 것이 수월했다.
나는 필기를 하는 동안, 강의를 이해할 수 있었다.
이 상호작용 시스템은 내가 원하는 조작을 하기 쉽게 해준다.
Perceived Ease of Use
(PEOU) 3
나는 이 상호작용 시스템을 사용하는 것이 편하다.
이 상호작용 시스템을 익숙하게 사용하는 것은 쉽다.
나는 이 상호작용 시스템을 사용하는 것이 쉽다.
Behavioral intention to use (IU) 2
나는 이 상호작용 시스템을 계속 사용하고 싶다.
나는 이 상호작용 시스템을 지인에게 추천해주고 싶다.
Satisfaction (SAT) 2
나는 이 방법의 상호작용 시스템의 사용에 만족한다.
나는 이 방법의 상호작용 시스템을 이용하여 동영상 강의 학습을 하는 것이 기쁘다.
19
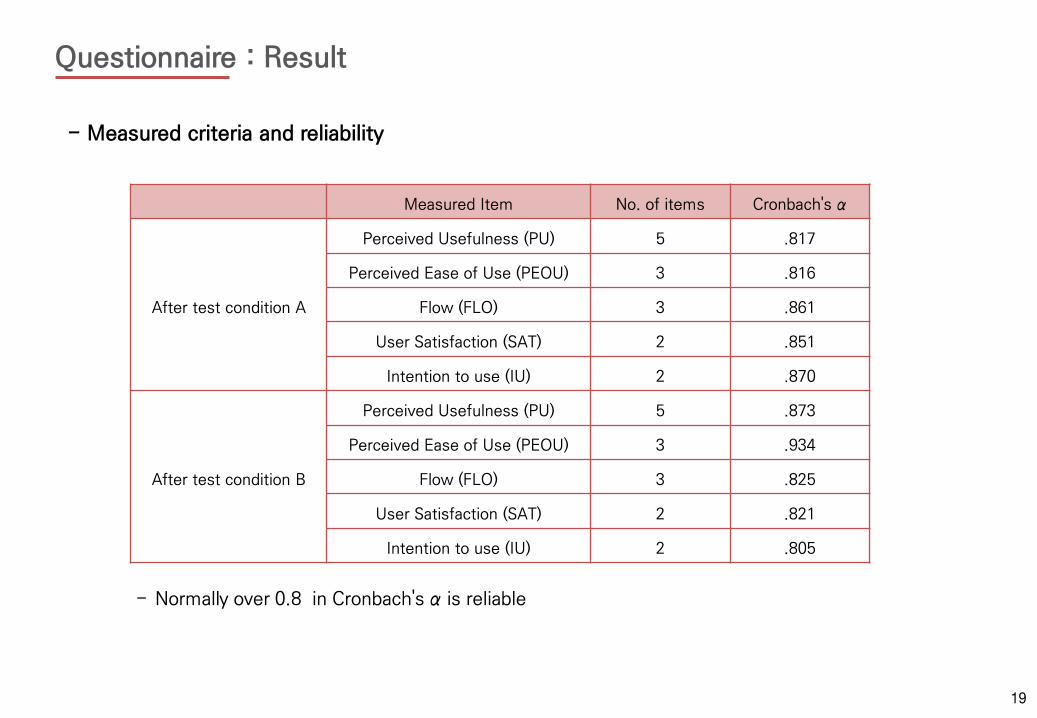
Questionnaire : Result
- Measured criteria and reliability
Measured Item No. of items Cronbach's α
After test condition A
Perceived Usefulness (PU) 5 .817
Perceived Ease of Use (PEOU) 3 .816
Flow (FLO) 3 .861
User Satisfaction (SAT) 2 .851
Intention to use (IU) 2 .870
After test condition B
Perceived Usefulness (PU) 5 .873
Perceived Ease of Use (PEOU) 3 .934
Flow (FLO) 3 .825
User Satisfaction (SAT) 2 .821
Intention to use (IU) 2 .805
- Normally over 0.8 in Cronbach's α is reliable

20
Questionnaire : Result
- Result of questionnaire of two conditions (condition A and B)
- Automatic speed control would has an effect on the usefulness
- There seem to be little difference in ease of use and flow between two conditions
0
1
2
3
4
5
6
7
Perceived usefulness Perceived ease of
use
Flow Intention to use User satisfaction
Direct manipulation condition Automatic control condition
(Condition A) (Condition B)
21
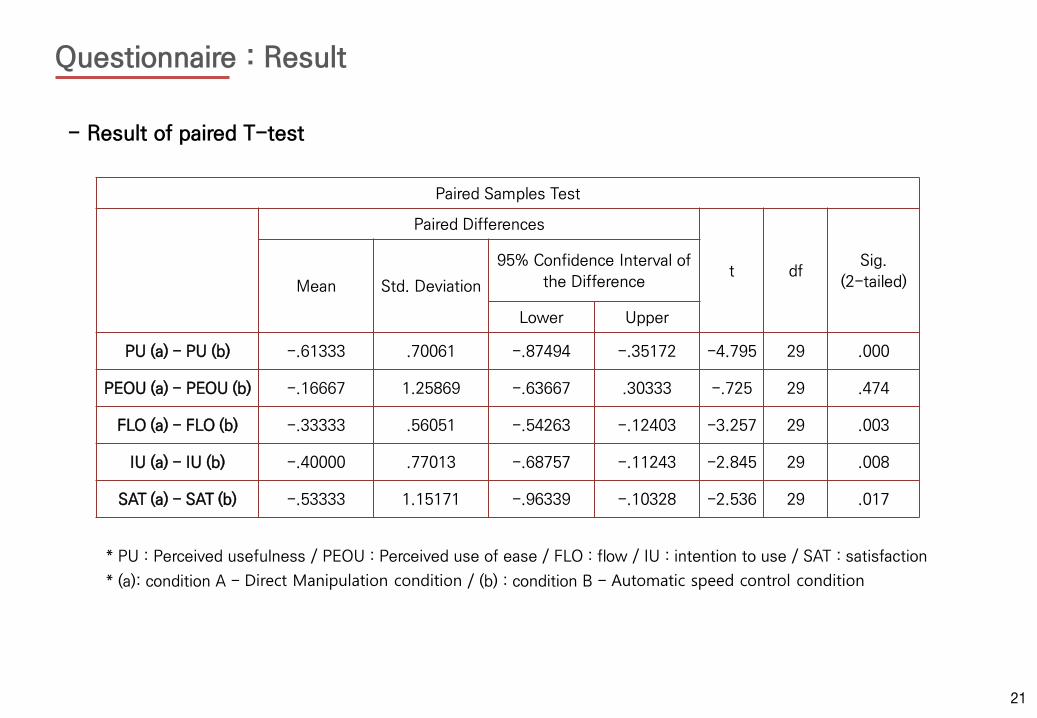
Questionnaire : Result
- Result of paired T-test
* PU : Perceived usefulness / PEOU : Perceived use of ease / FLO : flow / IU : intention to use / SAT : satisfaction
* (a): condition A - Direct Manipulation condition / (b) : condition B - Automatic speed control condition
Paired Samples Test
Paired Differences
t df Sig.
(2-tailed) Mean Std. Deviation
95% Confidence Interval of
the Difference
Lower Upper
PU (a) - PU (b) -.61333 .70061 -.87494 -.35172 -4.795 29 .000
PEOU (a) - PEOU (b) -.16667 1.25869 -.63667 .30333 -.725 29 .474
FLO (a) - FLO (b) -.33333 .56051 -.54263 -.12403 -3.257 29 .003
IU (a) - IU (b) -.40000 .77013 -.68757 -.11243 -2.845 29 .008
SAT (a) - SAT (b) -.53333 1.15171 -.96339 -.10328 -2.536 29 .017

22
Questionnaire : Result
- Result of paired T-test
* PU : Perceived usefulness / PEOU : Perceived use of ease / FLO : flow / IU : intention to use / SAT : satisfaction
* (a): condition A - Direct Manipulation condition / (b) : condition B - Automatic speed control condition
Paired Samples Test
Paired Differences
t df Sig.
(2-tailed) Mean Std. Deviation
95% Confidence Interval of
the Difference
Lower Upper
PU (a) - PU (b) -.61333 .70061 -.87494 -.35172 -4.795 29 .000
PEOU (a) - PEOU (b) -.16667 1.25869 -.63667 .30333 -.725 29 .474
FLO (a) - FLO (b) -.33333 .56051 -.54263 -.12403 -3.257 29 .003
IU (a) - IU (b) -.40000 .77013 -.68757 -.11243 -2.845 29 .008
SAT (a) - SAT (b) -.53333 1.15171 -.96339 -.10328 -2.536 29 .017
As a result of analysis,
Usefulness, Flow, Intention of use
are influenced by the condition B
(Automatic speed control
condition) significantly (p < 0.05)
Good !

23
Questionnaire : Result
- Result of paired T-test
* PU : Perceived usefulness / PEOU : Perceived use of ease / FLO : flow / IU : intention to use / SAT : satisfaction
* (a): condition A - Direct Manipulation condition / (b) : condition B - Automatic speed control condition
Paired Samples Test
Paired Differences
t df Sig.
(2-tailed) Mean Std. Deviation
95% Confidence Interval of
the Difference
Lower Upper
PU (a) - PU (b) -.61333 .70061 -.87494 -.35172 -4.795 29 .000
PEOU (a) - PEOU (b) -.16667 1.25869 -.63667 .30333 -.725 29 .474
FLO (a) - FLO (b) -.33333 .56051 -.54263 -.12403 -3.257 29 .003
IU (a) - IU (b) -.40000 .77013 -.68757 -.11243 -2.845 29 .008
SAT (a) - SAT (b) -.53333 1.15171 -.96339 -.10328 -2.536 29 .017
As a result of analysis,
Perceived ease of use and User
satisfaction is not influenced by
the condition B (p < 0.05)
Bad..

24
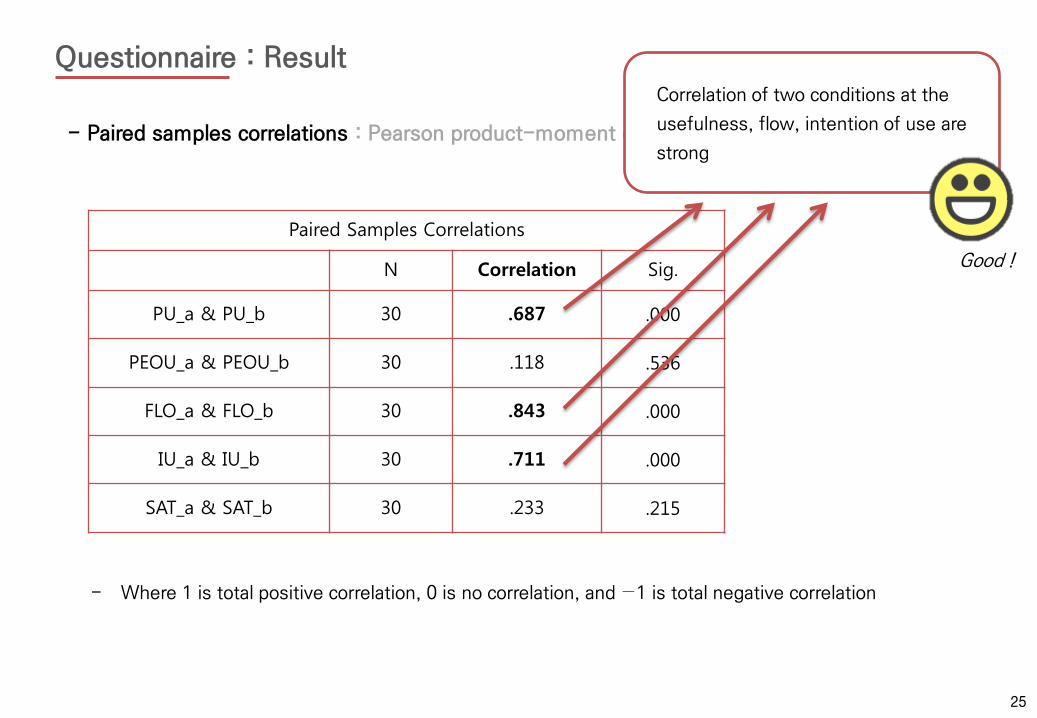
Questionnaire : Result
- Paired samples correlations : Pearson product-moment correlation coefficient
Paired Samples Correlations
N Correlation Sig.
PU_a & PU_b 30 .687 .000
PEOU_a & PEOU_b 30 .118 .536
FLO_a & FLO_b 30 .843 .000
IU_a & IU_b 30 .711 .000
SAT_a & SAT_b 30 .233 .215
- Where 1 is total positive correlation, 0 is no correlation, and −1 is total negative correlation
25
Questionnaire : Result
Paired Samples Correlations
N Correlation Sig.
PU_a & PU_b 30 .687 .000
PEOU_a & PEOU_b 30 .118 .536
FLO_a & FLO_b 30 .843 .000
IU_a & IU_b 30 .711 .000
SAT_a & SAT_b 30 .233 .215
Good !
- Paired samples correlations : Pearson product-moment correlation coefficient
- Where 1 is total positive correlation, 0 is no correlation, and −1 is total negative correlation
Correlation of two conditions at the
usefulness, flow, intention of use are
strong

Interview
- Subjects : 10
- interview type : semi-structured interview
- Measurement : Subject’s opinion about the system(on the Automatic Speed Control of
E-learning video by learner's head gesture)
- Procedure : after subjects finished their questionnaire, only ten of them took an
interview. All interview is recorded after getting agreement. Then, I conducted ‘context
analysis’ during watching the recorded video
26

Interview : Result
1. The Automatic Speed Control of learning video
‚With the regular e-learning system, I needed to click a pause button when I didn’t understand the material. But with the automatic control, I don’t need to do it.‛ – Participant 5 (age 25, male) ‚The automatic speed control of multimedia materials is convenient. Usually, I clicked a rewind button repeatedly. But I didn’t push pause and rewind buttons at all with system of the automatic speed control. It was very effective for studying. I didn’t need to move my fingers. It feels easier.‛ – Participant 18 (age 22, female) ‚I was embarrassed at first, but I got used to the system in an instant. It was helpful to concentrate with the lecture when this system returned to normal speed.‛ – Participant 23 (age 28, female)
▶ Many of interviewee mentioned that the suggested system is more comfortable
and they satisfied about it
27
Interview : Result
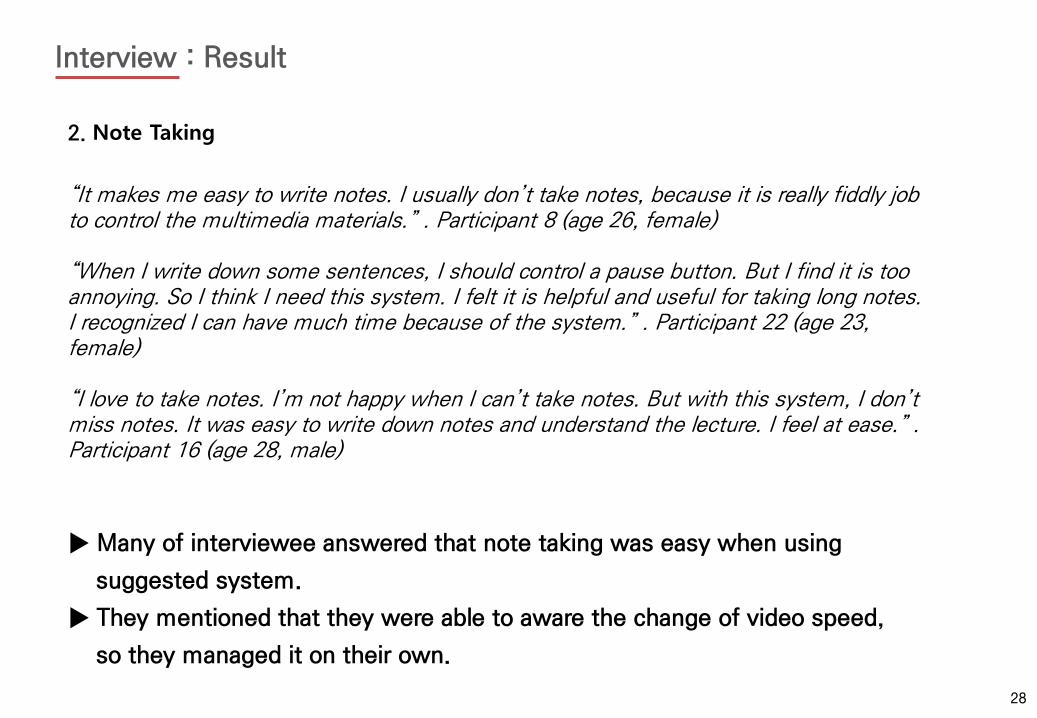
2. Note Taking
‚It makes me easy to write notes. I usually don’t take notes, because it is really fiddly job to control the multimedia materials.‛ . Participant 8 (age 26, female) ‚When I write down some sentences, I should control a pause button. But I find it is too annoying. So I think I need this system. I felt it is helpful and useful for taking long notes. I recognized I can have much time because of the system.‛ . Participant 22 (age 23, female) ‚I love to take notes. I’m not happy when I can’t take notes. But with this system, I don’t miss notes. It was easy to write down notes and understand the lecture. I feel at ease.‛ . Participant 16 (age 28, male)
▶ Many of interviewee answered that note taking was easy when using
suggested system.
▶ They mentioned that they were able to aware the change of video speed,
so they managed it on their own.
28

Prototyping
- After verification by previous research, I made a prototyping of the automatic speed
control of learning video
- Specification : Arduino Pro Min, 6-axis accelerometer gyro sensor (MPU-9150),
Bluetooth module and lithium battery for the second prototype.
The prototype module The prototype image when it wear
29

Prototyping
- Setting state 0, state 1, state 2 and state 3 after analyze the learners behavior pattern
Context State Condition Video Speed
Control x-axis y-axis Duration
Watching learning video State 0 |Θx| < 15 |Θy| < 15 t > 0s Normal.
Hand Writing (Temporary) - |Θx| > 15 - t < 2s Normal
Hand Writing (Continual) State 1 |Θx| > 15 - t > 2s 0,8x
Attention Loss from the Video (Temporary)
- - 15<|Θy|<60 t < 2s Normal
Attention Loss from the Video (Continual)
State 2 - 15<|Θy|<60 t > 2s 0.6x
Extreme Attention Loss (Temporary/Contrinual)
State 3 - |Θy| > 60 t > 1s 0.0x
30

Prototyping
- Based on previous setting I established algorithm of the system
31

Concept design of the system
32

Usage Scenario (concept)
33
Conclusion : Discussion
• This research is certification research of the idea : Automatic speed control of learning video by learner’s head gesture.
• At the experiment 1, I found that the system should reduce the speed of learning video when learner lower their head over 2 seconds.
• At the experiment 2, suggested system significantly reduced the number of direct manipulation(pushing pause and backward button) by learners.
• At the questionnaire, I found that suggested system has a positive effects on usefulness, user flow and intention of use.
34

Conclusion : Limitation
• 1. Most participants are twenties, despite e-learning users are varied age.
• 2. Total number of subjects is too small to certified the system
• 3. In this research, experiments are performed without an actual device.
35

Conclusion : Future Research
Context-based learner centered interaction system
Aware learner’s specific context
Natural user interface in e-learning system
by wireless headset
36

37
• [1] Tech Navio, Global E-learning Market 2013-2016. Infiniti Research Limited (2013)
• [2] M. S. Knowles, Self-directed Learning, Association Press, New York (1975)
• [3] V. Cantoni, M. Cellario, and M. Porta, Perspectives and Challenges in E-learning: Towards Natural Interaction Paradigms, J. Visual Languages & Computing. 15, 5 (2004)
pp.333-345.
• [4] CJ. Lim, NH. Lee, YG. Jeong and SI. Heo, Gesture Based Natural User Interface for E-training, J. the Ergonomics Society of Korea. 31, 4 (2012) pp.577-583.
• [5] JN. Bassili and S. Joordens, Media Player Tool Use, Satisfaction with Online Lectures and Examination Performance, J. Distance Education. 22, 2 (2008)
• [6] F. J. Di-Vesta and G. S. Gray, Listening and Note Taking, J. Educational Psychology. 64, 3 (1973) pp.278-287.
• [7] HS. Kim Chung, The Effects of Online Note-taking Forms and Metacognitive Awareness While Reading Online Text, UMI Dissertations Publishing, Ann Arbor (2006)
• [8] SW. Chou and CH. Liu, Learning Effectiveness in a Web-based Virtual Learning Environment: a Learner Control Perspective, J. Computer Assisted Learning. 21, 1 (2005)
pp.65-76.
• [9] DP. Hong and WT. Woo, Recent Research Trend of Gesture-based User Interfaces, Telecommunications Review. 18, 3 (2008) pp.403-413.
• [10] MJ. Park, JH. Kang, SW. Park and KS. Cho, User Interface Design of E-learning: Focused on the Automatic Speed Control of Multimedia Material by Learner’s Head
Angle. Proceedings of the 3rd Games and Graphics (2014) April 16-18; Jeju, Korea, pp.269-274.
• [11] G. Kearsley and M. Moore, Distance Education: a System View, Wadsworth, California (1996)
• [12] D. C. Hillman, D. J. Willis and C. N. Gunawardena, Learner-interface Interaction in Distance Education: An Extension of Contemporary Models and Strategies for
Practitioners, American J. Distance Education. 8, 2 (1994) pp.30-42.
• [13] M. Williams, Learner Control and Instructional Technologies. Handbook of Research on Educational Communications and Technology, Scholastic, New York (1996)
pp.957-983.
• [14] R. J. Spiro, P. J. Feltovich, M. J. Jacobson and R. L. Coulson, Cognitive Flexibility, Constructivism and Hypertext: Random Access Instruction for Advanced Knowledge
Acquisition in Ill-structured Domains, Educational Technology. 315 (1992) pp.57-76.
• [15] W. D. Milheim and B. L. Martin, Theoretical Bases for the Use of Learner Control: Three Different Perspectives. J. Computer-Based Instruction. 18, 3 (1991) pp.99-105.
• [16] R. P. Niemiec, C. Sikorski and H. J. Walberg, Learner-control Effects: A Review of Reviews and a Meta-Analysis, J. Educational Computing Research. 15, 2 (1996)
pp.157-174.
• [17] D. Wigdor and D. Wixon, Brave NUI World: Designing Natural User Interfaces for Touch and Gesture. Elsevier, USA (2011)
• [18] E. Vural, M. Cetin, A. Ercil, G. Littlewort, M. Bartlett and J. Movellan, Drowsy Driver Detection through Facial Movement Analysis. Proceedings of the 12th International
Conference on Human–Computer Interaction (2007) July 22-27; Beijing, China, pp.6-18.
• [19] E. LoPresti, D. M. Brienza, J. Angelo, L. Gilbertson and J. Sakai, Neck Range of Motion and Use of Computer Head Controls, Proceedings of the 4th International ACM
Conference on Assistive Technologies (2000) November 13-14; Virginia, USA, pp.121-128.
• [20] F. Girbacia and S. Butnariu, Development of a Natural User Interface for Intuitive Presentations in Educational Process. Proceedings of the E Learning and Software for
Education (2012) April 26-27; Bucharest, Romania, pp.74-79.
Reference

38
Thank you !!
Minjae Park