a n and a catch 1950 to 2010 · fishing activities in the nigerian marine fisheries sector may be...
TRANSCRIPT

Nigeria - Etim et al. 65
An overview of the nigeriAn mArine fisheries And A re-evAluAtion of their cAtch from 1950 to 20101
Lawrence Etima, Dyhia Belhabibb and Daniel Paulyb
a Department of Fisheries and Aquatic Environmental Management, University of Uyo, Akwa Ibom State, Nigeriab Sea Around Us, Fisheries Centre, University of British Columbia,
2202 Main Mall, Vancouver, BC, V6T 1Z4, Canada
lawrenceetim @uniuyo.edu.ng ; d.belhabib @fisheries.ubc.ca ; d.pauly @fisheries.ubc.ca
AbstrAct
Nigeria, with more than 250 ethnic groups and a current population of about 170 million inhabitants is the most populous African country. With a crude oil production of 2.5 million barrels per day, Nigeria also ranks as the largest producer of crude oil in Africa and the sixth largest producer in the world. The fisheries sector, which is also important, has grown considerably since the country gained independence from the United Kingdom in 1960. However, government fisheries departments lack officers responsible for field data collection; consequently, catch data are often exaggerated or un-reported. Using standard procedures, we re-estimated (i.e., reconstructed) the Nigerian marine fisheries catches from 1950 to 2010 to account for likely under-reporting and non-reporting of the catch of fish and shrimps trawlers, artisanal and subsistence fishers, foreign legal and illegal fleets and discards. This led to catches of about 34,000 t in 1950, 540,000 t in 2005 and 490,000 t in 2010. Reconstructed domestic catches were about twice the data supplied to the FAO. Taxonomically, sardinellas (Sardinella spp.) represented the largest contribution to domestic catches, followed by bonga shad (Ethmalosa fimbriata) and croakers (Pseudotolithus spp.). Under-reporting is becoming more pronounced over time, thus debunking the myth of massive over-reporting by Nigeria. Increasing illegal and unreported catches by foreign vessels constitute a growing threat to the sustainability of the stocks. In all, while catches are under-reported, the marine fisheries of Nigeria are overexploited.
introduction
Fishing activities in the Nigerian marine fisheries sector may be classified into coastal small-scale (artisanal and subsistence), inshore industrial and offshore (distant water) industrial fisheries. The coastal small-scale fishery operates within 5 nautical miles from the coastline and also in estuaries, creeks and lagoons. To reduce conflicts between the industrial and the artisanal sectors, the Nigeria Sea Fisheries (Fishing) Regulation of 1972 assigns exclusive right to the artisanal canoe fisheries to exploit this inshore area. The species exploited include pelagic and demersal fishes such as clupeids, croakers, soles, threadfins, catfishes, sharks, penaeid shrimps, crabs, etc. The artisanal fishery is labour intensive and employs small, traditional and sometimes un-motorized craft and hand-operated gears although planked and dug-out canoes (3 to 13 m long) powered by outboard engines ranging from 15 to 25 hp are increasingly common. Generally, this fishery, which has low capital outlays, employs simple technology and its catches are sold mostly in the local markets. Set gillnets and cast nets are the major fishing gears. The fishery is open access and unregulated (Panayotou 1982).
The inshore industrial fishery operates from about 5 nautical miles off the coast to the edge of the continental shelf (Figure 1). This industry employs bottom or mid-water trawlers to catch and land a variety of species including croakers (Pseudotolithus spp.), soles (Cynoglossus spp.), groupers (Epinephelus spp.), snappers (Lutjanus spp.), bigeyes (Brachydeuterus spp.), threadfins (Polydactilus spp.), baraccudas (Sphyraena spp.), jacks (Caranx spp.), horse mackerels (Trachurus spp.) and cutlass fishes (Trichiurus spp.). The industrial fisheries are capital intensive and utilize large fishing vessels with in-board engines 1 Cite as: Etim, L., Belhabib, D. and Pauly, D. (2015) An overview of the Nigerian marine fisheries and a re-evaluation of its catch data for the years 1950-2010. pp. 66-76. In: Belhabib, D. and Pauly, D. (eds). Fisheries catch reconstructions: West Africa, Part II. Fisheries Centre Research Reports vol.23(3). Fisheries Centre, University of British Columbia [ISSN 1198-6727].
Figure 1. Nigeria’s Exclusive Economic Zone (EEZ; 217,000 km2) and shelf area (to 200 m depth).
66
and mechanically operated winches (Ekpo and Etim 1989). They employ small- to medium-sized trawlers ranging in size from 9 to 25 m Length Over All (LOA). About 40 trawling companies, with an average fleet size of four, operate in Nigeria and most are members of the Nigerian Trawlers Owners’ Association. Companies with fleet size of more than four are likely to be in partnership with foreign investors (Falaye 2008). Ganapathiraju and Pitcher (2006) noted that there are 36 fishing companies operated in the country, out of which 14 were foreign-owned.
According to FAO (2000), Nigerian flag-registered fishing vessels are allowed to operate in the waters of other African countries under the terms of the bilateral fishing access agreements between Nigeria and the countries in question, or under privately arranged agreements, which must be seen by the Nigerian Federal Department of Fisheries (FDF) as “just and equitable”. All the fish catch must be landed at a Nigerian port. The fishing licence issued to such Nigerian-registered flag vessels is classified as Distant-Water Fishing Licence (Category A). Category B license is for vessels which are foreign flag-registered, but are chartered by Nigerian companies or individuals for fishing in the waters of foreign countries. Category C is Distant-Water Fishing Licences usually issued to reefer vessels bringing in frozen fish to Nigeria. Such vessels may be Nigerian or foreign-flag registered.
Falaye (2008) stated that FDF makes about 250,000 US dollars annually from the registration of industrial trawlers, but that the sector contributes less than 5% to total marine fish catches in the country. A salient aspect of this subsector is that parts of its catch, notably shrimps, are exported, which brings in about 20 million US dollars annually to the Nigerian economy (Falaye 2008).
Offshore marine fisheries exploit resources between the continental shelf area and the 200-mile EEZ. Tuna and billfishes are the main target species. The vessels are generally more than 25 m LOA and greater than 150 gross registered tonnage (GRT). Vessels are all wholly owned by Nigerians. The inability of Nigeria to attract foreign investors may be due its non-membership in the International Commission for the Conservation of Atlantic Tunas (ICCAT).
The history of systematic, country-wide fisheries data collection in Nigeria is rather short, as it started in the early 1970s (Ajayi 1991; Etim 1992). Etim (1992) pointed out that the accuracy and authenticity of data collated by FDF is usually doubted by independent authors (e.g., Ssentongo et al. 1983; Everett 1986; Ssentongo et al. 1986; Anon. 1988). Much of the inaccuracies and deficiencies in the FDF’s data are consequences of the inherent bureaucratic problems in government ministries, the fisheries sector and the difficult politics of the country. The various fisheries departments are grossly under-staffed with field officers who are not replaced by new employees upon their retirements. Thus, fewer field officers continue to collect data from an increasing number of landing sites and beaches.
Without adequate funding, they are unable to cover all the landing sites assigned to them and they end up guessing part, or maybe even all, of the data they submit. Indeed, scarcity of operating funds is considered by the Directors of Fisheries to be their greatest problem. The decline in government funding, as the only source of funds, to ministries implies that it is politically more expedient for government to direct scarce funds to community development projects and poverty alleviation programmes than to fix fisheries data collection issues whose usefulness is not immediately visible. Politicians are re-elected based on the “development projects” they can take credit for, and not on the quality of statistical data their ministries compile. Without funds, it is difficult for field officers to reach the numerous fishers scattered in remote villages.
There are inherent competitive tendencies among the states as they try to surpass or even outdo each other as the best producer of one commodity or the other. This explains the suspected or alleged tendencies by state ministries to inflate their production figures to the FDF. According to the Directors of Fisheries of several states, the final data published by FDF are often higher than the ones they submitted. With no vessels, the monitoring and surveillance unit of the FDF suffers from a total lack of vessel monitoring opportunities; the unit is handicapped as it is expected to depend on other agencies (e.g., the Nigeria Navy) for their monitoring and surveillance activities.
Thus, it is clear that fisheries data collection in Nigeria, as in many other developing countries, is fraught with difficulties that make such data deficient, biased or incomplete (Etim 1992; Zeller et al. 2007; Zeller and Pauly 2007; Jacquet et al. 2010). This is compounded by the multi-gear nature of the fisheries, which makes computation and inter-comparison of some indices (e.g., CPUE) across a range of gears difficult.
A ‘catch reconstruction’ approach for addressing the anomalies in such data was developed (Zeller et al. 2007) and successfully implemented for many countries, e.g., Mozambique and Tanzania (Jacquet et al. 2010), Colombia (Wielgus et al. 2010) and the US flag-associated islands in the Pacific (Zeller et al. 2007). Within this context and in the light of the aforementioned problems, we reconstructed the marine fisheries catches of Nigeria for the years 1950 to 2010, to obtain time series likely to be more complete, comprehensive and hopefully less biased than the extant data.
Nigeria - Etim et al. 67
methods
The catch reconstruction procedure used in this work entails six basic steps (Zeller et al. 2007):
i) Identifying of and sourcing for existing reported catch time series, catch per effort, number of fishers;
ii) Identifying of sectors, time periods, species, gears, etc., not covered by (i) above; that is missing catch data via extensive literature searches;
iii) Search for available alternative information sources to supply the missing catch data in (ii) through extensive literature searches (peer reviewed publications, gray literature and technical reports) and consultations. The first author consulted in-country experts in academia and federal and state government officials, notably, the Directors of Fisheries in all the maritime states, who were either visited or contacted;
iv) Developing of data anchor points in time for missing data items,
v) Interpolation of time periods between data anchor points for total catch, and
vi) Estimation of final total catch time series estimates for total catch, combining reported catches in (i) with interpolated, missing data series in (v) above.
FAO and other data
The Nigerian marine fish catches between 1950 and 2010, as published by FAO on behalf of Nigeria, was extracted from FAO FishstatJ after filtering out unwanted information related to turtles, marine mammals, etc. We carried out extensive literature searches including peer reviewed publications, technical reports and other grey literature2.
Reconstructed total catch
The catch per unit of effort (CPUE) and the active fishing days were extracted from the relevant literature or obtained from in-country experts. The reconstructed catch data have the following components: a) fish trawl catches, b) shrimp trawl catches, c) artisanal shrimp catches, d) artisanal fish catches, e) shrimp trawl discards, f) subsistence catch by fishers and their families, and g) illegal and unreported foreign fish catches and illegal and unreported foreign shrimp catches. These are addressed individually.
a) Fish trawl catches
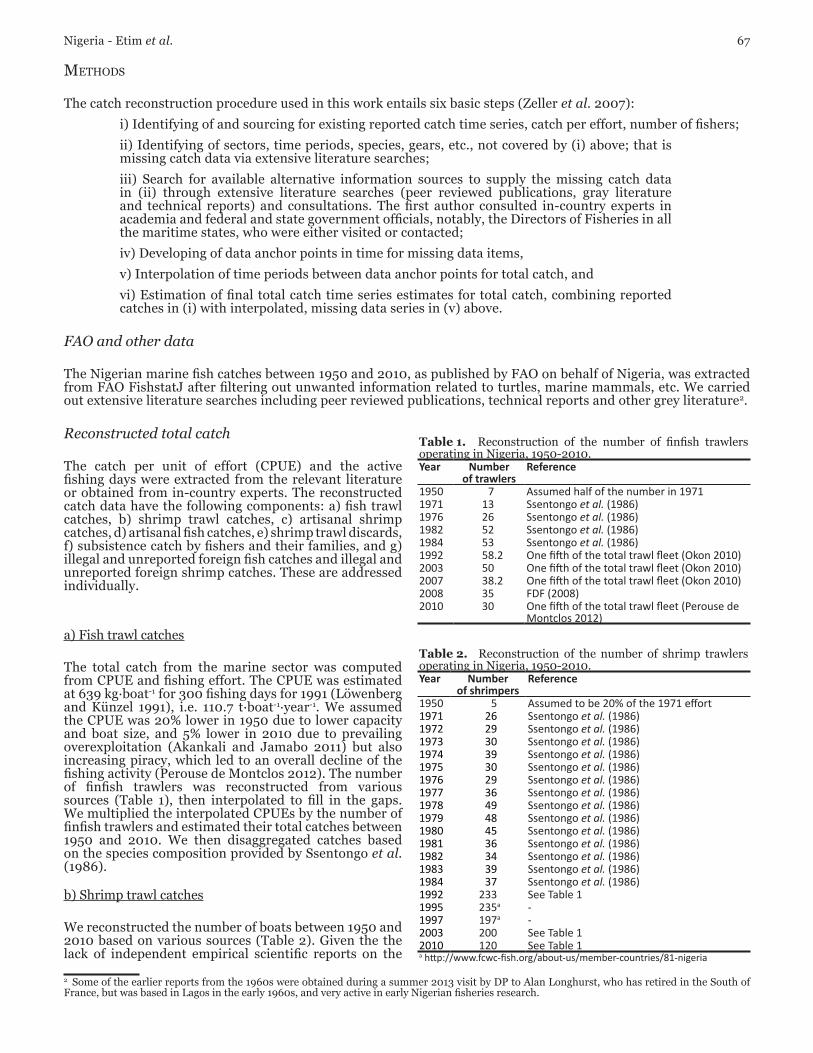
The total catch from the marine sector was computed from CPUE and fishing effort. The CPUE was estimated at 639 kg∙boat-1 for 300 fishing days for 1991 (Löwenberg and Künzel 1991), i.e. 110.7 t·boat-1·year-1. We assumed the CPUE was 20% lower in 1950 due to lower capacity and boat size, and 5% lower in 2010 due to prevailing overexploitation (Akankali and Jamabo 2011) but also increasing piracy, which led to an overall decline of the fishing activity (Perouse de Montclos 2012). The number of finfish trawlers was reconstructed from various sources (Table 1), then interpolated to fill in the gaps. We multiplied the interpolated CPUEs by the number of finfish trawlers and estimated their total catches between 1950 and 2010. We then disaggregated catches based on the species composition provided by Ssentongo et al. (1986).
b) Shrimp trawl catches
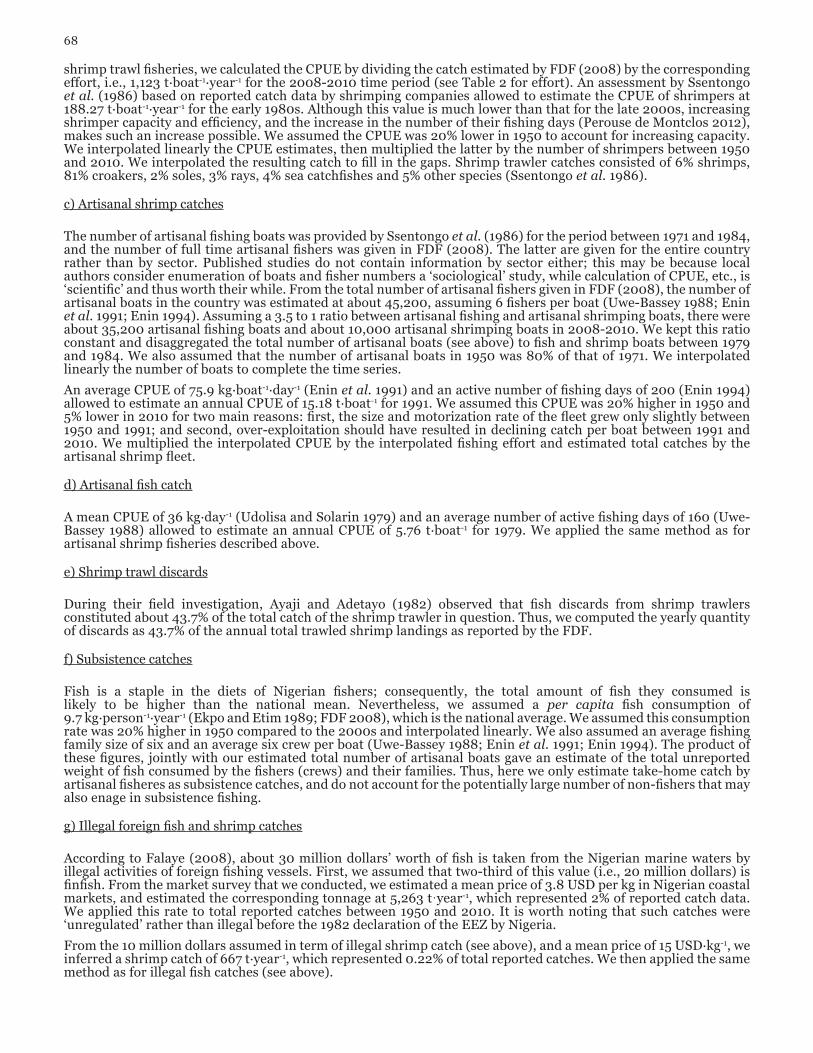
We reconstructed the number of boats between 1950 and 2010 based on various sources (Table 2). Given the the lack of independent empirical scientific reports on the
2 Some of the earlier reports from the 1960s were obtained during a summer 2013 visit by DP to Alan Longhurst, who has retired in the South of France, but was based in Lagos in the early 1960s, and very active in early Nigerian fisheries research.
Table 1. Reconstruction of the number of finfish trawlers operating in Nigeria, 1950-2010.Year Number
of trawlersReference
1950 7 Assumed half of the number in 19711971 13 Ssentongo et al. (1986)1976 26 Ssentongo et al. (1986)1982 52 Ssentongo et al. (1986)1984 53 Ssentongo et al. (1986)1992 58.2 One fifth of the total trawl fleet (Okon 2010) 2003 50 One fifth of the total trawl fleet (Okon 2010)2007 38.2 One fifth of the total trawl fleet (Okon 2010)2008 35 FDF (2008)2010 30 One fifth of the total trawl fleet (Perouse de
Montclos 2012)
Table 2. Reconstruction of the number of shrimp trawlers operating in Nigeria, 1950-2010.Year Number
of shrimpersReference
1950 5 Assumed to be 20% of the 1971 effort1971 26 Ssentongo et al. (1986) 1972 29 Ssentongo et al. (1986)1973 30 Ssentongo et al. (1986)1974 39 Ssentongo et al. (1986)1975 30 Ssentongo et al. (1986)1976 29 Ssentongo et al. (1986)1977 36 Ssentongo et al. (1986)1978 49 Ssentongo et al. (1986)1979 48 Ssentongo et al. (1986)1980 45 Ssentongo et al. (1986)1981 36 Ssentongo et al. (1986)1982 34 Ssentongo et al. (1986)1983 39 Ssentongo et al. (1986)1984 37 Ssentongo et al. (1986)1992 233 See Table 11995 235a -1997 197a -2003 200 See Table 12010 120 See Table 1a http://www.fcwc-fish.org/about-us/member-countries/81-nigeria
68
shrimp trawl fisheries, we calculated the CPUE by dividing the catch estimated by FDF (2008) by the corresponding effort, i.e., 1,123 t·boat-1·year-1 for the 2008-2010 time period (see Table 2 for effort). An assessment by Ssentongo et al. (1986) based on reported catch data by shrimping companies allowed to estimate the CPUE of shrimpers at 188.27 t·boat-1·year-1 for the early 1980s. Although this value is much lower than that for the late 2000s, increasing shrimper capacity and efficiency, and the increase in the number of their fishing days (Perouse de Montclos 2012), makes such an increase possible. We assumed the CPUE was 20% lower in 1950 to account for increasing capacity. We interpolated linearly the CPUE estimates, then multiplied the latter by the number of shrimpers between 1950 and 2010. We interpolated the resulting catch to fill in the gaps. Shrimp trawler catches consisted of 6% shrimps, 81% croakers, 2% soles, 3% rays, 4% sea catchfishes and 5% other species (Ssentongo et al. 1986).
c) Artisanal shrimp catches
The number of artisanal fishing boats was provided by Ssentongo et al. (1986) for the period between 1971 and 1984, and the number of full time artisanal fishers was given in FDF (2008). The latter are given for the entire country rather than by sector. Published studies do not contain information by sector either; this may be because local authors consider enumeration of boats and fisher numbers a ‘sociological’ study, while calculation of CPUE, etc., is ‘scientific’ and thus worth their while. From the total number of artisanal fishers given in FDF (2008), the number of artisanal boats in the country was estimated at about 45,200, assuming 6 fishers per boat (Uwe-Bassey 1988; Enin et al. 1991; Enin 1994). Assuming a 3.5 to 1 ratio between artisanal fishing and artisanal shrimping boats, there were about 35,200 artisanal fishing boats and about 10,000 artisanal shrimping boats in 2008-2010. We kept this ratio constant and disaggregated the total number of artisanal boats (see above) to fish and shrimp boats between 1979 and 1984. We also assumed that the number of artisanal boats in 1950 was 80% of that of 1971. We interpolated linearly the number of boats to complete the time series.
An average CPUE of 75.9 kg∙boat-1∙day-1 (Enin et al. 1991) and an active number of fishing days of 200 (Enin 1994) allowed to estimate an annual CPUE of 15.18 t·boat-1 for 1991. We assumed this CPUE was 20% higher in 1950 and 5% lower in 2010 for two main reasons: first, the size and motorization rate of the fleet grew only slightly between 1950 and 1991; and second, over-exploitation should have resulted in declining catch per boat between 1991 and 2010. We multiplied the interpolated CPUE by the interpolated fishing effort and estimated total catches by the artisanal shrimp fleet.
d) Artisanal fish catch
A mean CPUE of 36 kg∙day-1 (Udolisa and Solarin 1979) and an average number of active fishing days of 160 (Uwe-Bassey 1988) allowed to estimate an annual CPUE of 5.76 t∙boat-1 for 1979. We applied the same method as for artisanal shrimp fisheries described above.
e) Shrimp trawl discards
During their field investigation, Ayaji and Adetayo (1982) observed that fish discards from shrimp trawlers constituted about 43.7% of the total catch of the shrimp trawler in question. Thus, we computed the yearly quantity of discards as 43.7% of the annual total trawled shrimp landings as reported by the FDF.
f) Subsistence catches
Fish is a staple in the diets of Nigerian fishers; consequently, the total amount of fish they consumed is likely to be higher than the national mean. Nevertheless, we assumed a per capita fish consumption of 9.7 kg∙person-1∙year-1 (Ekpo and Etim 1989; FDF 2008), which is the national average. We assumed this consumption rate was 20% higher in 1950 compared to the 2000s and interpolated linearly. We also assumed an average fishing family size of six and an average six crew per boat (Uwe-Bassey 1988; Enin et al. 1991; Enin 1994). The product of these figures, jointly with our estimated total number of artisanal boats gave an estimate of the total unreported weight of fish consumed by the fishers (crews) and their families. Thus, here we only estimate take-home catch by artisanal fisheres as subsistence catches, and do not account for the potentially large number of non-fishers that may also enage in subsistence fishing.
g) Illegal foreign fish and shrimp catches
According to Falaye (2008), about 30 million dollars’ worth of fish is taken from the Nigerian marine waters by illegal activities of foreign fishing vessels. First, we assumed that two-third of this value (i.e., 20 million dollars) is finfish. From the market survey that we conducted, we estimated a mean price of 3.8 USD per kg in Nigerian coastal markets, and estimated the corresponding tonnage at 5,263 t·year-1, which represented 2% of reported catch data. We applied this rate to total reported catches between 1950 and 2010. It is worth noting that such catches were ‘unregulated’ rather than illegal before the 1982 declaration of the EEZ by Nigeria.
From the 10 million dollars assumed in term of illegal shrimp catch (see above), and a mean price of 15 USD∙kg-1, we inferred a shrimp catch of 667 t∙year-1, which represented 0.22% of total reported catches. We then applied the same method as for illegal fish catches (see above).

Nigeria - Etim et al. 69
results
Industrial catches
Industrial catches increased from around 1,800 t∙year-1 in the early 1950s to a peak of 200,000 t in 2003 (Figure 2). Industrial catches decreased after that to 141,000 t in 2010 (Figure 2) due to over-exploitation and increasing piracy, which led to the decrease in the number of industrial vessels. The sharp rise, which happened in 1980, is attributed to the creation of the Nigerian Shrimping Company and the expansion of the Nigerian economy as a consequence of the increase in crude oil prices.
Artisanal catches
Artisanal catches averaged around 32,000 t∙year-1 in the early 1950s, and increased gradually to 36,000 t in 1970 (Figure 3). Artisanal catches increased rapidly in the early 1970s, which coincided with the onset of the rapid expansion in Nigerian economy as a consequence of the jump in crude oil prices. Artisanal catches increased with the increase in the number of boats and reached a plateau of around 340,000 t∙year-1 in the mid-2000s (Figure 3).
Subsistence catches
Subsistence catches followed the same pattern as artisanal catches (Figure 4). Subsistence catches averaged around 1,200 t∙year-1 in the early 1950s, and gradually increased to around 2,500 t in 1974 (Figure 4). Thereafer, they increased to plateau at of over 13,200 t∙year-1 in the mid 2000s (Figure 4).
Discards
Discards increased from around 232 t∙year-1 in the early 1950s to a first peak of 2,200 t in 1990, declined to 1,400 t in 1993 before increasing again to a plateau of 3,100 t in 2001 (Figure 5).
Illegal foreign catches
Illegal catches (considered ‘unregulated’ before the declaration of the Nigerian EEZ in 1982) increased from 400 t in 1950 to a pleateau of around 3,000 t∙year-1 between the 1970s and the mid-1980s. Illegal catches increased to a peak of 6,000 t∙year-1 in the late 1990s, near which they remained (Figure 6).
Figure 2. Reconstructed industrial catches from the EEZ of Nigeria, 1950-2010.
Figure 3. Total reconstructed artisanal catches from the EEZ of Nigeria, 1950-2010.
Figure 4. Total reconstructed subsistence catches from the EEZ of Nigeria, 1950-2010.
70
Total reconstructed catches
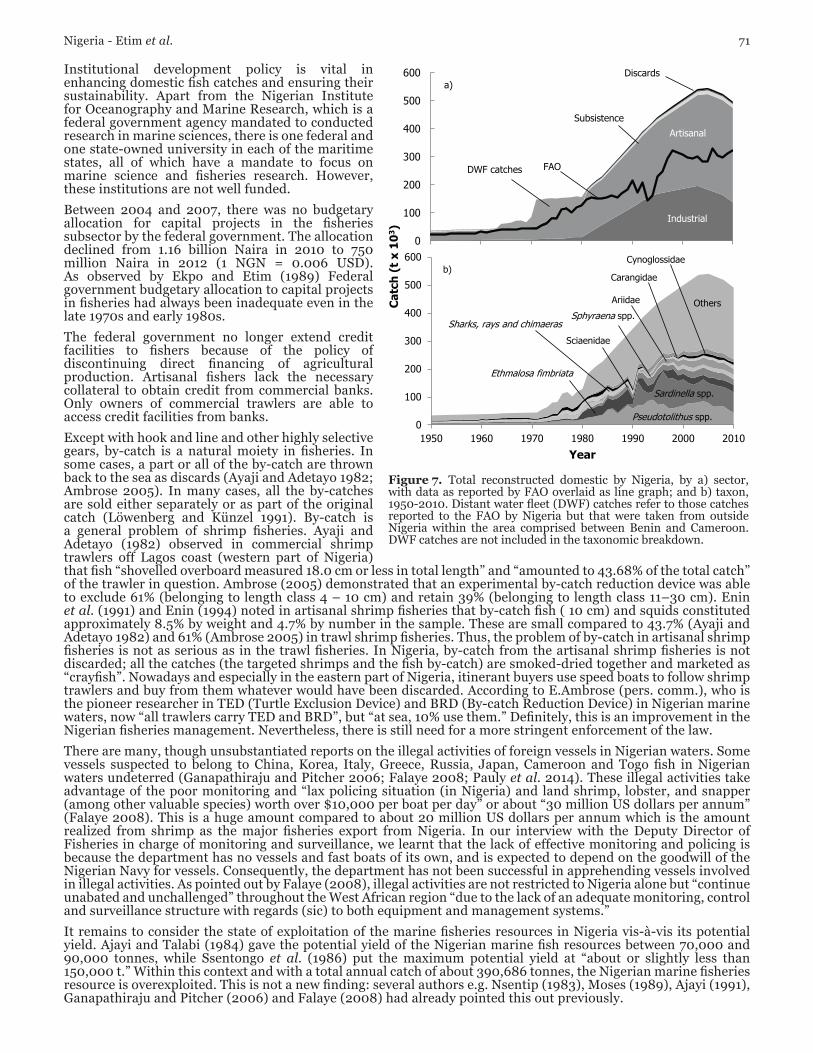
Total reconstructed domestic catches were estimated at around 34,000 t in 1950 compared to 22,000 t reported to the FAO on behalf of Nigeria (Figure 7a). Catches increased rapidly in the early 1970s to around 150,000 t∙year-1 due to (a) the expansion of industrial fisheries, notably those that targeted shrimp and (b) the distant water fishing fleet. Catches increased to a peak of 540,000 t in 2005 compared to 285,000 t reported to the FAO before declining to 490,000 t in 2010. Overall total reconstructed catches were twice as high as the data supplied to the FAO; however under-reporting was higher in the late time periods, which might be due to increasing piracy.
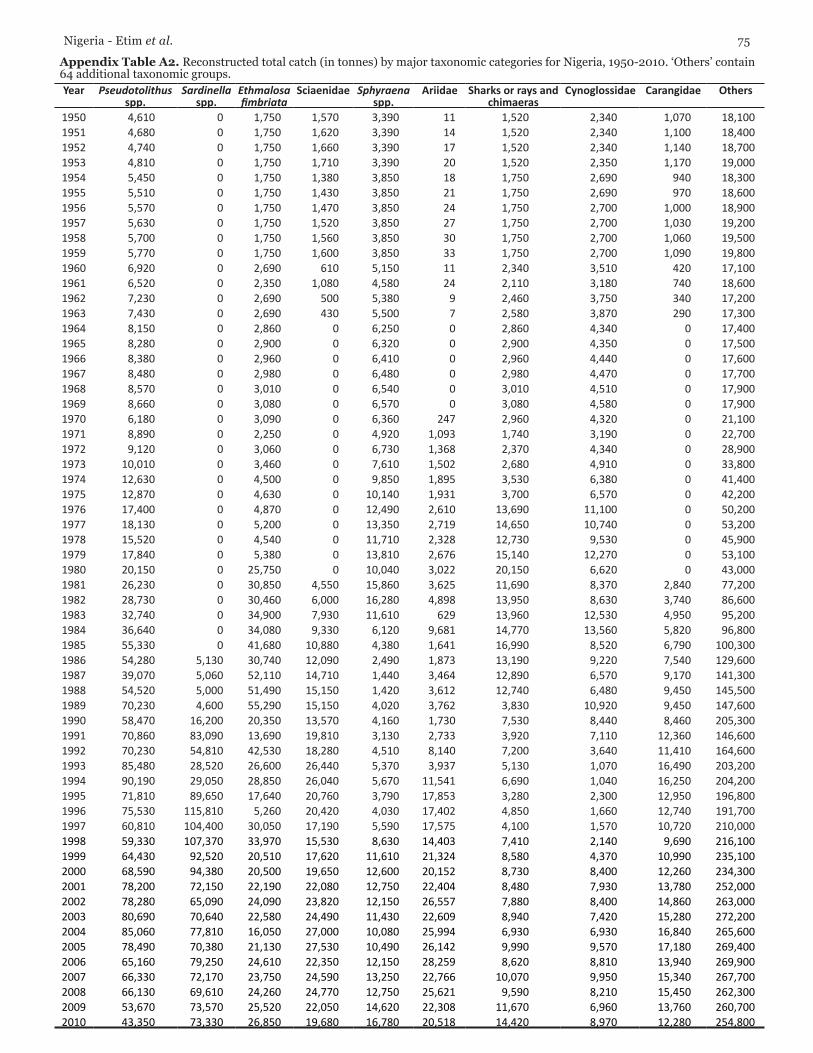
Taxonomically, around 70 taxa are caught within the Nigeria waters; however, catches include mainly croakers (15.4%), sardinellas (11.2%), Bonga shad (6.9%) and scianids (4.1%) (Figure 7b).
discussion
A large part of the catches from the Nigerian marine waters is either poorly accounted for or not accounted for at all. For example, there are at least four categories of fisheries data which are not mentioned at all in the FDF and FAO official statistics, which resulted in our reconstructed catch being twice as high as the catch data supplied to the FAO.
Three historical events in Nigeria translated in a most direct way into downward trends in domestic fish production in the country. These are activities of militants and pirates in the Niger Delta, government economic reform programmes (e.g., the Structural Adjustment Programme, or SAP) and the Nigerian Civil War (1967-1970).
The destructive and violent activities of the pirates in the Niger Delta region (eastern part of Nigeria) exerted a negative impact on fish production in the country. Over a period spanning many years, these militants had consistently and persistently carried out attacks on oil installations mostly in the Niger Delta area with the aim of ensuring that a greater part of Nigeria’s petroleum oil revenue goes to the impoverished people of the Niger Delta region from whose lands the oil was taken. The militants engaged in activities like sabotage, theft, property destructions, arson, bombings, guerrilla warfare and kidnapping. The decrease in fish landings, caused by the activities of the militants in the Niger Delta, reached what the FDF (2008) described as an “alarming situation” which resulted in the decline of the number of industrial vessels operating in Nigeria (Perouse de Montclos 2012).
Another event was the implementation of the IMF/World Bank-supported SAP in July 1986. The main components of the SAP entailed the devaluation of the local currency, removal of subsidies on petroleum, liberalization of trade and elimination of price controls (e.g., by scrapping commodity marketing boards), deregulation of bank interest rates and the privatization of government enterprises. The negative impacts of these activities precipitated an uncontrolled inflation, especially as a consequence of currency devaluation. The inflationary rise in cost of fishing inputs (gears, crafts, etc.) together with the increase in pump price of petrol due to subsidy removal had meant that most fishers could not buy new crafts and gears. They also could not service the old ones, nor replace their worn out gears and vessels. This resulted in the decrease in distant water fishing activities by Nigeria.
According to Ekpo and Etim (1989), Nigeria’s government fisheries policy objectives could be summarized as follows: (a) increasing domestic fish production, (b) earning foreign exchange through fish exports, (c) developing fishery-based industries, (d) rational management and conservation of the fisheries resources, (e) encouraging local manufacturing of fish products, (f) providing employment, (g) increasing income of local fishers. Measures put in place by government for the realization of these objectives can be grouped into (i) institutional development policy, (ii) direct production policy, (iii) credit policy, (iv) research policy, (v) infrastructure policy, (vi) input provision policy, and (vii) allocation policy. The Federal Government of Nigeria has difficulties implementing these policies, which is not surprising, as several of them are mutually incompatible.
Figure 5. Total reconstructed shrimp trawl discards from the EEZ of Nigeria, 1950-2010.
Figure 6. Total reconstructed illegal catches from the EEZ of Nigeria, 1950-2010.
Nigeria - Etim et al. 71
Institutional development policy is vital in enhancing domestic fish catches and ensuring their sustainability. Apart from the Nigerian Institute for Oceanography and Marine Research, which is a federal government agency mandated to conducted research in marine sciences, there is one federal and one state-owned university in each of the maritime states, all of which have a mandate to focus on marine science and fisheries research. However, these institutions are not well funded.
Between 2004 and 2007, there was no budgetary allocation for capital projects in the fisheries subsector by the federal government. The allocation declined from 1.16 billion Naira in 2010 to 750 million Naira in 2012 (1 NGN = 0.006 USD). As observed by Ekpo and Etim (1989) Federal government budgetary allocation to capital projects in fisheries had always been inadequate even in the late 1970s and early 1980s.
The federal government no longer extend credit facilities to fishers because of the policy of discontinuing direct financing of agricultural production. Artisanal fishers lack the necessary collateral to obtain credit from commercial banks. Only owners of commercial trawlers are able to access credit facilities from banks.
Except with hook and line and other highly selective gears, by-catch is a natural moiety in fisheries. In some cases, a part or all of the by-catch are thrown back to the sea as discards (Ayaji and Adetayo 1982; Ambrose 2005). In many cases, all the by-catches are sold either separately or as part of the original catch (Löwenberg and Künzel 1991). By-catch is a general problem of shrimp fisheries. Ayaji and Adetayo (1982) observed in commercial shrimp trawlers off Lagos coast (western part of Nigeria) that fish “shovelled overboard measured 18.0 cm or less in total length” and “amounted to 43.68% of the total catch” of the trawler in question. Ambrose (2005) demonstrated that an experimental by-catch reduction device was able to exclude 61% (belonging to length class 4 – 10 cm) and retain 39% (belonging to length class 11–30 cm). Enin et al. (1991) and Enin (1994) noted in artisanal shrimp fisheries that by-catch fish ( 10 cm) and squids constituted approximately 8.5% by weight and 4.7% by number in the sample. These are small compared to 43.7% (Ayaji and Adetayo 1982) and 61% (Ambrose 2005) in trawl shrimp fisheries. Thus, the problem of by-catch in artisanal shrimp fisheries is not as serious as in the trawl fisheries. In Nigeria, by-catch from the artisanal shrimp fisheries is not discarded; all the catches (the targeted shrimps and the fish by-catch) are smoked-dried together and marketed as “crayfish”. Nowadays and especially in the eastern part of Nigeria, itinerant buyers use speed boats to follow shrimp trawlers and buy from them whatever would have been discarded. According to E.Ambrose (pers. comm.), who is the pioneer researcher in TED (Turtle Exclusion Device) and BRD (By-catch Reduction Device) in Nigerian marine waters, now “all trawlers carry TED and BRD”, but “at sea, 10% use them.” Definitely, this is an improvement in the Nigerian fisheries management. Nevertheless, there is still need for a more stringent enforcement of the law.
There are many, though unsubstantiated reports on the illegal activities of foreign vessels in Nigerian waters. Some vessels suspected to belong to China, Korea, Italy, Greece, Russia, Japan, Cameroon and Togo fish in Nigerian waters undeterred (Ganapathiraju and Pitcher 2006; Falaye 2008; Pauly et al. 2014). These illegal activities take advantage of the poor monitoring and “lax policing situation (in Nigeria) and land shrimp, lobster, and snapper (among other valuable species) worth over $10,000 per boat per day” or about “30 million US dollars per annum” (Falaye 2008). This is a huge amount compared to about 20 million US dollars per annum which is the amount realized from shrimp as the major fisheries export from Nigeria. In our interview with the Deputy Director of Fisheries in charge of monitoring and surveillance, we learnt that the lack of effective monitoring and policing is because the department has no vessels and fast boats of its own, and is expected to depend on the goodwill of the Nigerian Navy for vessels. Consequently, the department has not been successful in apprehending vessels involved in illegal activities. As pointed out by Falaye (2008), illegal activities are not restricted to Nigeria alone but “continue unabated and unchallenged” throughout the West African region “due to the lack of an adequate monitoring, control and surveillance structure with regards (sic) to both equipment and management systems.”
It remains to consider the state of exploitation of the marine fisheries resources in Nigeria vis-à-vis its potential yield. Ajayi and Talabi (1984) gave the potential yield of the Nigerian marine fish resources between 70,000 and 90,000 tonnes, while Ssentongo et al. (1986) put the maximum potential yield at “about or slightly less than 150,000 t.” Within this context and with a total annual catch of about 390,686 tonnes, the Nigerian marine fisheries resource is overexploited. This is not a new finding: several authors e.g. Nsentip (1983), Moses (1989), Ajayi (1991), Ganapathiraju and Pitcher (2006) and Falaye (2008) had already pointed this out previously.
0
100
200
300
400
500
600
Cat
ch (
t x
103
)
Industrial
FAO
Subsistence
Artisanal
Discards
DWF catches
a)
0
100
200
300
400
500
600
1950 1960 1970 1980 1990 2000 2010
Cat
ch (
t x
103 )
Year
Pseudotolithus spp.
Cynoglossidae
Carangidae
Ariidae
spp.
Sciaenidae
Ethmalosa fimbriata
Sardinella spp.
Others
Sharks, rays and chimaeras
b)
Sphyraena
Figure 7. Total reconstructed domestic by Nigeria, by a) sector, with data as reported by FAO overlaid as line graph; and b) taxon, 1950-2010. Distant water fleet (DWF) catches refer to those catches reported to the FAO by Nigeria but that were taken from outside Nigeria within the area comprised between Benin and Cameroon. DWF catches are not included in the taxonomic breakdown.

72
The challenges this posed are acknowledged by the new Director of the Nigerian Institute for Oceanograpy and Marine Research (NIOMR) Dr. Gbola Akande, who wrote (pers. comm to D.P.) that NIOMR “is also very much into [food security] research nowadays [which is understandable] when you consider the need for the Government to feed a population close to 170 million people. Fish food security is our priority especially in the artisanal fisheries and aquaculture. The industrial fisheries of course are also in the reckoning, but the first two contributes far more to our national fish production than the industrial fisheries. The justification for procuring the new vessel, RV Bayagbona is essentially to tap into the resources of the deep waters in our 200 mile Exclusive Economic Zone. Our inshore coastal water is currently under pressures with well over 150 fishing/shrimping trawlers struggling to catch from an environment already depleted due to overfishing over the years.”
Acknowlegements
The work of DB and DP was supported by the Sea Around Us, a collaboration supported by The Pew Charitable Trusts and the Paul G. Allen Family Foundation.
references
Ajayi TO (1991) Highlights of achievements in the last 30 years by the Nigerian Institute for Oceanography and Marine Research and its parent research division of the Federal Department of Fisheries, Lagos, 1960-1990. Nigerian Institute for Oceanography and Marine Research (NIOMR), Lagos, Nigeria. 23 p.
Ajayi TO and Talabi SO (1984) The potential yield and strategies for optimum utilization of the fisheries resources of Nigeria. Nigerian Insitute for Oceanography and Marine Research Technical Paper 18: 24.
Akankali JA and Jamabo NA (2011) A review of some factors militating against artisanal fisheries development in Niger Delta, Nigeria. Asian Journal of Agricultural Sciences 3(5): 369-377.
Ambrose E (2005) Effects of “fish eye codend” on by-catch reduction in near shore beam trawl shrimp fisheries in Nigeria. Journal of Aquatic Science 20(2): 97-105.
Anon. (1988) Fishing industry–Annual report, Nigeria, 1988. Department of State, Message Reference Number A-9, U.S. Department of State, Washington. 12 p.
Ayaji TO and Adetayo JA (1982) On fish catch and discard of the shrimp fishery of Nigeria. Nigerian Insitute for Oceanography and Marine Research Technical Paper 5: 15.
Ekpo AH and Etim L (1989) The performance of Nigeria’s fishery sector: an empirical analysis, 1976 – 85. GeoJournal 18(3): 291-295.
Enin UI (1994) The artisanal shrimp fishery of the outer Cross River Estuary, Nigeria. PhD thesis, University of Calabar, Calabar, Nigeria. 226 p.
Enin UI, Löwenberg U and Kunzel T (1991) The Nematopalaemon hastatus (estuarine prawn) fishery in the outer estuarine region of the Cross River Nigeria. Archiv für Fishereiwissenschaft 41(1): 67-68.
Etim L (1992) An integrated approach to the management of the Nigerian fisheries. A case report. Participant Country Reports. Conservation and management of marine resources within the Exclusive Economic Zone. Proceedings of an International Workshop at the International Oceans Institute, Halifax, Canada. 10 p.
Everett GV (1986) An outline of West African small-scale fisheries. IDAF/WP/13. FAO/DANIDA/NORWAY, Food and Agriculture Organization of the United Nations (FAO), Rome. 34 p.
Falaye AE (2008) Illegal, Unreported and Unregulated (IUU) fishing in West Africa (Nigeria and Ghana). A report prepared for the Marine Resource Assessment Group Ltd (MRAG), London. 35 p. Available at: http://www.imcsnet.org/imcs/docs/iuu_fishing_nigeriea_ghana.pdf [Accessed: June 2014].
FAO (2000) Information on Fisheries Management in the Federal Republic of Nigeria. Food and Agriculture Organization of the United Nations (FAO), Rome. Available at: http://www.fao.org/fi/fcp/en/NGA/body.htm [Accessed: June 2014].
FDF (2008) Fisheries Statistics of Nigeria 1995 – 2007. 4th Edition. Federal Department of Fisheries, Abuja, Nigeria.Ganapathiraju P and Pitcher T (2006) An estimation of compliance of the fisheries of Nigeria with Article 7 (fisheries
management) of the UN Code of Conduct for Responsible Fishing. p. 49 + 23 pages In Pitcher T, Kalikoski D and Ganapathiraju P (eds.), Evaluations of compliance with the FAO (UN) Code of Conduct for Responsible Fisheries. Fisheries Centre Research Reports 14(2), Vancouver.
Jacquet JL, Fox H, Motta H, Ngusaru A and Zeller D (2010) Few data but many fish: Marine small-scale fisheries catches for Mozambique and Tanzania. African Journal of Marine Science 32(2): 197-206.
Löwenberg U and Künzel T (1991) Investigations on the trawl fishery in the Cross River estuary, Nigeria. Journal of Applied Ichthyology 7: 44-53.
Moses BS (1989) The status of artisanal fisheries and fish resources conservation in south eastern Nigeria. Nigerian Society for Biological Conservation, University of Cross River State, Uyo, Nigeria. 22 p.
Nsentip UN (1983) A review of the commercially exploited marine fishery resources in Nigeria. pp. 35-57 In Anon. (ed.), Proceedings of the Second Annual Conference of the Fisheries Society of Nigeria. Fisheries Society of Nigeria (FISON), Calabar, Nigeria, 25-27th January, 1983
Okon EE (2010) Integrating climate change into conservation and management of marine fisheries resources: A study of the sustainable development of marine fisheries in Nigeria. PhD thesis, Aberystwyth University, Department of Law, Aberystwyth, United Kingdom. 308 p.

Nigeria - Etim et al. 73
Panayotou T (1982) Management concept for small scale fisheries: economic and social aspects. FAO Fisheries Technical Paper 228, Rome. 53 p.
Pauly D, Belhabib D, Blomeyer R, Cheung WWL, Cisneros-Montemayor A, Copeland D, Harper S, Lam V, Mai Y, Le Manach F, Österblom H, Mok KM, van der Meer L, Sanz A, Shon S, Sumaila UR, Swartz W, Watson R, Zhai Y and Zeller D (2014) China’s distant water fisheries in the 21st century. Fish and Fisheries 15: 474-488.
Perouse de Montclos MA (2012) Maritime piracy in Nigeria: Old wine in new bottles? Studies in Conflict & Terrorism 35: 531-541.
Ssentongo GW, Ajayi T and Ukpe ET (1983) Report on a resource appraisal of the artisanal and inshore fisheries of Nigeria. FAO/UNDP/FNDP/NIR/77/001, Rome. 43 p.
Ssentongo GW, Ukpe ET and Ajayi TO (1986) Marine fishery resources of Nigeria: a review of exploited fish stocks. CECAF Series 86/40, Food and Agriculture Organization of the United Nations (FAO), Rome. 62 p.
Udolisa REK and Solarin BB (1979) Design characteristics of cast nets and gillnets in Lagos Lagoon, Nigeria. Nigerian Institute of Oceanography and Marine Research Occasional Paper 31: 24.
Uwe-Bassey BU (1988) The catch structure of the artisanal gillnet fishery of the lower Cross River. MSc thesis, University of Calabar, Calabar, Nigeria. 105 p.
Wielgus J, Zeller D, Caicedo-Herrera D and Sumaila UR (2010) Estimation of fisheries removals and primary economic impact of the small-scale and industrial marine fisheries in Colombia. Marine Policy 34: 506-513.
Zeller D, Booth S, Davis G and Pauly D (2007) Re-estimation of small-scale fishery catches for U.S. flag-associated island areas in the western Pacific: the last 50 years. Fishery Bulletin 105(2): 266-277.
Zeller D and Pauly D, editors (2007) Reconstruction of marine fisheries catches for key countries and regions (1950-2005). Fisheries Centre Research Reports 15(2), University of British Columbia Fisheries Centre, Vancouver. 163 p.
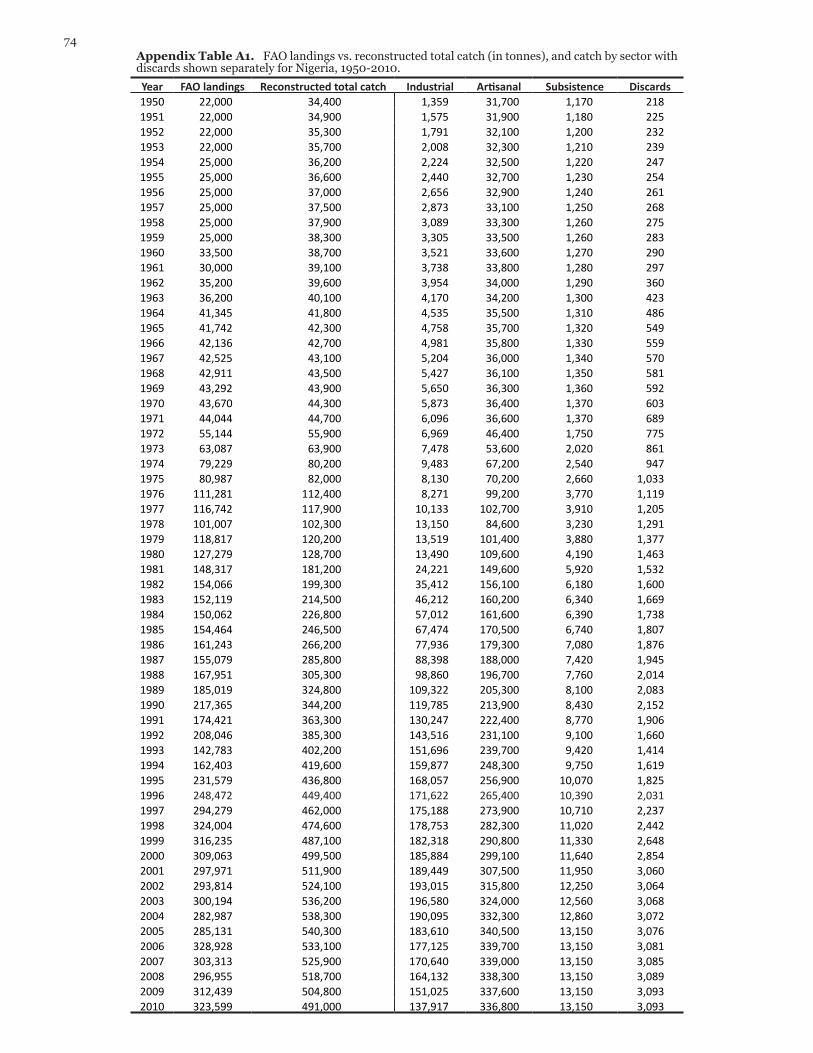
74Appendix Table A1. FAO landings vs. reconstructed total catch (in tonnes), and catch by sector with discards shown separately for Nigeria, 1950-2010.Year FAO landings Reconstructed total catch Industrial Artisanal Subsistence Discards1950 22,000 34,400 1,359 31,700 1,170 2181951 22,000 34,900 1,575 31,900 1,180 2251952 22,000 35,300 1,791 32,100 1,200 2321953 22,000 35,700 2,008 32,300 1,210 2391954 25,000 36,200 2,224 32,500 1,220 2471955 25,000 36,600 2,440 32,700 1,230 2541956 25,000 37,000 2,656 32,900 1,240 2611957 25,000 37,500 2,873 33,100 1,250 2681958 25,000 37,900 3,089 33,300 1,260 2751959 25,000 38,300 3,305 33,500 1,260 2831960 33,500 38,700 3,521 33,600 1,270 2901961 30,000 39,100 3,738 33,800 1,280 2971962 35,200 39,600 3,954 34,000 1,290 3601963 36,200 40,100 4,170 34,200 1,300 4231964 41,345 41,800 4,535 35,500 1,310 4861965 41,742 42,300 4,758 35,700 1,320 5491966 42,136 42,700 4,981 35,800 1,330 5591967 42,525 43,100 5,204 36,000 1,340 5701968 42,911 43,500 5,427 36,100 1,350 5811969 43,292 43,900 5,650 36,300 1,360 5921970 43,670 44,300 5,873 36,400 1,370 6031971 44,044 44,700 6,096 36,600 1,370 6891972 55,144 55,900 6,969 46,400 1,750 7751973 63,087 63,900 7,478 53,600 2,020 8611974 79,229 80,200 9,483 67,200 2,540 9471975 80,987 82,000 8,130 70,200 2,660 1,0331976 111,281 112,400 8,271 99,200 3,770 1,1191977 116,742 117,900 10,133 102,700 3,910 1,2051978 101,007 102,300 13,150 84,600 3,230 1,2911979 118,817 120,200 13,519 101,400 3,880 1,3771980 127,279 128,700 13,490 109,600 4,190 1,4631981 148,317 181,200 24,221 149,600 5,920 1,5321982 154,066 199,300 35,412 156,100 6,180 1,6001983 152,119 214,500 46,212 160,200 6,340 1,6691984 150,062 226,800 57,012 161,600 6,390 1,7381985 154,464 246,500 67,474 170,500 6,740 1,8071986 161,243 266,200 77,936 179,300 7,080 1,8761987 155,079 285,800 88,398 188,000 7,420 1,9451988 167,951 305,300 98,860 196,700 7,760 2,0141989 185,019 324,800 109,322 205,300 8,100 2,0831990 217,365 344,200 119,785 213,900 8,430 2,1521991 174,421 363,300 130,247 222,400 8,770 1,9061992 208,046 385,300 143,516 231,100 9,100 1,6601993 142,783 402,200 151,696 239,700 9,420 1,4141994 162,403 419,600 159,877 248,300 9,750 1,6191995 231,579 436,800 168,057 256,900 10,070 1,8251996 248,472 449,400 171,622 265,400 10,390 2,0311997 294,279 462,000 175,188 273,900 10,710 2,2371998 324,004 474,600 178,753 282,300 11,020 2,4421999 316,235 487,100 182,318 290,800 11,330 2,6482000 309,063 499,500 185,884 299,100 11,640 2,8542001 297,971 511,900 189,449 307,500 11,950 3,0602002 293,814 524,100 193,015 315,800 12,250 3,0642003 300,194 536,200 196,580 324,000 12,560 3,0682004 282,987 538,300 190,095 332,300 12,860 3,0722005 285,131 540,300 183,610 340,500 13,150 3,0762006 328,928 533,100 177,125 339,700 13,150 3,0812007 303,313 525,900 170,640 339,000 13,150 3,0852008 296,955 518,700 164,132 338,300 13,150 3,0892009 312,439 504,800 151,025 337,600 13,150 3,0932010 323,599 491,000 137,917 336,800 13,150 3,093
Nigeria - Etim et al. 75
Appendix Table A2. Reconstructed total catch (in tonnes) by major taxonomic categories for Nigeria, 1950-2010. ‘Others’ contain 64 additional taxonomic groups.Year Pseudotolithus
spp.Sardinella
spp.Ethmalosa fimbriata
Sciaenidae Sphyraena spp.
Ariidae Sharks or rays and chimaeras
Cynoglossidae Carangidae Others
1950 4,610 0 1,750 1,570 3,390 11 1,520 2,340 1,070 18,1001951 4,680 0 1,750 1,620 3,390 14 1,520 2,340 1,100 18,4001952 4,740 0 1,750 1,660 3,390 17 1,520 2,340 1,140 18,7001953 4,810 0 1,750 1,710 3,390 20 1,520 2,350 1,170 19,0001954 5,450 0 1,750 1,380 3,850 18 1,750 2,690 940 18,3001955 5,510 0 1,750 1,430 3,850 21 1,750 2,690 970 18,6001956 5,570 0 1,750 1,470 3,850 24 1,750 2,700 1,000 18,9001957 5,630 0 1,750 1,520 3,850 27 1,750 2,700 1,030 19,2001958 5,700 0 1,750 1,560 3,850 30 1,750 2,700 1,060 19,5001959 5,770 0 1,750 1,600 3,850 33 1,750 2,700 1,090 19,8001960 6,920 0 2,690 610 5,150 11 2,340 3,510 420 17,1001961 6,520 0 2,350 1,080 4,580 24 2,110 3,180 740 18,6001962 7,230 0 2,690 500 5,380 9 2,460 3,750 340 17,2001963 7,430 0 2,690 430 5,500 7 2,580 3,870 290 17,3001964 8,150 0 2,860 0 6,250 0 2,860 4,340 0 17,4001965 8,280 0 2,900 0 6,320 0 2,900 4,350 0 17,5001966 8,380 0 2,960 0 6,410 0 2,960 4,440 0 17,6001967 8,480 0 2,980 0 6,480 0 2,980 4,470 0 17,7001968 8,570 0 3,010 0 6,540 0 3,010 4,510 0 17,9001969 8,660 0 3,080 0 6,570 0 3,080 4,580 0 17,9001970 6,180 0 3,090 0 6,360 247 2,960 4,320 0 21,1001971 8,890 0 2,250 0 4,920 1,093 1,740 3,190 0 22,7001972 9,120 0 3,060 0 6,730 1,368 2,370 4,340 0 28,9001973 10,010 0 3,460 0 7,610 1,502 2,680 4,910 0 33,8001974 12,630 0 4,500 0 9,850 1,895 3,530 6,380 0 41,4001975 12,870 0 4,630 0 10,140 1,931 3,700 6,570 0 42,2001976 17,400 0 4,870 0 12,490 2,610 13,690 11,100 0 50,2001977 18,130 0 5,200 0 13,350 2,719 14,650 10,740 0 53,2001978 15,520 0 4,540 0 11,710 2,328 12,730 9,530 0 45,9001979 17,840 0 5,380 0 13,810 2,676 15,140 12,270 0 53,1001980 20,150 0 25,750 0 10,040 3,022 20,150 6,620 0 43,0001981 26,230 0 30,850 4,550 15,860 3,625 11,690 8,370 2,840 77,2001982 28,730 0 30,460 6,000 16,280 4,898 13,950 8,630 3,740 86,6001983 32,740 0 34,900 7,930 11,610 629 13,960 12,530 4,950 95,2001984 36,640 0 34,080 9,330 6,120 9,681 14,770 13,560 5,820 96,8001985 55,330 0 41,680 10,880 4,380 1,641 16,990 8,520 6,790 100,3001986 54,280 5,130 30,740 12,090 2,490 1,873 13,190 9,220 7,540 129,6001987 39,070 5,060 52,110 14,710 1,440 3,464 12,890 6,570 9,170 141,3001988 54,520 5,000 51,490 15,150 1,420 3,612 12,740 6,480 9,450 145,5001989 70,230 4,600 55,290 15,150 4,020 3,762 3,830 10,920 9,450 147,6001990 58,470 16,200 20,350 13,570 4,160 1,730 7,530 8,440 8,460 205,3001991 70,860 83,090 13,690 19,810 3,130 2,733 3,920 7,110 12,360 146,6001992 70,230 54,810 42,530 18,280 4,510 8,140 7,200 3,640 11,410 164,6001993 85,480 28,520 26,600 26,440 5,370 3,937 5,130 1,070 16,490 203,2001994 90,190 29,050 28,850 26,040 5,670 11,541 6,690 1,040 16,250 204,2001995 71,810 89,650 17,640 20,760 3,790 17,853 3,280 2,300 12,950 196,8001996 75,530 115,810 5,260 20,420 4,030 17,402 4,850 1,660 12,740 191,7001997 60,810 104,400 30,050 17,190 5,590 17,575 4,100 1,570 10,720 210,0001998 59,330 107,370 33,970 15,530 8,630 14,403 7,410 2,140 9,690 216,1001999 64,430 92,520 20,510 17,620 11,610 21,324 8,580 4,370 10,990 235,1002000 68,590 94,380 20,500 19,650 12,600 20,152 8,730 8,400 12,260 234,3002001 78,200 72,150 22,190 22,080 12,750 22,404 8,480 7,930 13,780 252,0002002 78,280 65,090 24,090 23,820 12,150 26,557 7,880 8,400 14,860 263,0002003 80,690 70,640 22,580 24,490 11,430 22,609 8,940 7,420 15,280 272,2002004 85,060 77,810 16,050 27,000 10,080 25,994 6,930 6,930 16,840 265,6002005 78,490 70,380 21,130 27,530 10,490 26,142 9,990 9,570 17,180 269,4002006 65,160 79,250 24,610 22,350 12,150 28,259 8,620 8,810 13,940 269,9002007 66,330 72,170 23,750 24,590 13,250 22,766 10,070 9,950 15,340 267,7002008 66,130 69,610 24,260 24,770 12,750 25,621 9,590 8,210 15,450 262,3002009 53,670 73,570 25,520 22,050 14,620 22,308 11,670 6,960 13,760 260,7002010 43,350 73,330 26,850 19,680 16,780 20,518 14,420 8,970 12,280 254,800

76