a multiwavelength study of a massive, active galaxy at z ... · obscured agn. this source has been...
TRANSCRIPT

University of Groningen
A multiwavelength study of a massive, active galaxy at z similar to 2Loiacono, Federica; Talia, Margherita; Fratemali, Filippo; Cimatti, Andrea; Di Teodoro, EnricoM.; Caminha, Gabriel B.Published in:Monthly Notices of the Royal Astronomical Society
DOI:10.1093/mnras/stz2170
IMPORTANT NOTE: You are advised to consult the publisher's version (publisher's PDF) if you wish to cite fromit. Please check the document version below.
Document VersionPublisher's PDF, also known as Version of record
Publication date:2019
Link to publication in University of Groningen/UMCG research database
Citation for published version (APA):Loiacono, F., Talia, M., Fratemali, F., Cimatti, A., Di Teodoro, E. M., & Caminha, G. B. (2019). Amultiwavelength study of a massive, active galaxy at z similar to 2: coupling the kinematics of the ionizedand molecular gas. Monthly Notices of the Royal Astronomical Society, 489(1), 681-698.https://doi.org/10.1093/mnras/stz2170
CopyrightOther than for strictly personal use, it is not permitted to download or to forward/distribute the text or part of it without the consent of theauthor(s) and/or copyright holder(s), unless the work is under an open content license (like Creative Commons).
Take-down policyIf you believe that this document breaches copyright please contact us providing details, and we will remove access to the work immediatelyand investigate your claim.
Downloaded from the University of Groningen/UMCG research database (Pure): http://www.rug.nl/research/portal. For technical reasons thenumber of authors shown on this cover page is limited to 10 maximum.
Download date: 22-04-2020

MNRAS 489, 681–698 (2019) doi:10.1093/mnras/stz2170Advance Access publication 2019 August 8
A multiwavelength study of a massive, active galaxy at z ∼ 2: couplingthe kinematics of the ionized and molecular gas
Federica Loiacono ,1,2‹ Margherita Talia ,1,2 Filippo Fraternali,1,3 Andrea Cimatti,1,4
Enrico M. Di Teodoro 5 and Gabriel B. Caminha3
1Dipartimento di Fisica e Astronomia, Universita di Bologna, via Gobetti 93/2, I-40129 Bologna, Italy2INAF-Osservatorio di Astrofisica e Scienza dello Spazio, via Gobetti 93/3, I-40129 Bologna, Italy3Kapteyn Astronomical Institute, University of Groningen, Postbus 800, NL-9700 AV Groningen, the Netherlands4INAF-Osservatorio Astrofisico di Arcetri, Largo E. Fermi 5, I-50125 Firenze, Italy5Research School of Astronomy and Astrophysics, The Australian National University, Canberra, ACT 2611, Australia
Accepted 2019 July 29. Received 2019 July 25; in original form 2018 November 22
ABSTRACTWe report a multiwavelength study of the massive (M� � 1011M�), z ∼ 2 star-forming galaxyGMASS 0953, which hosts an obscured AGN. We combined near-infrared observations ofthe GNIRS, SINFONI and KMOS spectrographs to study the kinematics of the [O III] λ5007and H α emission lines. Our analysis shows that GMASS 0953 may host an ionized discextending up to 13 kpc, which rotates at a velocity of Vion = 203+17
−20 km s−1 at the outermostradius. Evidence of rotation on a smaller scale (R ∼ 1 kpc) arises from the CO(J = 6–5) line.The central velocity VCO = 320+92
−53 km s−1 traced by the molecular gas is higher than Vion,suggesting that the galaxy harbours a multiphase disc with a rotation curve that peaks in thevery central regions. The galaxy appears well located on the z = 0 baryonic Tully–Fisherrelation. We also discuss the possibility that the [O III] λ5007 and H α velocity gradients aredue to a galactic-scale wind. Besides, we found evidence of an AGN-driven outflow traced by abroad blueshifted wing affecting the [O III] λ5007 line, which presents a velocity offset �v =−535 ± 152 km s−1 from the systemic velocity. Because of the short depletion time-scale(τ dep ∼ 108 yr) due to gas ejection and gas consumption by star formation activity, GMASS0953 may likely evolve into a passive galaxy. However, the role of the AGN in depleting thegas reservoir of the galaxy is quite unclear because of the uncertainties affecting the outflowrate.
Key words: galaxies: active – galaxies: evolution – galaxies: high-redshift – galaxies:kinematics and dynamics.
1 IN T RO D U C T I O N
In the last years significant progress has been made in the studyof z ∼ 2 massive (M� � 1011 M�) galaxies. Investigating thesesystems is pivotal to shed light on the mechanisms that regulate themass assembly at the peak epoch of both star formation and nuclearactivity (e.g. Madau & Dickinson 2014). Near-infrared (NIR)observations using integral field spectroscopy have revealed thatrotating discs are common in these objects (Forster Schreiber et al.2009; Wisnioski et al. 2015), with important implications for theirgrowth mode. The interplay between active galactic nuclei (AGNs)and their hosts have been deeply investigated through spatiallyresolved observations of ionized outflows traced by strong emissionlines (e.g. Harrison et al. 2012; Genzel et al. 2014; Carniani et al.
� E-mail: [email protected]
2015) while at the submillimetre wavelengths interferometers as theNOrthern Extended Millimeter Array (NOEMA) and the AtacamaLarge Millimeter Array (ALMA) have provided key information onthe molecular gas content of massive systems through CO lines anddust emission (e.g. Scoville et al. 2016; Tacconi et al. 2018).
Nevertheless, a number of questions remain open. A first issueconcerns the so-called ‘quenching’ of star formation in massivespheroids. Several studies show that massive spheroidal galaxiesare dominated by old stellar populations already at 1 < z < 2(e.g. Cimatti et al. 2004, 2008; Glazebrook et al. 2004; Onoderaet al. 2015). Because of their size, considerably smaller comparedto present-day ellipticals, and high stellar density the progenitorsof these systems are thought to be compact star-forming galaxies(SFGs) at 1.5 < z < 3 (e.g. van Dokkum et al. 2015). These objectsare often characterized by a short depletion time-scale inferred fromthe molecular gas content (Spilker et al. 2016; Barro et al. 2017;Tadaki et al. 2017) suggesting that they are rapidly exhausting
C© 2019 The Author(s)Published by Oxford University Press on behalf of the Royal Astronomical Society
Dow
nloaded from https://academ
ic.oup.com/m
nras/article-abstract/489/1/681/5545213 by University of G
roningen user on 19 Novem
ber 2019
682 F. Loiacono et al.
Table 1. Main properties of GMASS 0953.
RA Dec. z Reff,H band M� SFRIR SFRH α LX(2–10 keV) HR NH E(B − V) ne
(J2000) (J2000) (kpc) (1011M�) (M� yr−1) (M� yr−1) (erg s−1) (1024 cm−2) (cm−3)(1) (2) (3) (4) (5) (6) (7) (8) (9) (10) (11) (12)
3:32:31.4 −27:46:23.2 2.226 2.5 1.15 ± 0.10 214 ± 20 498 ± 33 5 × 1044 0.6 4.4+4.7−1.7 0.8 ± 0.3 ∼500
Note. Column description: (1), (2) sky-coordinates of GMASS 0953 in the HST/WFC3 H-band image. (3) Redshift derived from the [O III] λ5007 narrow line.(4) Effective radius measured on the HST/WFC3 H-band image (van der Wel et al. 2014). (5) Stellar mass derived from SED fitting. (6), (7) Star formationrate derived from the infrared luminosity and from H α. (8) X-ray intrinsic luminosity (Dalla Mura et al., in preparation). (9) Hardness ratio (Luo et al. 2017).(10) Column density (Dalla Mura et al., in preparation). (11) Colour excess derived from the H α and H β line ratio. (12) Electron number density evaluatedfrom the [S II] λλ6716, 6731 line ratio.
their internal reservoir for star formation. However, new gas canbe accreted from the circumgalactic and intergalactic medium(CGM/IGM) as shown by numerical simulations (Keres et al. 2005;Dekel et al. 2009), which may keep sustaining the star formationactivity. To explain the quenching of star formation in spheroidalgalaxies is thus necessary a mechanism that removes or heats theaccreted gas, in order to make it not available to form stars. AGNscould be crucial in this context through feedback mechanism (seeFabian 2012 for a review). In particular, high-velocity winds (v >
500 km s−1) extending on kpc-scale driven by the AGN may beefficient in depleting the galaxy of the accreted gas, cutting off thefuel for star formation. This ejective feedback is implemented inmodels as a way to prevent both black hole and galaxy growth (e.g.Di Matteo, Springel & Hernquist 2005; King 2005; Springel, DiMatteo & Hernquist 2005; Hopkins et al. 2016; Weinberger et al.2017; Nelson et al. 2018). However, if on the theoretical side AGNfeedback is commonly invoked to explain the observed propertiesof galaxies, from the observational point of view we still lack arobust understanding of how AGNs shape their hosts (Cresci &Maiolino 2018).
An important clue about the influence of AGN feedback in turningmassive SFGs to passive spheroids may arise from the population ofthe red sequence in the colour–mass plane (Cassata et al. 2008) byspheroidal galaxies between z ∼ 2.4 and z ∼ 1.4 and the decreaseof AGN activity in SFGs between the same redshifts (Cimattiet al. 2013). Rest-frame UV, stacked spectra of active galaxies inthe sample of Cimatti et al. (2013) show absorption lines withaverage velocity offset �v � −500 km s−1 that are signatures ofgas outflows, highlighting that the progenitors of passive spheroidsmay be found among the SFGs with AGN feedback in action.However, the picture is still hazy and detailed observations ofsystems hosting AGN-driven outflows are needed especially atz � 2, i.e. the formation epoch of the spheroids progenitors, inorder to assess the efficiency of AGN winds in suppressing starformation.
Another key issue concerning z∼ 2 massive galaxies relates to thekinematics of the interstellar medium (ISM). Using rotation curvesto investigate the kinematics of z ∼ 2 discs provides importantconstraints on the dark matter content and on the evolution ofscaling relations such as the Tully–Fisher (Tully & Fisher 1977)whose matching is an important test bench for theoretical models(e.g. Ferrero et al. 2017). Most of the studies at z ∼ 2 uses theionized phase of the ISM to trace the kinematics of massive galaxies,which has been deeply investigated through large programs suchas SINS (Forster Schreiber et al. 2009) and KMOS3D (Wisnioskiet al. 2015). The ionized gas has though the drawback to be moreaffected compared to the cold gas by non-circular motions (e.g.outflows), which may make this tracer, if considered alone, notrepresentative of the overall kinematics (e.g. Lelli et al. 2018). Amultiwavelength approach that employs different ISM tracers (e.g.
molecular, ionized) is hence required in order to build a robustpicture of the kinematics of z ∼ 2 objects. At the moment this kindof studies is rare, regarding just a scanty number of high-z galaxies(see e.g. Genzel et al. 2013; Chen et al. 2017; Lelli et al. 2018;Ubler et al. 2018; Herrera-Camus et al. 2019) because of the lackof multiwavelength spectroscopic data at high redshift.
Here we report a multiwavelength study of the z � 2.226 galaxyGMASS 0953. This is a massive, compact SFG, which hosts anobscured AGN. This source has been already studied by Taliaet al. (2018), who investigated its molecular content revealingthe existence of a rotating disc traced by the CO(J = 6–5) line.Moreover, Popping et al. (2017) found a very short depletion time-scale for the molecular gas, which implies that the galaxy is rapidlyconsuming its gas reservoir and it will likely evolve into a passivesystem. This work integrates the aforementioned picture addinginformation on the ionized gas kinematics. In particular, we discusshow the ionized gas motions relate to the molecular phase and whatis the effect of the AGN feedback on the galaxy. In our analysis, weused NIR observations of [O III] λ5007 and H α combining a slitspectrum, obtained with the Gemini Near InfraRed Spectrograph(GNIRS), with integral field data collected by the Spectrograph forINtegral Field Observations in the Near Infrared (SINFONI) and theK-band Multi-Object Spectrograph (KMOS). The use of differentinstruments that work at similar wavelengths has the advantage tocorroborate the results arising from independent measurements andprovides also complementary details (see Section 3). The paper isorganized as follows: in Section 2 we describe the main propertiesof GMASS 0953 while Section 3 concerns the data analysis.The multiwavelength kinematics is discussed in Section 4 andSection 5, while we study the AGN feedback in Section 6. Wefinally summarize the obtained results in Section 7. We adopt a�CDM cosmology with � = 0.71, M = 0.29, and H0 = 69.6km s−1 Mpc−1. In this cosmology 1 arcsec corresponds to 8.4 kpcat z � 2.226. We assume a Chabrier (2003) IMF.
2 G M A S S 0 9 5 3 : A G L O BA L PO RT R A I T
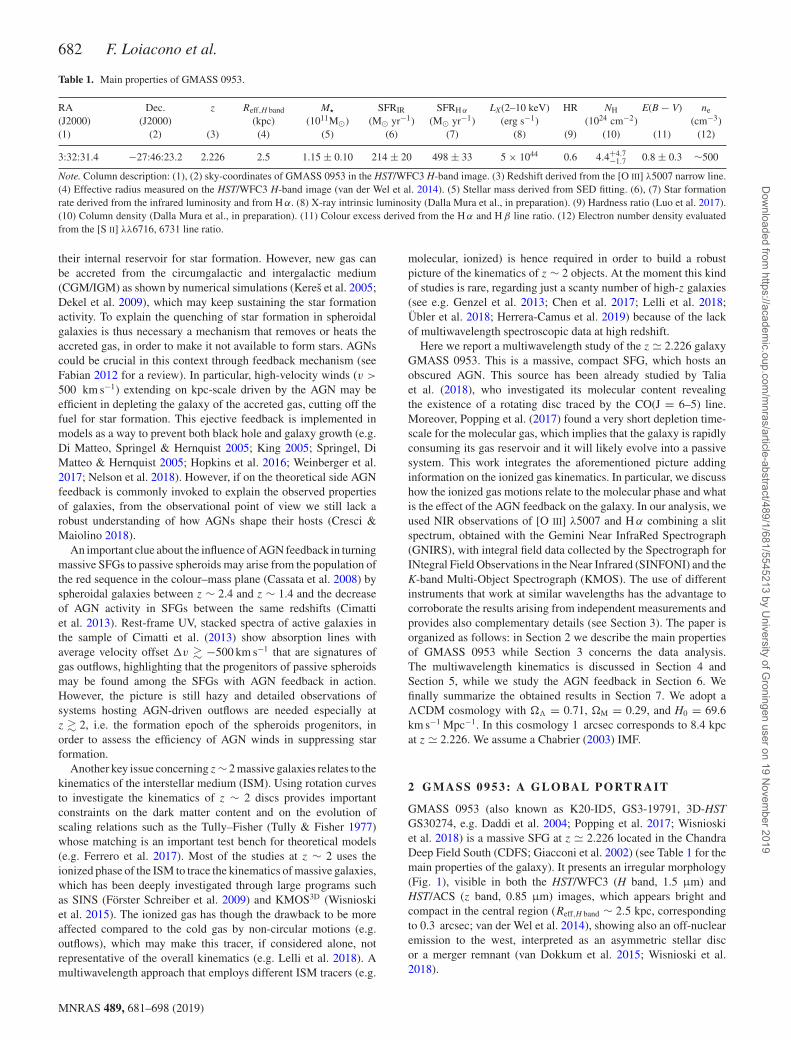
GMASS 0953 (also known as K20-ID5, GS3-19791, 3D-HSTGS30274, e.g. Daddi et al. 2004; Popping et al. 2017; Wisnioskiet al. 2018) is a massive SFG at z � 2.226 located in the ChandraDeep Field South (CDFS; Giacconi et al. 2002) (see Table 1 for themain properties of the galaxy). It presents an irregular morphology(Fig. 1), visible in both the HST/WFC3 (H band, 1.5 μm) andHST/ACS (z band, 0.85 μm) images, which appears bright andcompact in the central region (Reff,H band ∼ 2.5 kpc, correspondingto 0.3 arcsec; van der Wel et al. 2014), showing also an off-nuclearemission to the west, interpreted as an asymmetric stellar discor a merger remnant (van Dokkum et al. 2015; Wisnioski et al.2018).
MNRAS 489, 681–698 (2019)
Dow
nloaded from https://academ
ic.oup.com/m
nras/article-abstract/489/1/681/5545213 by University of G
roningen user on 19 Novem
ber 2019
The multiwavelength kinematics of GMASS 0953 683
Figure 1. H-band (1.6 μm, upper panel) and z-band (0.85 μm, bottompanel) images of GMASS 0953 (HST/WFC3 and ACS). The lowest contouris at 5σ . The blue crosses show the emission peak, which we take asthe photometric and dynamical centre of the galaxy. The central regionappears extremely bright and compact with an effective radius Re ∼ 2.5 kpc,estimated from the H-band image (van der Wel et al. 2014). The dashed lineindicates the major axis (position angle φ = 94◦).
The galaxy was selected among the AGN-hosts of Cimatti et al.(2013), which represent a subsample of the GMASS survey (Kurket al. 2013), including active galaxies with a stellar mass M� > 1010
M� and a X-ray luminosity LX > 1042.3 erg s−1. The AGN activityof GMASS 0953 was inferred from the X-ray luminosity LX ∼5 × 1044 erg s−1 corrected for obscuration (Dalla Mura et al., inpreparation) and the hardness ratio1 HR = 0.6 (Luo et al. 2017), bothhigher than those measured in purely star-forming systems (Normanet al. 2004). The optical emission-line ratios are also consistentwith an AGN (Newman et al. 2014) even if shock ionization bya strong galactic wind is also possible (van Dokkum et al. 2005).Indications of outflowing material, likely boosted by the AGN, wereobserved in the rest-frame optical spectrum (Forster Schreiber et al.2014; Genzel et al. 2014), in the UV absorption lines (Cimatti et al.2013) and we found further evidence in this work. On the otherhand, the AGN activity does not emerge from the UV emissionlines. This was verified by the measurement of the line ratios ofC IV λ1550, He II λ1640, and C III] λ1909 using MUSE data (P.Rosati, private communication). These ratios place GMASS 0953closer to the observed SFGs than to the AGNs in the diagnosticdiagram of Feltre, Charlot & Gutkin (2016), likely because of thehigh obscuration (NH = 4.4+4.7
−1.7 × 1024 cm−2, Dalla Mura et al., inpreparation).
Thanks to the available photometric spectral energy distribution(SED)2 from the UV to submm wavelengths, we estimated severalproperties of the galaxy. The stellar mass M� = (1.15 ± 0.10) × 1011
1The hardness ratio is defined as HR = (H − S)/(H + S) where H and Sare the photon counts in the hard (2–10 keV) and soft (0.5–2 keV) X-rayband, respectively.2The photometric SED of GMASS 0953 was obtained collecting data fromMUSIC (Grazian et al. 2006), SPITZER/MIPS (Magnelli et al. 2011),
M� was evaluated from the SED decomposition applying a modifiedMAGPHYS code (da Cunha, Charlot & Elbaz 2008) that includesthe AGN component, relevant in the mid-infrared (Berta et al.2013), as done by Delvecchio et al. (2014). The derived infraredluminosity LIR in the rest-frame 8–1000 μm, corrected for the AGNcontribution, was used to estimate the star formation rate SFRIR =214 ± 20 M� yr−1 through the Kennicutt (1998) relation, rescaled toa Chabrier (2003) IMF. The stellar mass and the SFR place GMASS0953 on the main sequence at z ∼ 2 (e.g. Daddi et al. 2007).
The kinematical properties of GMASS 0953 were investigatedby Forster Schreiber et al. (2009), who inferred an upper limit forthe dynamical mass Mdyn < 5.8 × 10¹¹ M�. Wisnioski et al. (2018)modelled the H α kinematics revealing a disc structure extendingup to 13 kpc with an average rotation velocity of 200 km s−1.Evidence of rotation on a smaller scale was found by Talia et al.(2018) studying the CO (J = 6-5) transition produced by a rapidlyrotating (VCO = 320+92
−53 km s−1) and very compact core (RCO =0.75 ± 0.25 kpc). Talia et al. (2018) found also a short depletiontime-scale for the molecular gas (τ dep < 150 Myr) and a lowmolecular gas fraction (fg < 0.2) in agreement with Popping et al.(2017), which imply that GMASS 0953 might quickly cease its starformation activity, likely turning into a passive galaxy.
3 DATA A NA LY SIS
In the sections below we describe the spectroscopic data set and theline fitting methods that we used to evaluate the physical propertiesof GMASS 0953. We also discuss the derivation of total flux mapsfrom the integral field data, which show the spatially resolvedemission-line morphology. We focus in particular on the [O III]λ5007 and H α lines that are then used to model the kinematics (seeSection 4)
3.1 GNIRS one-dimensional spectrum
We used the data of Kriek et al. (2008; see van Dokkum et al.2005 for the details) obtained with the GNIRS spectrograph (Eliaset al. 2006) at the Gemini South Observatory. They consist of aone-dimensional and two-dimensional spectra, publicly available,that cover the range 1.0–2.5 μm with a resolving power ∼ 1800.Several emission lines are present such as [O II] λλ3727, 3729,[O III] λλ4959, 5007, H α, H β, [N II] λλ6548, 6584, and the [S II]λλ6716, 6731 doublet (Fig. 2, top panel).
We analysed the one-dimensional spectrum through line fitting.The analysis was carried out with SPECFIT (Kriss 1994), a spectralfitting tool that runs in the Image Reduction and Analysis Facility(IRAF) environment. The galaxy emission was modelled with alinear continuum and eight Gaussian components, one for eachline. We divided the spectrum into two ranges including H β, [OIII] λλ4959, 5007 (1.5–1.7μm) and H α, [N II] λλ6548, 6584, [SII] λλ6716, 6731 (2.0–2.3 μm) on which we performed two fitsseparately. The ratio between the line centroids of oxygen, nitrogen,and sulphur doublets was fixed to the theoretical one (0.990, 0.995,and 0.998, respectively). We initially used two Gaussian functionsto reproduce [O III] λλ4959, 5007. However, both the lines showa broad, blueshifted wing, detected at 3σ and 5σ of significancefor [O III] λ4959 and [O III] λ5007, that is not reproduced by oneGaussian. In order to account for these emissions, we performed a
Herschel/PACS (Magnelli et al. 2013), SPIRE (Roseboom et al. 2010),and ALMA (Popping et al. 2017; Talia et al. 2018; Ueda et al. 2018).
MNRAS 489, 681–698 (2019)
Dow
nloaded from https://academ
ic.oup.com/m
nras/article-abstract/489/1/681/5545213 by University of G
roningen user on 19 Novem
ber 2019

684 F. Loiacono et al.
Figure 2. Top panel: GNIRS one-dimensional spectrum. Middle panel: line fits of H β and [O III] λλ4959, 5007. Bottom panels: line fits of [N II] λλ6548,6584and H α (left) and [S II] λλ6716,6731 (right, fit (b) of Table 2). The black line represents the model superimposed on the data (blue line), with the singlecomponents in red. The vertical bands show the location of the atmospheric lines. The profile of [O III] λλ4959, 5007 shows a blueshifted wing that wasmodelled with a broad Gaussian function (FWHM ∼ 1270 km s−1).
MNRAS 489, 681–698 (2019)
Dow
nloaded from https://academ
ic.oup.com/m
nras/article-abstract/489/1/681/5545213 by University of G
roningen user on 19 Novem
ber 2019

The multiwavelength kinematics of GMASS 0953 685
second fit adding two other Gaussians (Fig. 2, middle panel). Thisaddition improved significantly the reduced chi-square χ2
dof from1.23 to 1.01. The new fitted components have a full width at halfmaximum FWHM ∼ 1270 km s−1, much broader in comparisonto those already fitted (FWHM ∼ 370 km s−1). The blueshiftedcomponent of [O III] λ5007 is also clearly visible in the GNIRStwo-dimensional spectrum (broad component in Fig. 5, left-handpanel).
In the case of H α and [N II] λλ6548, 6584 we note that thefitted line widths result considerably larger than the FWHM of the[O III ] λλ4959, 5007 narrow components and the [S II ] λλ6716,6731 lines (Table 2). This could be due either to the overlappingof several sky lines, which may alter the line profiles, or to thepresence of blueshifted components, hidden by the line blending,that were not modelled separately (Fig. 2, bottom left panel). Thelatter interpretation could be supported by the blueshifted emissionaffecting the H α profile after the subtraction of the [N II] λλ6548,6584 models from the KMOS data cube (see Section 3.3 and Fig. 5,right-hand panel).
In the [S II] λλ6716, 6731 case, two fits have been performed. Ifonly the centroids ratio is fixed, the FWHM of [S II] λ6731 resultsindeed higher than the one relative to [S II] λ6716 (Table 2, fit (a)).However, the [S II] λ6731 emission is affected by a sky line (Fig. 2,bottom right panel) that likely alters its profile. In order to accountfor this uncertainty, we performed a second fit in which the linewidths were matched to the FWHM of [S II] λ6716 (i.e. the morereliable one) calculated in the first fit.
All the parameters derived from line fitting are reported in Table 2.The fitted values are consistent with the ones found by van Dokkumet al. (2005) despite of the addition of the broad [O III] λλ4959,5007 components.
We used the fitted quantities to evaluate some global propertiesof GMASS 0953 like dust obscuration, the SFR and the electronnumber density. Assuming a Calzetti et al. (2000) extinction curve,we estimated the colour excess E(B − V) = 0.8 ± 0.3 from theline ratio of H α and H β. This value indicates that GMASS 0953is a highly obscured system (see also van Dokkum et al. 2005).Before calculating the colour excess, the fluxes of H α and H β
were corrected for the stellar continuum absorption considering anequivalent width EW = 4 ± 1 Å (van Dokkum et al. 2005). Thenwe derived the SFRH α = 498 ± 33 M� yr−1 using the de-reddenedH α through the Kennicutt (1998) relation, rescaled to a Chabrier(2003) IMF. This value is higher than the one obtained using theinfrared luminosity, likely because of the AGN contamination (seealso Section 3.3).
Finally, we measured the electron number density ne from the[S II] λλ6716, 6731 line ratio calculated in the two fits. Bothratios are compatible with an electron number density of 500 cm−3
(Osterbrock & Ferland 2006), which can vary in the range 100< ne [cm−3] < 2 × 10³ because of the uncertainties in the lineratios. Values of ne ∼ 500 cm−3 are typical of AGNs narrow-lineregions. However, it is highly reasonable that the galaxy ISM alsocontributes to it because of the large size of the ionized gas, whichextends over the entire galaxy as visible from the SINFONI andKMOS maps (Figs 3 and 9).
3.2 SINFONI integral field spectrum
We analysed the data of GMASS 0953 from the SINS survey (seeForster Schreiber et al. 2009 for the observation details and datareduction) carried out with the SINFONI (Eisenhauer et al. 2003)integral field spectrograph (IFS) at the ESO Very Large Telescope
(VLT). They consist in a data cube covering the H band (1.5–1.7μμm) with a resolving power ∼ 2900 and a channel width of 1.95Å containing the sky-subtracted data. The visible lines are H β andthe [O III] λλ4959, 5007 doublet. The observation is seeing limitedwith a PSF of 0.7 arcsec. We verified the SINFONI astrometry inorder to properly overlap the emission-line maps on the HST imagesof GMASS 0953 as explained in Appendix A.
The SINFONI data cube (and also the KMOS one) was handledusing the software GIPSY (van der Hulst et al. 1992). We focusedin particular on the [O III] λ5007 narrow line fitted in the GNIRSspectrum, which we used for the kinematic modelling due to itshigh brightness, and on the [O III] λ5007 blueshifted component.The total flux map, which shows the [O III] λ5007 narrow-linemorphology, was derived co-adding N = 17 channels after maskingout all the pixels with a signal-to-noise ratio F/σ < 1 and removingby hand (channel by channel) the instrumental noise peaks presentin the field of view. We considered as the typical noise in one channelthe average standard deviation σ = 1.7 × 10⁻²⁰ erg s−1 cm−2 Å−1
of the signal in the channels without emission from the galaxy. Thenoise of the [O III] λ5007 map was estimated by the relation σTOT =σ√
N , where N = 9 is the average number of co-added channelsat each pixel position in the map. Due to the masking process, thenumber of co-added channels is not constant for all the pixels.
From the map3 (Fig. 3, top left panel), the [O III] λ5007narrow-line emission appears quite extended (see Fig. 9 for avisual comparison with the HST/WFC3 image). Moreover, the fluxdistribution is very asymmetric, with the western side much brighterthan the eastern one. The asymmetry in the flux distribution is visiblealso in the GNIRS two-dimensional spectrum (narrow componentin Fig. 5, left-hand panel).
Then, after a by eye inspection of the whole data cube, westacked the channels without emission lines or sky subtractionresiduals to obtain the continuum radiated by the galaxy. Thecontinuum emission is produced by the inner region of GMASS0953 (Fig. 3, top left panel) and it originates from the stellarcomponent; however, also a contribution from the obscured AGN ispossible. This is indeed less affected by dust extinction at rest-frameoptical wavelengths than in the UV, where the nuclear activity ofGMASS 0953 does not emerge (see Section 2). In order to properlyoverlap the SINFONI line maps to the HST images of the galaxy(see Appendix A), we evaluated the coordinates of the continuumpeak fitting the stacked emission with a two-dimensional ellipticalGaussian. We observe that there is a shift of 0.58 ± 0.24 arcsec(equivalent to 4.9 ± 2.0 kpc) between the fitted coordinates andthe [O III] λ5007 narrow-line peak (cross in Fig. 3, top left panel),evaluated also through a two-dimensional Gaussian fit.
The detection of blueshifted emission with respect to the [O III]λ5007 narrow line, corresponding to the broad component fittedin the GNIRS spectrum (Fig. 2, middle panel), was confirmed bythe SINFONI data, which also provided its spatial position. AddingN = 18 channels from 4974 to 4995 Å (rest-frame wavelengths),we obtained a 6σ detection localized near the galaxy centre (Fig. 3,top right panel). In order to assess if this emission was truly due to[O III] λ5007 and not to the stellar continuum, which also peaksnear the galaxy centre, we compared it to the continuum fluxof N = 18 co-added channels, i.e. the same number of stackedchannels for the [O III] λ5007 broad component. These channels
3We point out that the [O III] λ5007 map was not continuum subtractedbecause the contributed continuum flux on N = 17 channels is very low(less of 2σ significance).
MNRAS 489, 681–698 (2019)
Dow
nloaded from https://academ
ic.oup.com/m
nras/article-abstract/489/1/681/5545213 by University of G
roningen user on 19 Novem
ber 2019

686 F. Loiacono et al.
Table 2. Emission-line properties derived from the line fitting of the GNIRS spectrum.
Line Flux Line centroid FWHM(10−19 erg s−1 cm−2) (rest frame, Å) (km s−1)
H β 278 ± 58 4862.4 ± 0.4 264 ± 63[O III]λ4959 (narrow) 936 ± 125 4958.7 ± 0.2 394 ± 40[O III] λ4959 (broad) 501 ± 157 4949 ± 2 1170 ± 389[O III] λ5007 (narrow) 2084 ± 249 5006.8 ± 0.2 354 ± 31[O III] λ5007 (broad) 1099 ± 262 4998 ± 2 1376 ± 356
[N II] λ6548 847 ± 107 6547.4 ± 0.5 756 ± 78H α 2312 ± 108 6562.6 ± 0.3 604 ± 30[N II] λ6584 2120 ± 149 6583.7 ± 0.5 756 ± 78
[S II] λ6716 (a) 307 ± 58 6715.9 ± 0.6 319 ± 79[S II] λ6731 327 ± 73 6731.4 ± 0.6 413 ± 92
[S II] λ6716 (b) 307 ± 58 6716.0 ± 0.5 319 ± 79[S II] λ6731 282 ± 59 6731.5 ± 0.5 319 ± 79
Note. Letter (a) refers to the line fit of the [S II] λλ6716, 6731 doublet in which only the cen-troids ratio was fixed to the theoretical value while letter (b) indicates the fit in which the FWHM of[S II] λ6731 was matched to the FWHM of [S II] λ6716 calculated in fit (a).
Figure 3. Emission-line maps extracted from the SINFONI and KMOS data cubes. Top panels: narrow and broad component of [O III] λ5007 (black contoursand colours). Flux contour levels are at 3σ , 6σ , 12σ and 24σ for the [O III] λ5007 narrow line and at 2σ , 4σ and 6σ for the [O III] λ5007 broad component. Thered contour shows the continuum emission stacked on the entire spectrum (left-hand panel) and on N = 18 channels (right-hand panel), i.e. the same numberof co-added channels for the [O III] λ5007 blueshifted component. Compared to the centre of GMASS 0953 (0 arcsec offset in the map) the [O III] λ5007narrow-line morphology appears asymmetric, concentred in the western region of the galaxy, as indicated also by the off-centred emission peak (orange cross);on the other hand the [O III] λ5007 blueshifted line emits close to the nuclear region. Bottom panel: H α emission. Flux contour levels are at 3σ , 6σ , 12σ , 24σ
and 48σ . Compared to the [O III] λ5007 emission H α shows a more symmetric morphology, with the emission peak (orange cross) close to the centre. All themaps are centred on the peak of the HST/H-band image. The beam size of SINFONI and KMOS is shown in pink.
MNRAS 489, 681–698 (2019)
Dow
nloaded from https://academ
ic.oup.com/m
nras/article-abstract/489/1/681/5545213 by University of G
roningen user on 19 Novem
ber 2019

The multiwavelength kinematics of GMASS 0953 687
Figure 4. H α and [N II] λλ6548, 6584 emission lines (KMOS data). Left-hand panel: line fit of H α and [N II] λλ6548, 6584 superimposed on the data(black line) in one pixel. The fitted Gaussians are shown in coloured lines with the total model in red. The purple line indicates the continuum level while thenoise spectrum is shown in brown. Right-hand panel: total H α emission (orange) after the subtraction of [N II] λλ6548, 6584 and stellar continuum. See alsoAppendix B.
were selected at wavelengths close to the oxygen line. As evidentfrom the comparison of the contours, the blueshifted componentis significantly brighter than the continuum, hence it traces agenuine emission from the [O III] λ5007 line.4 This component isclearly visible also by looking at the position-velocity (pv) diagramextracted one pixel above the major axis of the galaxy (Fig. 5,middle panel). It appears like an evident off-set emission from the[O III] λ5007 narrow line reaching a velocity difference from thebulk of the galaxy emission of ∼−1200 km s−1.
3.3 KMOS integral field spectrum
To model the H α kinematics, we employed integral field data fromthe KMOS3D survey (Wisnioski et al. 2015), which investigates thekinematics of galaxies at 0.7 < z < 2.7 using the NIR spectrographKMOS (Sharples et al. 2013) at the VLT. GMASS 0953 is one of thecompact, massive galaxies in the sample of Wisnioski et al. (2018). Itwas observed with a resolving power ∼3965 at H α wavelengths anda spatial resolution of 0.59 arcsec. The spectrum covers the range1.95–2.3 μm with a channel width of 2.8 Å and an average noise of1.6 × 10−20 erg s−1cm−2 Å−1 in each channel. The visible lines areH α, [N II] λλ6548, 6584 and the [S II] λλ6716, 6731 doublet. Forthe observation details and the data reduction see Wisnioski et al.(2015).
In order to study the kinematics of H α, we carried out a linefit to subtract the stellar continuum and the nitrogen emission thatis partially mixed with the H α line (Fig. 4, left-hand panel), asalready seen in the GNIRS spectrum (Fig. 2, bottom left panel). Fordetails about the line fit, which we performed pixel by pixel, seeAppendix B. After subtracting the [N II] λλ6548, 6584 modelsfrom the original spectrum, a new data cube containing only theH α emission was built (Fig. 4, right-hand panel). We then stackedthe channels with the line (N = 25) to obtain the total flux map(Fig. 3, bottom panel). In comparison to the [O III] λ5007 emission,the H α morphology appears much less asymmetric, with the linepeak closer to the galaxy centre. The central position of the peak
4In the [O III] λ4959 case an emission near the galaxy centre was alsodetected but it was only slightly brighter than the continuum level so we donot report it.
may support the substantial contribution to the line from the AGN,which explains the discrepancy between the H α derived SFR andthe one inferred from the IR luminosity (see Section 3.1).
4 K I NEMATI C MODELLI NG
The SINFONI and KMOS data were used to perform a study ofthe kinematics of the [O III] λ5007 narrow line and H α. Thetwo lines show a large-scale velocity gradient that we analysedin details (Fig. 5). In particular, we worked under the hypothesisthat the observed velocity gradients are due to gas rotation and wemodelled the line emission as if it were produced by a rotating disc.In Section 4.3 we also discuss an alternative interpretation of thevelocity gradient.
4.1 Signatures of an ionized disc
As suggested by an inspection of the GNIRS two-dimensionalspectrum (Fig. 5, left-hand panel), the [O III] λ5007 narrow-lineemission appears tilted along the slit, showing a large-scale velocitygradient that could be due to gas rotation. The emission extendsover ∼3 arcsec, corresponding to 25 kpc. This large-scale gradienthas been confirmed by the pv diagram of [O III] λ5007 extractedroughly along the major axis of GMASS 0953 (see Fig. 1, toppanel) using the SINFONI data (middle panel in Fig. 5). Beforethe extraction, the data cube channel separation was converted intovelocity after determining λrest = (λB
50 + λR50)/2, i.e. the average
value between the wavelengths λ50 where the flux of the global [OIII] λ5007 profile is 50 per cent of the peak, with ‘B’ and ‘R’ thatrefer to the blue and red side of the line profile, respectively. Thisquantity was set to zero for simplicity and allowed us to fix thechannel velocity spacing to �v = 36.6 km s−1 at the [O III] λ5007wavelengths.5
The emission of the [O III] λ5007 narrow line covers about500 km s−1 with the western, bright side of the galaxy moving inour direction while the eastern, dimmer part is globally redshifted.
5For H α the channel velocity spacing is 39.8 km s−1. The λrest valuewas used also to convert the wavelengths of the GNIRS two-dimensionalspectrum into velocity.
MNRAS 489, 681–698 (2019)
Dow
nloaded from https://academ
ic.oup.com/m
nras/article-abstract/489/1/681/5545213 by University of G
roningen user on 19 Novem
ber 2019

688 F. Loiacono et al.
Figure 5. Position-velocity (pv) diagrams of [O III] λ5007 and H α roughly along the major axis of GMASS 0953 extracted from the GNIRS two-dimensionalspectrum (left), SINFONI (middle), and KMOS (right) data cubes. Flux contour levels are at ±2σ , ±4σ , 8σ and 16σ . Both the [O III] λ5007 and H α linespresent a large-scale velocity gradient that extends up to 500 km s−1at the external radii and goes far beyond in the central region. However, in the H α case, acontamination from the [N II] λλ6548, 6584 residuals is possible. The central excess up to ∼−1200 km s−1 presented by [O III] λ5007 in both the GNIRS andSINFONI pv diagrams corresponds to the broad blueshifted component fitted in the GNIRS one-dimensional spectrum.
Because of an atmospheric line, it is not clear if the galaxy emissionreaches velocity higher than −300 km s−1, which would be hiddenby the sky subtraction. The large-scale gradient extracted fromthe SINFONI data is consistent with the observed velocity in theGNIRS two-dimensional spectrum, even if the latter shows a slightlyhigher velocity for the receding half probably because of the bettersensitivity and lower spectral resolution.
As we noted in Section 3.2, in the central region of GMASS0953 the [O III] λ5007 gradient extends up to ∼−1200 km s−1
(broad component in Fig. 5, middle panel). The interpretation ofthis blueshifted emission, which is not due to gas rotation, will bediscussed in Section 6.
Interestingly, a large-scale velocity gradient is also shown by H α
(Fig. 5, right-hand panel). The line shows a slightly asymmetricmorphology, not marked as in the [O III] λ5007 case, with theredshifted half more clearly visible. The emission from the externalregions shows the same velocity gradient of the [O III] λ5007line for both sides while, in the inner part, it extends up to 500km s−1 for the red half and goes far beyond on the blue side. Thisblueshifted emission, which extends on a smaller scale (∼0.8 arcsec,corresponding to ∼6.7 kpc) with a velocity up to −700 km s−1,highlights the presence of a possible blueshifted component alsoin H α, though we point out a probable contamination from theresiduals of the [N II] λ6548 subtraction. Evidence of a blueshiftedcomponent necessary to reproduce H α and the [N II] λλ6548, 6584doublet was found by Forster Schreiber et al. (2014) and Genzel
et al. (2014), who interpreted it as a nuclear outflow linked to theAGN activity of the galaxy.
A velocity gradient, extending in the same direction of the [O III]λ5007 and H α large-scale observed gradients, is also shown by theCO(J = 6–5) line, which traces a high-density, compact moleculardisc hosted by GMASS 0953 (Talia et al. 2018). This fact suggeststhat the galaxy harbours a multiphase disc that includes both anionized and a molecular component (see Section 5).
4.2 Three-dimensional disc modelling
We interpreted both the [O III] λ5007 and H α large-scale velocitygradient as due to a rotating disc that we modelled with thepublicly available software 3DBAROLO (Di Teodoro & Fraternali2015). This is an algorithm based on the tilted-ring model (Rogstad,Lockhart & Wright 1974) that derives rotation curves througha three-dimensional modelling of data cubes. In this approach,the rotation velocity and the velocity dispersion are computeddirectly comparing the observed data cube with an artificial onethat simulates an IFS observation, avoiding the extraction ofthe two-dimensional velocity field. The latter is indeed affectedby beam smearing (Begeman 1987), a problem due to the lowspatial resolution (e.g. atmospheric seeing) that spreads the lineemission within a region on the adjacent ones. The result isthat the observed velocity gradients are artificially flattened witha consequent increase of the line broadening, which makes the
MNRAS 489, 681–698 (2019)
Dow
nloaded from https://academ
ic.oup.com/m
nras/article-abstract/489/1/681/5545213 by University of G
roningen user on 19 Novem
ber 2019

The multiwavelength kinematics of GMASS 0953 689
[O III] 5007
αH
Figure 6. Position-velocity diagrams of the [O III] λ5007 narrow line (toppanel) and H α (bottom panel) extracted along the major axis (φ = 94◦)of GMASS 0953. Blue contour and colours refer to the data while the3DBAROLO disc model is marked in red. Flux contour levels are at ±2σ , 4σ ,8σ , 16σ and 32σ . The yellow dots show the rotation curve projected alongthe line of sight.
kinematical parameters derived from the two-dimensional velocityfield less reliable (see Di Teodoro & Fraternali 2015 and Di Teodoro,Fraternali & Miller 2016 for more details). On the other hand,a three-dimensional modelling is not affected by beam smearingbecause the PSF of the observation is taken into account througha convolution step, performed to build mock data with the samespatial resolution of the observed ones.
To reproduce the data, the code builds a three-dimensional discmodel, formed by N rings of width W, for which the parameters thatminimize the residuals between the data cube and the model cubeare calculated. These parameters, both geometrical and kinematical,are the rotation velocity V(R), the velocity dispersion σ (R), theinclination angle i (90◦ for edge-on discs), the position angle φ ofthe major axis, the dynamical centre (x0, y0), the systemic velocityVsys, the disc scale height z0, and the gas surface density .
We applied the algorithm to [O III] λ5007 and H α independently,fixing all the rings parameters except V(R) and σ (R). The galaxywas divided into five rings with radii from 0.175 (1.5 kpc) to 1.575arcsec (13.2 kpc) and a width of 0.35 arcsec, corresponding toabout half the PSF. This choice entails that V(R) and σ (R) of aring are not fully independent of the fitted values for the closerones. The inclination angle i was fixed to 75◦ for both the lines(see Appendix C) while we chose φ = 94◦ after producing pv
Radius (kpc)2.9 5.9 8.8 11.8
H
Figure 7. Rotation curve of [O III] λ5007 (blue diamonds) and H α (greencircles). The rotation velocity decreases between the first two rings andincreases going outwards. The V(R) values are in agreement within theerrors for both the lines in all the rings.
diagrams for different position angles and considering the one withthe most extended emission. For the dynamical centre we used thecoordinates of the emission peak in the HST/H-band image whilewe left the disc scale height z0 to the default value (150 pc): due tothe low spatial resolution the disc scale height is unresolved, hencethe thickness has a negligible effect. Finally, we adopted for the gassurface density a locally averaged normalization, in which theflux in each pixel of the disc model is equalled to the flux in thecorresponding pixel in the data. In this way the inhomogeneitiesthat may affect a ring, as in the [O III] λ5007 case, can bereproduced.
After setting the disc parameters as described above, we launched3DBAROLO obtaining two best-fitting model cubes that simulate the[O III] λ5007 and H α line emission. In order to compare the discmodel with the data, we inspected the pv diagrams extracted alongthe major axis (Fig. 6). The observed [O III] λ5007 and H α emissionis well reproduced by the model. However, some differences arepresent. For example, the model slightly overestimates the linebroadening for both [O III] λ5007 and H α in the outer rings (R∼ 1.8 arcsec) of the approaching side. The disc model also doesnot reproduce the emission in the central region, with possiblerepercussions on V(R) and σ (R) of the internal rings. This effect isparticularly prominent in the H α case.
The fitted rotation curves nicely show consistent values of V(R)for the two lines in each ring (Fig. 7). The rotation velocity decreasesbetween the first two rings and appears to slightly increase goingoutwards for both [O III] λ5007 and H α.
We assessed the reliability of the best-fitting velocities simulatingnew model cubes in which we varied the fitted V(R) in order tovisually verify if different values of the rotation velocity worsenedor improved the pv diagram reproduction (see Swaters et al. 2009for the details about a similar ‘trial-and-error’ procedure in thiscontext). This test was carried out adopting an azimuthal surfacedensity profile for instead of the local normalization becausein this way the simulated pv diagrams present a smoothed andsymmetric emission that makes it more straightforward to seevariations in their shape. For both [O III] λ5007 and H α we foundthat the shape of the pv diagram is not sensitive to large variationsof V(R) for the first two rings, meaning that the associated errorbarsare underestimated. On the other hand, we consider reliable the
MNRAS 489, 681–698 (2019)
Dow
nloaded from https://academ
ic.oup.com/m
nras/article-abstract/489/1/681/5545213 by University of G
roningen user on 19 Novem
ber 2019

690 F. Loiacono et al.
Offset (kpc)
V (
km/s
)LO
S
-15 -10 -5 5 10 15
-100
0
100
150
-150
-50
50
0 -15 -10 -5 5 10 15Offset (kpc)
V (
km/s
)LO
S
150
100
50
0
-50
-100
-150
M82 (H I)
smoothed data
M82 (H I)
0
Figure 8. Position-velocity diagrams along the H I wind in the local starburst M82 (Very Large Array and Green Bank Telescope data; Martini et al. 2018).Left-hand panel: original data with a spatial resolution of 0.4 kpc. Right-hand panel: smoothed data with a spatial resolution of 4.65 kpc. The smoothedemission appears roughly similar to the observed velocity gradient of H α and [O III] λ5007 in GMASS 0953 suggesting that the interpretation of gas velocitygradients may be ambiguous when using data of low spatial resolution.
fitted rotation velocity and errors of the external three rings assignificantly lower or higher values of V(R) would not reproducethe data.
We repeated the test for the velocity dispersion σ (R). Theevaluation of this parameter is particularly complex because ofthe low spatial and spectral resolution of our data and the relativelyhigh inclination of the galaxy. We could derive only an upper limitof σ (R) < 160 km s−1 for [O III] λ5007 and σ (R) < 90 km s−1 forH α at large radii, which we obtained rejecting the σ (R) values thatdo not reproduce the pv diagram.
After this analysis, as a representative rotation velocity of thedisc, we took the weighted average V(R) of [O III] λ5007 and H α
of the last ring (R ∼ 13 kpc), which amounts to Vion = 203+17−20
km s−1. The associated errors were estimated considering both thefitted ones and the uncertainties due to the inclination angle (seeAppendix C).
4.3 An alternative interpretation of the velocity gradient
In Section 4.2 we modelled the kinematics of [O III] λ5007 andH α under the hypothesis that the velocity gradient of the two lineswas produced by a rotating disc. This is the more straightforwardassumption we can do given the limited spatial resolution of ourdata. However, velocity gradients in the gas kinematics can also beoriginated by other phenomena. In particular, galactic-scale windscan produce velocity gradients similar to that observed in GMASS0953, with the emission coming from the approaching/recedingcone blueshifted and redshifted, respectively. This can be seenin observations of local galaxies. One of the best-studied casesof galactic winds in the nearby Universe concerns the starburstgalaxy M82. The wind, due to vigorous star formation in the centre,has been observed in several gas phases (e.g. Schaaf et al. 1989;Shopbell & Bland-Hawthorn 1998; Leroy et al. 2015). Recently,Martini et al. (2018) investigated the kinematics of the M82 windusing H I observations resolved on the scale of 0.4 kpc. The windextends over 10 kpc from the galaxy centre and the observed pvdiagram (Fig. 8, left-hand panel) presents some interesting analogies
with those of [O III] λ5007 and H α in GMASS 0953 (Fig. 5).Clearly, a direct comparison of the pv diagrams is difficult becauseof the different spatial resolution of the two observations. Therefore,we smoothed the M82 data in order to have the same number ofresolution elements of GMASS 0953 along the pv diagram. Thiscorresponds to a new spatial resolution of 4.65 kpc. We found thatthe analogy persists after the smoothing (Fig. 8, right-hand panel)in terms of the global shape of the pv diagram, the asymmetric fluxdistribution and the observed declining velocity from the inner to theouter regions. Despite these similarities, the above comparison isnot trivial at least for two reasons: (i) we are comparing two differentgas phases, i.e. ionized versus neutral, which have different physicalproperties; (ii) we are comparing a local starburst galaxy withoutAGN activity with a high-redshift active galaxy. Keeping this inmind, our experiment suggests that when looking at the pv diagramof [O III] λ5007 and H α a wind interpretation cannot be ruled outwith our data. However, the wind scenario appears quite unlikely inGMASS 0953 since the wind would move along the projected majoraxis of the galaxy and not in a perpendicular direction, as observedin other low- and high-redshift sources (Heckman, Armus & Miley1990; Lelli et al. 2018). Moreover, the connection between a putativelarge-scale wind and the outflow described in Section 6 wouldremain unclear.
5 TH E M U LT I P H A S E D I S C O F G M A S S 0 9 5 3
From the kinematics modelling presented in Section 4.2, it emergesthat GMASS 0953 may host an ionized disc extending up to R ∼13 kpc with a rotation velocity Vion = 203+17
−20 km s−1 at the largestradius. The existence of the disc is highlighted by two lines analysedindependently, which show two consistent rotation curves. The H α
kinematics of GMASS 0953 was modelled also by Wisnioski et al.(2018), who found a rotation curve that is broadly consistent withour estimate at large radii, though a direct comparison betweenthe two rotation curves is made difficult by the differences in theadopted disc modelling and beam smearing correction.
MNRAS 489, 681–698 (2019)
Dow
nloaded from https://academ
ic.oup.com/m
nras/article-abstract/489/1/681/5545213 by University of G
roningen user on 19 Novem
ber 2019

The multiwavelength kinematics of GMASS 0953 691
Figure 9. The multiphase gas emission of GMASS 0953 overimposed on the HST/WFC3 (H band) image. The contours refer to the [O III] λ5007 narrow line(cyan), H α (green), and CO(J = 6–5) (orange, ALMA data; Talia et al. 2018). The lowest contour level is at 3σ . The cross indicates the galaxy centre.
Rotation does not concern only the ionized phase of the ISM.According to Talia et al. (2018), GMASS 0953 harbours a verycompact (RCO = 0.75 ± 0.25 kpc) molecular disc traced by theCO(J = 6–5) line, with a rotation velocity VCO = 320+92
−53 km s−1,i.e. higher although compatible at 2σ with our H α inner value.All the three lines show velocity gradients with consistent positionangle that are aligned with the major axis of the stellar component.The latter represents possibly a nearly edge-on disc that is visiblein the HST image of the galaxy (Fig. 9). These findings suggestthat GMASS 0953 hosts a multiphase disc, with rotation affectingthe galaxy from small to large scales and peaking in its centralregions. The joint existence of a cold and an ionized disc in high-zmassive galaxies was also found by Ubler et al. (2018) and Herrera-Camus et al. (2019). In the very inner region of GMASS 0953, weconsidered VCO = 320+92
−53 km s−1 of the molecular disc a reliablemeasure of the rotation velocity. As we discussed in Section 4.2,the internal points of the [O III] λ5007 and H α rotation curveare dominated by large uncertainties and they could be compatiblewith the CO(J = 6–5) rotation. Declining rotation curves in thecentral part of galaxies are observed both in local and distant objects(Spekkens & Giovanelli 2006; Noordermeer et al. 2007; de Bloket al. 2008; Genzel et al. 2017). In particular, in local galaxies theyhave been clearly associated with the presence of large bulges (e.g.Lelli, McGaugh & Schombert 2016a).
The ionized gas also provides the V(R) value on a larger scale,hence we can use it to estimate a lower limit to the dynamicalmass of the galaxy. Under the hypothesis of pure circular motions,the dynamical mass contained within the radius R ∼ 13 kpcamounts to Mdyn = RV 2
c /G > (1.3+0.2−0.3) × 1011 M� where, as the
circular velocity Vc, we considered the Vion value. Our estimateconstitutes only a lower limit to the dynamical mass because thecircular velocity Vc may be larger than the fitted rotation velocityVion. To estimate Vc both H α and [O III] λ5007 may require anasymmetric drift correction (Binney & Tremaine 2008) that isprobably negligible for CO(J = 6–5) because of the gas lower
temperature and velocity dispersion. We have not attempted toapply this correction due to the large uncertainties of our velocitydispersion (see Iorio et al. 2017 for the details). The lower limit forthe dynamical mass results consistent with the stellar mass evaluatedusing SED fitting (see Section 2) and also with the upper limit ofForster Schreiber et al. (2009).
It is interesting to see where GMASS 0953 is located on thebaryonic Tully–Fisher relation (McGaugh et al. 2000), whichconnects the baryonic content Mb to the circular velocity. Thebaryonic content Mb of the galaxy can be evaluated adding thestellar mass M� to the gas mass Mg. To compute the gas budgetwe considered the molecular gas content MH2 evaluated by Taliaet al. (2018) and the ionized gas mass Mion derived from the [OIII] λ5007 narrow-line luminosity (see Appendix D). However, thelatter amounts to Mion � 8.5 × 10⁶ M� if we use the observed[O III] λ5007 flux or to Mion � 2.2 × 10⁸ M� when correctingfor dust extinction, which is in both cases negligible comparedto the molecular gas mass MH2 = (3.24 ± 0.60) × 1010 M� (Taliaet al. 2018). We hence computed the baryonic mass as Mb �M� + MH2 = (1.47 ± 0.12) × 1011 M�. For the circular velocitywe used again Vion at 13 kpc. If we put these two values on thebaryonic Tully–Fisher relation of Lelli, McGaugh & Schombert(2016b), we find that GMASS 0953 is well included into the 0.11dex scatter of the z = 0 relation. This result suggests that massivegalaxies that are already relaxed at z � 2 may exist, in agreementwith the findings of Lelli et al. (2018).
6 PRO B I N G TH E AG N FE E D BAC K IN AC T I O N
6.1 Evidence of an AGN-driven ionized outflow
We know, from what we discussed in Section 3, that the [O III]λ5007 line consists of a narrow component, which we used tomodel the kinematics, and a broad blueshifted wing fitted in the
MNRAS 489, 681–698 (2019)
Dow
nloaded from https://academ
ic.oup.com/m
nras/article-abstract/489/1/681/5545213 by University of G
roningen user on 19 Novem
ber 2019

692 F. Loiacono et al.
GNIRS spectrum that is not ascribable to the rotating disc (Figs 2and 5). The emitting region appears concentrated near the nucleusof GMASS 0953 (Fig. 3, right-hand panel).
It is interesting to evaluate the size and the velocity of the [O III]λ5007 blueshifted emission. We computed the size of the emittingregion through a two-dimensional Gaussian fit on the SINFONImap. The emission appears barely resolved, with a FWHM of themajor axis of ∼0.8 arcsec, corresponding to 6.7 kpc. The velocitycan be evaluated from the line fit of the GNIRS spectrum. Wemeasured the velocity shift between the line centroids of the broadand the narrow [O III] λ5007 line to be �v = −535 ± 152 km s−1.
Line velocity offsets in galaxies are often connected to outflowinggas due to stellar winds or supernova explosions. However, thetypical offset in these cases amounts to |�v| ∼ 100 km s−1 (e.g.Shapley et al. 2003; Steidel et al. 2010; Talia et al. 2012), whichis considerably lower than our value. Conversely, velocity offsets�v ∼ −500 km s−1 have been found in [O III] λ5007 blueshiftedemission extending on several kpc in many high-z active galaxies(e.g. Cano-Dıaz et al. 2012; Harrison et al. 2012; Brusa et al.2015; Carniani et al. 2015). These high-velocity kpc-scale emissionsare actually interpreted as robust tracers of AGN-driven outflowsand represent an observational evidence of the AGN feedback inaction. They are also characterized by line widths >1000 km s−1,compatible with the FWHM ∼ 1400 km s−1 of the [O III] λ5007blueshifted line detected in our data. Finally, also the emittingregion, located close to the nucleus GMASS 0953, yet supportsthe AGN activity as the main engine of gas expulsion in this galaxy.
The [O III] λ5007 blueshifted line therefore highlights thepresence of an AGN-driven ionized outflow that affects GMASS0953, suggesting that the AGN feedback is likely at work in thisgalaxy. A further support to the presence of outflowing materialin the ionized phase may come from the blueshifted H α emissionin the central part of the galaxy visible in the pv diagram (Fig. 5,right-hand panel; see also Forster Schreiber et al. 2014; Genzelet al. 2014). Moreover, the FORS2 rest-frame UV spectrum ofGMASS 0953 presents absorption lines (e.g. C II λ1334, Si λ1260)that are blueshifted of −800 km s−1 with respect to the systemicvelocity (Cimatti et al. 2013). This fact suggests the presence ofoutflowing material also in a lower ionization state than that tracedby [O III] λ5007 and H α. Finally, there is a tentative evidence ofa blueshifted wing affecting also the CO(J = 6–5) line with �v ∼−700 km s−1 with respect to the main component, which might bedue to outflowing material in the molecular phase (Talia et al. 2018).However, the low significance of the detection (2.5σ ) prevents usto make a reliable analysis of this component hence, to state theeffects of gas expulsion on the galaxy, we considered the ionizedphase only.
6.2 Impact of the outflow on the host galaxy
6.2.1 Outflow rate
Because of the presence of outflowing gas, it is interesting toevaluate the mass of the expelled material per unit time (i.e. theoutflow rate) in order to compare it with the SFR of GMASS 0953.Many studies observed AGN-driven winds in local galaxies withoutflow rates that may exceed the SFR (Rupke & Veilleux 2011;Cicone et al. 2014) and influence the star formation activity byremoving large amounts of gas.
We followed the approach of Cano-Dıaz et al. (2012) and Carnianiet al. (2015), who derived the outflow rate of the ionized gas fromthe luminosity of the [O III] λ5007 blueshifted emission (all the
calculations are in Appendix D). We note that using [O III] λ5007as a mass tracer of the outflowing gas implies several uncertaintiessince the derived outflow mass is sensitive to the ionization state andto the metallicity of the gas. The latter cannot be directly measuredfrom the optical line ratios of GMASS 0953 because of the presenceof the AGN and we resort to using the mass–metallicity relation(Wuyts et al. 2016) while the ionization state has been assumed(see Appendix D). On the other hand, hydrogen lines such as H β
and H α are better mass tracers because they do not depend onthese quantities (see Harrison et al. 2018). However, we do not findevidence of a blueshifted wing in the H β profile probably becauseof the low signal-to-noise ratio and the weakness of the emission.In the case of H α we highlighted in Section 4 the presence ofoutflowing material possibly shown also by this line; however, theH α emission suffers from possible contamination of the [N II]λλ6548, 6584 lines (see Section 3.3) and from the AGN broad-lineregion (see also Brusa et al. 2015). For these reasons we do not useH α to derive the outflow properties.
The outflow rate was estimated in two ways: with and withoutapplying the dust extinction correction to the [O III] λ5007 lumi-nosity. As seen in Section 3.1 GMASS 0953 is highly obscured,hence it seems reasonable to consider both scenarios. To evaluatethe intrinsic [O III] λ5007 flux, we used the colour excess E(B −V) = 0.8 ± 0.3 derived from the H α and H β line ratio assuminga Calzetti et al. (2000) extinction curve. The resulting ionizedoutflow mass Mof in the extinction corrected case amounts to Mof �1.2 × 10⁸ M�. Without the extinction correction this quantity dropsto � 4.3 × 10⁶ M�.
Once we have obtained the outflow mass, to evaluate the outflowrate it is necessary to assume a geometrical model to describethe wind. The low spatial resolution of our data does not provideinformation about the intrinsic geometry of the outflowing gas. Forsimplicity we used the model of Cano-Dıaz et al. (2012), wherethe ionized gas is distributed in a conical region of radius Rof andis expelled in a direction roughly perpendicular to the galaxy disc.Under these assumptions, the outflow rate can be written as
Mof = 3Mof|vof|Rof
(1)
where vof is the outflow velocity estimated from the line fit ofthe GNIRS spectrum. There is no general consensus on how todefine outflow velocities (see Harrison et al. 2018). In our work wefollowed the approach of Rupke, Veilleux & Sanders (2005), whodefined the outflow maximum velocity as vof = FWHMbroad/2 +|�v|, where the first term is half the FWHM of the [O III] λ5007blueshifted component and �v is the velocity offset between the[O III] λ5007 narrow and blueshifted component (see also Fluetschet al. 2019). The resulting velocity amounts to vof ∼ 1200 km s−1.Using this vof value in equation (1) we are implicitly assuming thatall the outflowing material is moving at this velocity. This could bepossible due to projection effects, supported by the high inclinationof the galaxy (see also Cano-Dıaz et al. 2012; Brusa et al. 2015;Cresci et al. 2015). We note that using a more conservative definitionof vof, relying on the velocity offset |�v| ∼ 530 km s−1, the outflowrate would be reduced at most by a factor ∼2 and our results wouldnot be considerably modified. Finally, we used as the outflow radiusRof half the FWHM of the emitting region visible in the SINFONImap, which amounts to Rof � 3.3 kpc (see also Harrison et al.2012, 2014). Substituting these values in equation (1) and using theextinction corrected outflow mass, we found an ionized outflow rateMof ∼ 120 M�yr−1 that drops to ∼6 M� yr−1 if the outflow is notextincted by dust.
MNRAS 489, 681–698 (2019)
Dow
nloaded from https://academ
ic.oup.com/m
nras/article-abstract/489/1/681/5545213 by University of G
roningen user on 19 Novem
ber 2019

The multiwavelength kinematics of GMASS 0953 693
Figure 10. Comparison between the [O III] λ5007 blueshifted line (cyan) and the dust continuum (red, ALMA data; Talia et al. 2018). The two emissions areboth concentrated near the centre of GMASS 0953, marked with a cross.
An indication of whether the outflow is affected or not by dustobscuration may come from the 1.4 mm continuum of GMASS 0953(Talia et al. 2018), which is a robust tracer of dust. After applyingan astrometric correction (see Appendix A), we overlapped the dustcontinuum map on the outflow emission detected with SINFONI(Fig. 10). Interestingly, the dust and the [O III] λ5007 blueshiftedcomponent emit in the same region. Therefore, it is plausible thatthe [O III] λ5007 luminosity may be dimmed by the dust along theline of sight, though it is also possible that the outflow may havealready escaped the dusty region of the galaxy because of the highvelocity.
Apart from the extinction correction and the adopted assumptionabout the outflow velocity, it should be noted that other uncertaintiesaffect the outflow rate. The derivation of the outflow mass Mof thatenters equation (1) requires the knowledge of the electron numberdensity of the gas (see Appendix D). This quantity was derivedfrom the [S II] λλ6716, 6731 line ratio and amounts to 500 cm−3
(see Section 3.1). Unfortunately, the [S II] λλ6716, 6731 emissionis produced by the galaxy ISM and not by the wind since we didnot find evidence of a broad component in the [S II] λλ6716, 6731line fit likely because of the low signal-to-noise ratio. Finally, weremind that we assumed a conical outflow for simplicity, but thetrue geometry is not known.
6.2.2 Depletion time-scale
In order to properly gauge the impact of the AGN feedback onGMASS 0953 a comparison between the depletion time-scale dueto star formation with that associated with gas ejection is necessary.The former amounts to τ SF
dep = MH2/SFR ∼ 150 Myr (Popping et al.2017; Talia et al. 2018). The depletion time-scale due to the outflowcan be evaluated as the ratio between the mass of the ionized gasand the outflow rate, i.e. τ
OF,iondep = Mion/Mof ∼ 2 Myr (extinction
corrected case). This very short value is however implausible if theoutflowing material is supplied by the internal gas reservoir of the
galaxy, which is much higher than Mion. Under the assumptionthat the outflow is depleting the whole ISM, we can write thedepletion time-scale as τ
OF,moldep ≈ MH2/Mof, which is ∼270 Myr
using again the extinction corrected [O III] λ5007 luminosity. Wenote that this value of τ
OF,moldep represents an estimate of the depletion
time-scale in the central region only, since the molecular gas isconcentrated within a radius of 1 kpc (Talia et al. 2018). From thecomparison of the depletion time-scales, it appears that the AGN-driven outflow and the star formation activity contribute in a similarway in depleting the gas reservoir of the galaxy. We note howeverthat the outflow would be much less effective in consuming thegas if the not-extincted value of the [O III] λ5007 luminosity wereconsidered. Using the not-extincted luminosity we obtain indeeda depletion time-scale τ
OF,moldep ∼ 5.4 Gyr, meaning that the AGN-
driven outflow is negligible compared to the star formation activity.Moreover, the latter may also drive galactic winds that wouldprovide an additional contribution to gas consumption from starformation (Heckman & Thompson 2017).
Apart from the extinction correction, another important uncer-tainty affects the outflow depletion time-scale. We considered in theevaluation τ
OF,moldep the contribution of the ionized outflow only. Many
studies show that this phase cannot be the dominant constituent ofAGN outflows (Fiore et al. 2017); in particular, molecular outflowswere found to be up to two orders of magnitude more massive thanionized outflows in active galaxies where both the phases have beenobserved (Carniani et al. 2015). As we mentioned in Section 6.1,we did not find evidence of outflowing material in the molecularphase except for a feature of 2.5σ blueshifted from the CO(6–5) main line. The ALMA data can be used to set an upper limitto the molecular outflow rate of GMASS 0953. We stacked thechannels between −500 and −1200 km s−1 , corresponding to theoutflow emission in the SINFONI data (see Fig. 5, middle panel), inorder to derive a 3σ upper limit to the flux density of the CO(6–5)outflow (S3σ
CO = 79 mJy, assuming the outflow has the same sizeof the ionized one; see also Brusa et al. 2018). This value was
MNRAS 489, 681–698 (2019)
Dow
nloaded from https://academ
ic.oup.com/m
nras/article-abstract/489/1/681/5545213 by University of G
roningen user on 19 Novem
ber 2019

694 F. Loiacono et al.
converted in H2 mass using the same assumptions of Talia et al.(2018). We hence derived an upper limit to the molecular outflowrate using equation (1) and adopting the same velocity of the ionizedoutflow. The upper limit to the molecular outflow rate amounts to∼2500 M� yr−1. This means that our observation does not allow usto detect outflow rates below this quantity, which can potentiallycontribute to gas consumption.
From the reported analysis we conclude that the role played by theAGN feedback in GMASS 0953 is quite unclear. However, despitethe aforementioned uncertainties, the galaxy appears a promisingcandidate to quench the star formation activity in a total depletiontime-scale τTOT
dep = MH2/(SFR + Mof) ∼ 108 yr (see also Brusaet al. 2018) if the accretion from external gas is shutdown. Thisestimate is valid in both the extinction corrected/not-corrected case.
7 C O N C L U S I O N S
In this work we studied the kinematics of the active galaxy GMASS0953 from a multiwavelength perspective. Our analysis was focusedon the [O III] λ5007 and H α emission lines, which we inspectedcombining three spectroscopic data set. The main conclusions ofour work are summarized here:
(i) We found evidence of a multiphase disc supported by the [OIII] λ5007, H α and CO(J = 6–5) emission lines, which have parallelvelocity gradients extending in the same direction of the stellarcomponent. We investigated the kinematics of [O III] λ5007 and H α
independently using a three-dimensional modelling that correctsfor beam smearing. The two lines present consistent rotation curveswith an average rotation velocity Vion = 203+17
−20 km s−1 at a distanceof 13 kpc from the galaxy centre. As already known, the CO(J = 6–5) traces rotation on a much smaller scale (R ∼ 1 kpc) with a rotationvelocity VCO = 320+92
−53 km s−1 (Talia et al. 2018). Combining thesetwo results, the arising picture is that GMASS 0953 may host amultiphase disc with a rotation curve peaking in the central regionsand a dynamical mass >1.3 × 10¹¹ M�, consistent with the stellarmass. The galaxy falls onto the 0.11 dex scatter of the z = 0 baryonicTully–Fisher relation of Lelli et al. (2016b), suggesting that itis already kinematically relaxed. On the other hand, the velocitydispersion of the disc of GMASS 0953 is poorly constrained byour kinematic model because of the low spatial resolution of theSINFONI and KMOS data.
(ii) Based on the analogies between the [O III] λ5007 and H α
pv diagrams of GMASS 0953 and the local starburst M82, we alsodiscussed the possibility of a galaxy-scale wind as an explanationof the observed gradient. Despite finding this scenario unlikely, wecaution the reader over the challenging interpretation of gas velocitygradients in data with low spatial resolution.
(iii) We discovered an ionized outflow extending on kpc-scaleand likely associated with the nuclear activity of GMASS 0953.The outflow was highlighted by a broad (FWHM ∼ 1400 km s−1),blushifted wing in the [O III] λ5007 line profile with a velocityshift of �v = −535 ± 152 km s−1 from the systemic velocity. Theblueshifted [O III] λ5007 emission was detected independently bythe GNIRS and SINFONI spectrographs. Other hints of outflowingmaterial in the ionized phase come from the position-velocitydiagram of H α presented in this work (see also Forster Schreiberet al. 2014; Genzel et al. 2014) and the UV absorption lines (Cimattiet al. 2013).
(iv) We derived the outflow rate of the ionized gas in order toassess the impact of the AGN feedback on the galaxy. We foundthat the outflow rate amounts to ∼120 M� yr−1, which drops to
∼6 M� yr−1 without applying the dust extinction correction. Wecompared the gas depletion time-scale due to the outflow with theone based on star formation finding that they are of the same orderof magnitude (extinction corrected case). When both processes areconsidered we find a total depletion time-scale of 108 Myr. Thismeans that GMASS 0953 is expected to rapidly quench the starformation activity, if the accretion of external gas is shutdown.However the role played by the AGN in this galaxy appears uncleardue to the several uncertainties affecting the outflow rate. Forexample, if the outflow luminosity is not extincted by dust, thedepletion time-scale associated with the outflow drops to 5.4 Gyr,negligible compared to that due to star formation (τ SF
dep ∼ 150 Myr).Besides, using our data we can only constrain the ionized phasewhile we are not accounting for possible gas expulsion in otherphases (e.g. molecular). Deeper ALMA observations will be crucialin this sense.
Despite the remaining open questions, we stress the importanceof multiwavelength and multi-instrument studies of high-z galaxies.They provide complementary details about the ISM that are essentialto characterize the processes occurring in z ∼ 2 massive systems.Even though the uncertainties due to the observational limitsof high-z sources, multiwavelength studies represent the mostpowerful approach to investigate the kinematics of z ∼ 2 galaxiesand the role played by AGNs in their evolution.
AC K N OW L E D G E M E N T S
We gratefully thank N. M. Forster Schreiber and the KMOS3D andSINS/zC-SINF team for sharing the reduced KMOS and SINFONIdata analysed in this work. We thank P. G. van Dokkum for theGNIRS spectrum and P. Rosati who provided the reduced MUSEdata. We thank also P. Martini for having kindly made availablethe reduced data cube of M82. AC, MT and FL acknowledge thesupport from the grants PRIN-MIUR 2015, PRIN 2017, and ASIn.2018-23-HH.0.
REFERENCES
Asplund M., Grevesse N., Sauval A. J., Scott P., 2009, ARA&A, 47, 481Barro G. et al., 2017, ApJ, 851, L40Begeman K. G., 1987, PhD thesis. Kapteyn InstituteBerta S. et al., 2013, A&A, 551, A100Binney J., Tremaine S., 2008, Galactic Dynamics, 2nd edn. Princeton Univ.
Press, PrincetonBrusa M. et al., 2015, MNRAS, 446, 2394Brusa M. et al., 2018, A&A, 612, A29Calzetti D., Armus L., Bohlin R. C., Kinney A. L., Koornneef J., Storchi-
Bergmann T., 2000, ApJ, 533, 682Cano-Dıaz M., Maiolino R., Marconi A., Netzer H., Shemmer O., Cresci
G., 2012, A&A, 537, L8Carniani S. et al., 2015, A&A, 580, A102Cassata P. et al., 2008, A&A, 483, L39Chabrier G., 2003, PASP, 115, 763Chen C.-C. et al., 2017, ApJ, 846, 108Cicone C. et al., 2014, A&A, 562, A21Cimatti A. et al., 2004, Nature, 430, 184Cimatti A. et al., 2008, A&A, 482, 21Cimatti A. et al., 2013, ApJ, 779, L13Cresci G. et al., 2015, ApJ, 799, 82Cresci G., Maiolino R., 2018, Nat. Astron., 2, 179da Cunha E., Charlot S., Elbaz D., 2008, MNRAS, 388, 1595Daddi E. et al., 2004, ApJ, 600, L127Daddi E. et al., 2007, ApJ, 670, 156
MNRAS 489, 681–698 (2019)
Dow
nloaded from https://academ
ic.oup.com/m
nras/article-abstract/489/1/681/5545213 by University of G
roningen user on 19 Novem
ber 2019

The multiwavelength kinematics of GMASS 0953 695
de Blok W. J. G., Walter F., Brinks E., Trachternach C., Oh S.-H., KennicuttR. C., Jr., 2008, AJ, 136, 2648
Dekel A. et al., 2009, Nature, 457, 451Delvecchio I. et al., 2014, MNRAS, 439, 2736Di Matteo T., Springel V., Hernquist L., 2005, Nature, 433, 604Di Teodoro E. M., Fraternali F., 2015, MNRAS, 451, 3021Di Teodoro E. M., Fraternali F., Miller S. H., 2016, A&A, 594, A77Dunlop J. S. et al., 2017, MNRAS, 466, 861Eisenhauer F. et al., 2003, in Iye M., Moorwood A. F. M., eds, Proc. SPIE
Conf. Ser. Vol. 4841, Instrument Design and Performance for Opti-cal/Infrared Ground-based Telescopes. SPIE, Bellingham, p. 1548
Elias J. H., Joyce R. R., Liang M., Muller G. P., Hileman E. A., GeorgeJ. R., 2006, in McLean I. S., Iye M., eds, Proc. SPIE Conf. Ser.Vol. 6269, Ground-based and Airborne Instrumentation for Astronomy.SPIE, Bellingham, p. 62694C
Fabian A. C., 2012, ARA&A, 50, 455Feltre A., Charlot S., Gutkin J., 2016, MNRAS, 456, 3354Ferrero I. et al., 2017, MNRAS, 464, 4736Fiore F. et al., 2017, A&A, 601, A143Fluetsch A.et al., 2019, MNRAS, 483, 4586Forster Schreiber N. M. et al., 2009, ApJ, 706, 1364Forster Schreiber N. M. et al., 2014, ApJ, 787, 38Franco M. et al., 2018, A&A, 620, A152Genzel R. et al., 2013, ApJ, 773, 68Genzel R. et al., 2014, ApJ, 796, 7Genzel R. et al., 2017, Nature, 543, 397Giacconi R. et al., 2002, ApJS, 139, 369Glazebrook K. et al., 2004, Nature, 430, 181Grazian A. et al., 2006, A&A, 449, 951Harrison C. M. et al., 2012, MNRAS, 426, 1073Harrison C. M., Alexander D. M., Mullaney J. R., Swinbank A. M., 2014,
MNRAS, 441, 3306Harrison C. M., Costa T., Tadhunter C. N., Flutsch A., Kakkad D., Perna
M., Vietri G., 2018, Nat. Astron., 2, 198Heckman T. M., Thompson T. A., 2017, preprint (arXiv:1701.09062)Heckman T. M., Armus L., Miley G. K., 1990, ApJS, 74, 833Herrera-Camus R. et al., 2019, ApJ, 871, 37Hopkins P. F., Torrey P., Faucher-Giguere C.-A., Quataert E., Murray N.,
2016, MNRAS, 458, 816Iorio G., Fraternali F., Nipoti C., Di Teodoro E., Read J. I., Battaglia G.,
2017, MNRAS, 466, 4159Kennicutt R. C., Jr., 1998, ARA&A, 36, 189Keres D., Katz N., Weinberg D. H., Dave R., 2005, MNRAS, 363, 2King A., 2005, ApJ, 635, L121Kriek M. et al., 2008, ApJ, 677, 219Kriss G., 1994, in Crabtree D. R., Hanisch R. J., Barnes J., eds, ASP Conf.
Ser. Vol. 61, Astronomical Data Analysis Software and Systems III.Astron. Soc. Pac., San Francisco, p. 437
Kurk J. et al., 2013, A&A, 549, A63Lelli F., McGaugh S. S., Schombert J. M., 2016a, AJ, 152, 157Lelli F., McGaugh S. S., Schombert J. M., 2016b, ApJ, 816, L14Lelli F., De Breuck C., Falkendal T., Fraternali F., Man A. W. S., Nesvadba
N. P. H., Lehnert M. D., 2018, MNRAS, 479, 5440Leroy A. K. et al., 2015, ApJ, 814, 83Luo B. et al., 2017, ApJS, 228, 2Madau P., Dickinson M., 2014, ARA&A, 52, 415Magnelli B. et al., 2013, A&A, 553, A132Magnelli B., Elbaz D., Chary R. R., Dickinson M., Le Borgne D., Frayer D.
T., Willmer C. N. A., 2011, A&A, 528, A35Maiolino R. et al., 2015, MNRAS, 452, 54Martini P., Leroy A. K., Mangum J. G., Bolatto A., Keating K. M., Sandstrom
K., Walter F., 2018, ApJ, 856, 61McGaugh S. S., Schombert J. M., Bothun G. D., de Blok W. J. G., 2000,
ApJ, 533, L99Nelson D. et al., 2018, MNRAS, 475, 624Newman S. F. et al., 2014, ApJ, 781, 21Noordermeer E., van der Hulst J. M., Sancisi R., Swaters R. S., van Albada
T. S., 2007, MNRAS, 376, 1513Norman C. et al., 2004, ApJ, 607, 721
Onodera M. et al., 2015, ApJ, 808, 161Osterbrock D. E., Ferland G. J., 2006, Astrophysics of Gaseous Nebulae and
Active Galactic Nuclei, 2nd edn, University Science Books, SausalitoPopping G. et al., 2017, A&A, 602, A11Rogstad D. H., Lockhart I. A., Wright M. C. H., 1974, ApJ, 193, 309Roseboom I. G. et al., 2010, MNRAS, 409, 48Rupke D. S., Veilleux S., Sanders D. B., 2005, ApJ, 632, 751Rupke D. S. N., Veilleux S., 2011, ApJ, 729, L27Schaaf R., Pietsch W., Biermann P. L., Kronberg P. P., Schmutzler T., 1989,
ApJ, 336, 722Scoville N. et al., 2016, ApJ, 820, 83Shapley A. E., Steidel C. C., Pettini M., Adelberger K. L., 2003, ApJ, 588,
65Sharples R. et al., 2013, Messenger, 151, 21Shopbell P. L., Bland-Hawthorn J., 1998, ApJ, 493, 129Spekkens K., Giovanelli R., 2006, AJ, 132, 1426Spilker J. S., Bezanson R., Marrone D. P., Weiner B. J., Whitaker K. E.,
Williams C. C., 2016, ApJ, 832, 19Springel V., Di Matteo T., Hernquist L., 2005, ApJ, 620, L79Steidel C. C., Erb D. K., Shapley A. E., Pettini M., Reddy N., Bogosavljevic
M., Rudie G. C., Rakic O., 2010, ApJ, 717, 289Swaters R. A., Sancisi R., van Albada T. S., van der Hulst J. M., 2009, A&A,
493, 871Tacconi L. J. et al., 2018, ApJ, 853, 179Tadaki K.-i. et al., 2017, ApJ, 841, L25Talia M. et al., 2012, A&A, 539, A61Talia M. et al., 2018, MNRAS, 476, 3956Tully R. B., Fisher J. R., 1977, A&A, 54, 661Ubler H. et al., 2018, ApJ, 854, L24Ueda Y. et al., 2018, ApJ, 853, 24van der Hulst J. M., Terlouw J. P., Begeman K. G., Zwitser W., Roelfsema
P. R., 1992, in Worrall D. M., Biemesderfer C., Barnes J., eds, ASPConf. Ser. Vol. 25, Astronomical Data Analysis Software and SystemsI. Astron. Soc. Pac., San Francisco, p. 131
van der Wel A. et al., 2014, ApJ, 788, 28van Dokkum P. G. et al., 2015, ApJ, 813, 23van Dokkum P. G., Kriek M., Rodgers B., Franx M., Puxley P., 2005, ApJ,
622, L13Weinberger R. et al., 2017, MNRAS, 465, 3291Wisnioski E. et al., 2015, ApJ, 799, 209Wisnioski E. et al., 2018, ApJ, 855, 97Wuyts E. et al., 2016, ApJ, 827, 74
APPENDI X A : A STRO METRI C CORRECTIO NS
We verified the astrometry of the SINFONI data against theHST imaging of GMASS 0953. In order to properly overlap themaps of [O III] λ5007 on the HST images, we adjusted the datacube coordinates imposing the matching between the peak of theSINFONI stacked continuum and the light peak determinated inthe HST/H-band image. The coordinates of the peaks were bothcalculated through a two-dimensional Gaussian fit. The correctionresulted in a shift of +1.26 arcsec in RA and +2.16 arcsec inDec. applied to the data cube coordinates, after which we couldnicely superimpose the SINFONI line maps on the HST images(Fig. 9).
We verified also the astrometry of the ALMA data with respectto the HST images of GMASS 0953. The systematic offset betweenALMA and the HST data in the GOODS-South is a well-knownproblem that was underlined in many works (e. g. Maiolino et al.2015, Dunlop et al. 2017). We applied the correction of Franco et al.(2018) determined for the object AGS13: this name refers indeed toGMASS 0953, which was studied also in that work. We shifted thecoordinates of −0.087 arcsec in RA and +0.291 arcsec in Dec.In this way we could correctly overlap the dust continuum of thegalaxy on the HST images of GMASS 0953 (Fig. 10).
MNRAS 489, 681–698 (2019)
Dow
nloaded from https://academ
ic.oup.com/m
nras/article-abstract/489/1/681/5545213 by University of G
roningen user on 19 Novem
ber 2019

696 F. Loiacono et al.
0
0.1
0.2
0.3
0
0.1
0.2
0.3
0
0.1
0.2
0.3
0
0.1
0.2
0.3
0
0.1
0.2
0.3
2.10 2.12 2.14 2.10 2.12 2.14 2.10 2.12 2.14 2.10 2.12 2.14 2.10 2.12 2.14
Flux
[10
e
rg s
cm
Å ]
-18
-1-2
-1
Wavelengths [observed, 10 Å] 4
Figure B1. Line fit of H α and [N II] λλ6548, 6584 (KMOS data). Each spectrum was extracted from a pixel belonging to a section of 5 × 5 pixels, whichcorresponds to the central region of GMASS 0953. We modelled the data (blue line) with three Gaussian components and a linear continuum (coloured lines).The centroids ratio of the [N II] λλ6548, 6584 doublet and H α was fixed to the theoretical one. We imposed the same FWHM for the nitrogen lines and theirflux ratio was fixed to 1:3. The total model is overlayed in red.
APPENDIX B: K MOS LINE FITTING
In order to study the kinematics of the H α line, it was necessary toseparate its emission from the [N II] λλ6548, 6584 doublet, whichis blended with H α, and to subtract the stellar continuum. A linefit was hence performed in each pixel of the KMOS data cubecontaining the stellar and [N II] λλ6548, 6584 emission (Fig. B1).We selected a region of 5 × 5 pixels corresponding to the galaxycentral part because the nitrogen and the stellar emission weremainly confined in a region of this size (∼6.7 kpc). For each pixelwe extracted a spectrum that was modelled with three Gaussians anda linear continuum. The centroids ratio of the [N II] λλ6548, 6584doublet and H α was fixed to the theoretical one (0.995 for the [N II]λλ6548, 6584 lines and 0.998 for the [N II] λ6548 and H α ratio);we also imposed the same FWHM for the nitrogen lines and fixed
their intensity ratio to 1:3.6 We then subtracted from each pixel inthe data cube the corresponding [N II] λλ6548, 6584 models and thecontinuum level. In this way we obtained a data cube that containsonly the H α emission, which was used to study the kinematics.
APPENDI X C : INCLI NATI ON ANGLE
The disc inclination in the 3DBAROLO model was determined bycomparing the shape of the H α total flux map with synthetic mapsobtained for fixed inclination angles (from 60◦ to 85◦) using anazimuthally averaged H α surface brightness profile (Fig. D1). We
6We executed also a fit in which the intensity ratio of [N II] λλ6548, 6584was left free, but it showed no significant differences.
MNRAS 489, 681–698 (2019)
Dow
nloaded from https://academ
ic.oup.com/m
nras/article-abstract/489/1/681/5545213 by University of G
roningen user on 19 Novem
ber 2019

The multiwavelength kinematics of GMASS 0953 697
used the H α line instead of [O III] λ5007 because of the higher fluxof the receding half, which allows to better examine the geometry ofthe disc. This (by eye) comparison allowed us to exclude inclinationangles lower than 70◦ and greater than 80◦ and as a fiducial averagevalue we took i = 75◦ for all the rings. The reliability of our choicewas confirmed by the residuals between the data and the modelevaluated for different inclination angles, which show a minimumcorresponding to i = 75◦. Therefore we fixed i = 75◦ for both the[O III] λ5007 and H α disc models. We considered the uncertaintydue to the inclination angle in the range 70◦ <i < 80◦ when wecalculated the errorbars of the [O III] λ5007 and H α rotationvelocity. However, given the high value of i, the uncertainty onthe inclination does not have a big impact on the derived rotationvelocity.
APPENDIX D : O UTFLOW MASS ANDOUTFLOW R ATE
To evaluate the outflow mass and the outflow rate traced by [O III]λ5007 we followed the approach of Cano-Dıaz et al. (2012) andCarniani et al. (2015). We started evaluating the outflow mass, i.e.the total mass of the ionized gas expelled, from the luminosity ofthe [O III] λ5007 blueshifted component. The luminosity of the [OIII] λ5007 line can be written as
L[O III] = ελ5007f Vof, (D1)
where ελ5007 is the line emissivity, Vof the total volume occupiedby the ionized outflow, and f is the filling factor, i. e. the ratiobetween the volume of the [O III] λ5007 emitting gas and the totalvolume: we worked indeed under the hypothesis that the [O III]λ5007 line is produced by a fraction of the outflowing ionized gas.We used the emissivity value reported by Cano-Dıaz et al. (2012)for a temperature T = 104 K
ελ5007 = 1.11 × 10⁻⁹hνλ5007nO2+ne [ erg s−1cm−3 ], (D2)
where nO2+ is the number density of the doubly ionized oxygenand ne the electron number density. Under the reasonable assump-tion that all the oxygen is in the ionized form, we can espressnO2+ as
nO2+ = nO
nH
nH
nene, (D3)
where nO and nH are the neutral oxygen and hydrogen numberdensities. The electron number density ne can be written as ne ≈nH+ + 1.5nHe for a helium mixture made up by equal parts of He+
and He++ (Osterbrock & Ferland 2006). Since the number densityof the ionized helium nHe is in good approximation 0.1nH+ , underthe hypothesis that nH ≈ nH+ , equation (D3) becomes
nO2+ = nO
nH(1.15)−1ne = 10
log(
nOnH
)� 10
[OH
](1.15)−1ne, (D4)
where[
OH
] ≡ log(
nOnH
)− log
(nOnH
)�
is the metallicity. Substi-
tuting equation (D4) in equation (D2) and equation (D1) weobtain
L[O III] = 4.727 × 10⁻¹³hνλ5007n2e10
[OH
]f Vof [ erg s−1 ]. (D5)
We used for the oxygen abudance of the sun (nO/nH)� the valueof Asplund et al. (2009). If we neglect the elements heavier thanhelium, the ionized gas mass Mof of the [O III] λ5007 emittingclouds is essentially given by
Mof = (nH+mp + nHemHe)f Vof, (D6)
i=65°
i=75°
i=85°
Hα
Hα
Hα
Figure D1. Comparison between the H α flux map (black contour andcolours) and the model maps (red contour, 3σ level) obtained using anazimuthally averaged H α profile for fixed inclination angles. The inclinationangle was varied from i = 60◦ to i = 85◦. We report here the modelscorresponding to i = 65◦ and i = 85◦ (top and bottom panel) and the onewith i = 75◦ (middle panel), which we fixed as the disc inclination. Themore plausible inclination angles are included in the range 70◦ <i < 80◦while for i < 70◦ and i > 80◦ the model varies significantly from the data.
where mp and mHe are the proton and helium mass. Since mHe ≈2mp and expressing nH+ and nHe in terms of ne, equation (D6)becomes
Mof = 1.04 nempf Vof, (D7)
which combined with equation (D5) gives
Mof = 1.04 mp
4.727 × 10⁻¹³hνλ5007ne10[
OH
] L[O III] [ g ]. (D8)
We measured the electron number density ne from the [S II] λλ6716,6731 line ratio (see Section 3.1). The metallicity was derived usingthe mass–metallicity relation of Wuyts et al. (2016) and amounts to[
OH
] = log(0.9) for a stellar mass of 1011 M�.Once we have the outflow mass we can evaluate the outflow
rate, i.e. the ionized gas mass expelled per unit time. In order to
MNRAS 489, 681–698 (2019)
Dow
nloaded from https://academ
ic.oup.com/m
nras/article-abstract/489/1/681/5545213 by University of G
roningen user on 19 Novem
ber 2019

698 F. Loiacono et al.
calculate it, we adopted a simple geometrical model to describe theoutflow, as done by Cano-Dıaz et al. (2012), where the materialis distributed in a conical region with an opening angle andradius Rof and is expelled in a direction almost perpendicular tothe galaxy disc. Under this assumption, the outflow rate can bewritten as
Mof = ρvofR2of, (D9)
where ρ is the mass density of the ionized gas and vof the outflowvelocity. Assuming that the ejected material is located in a volume
Vof = 43 πR3
of4π
and simply writing ρ as ρ = Mof/Vof, equation (D9)becomes
Mof = 3Mofvof
Rof(D10)
by which it is possible to estimate the outflow rate of the ionizedgas.
This paper has been typeset from a TEX/LATEX file prepared by the author.
MNRAS 489, 681–698 (2019)
Dow
nloaded from https://academ
ic.oup.com/m
nras/article-abstract/489/1/681/5545213 by University of G
roningen user on 19 Novem
ber 2019