a multilocus perspective on colonization … lab uc berkeley...tence (lenormand 2002; holt et al....
TRANSCRIPT

ORIGINAL ARTICLE
doi:10.1111/j.1558-5646.2007.00251.x
A MULTILOCUS PERSPECTIVE ONCOLONIZATION ACCOMPANIEDBY SELECTION AND GENE FLOWErica Bree Rosenblum,1,2,3 Michael J. Hickerson,1 and Craig Moritz1
1Museum of Vertebrate Zoology, University of California, Berkeley, 3101 Valley Life Sciences Building, Berkeley,
California 947202E-mail: [email protected]
Received November 2, 2006
Accepted August 9, 2007
The colonization of novel habitats involves complex interactions between founder events, selection, and ongoing migration,
and can lead to diverse evolutionary outcomes from local extinction to adaptation to speciation. Although there have been
several studies of the demography of colonization of remote habitats, less is known about the demographic consequences of
colonization of novel habitats within a continuous species range. Populations of the Eastern Fence Lizard, Sceloporus undulatus,
are continuously distributed across two dramatic transitions in substrate color in southern New Mexico and have undergone rapid
adaptation following colonization of these novel environments. Blanched forms inhabit the gypsum sand dunes of White Sands and
melanic forms are found on the black basalt rocks of the Carrizozo lava flow. Each of these habitats formed within the last 10,000
years, allowing comparison of genetic signatures of population history for two independent colonizations from the same source
population. We present evidence on phenotypic variation in lizard color, environmental variation in substrate color, and sequence
variation for mitochondrial DNA and 19 independent nuclear loci. To confirm the influence of natural selection and gene flow in
this system, we show that phenotypic variation is best explained by environmental variation and that neutral genetic variation
is related to distance between populations, not partitioned by habitat. The historical demography of colonization was inferred
using an Approximate Bayesian Computation (ABC) framework that incorporates known geological information and allows for
ongoing migration with the source population. The inferences differed somewhat between mtDNA and nuclear markers, but overall
provided strong evidence of historical size reductions in both white sand and black lava populations at the time of colonization.
Populations in both novel habitats appear to have undergone partial but incomplete recovery from the initial bottleneck. Both
ABC analyses and measures of mtDNA sequence diversity also suggested that population reductions were more severe in the black
lava compared to the white sands habitat. Differences observed between habitats may be explained by differences in colonization
time, habitat geometry, and strength or response to natural selection for substrate matching. Finally, effective population size
reductions in this system appear to be more dramatic when colonization is accompanied by a change in selection regime. Our
analyses are consistent with a demographic cost of adaptation to novel environments and show that it is possible to infer aspects
of the historical demography of local adaptation even in the presence of ongoing gene flow.
KEY WORDS: Approximate Bayesian Computation, colonization, gene flow, natural selection, Sceloporus cowlesi, Sceloporus
undulatus, single nucleotide polymorphism.
3Current address: Lawrence Berkeley National Lab, Building 84 Room 355, One Cyclotron Road, Berkeley California 94720
2971C© 2007 The Author(s). Journal compilation C© 2007 The Society for the Study of Evolution.Evolution 61-12: 2971–2985

ERICA B. ROSENBLUM ET AL.
How adaptive, demographic, and genetic processes interact dur-
ing colonization of novel habitats is of central concern to stud-
ies of speciation and for the management of threatened or inva-
sive taxa (e.g., Tufto 2001; Lenormand 2002; Nosil et al. 2005).
Of particular interest is whether colonizing populations experi-
ence reduced effective population size as a consequence of nat-
ural selection and/or gene flow. Natural selection can suppress
population growth in novel environments due to high mortality
associated with initial maladaptation (e.g., Lande and Shannon
1996). Theory also suggests that colonizing populations may best
persist, and eventually adapt, with intermediate migration rates.
Too little migration can lead to extinction via demographic pro-
cesses or loss of genetic variance, and too much migration can
hinder the process of local adaptation, and thus population persis-
tence (Lenormand 2002; Holt et al. 2004; Nosil and Crespi 2004,
Alleaume-Benharira et al. 2006). However, predictions from these
theoretical models depend on a number of complex and inter-
acting factors (e.g., mating system, genetic architecture of traits,
density dependence of fitness). Therefore it is unclear whether
natural populations that colonize novel habitats, and which ex-
perience both selection and gene flow, should exhibit a partic-
ular demographic signature associated with the early stages of
adaptation.
Molecular data have been used with increasing sophistication
to infer the demography of colonization of isolated habitats (e.g.,
Estoup et al. 2001; Gaggiotti et al. 2004) and to infer population
reductions in isolated populations (e.g., Groombridge et al. 2000).
Less attention has been given to estimation from molecular data
of historical changes in effective population size under strong
selection, especially in the presence of ongoing migration (but
see Hadly et al. 2004). Further because colonization events are
Figure 1. Map of collecting localities and photographs of color morphs inhabiting different environments. On the left are photographs
of substrates and lizards from white sand (indicated with white bar), dark soil (indicated with gray bar), and black lava (indicated with
black bar) habitats. On the right is a map of the Tularosa Basin region with white sand populations A–C indicated with white circles, dark
soil populations G–J indicated with gray circles (note that only populations G and H are within the Tularosa Basin proper), and black lava
populations D–F indicated with black circles.
often unique, there is rarely an opportunity in natural systems
to compare population responses to colonization under specified
conditions.
Here we use molecular evidence to infer the historical de-
mography of colonization for natural populations of lizards that
have recently colonized and adapted to novel habitats within a
continuous population. Populations of the Eastern Fence Lizard,
Sceloporus undulatus (Sceloporus cowlesi, Southwestern Fence
Lizard, sensu Leache and Reeder 2002), are continuously dis-
tributed across two distinct ecological gradients in substrate color
in the Tularosa Basin of south-central New Mexico. Blanched
color morphs occupy the white gypsum dunes of white sands
(Lowe and Norris 1956), melanic color morphs occupy the black
basalt rocks of the Carrizozo lava flow (Lewis 1949), and “wild-
type” color morphs inhabit the brown soils of the surrounding
Chihuahuan desert scrublands (Fig. 1).
Despite the independent geological origins of the white sand
and black lava formations, their colonization history is likely quite
similar. The entire Tularosa Basin, ringed by regions of geological
uplift on all sides, was engulfed by a large inland lake during the
last glacial maxima (S. G. Fryberger, unpubl. data). The drying
of Lake Otero approximately 12,000 years ago represents a maxi-
mum age of recolonization of lizards into the Tularosa Basin. The
gypsum sands of white sands began to form approximately 10,000
years before present (ybp) with most of the deposition complete by
5000 ybp (Kocurek, in press; S. G. Fryberger, unpubl. data). The
exposure age of the black rocks that characterize the Carrizozo
lava flow are also estimated at approximately 5000.
The two novel habitats represent independent but analogous
experiments in selection. First, as detailed above, the white sand
and black lava formations are of comparable age. Second, the
2972 EVOLUTION DECEMBER 2007
COLONIZATION OF NOVEL HABITATS
white sand and black rock formations currently encompass areas
of approximately the same size (275 km2 and 320 km2, respec-
tively). Third, because the southern edge of the Carrizozo lava
flow and the northern edge of the white sands dune fields are less
than 20 km apart, abiotic factors in the two habitats other than
substrate color are extremely similar. Fourth, we can infer that
initial colonization of the two novel habitats occurred from the
same source population because S. undulatus in this region de-
rive from a single lineage (i.e., Sceloporus cowlesi sensu Leache
and Reeder 2002). Therefore colonists of the two habitats would
have shared traits likely to influence demographic response to
colonization (e.g., innate dispersal ability, breeding structure). Fi-
nally, both novel habitats provided selection pressure specifically
for substrate matching, albeit in opposing directions. The impor-
tance of crypsis for avoiding avian predators has been well docu-
mented for small diurnal lizards in southern New Mexico (Luke
1989), and previous research indicates that marked variation in
dorsal coloration among habitats is not due to phenotypic plastic-
ity (Rosenblum 2005).
Here, we examine patterns of molecular diversity to test for
population reductions, either transient or sustained, associated
with colonization of, and adaptation to, the novel habitats. We
first provide evidence for the role of natural selection and gene
flow in this system and then ask whether the demographic effects
of colonization are detectable and consistent between the two ge-
ologically independent environments.
MethodsSAMPLING
Ninety-one S. undulatus individuals were sampled from three
habitat categories. (1) White sand habitat: 29 blanched lizards (11
females, 18 males) were collected from three localities on the gyp-
sum dunes of White Sands National Monument and White Sands
Missile Range, Otero County. (2) Black lava habitat: 25 melanic
S. undulatus (11 females, 14 males) were collected from three
localities on the basalt rocks of the Carrizozo lava flow, Lincoln
County. (3) Dark soil habitat: 37 wildtype lizards (19 females, 18
males) were collected from four localities on the yucca scrublands
and blue gramma grasslands of Jornada Long-Term Ecological
Research Station, White Sands Missile Range, and White Sands
National Monument in Otero, Dona Ana, and Socorro Counties.
Whenever possible, ten individuals were sampled per population,
and comparable numbers of males and females were used. Repre-
sentative substrate samples were also collected from each habitat
type. Spatial locations of populations are illustrated in Figure 1.
Throughout, we refer to four categories of samples: (1) white
sand (samples from the gypsum dunes of white sands), (2) black
lava (samples from the Carrizozo lava flow), (3) dark soil (samples
from localities with typical Chihuahuan desert substrate), and (4)
Tularosa Basin dark soil (a subset of “dark soil” samples including
only those populations found within the Tularosa Basin, popula-
tions G and H east of the San Andres Mountains in Fig. 1). We
distinguish between “dark soil” and “Tularosa Basin dark soil”
populations because the Tularosa Basin dark soil populations are
of particular interest as a putative source for colonization of the
novel habitats and as a colonization “control” (i.e., these pop-
ulations colonized the Tularosa Basin but without a change in
selection regime for substrate matching).
CHARACTERIZING GENETIC AND PHENOTYPIC
VARIATION
Markers were developed for 19, unlinked anonymous nuclear loci
as detailed in Rosenblum et al. (2007). Briefly, we constructed
genomic libraries for two S. undulatus individuals, sequenced
approximately 200 random clones, and optimized PCR and se-
quencing primers for 19 anonymous nuclear loci (none exhibited
significant similarity to existing sequences in GenBank). Primers,
PCR chemistry, and locus-specific annealing temperatures are
given for the 19 loci (sun 001 through sun 019) in Rosenblum
et al. (2007). PCR products were sequenced directly using
Big Dye 3.1 cycle sequencing chemistry and visualized on an
ABI 3730 (Applied Biosystems, Foster City, CA). ABI’s KB-
basecalling software was used, but all sequences were checked
by eye in Sequencher (ver. 4.2, Gene Codes Corporation, Ann
Arbor, MI) to ensure that variable sites and heterozygotes were
scored correctly. Sequence data were obtained in one direction
and truncated at the first insertion/deletion polymorphism. No
fixed heterozygotes were observed, so variation was not due
to coamplification of duplicated regions. We resolved gametic
phase computationally (PHASE, Stephens and Donnelly 2003),
and found that results of analyses were robust to alternative phase
calls at positions below the confidence probability threshold
of 90%. A total of 191 variable sites was recorded in the 4732
basepairs sequenced from the 19 nuclear loci. Despite multiple
attempts, not all 91 individuals were sequenced for all loci, so
final sample sizes for the loci varied somewhat (mean 84, range:
61–91). We evaluated the minimum number of recombination
events within loci (Hudson and Kaplan 1985) using DnaSP (ver.
4.00, Rozas et al. 2003) and detected recombination at 11 of 19
loci. Therefore our model-based analyses include recombination
(see below). No significant linkage disequilibrium (LD) was
observed among loci after correcting for multiple comparisons
using Arlequin (ver. 3.0.1, Excoffier et al. 2005b), indicating
that the 19 loci were effectively unlinked. In addition to the
nuclear dataset, 812 basepairs of the mitochondrial ND4 gene
and associated tRNAs were sequenced for all but two individuals
for which nuclear data were collected. Primers modified from
Arevalo et al. (1994) were used to amplify and sequence this locus
(ND4: 5′-CAC CTA TGA CTA CCA AAA GCT CAT GTA GAA
EVOLUTION DECEMBER 2007 2973

ERICA B. ROSENBLUM ET AL.
GC-3′ and LEU: 5′-CAT TAC TTT TAC TTG GAT TTG CAC
CA-3′), and 64 variable sites were recorded. Sequence data have
been deposited in GenBank (nuclear data accession numbers:
EF411269-EF412962; mitochondrial data accession numbers:
EU045255-EU045304, DQ114057-DQ114065, DQ114067-
DQ114076, DQ114097-DQ114098, DQ114102-DQ114105,
DQ114108-DQ114121).
We quantified dorsal coloration for the majority of lizards
collected (22 individuals from white sand habitat, 24 individuals
from black lava habitat, and 23 individuals from dark soil habi-
tat). We published quantitative measures of color from a subset
of the dark soil and white sand samples previously (Rosenblum
2006), and data collection from the expanded set presented here
follows the identical protocol. Briefly, color recordings were taken
with an Ocean Optics USB 2000 spectrometer with a dual deu-
terium/tungsten halogen light source. The probe was oriented at
45 degrees, 1 cm away from the dorsal body surface. Lizard dor-
sal body coloration was characterized by averaging three readings
along the dorsal midline: between the front limbs, at the center
of the body, and between the hind limbs. All color recordings
were obtained at approximately 30◦C, and lizards were held on an
intermediate substrate prior to making color measurements. Addi-
tionally, spectrometric readings were taken of substrate samples
from each habitat type. Points along the spectra were averaged
10-fold into 3 nanometer (nm) bins. Spectral curves were there-
fore described by approximately 200 variables. Readings from
300 to 700 nm, the spectral range visible to squamates and their
avian predators (Bennett and Cuthill 1994; Ellingson et al. 1995;
Fleishman et al 1997; Cuthill et al. 1999), were used for analysis.
Principal Components Analysis (PCA) was used to quantify
variation in color of S. undulatus across habitats. Spectral data
were analyzed with PCA and then principal component factor
scores (FS1, FS2, FS3) were analyzed with a multivariate anal-
ysis of variance (MANOVA). All analyses were performed with
individuals grouped by habitat (white sand, black lava, and dark
soil). If a MANOVA was significant, univariate tests were per-
formed for FS1, FS2, and FS3 to determine which aspect of color
explained most of the observed differences among lizards. Empir-
ical findings show that principal component 1 (PC1) corresponds
to brightness (light transmission intensity) whereas PC2 and PC3
generally contain information about chroma (color purity) and
hue (wavelength of maximum slope) (Grill and Rush 2000). If
an ANOVA on FS1, FS2, or FS3 was significant, post hoc Tukey
HSD tests were used to determine which groups occupied signif-
icantly different regions of color space. In the dataset presented
here, PC1 explained over 90% of the variance in dorsal coloration
among habitats. We corroborated that PC1 scores were an accu-
rate quantification of the brightness aspect of color by comparing
results from PC1 with a more direct estimation of brightness: area
under the spectral curve (AUC). Because these analyses returned
nearly identical results, we refer to PC1 scores as measures of
brightness throughout.
CORROBORATING THE ROLE OF SELECTION
AND MIGRATION
To avoid making assumptions about the role of gene flow and
natural selection in this system, we first conducted several analyses
to better understand the partitioning of genetic and phenotypic
variation across habitats. Unless otherwise specified, all sampled
populations (n = 10) were included in analyses presented below.
We conducted an Analysis of Molecular Variance (AMOVA)
and a test for Isolation by Distance (IBD) to determine whether
genetic variation was partitioned by habitat (i.e., whether gene
flow was restricted by habitat boundaries). Levels of popula-
tion subdivision within species were computed using Tamura–
Nei molecular distances (Tamura and Nei 1993) implemented in
Arlequin (Schneider et al. 2000; Excoffier et al. 2005b). A hier-
archical AMOVA was conducted with populations nested within
the three habitat types. Confidence intervals for the global �ST
from AMOVA were estimated by permuting haplotypes among
populations and among habitat groups. Confidence intervals for
�SC were estimated by permuting haplotypes among populations
within habitat groups, and those for �CT were estimated by per-
muting populations among habitat groups. Pairwise population
comparisons were also conducted. For all �ST analyses, 1000 per-
mutations were performed to determine statistical significance. To
determine whether genetic difference among populations could be
explained solely by geography (i.e., IBD), a regression of FST/
(1 − FST) against Log(geographic distance) was performed
(Rousset 1997).
Following Rosenblum (2006) we used matrix correspon-
dence tests (MCTs) (Smouse et al. 1986; Thorpe et al. 1996; Storz
2002) to ask whether phenotypic variation was better explained
by selection (habitat variation) or drift and gene flow (neutral ge-
netic variation). Three matrices were generated based on pairwise
population comparisons. The first matrix described phenotypic
variation in dorsal brightness and was generated using mean pop-
ulation PC1 scores for spectrophotometric data (absolute values
of linear distances along PC1). The second matrix described varia-
tion in substrate color and was similarly based on absolute values
of linear distances along PC1. The third matrix described neu-
tral genetic variation among S. undulatus populations, and was
comprised of pairwise estimates of linearized FST.
Both pairwise and partial MCTs were conducted. Pairwise
MCTs were used to test for significant correspondence between
pairwise combinations of the phenotypic, substrate, and genetic
matrices. Partial MCTs were used to test for significant correspon-
dence between the phenotypic matrix and the substrate matrix
while controlling for neutral genetic divergence. This method is
based on a partial regression (i.e., testing the correlation between
2974 EVOLUTION DECEMBER 2007

COLONIZATION OF NOVEL HABITATS
two matrices while controlling for the effect of a third matrix) and
effectively “removes” the component of population-level pheno-
typic divergence that would be expected due to observed levels
of genetic subdivision. Because partial MCTs may be mislead-
ing when spatial autocorrelations of the dependent variables are
important (Raufaste and Rousset 2001; Castellano and Balletto
2002; Rousset 2002)—a problem not encountered with pairwise
MCTs—it is particularly informative to compare results of par-
tial and pairwise tests. Statistical significance for all MCTs was
assessed with permutation tests, and Bonferroni corrections were
used to adjust significance levels for multiple comparisons con-
ducted with pairwise MCTs.
RECONSTRUCTING THE DEMOGRAPHIC SIGNATURE
OF COLONIZATION
We next conducted several analyses to determine whether we
could detect population reductions in the novel habitats using
multilocus sequence data. Two measures of nucleotide variabil-
ity, � (Nei and Li 1979) and � (Watterson 1975) were calculated
using Arlequin (Schneider et al. 2000; Excoffier et al. 2005b). Nu-
cleotide diversity, �, is based on the average number of nucleotide
differences between two sequences randomly drawn from a sam-
ple, and � is based on the proportion of segregating sites in a
sample. Number of polymorphic sites, �, and � were calculated
for the entire pooled sample and also separately for all dark soil,
Tularosa Basin dark soil, white sand, and black lava samples.
We also used an approximate Bayesian computation (ABC)
framework (Beaumont et al. 2002; Hickerson et al. 2006) to infer
the size of populations inhabiting the novel habitats (i.e., white
sand and black lava) relative to their putative parental populations
(Tularosa Basin dark soil) and to estimate the magnitude of tran-
sient population reductions associated with initial colonization of
the novel habitats. Genetic divergence among collecting locali-
ties within each novel habitat was relatively low (i.e., white sands
�ST = 0.04 and black lava �ST = 0.03) and our desired scale of
inference was at the habitat level; therefore we pooled collecting
localities within habitats. The ABC approach uses a customized
model of population splitting to incorporate complexity associ-
ated with the characteristics of the molecular markers and the
population history. The model also uses prior geological knowl-
edge about the time frame of the colonizations. Importantly, the
uniform priors of the ABC model allowed for realistic levels of
recombination within loci as well as migration between source
and colonized populations subsequent to colonization. Inferring
specific values for migration and recombination was not our objec-
tive; rather these variables were included in the model to support
our goal of obtaining accurate estimates of effective population
sizes.
The ABC model consisted of a source population coloniz-
ing a novel population � generations in the past with subsequent
Na
Nb
Nn Nd
M
b
Figure 2. Schematic of ABC model. An ancestral population (Na)
gives rise to current-day populations in dark soil habitat (Nd) and
novel white sand or black lava habitat (Nn). The novel habitat
population is founded at time t and experiences a size reduction
(Nb) at time tb. Migration (M) is allowed between populations in
divergent habitats.
migration (M) in both directions (Fig. 2). All prior distributions
were uniform and are listed in Table 1. For the nuclear dataset, we
allowed � (the per gene per locus mutation rate) to vary across the
19 loci by drawing � from a prior distribution (where � = 4 Nd �
and Nd is the diploid effective population size of the present-day
source population). For the haploid mitochondrial dataset, � =was 2N� (N is female effective population size). Effective popu-
lation sizes were free to vary independently among novel popula-
tion (Nn), ancestral source population (Na), and population during
the bottleneck-colonization phase (Nb). The size of Nd (the source
population) remained constant subsequent to colonization and was
drawn from the uniform prior (0.0, �max / 4�); Nn, Nb, and Na are
given as sizes relative to Nd. The current effective population size
in the novel habitat (Nn) exponentially grew from the bottlenecked
effective population of size Nb at approximately 250 generations
subsequent to the colonization time, � . Exponential growth mod-
els are most commonly characterized with the coalescent [e.g.,
LAMARC (Kuhner 2006); customized ABC models (Ramakrish-
nan et al. 2005)]. Alternative growth models (e.g., instantaneous,
logistic) do have subtle effects on the coalescent but may only be
distinguished by very large samples (Polanski et al. 1998). If the
true growth model for our sampled populations of S. undulatus
was not exponential, Nb may be overestimated. However our in-
ferences from traditional population genetics (�, �), ABC, and
IM analyses are consistent, suggesting that our conclusions are
robust to particular model characteristics. Additionally, our study
employs a large number of independent loci, thus avoiding the
upward bias in estimates of growth rate that has been reported
when only few loci are used (Kuhner et al. 1998).
To constrain the parameter space in our ABC analyses, we
fixed � according to geological knowledge. Specifically we ran
models with minimum and maximum estimates � of 5000 and
10,000 ybp for white sands (Langford et al., unpubl. ms.; S. G.
Fryberger, unpubl. data) and 2000 and 5000 ybp for the Carrizozo
lava flow (Zimbelman and Johnston 2001). Although our primary
EVOLUTION DECEMBER 2007 2975
ERICA B. ROSENBLUM ET AL.
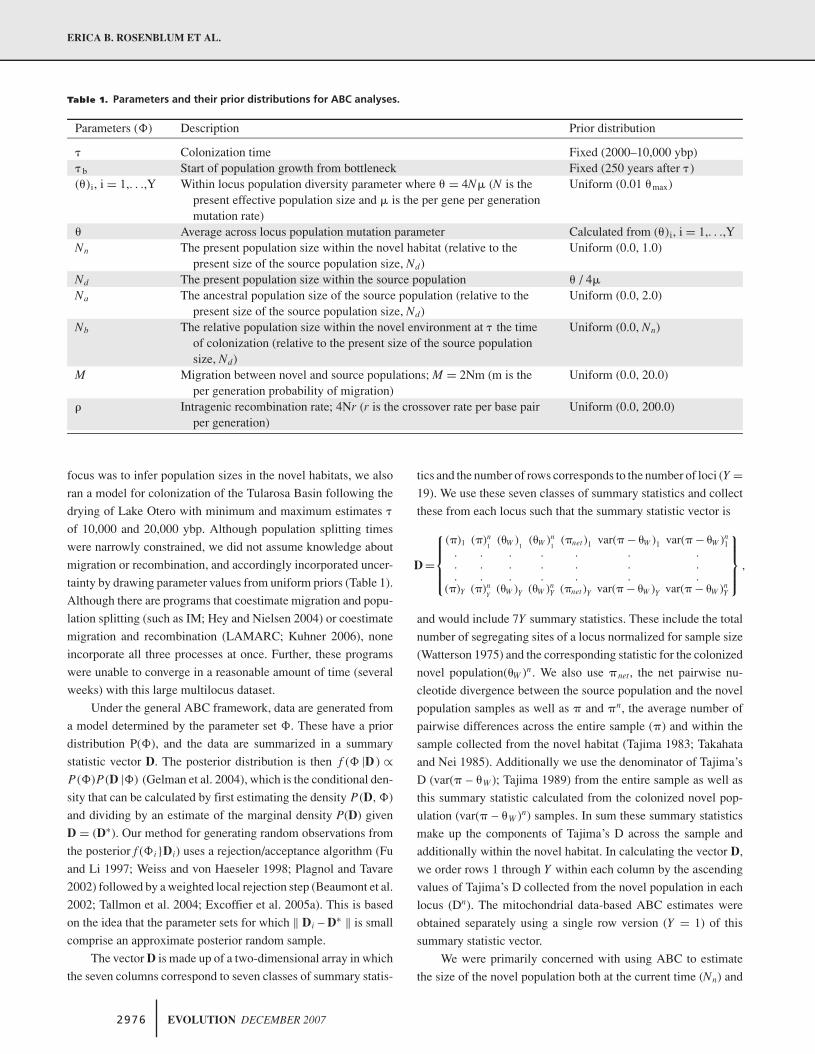
Table 1. Parameters and their prior distributions for ABC analyses.
Parameters (�) Description Prior distribution
� Colonization time Fixed (2000–10,000 ybp)� b Start of population growth from bottleneck Fixed (250 years after � )(�)i, i = 1,. . .,Y Within locus population diversity parameter where � = 4N� (N is the
present effective population size and � is the per gene per generationmutation rate)
Uniform (0.01 �max)
� Average across locus population mutation parameter Calculated from (�)i, i = 1,. . .,YNn The present population size within the novel habitat (relative to the
present size of the source population size, Nd)Uniform (0.0, 1.0)
Nd The present population size within the source population � / 4�
Na The ancestral population size of the source population (relative to thepresent size of the source population size, Nd)
Uniform (0.0, 2.0)
Nb The relative population size within the novel environment at � the timeof colonization (relative to the present size of the source populationsize, Nd)
Uniform (0.0, Nn)
M Migration between novel and source populations; M = 2Nm (m is theper generation probability of migration)
Uniform (0.0, 20.0)
� Intragenic recombination rate; 4Nr (r is the crossover rate per base pairper generation)
Uniform (0.0, 200.0)
focus was to infer population sizes in the novel habitats, we also
ran a model for colonization of the Tularosa Basin following the
drying of Lake Otero with minimum and maximum estimates �
of 10,000 and 20,000 ybp. Although population splitting times
were narrowly constrained, we did not assume knowledge about
migration or recombination, and accordingly incorporated uncer-
tainty by drawing parameter values from uniform priors (Table 1).
Although there are programs that coestimate migration and popu-
lation splitting (such as IM; Hey and Nielsen 2004) or coestimate
migration and recombination (LAMARC; Kuhner 2006), none
incorporate all three processes at once. Further, these programs
were unable to converge in a reasonable amount of time (several
weeks) with this large multilocus dataset.
Under the general ABC framework, data are generated from
a model determined by the parameter set �. These have a prior
distribution P(�), and the data are summarized in a summary
statistic vector D. The posterior distribution is then f (� |D ) ∝P(�)P(D |�) (Gelman et al. 2004), which is the conditional den-
sity that can be calculated by first estimating the density P(D, �)
and dividing by an estimate of the marginal density P(D) given
D = (D∗). Our method for generating random observations from
the posterior f (�i}Di) uses a rejection/acceptance algorithm (Fu
and Li 1997; Weiss and von Haeseler 1998; Plagnol and Tavare
2002) followed by a weighted local rejection step (Beaumont et al.
2002; Tallmon et al. 2004; Excoffier et al. 2005a). This is based
on the idea that the parameter sets for which ‖ Di – D∗ ‖ is small
comprise an approximate posterior random sample.
The vector D is made up of a two-dimensional array in which
the seven columns correspond to seven classes of summary statis-
tics and the number of rows corresponds to the number of loci (Y =19). We use these seven classes of summary statistics and collect
these from each locus such that the summary statistic vector is
D =
(�)1 (�)n1
(�W )1
(�W )n1
(�net )1 var(� − �W )1 var(� − �W )n1
. . . . . . .
. . . . . . .
. . . . . . .(�)Y (�)n
Y(�W )Y (�W )n
Y (�net )Y var(� − �W )Y var(� − �W )nY
,
and would include 7Y summary statistics. These include the total
number of segregating sites of a locus normalized for sample size
(Watterson 1975) and the corresponding statistic for the colonized
novel population(�W )n . We also use �net, the net pairwise nu-
cleotide divergence between the source population and the novel
population samples as well as � and �n, the average number of
pairwise differences across the entire sample (�) and within the
sample collected from the novel habitat (Tajima 1983; Takahata
and Nei 1985). Additionally we use the denominator of Tajima’s
D (var(� – �W ); Tajima 1989) from the entire sample as well as
this summary statistic calculated from the colonized novel pop-
ulation (var(� – �W )n) samples. In sum these summary statistics
make up the components of Tajima’s D across the sample and
additionally within the novel habitat. In calculating the vector D,
we order rows 1 through Y within each column by the ascending
values of Tajima’s D collected from the novel population in each
locus (Dn). The mitochondrial data-based ABC estimates were
obtained separately using a single row version (Y = 1) of this
summary statistic vector.
We were primarily concerned with using ABC to estimate
the size of the novel population both at the current time (Nn) and
2976 EVOLUTION DECEMBER 2007
COLONIZATION OF NOVEL HABITATS
at the time of colonization (Nb). For these two parameters we
report the posterior densities, their means as well as their modes.
To compare models of demographic history we use Bayes factors
B(�1,�2) that quantify the amount of posterior support in favor
of at least a 10-fold reduction (Nb < 0.1 (M�1) versus Nb > 0.1
(M�2). In this case, the Bayes factor comparing these models is
B(�1, �2) = (P(Nb ≤ 0.1|D = D∗)/P(Nb〉0.1|D = D∗))/
(P(Nb ≤ 0.1)/P(Nb〉0.1)),
for population reductions. We do not report posterior densities for
other parameters (e.g., migration) because the summary statistics
chosen to comprise vector D were tailored to our objective of
obtaining accurate estimate of effective population size.
To estimate Nn, Na, and Nb, we generated K = 500,000 sim-
ulated datasets under a standard coalescent model using random
draws from the prior distribution f (�) for parameters to simu-
late the data. The proportion of K values accepted to sample the
joint posterior distribution f (�}D) was 0.002. Although we con-
sidered other proportions (see below), simulations showed that
an acceptance rate of 0.002 yielded the most accurate estimates.
Three C programs (msprior, msDQH, and msstatsvector) were
glued together by a Perl shell (msBayes) to: (1) sample from the
prior f (�); (2) generate the finite sites DNA sequence data under
the coalescent model given sample sizes identical to the observed
sample; and (3) calculate the summary statistic vector D. The
parameter estimates and corresponding joint posterior surfaces
for Nn, Nd, and Nb were calculated using the density estimation
method implemented in the R statistical package (Loader 1996; R
Development Core Team 2004) using scripts kindly provided by
M. Beaumont.
Although the number of summary statistics that we use in Dcould hinder obtaining accurate ABC estimates from K = 500,000
draws from the prior, we determined the ABC conditions from
which to obtain reliable estimates from this summary statistic
vector D by way of simulations. To this end we obtained ABC
estimates on 1000 pseudo-observed (simulated) datasets using:
(1) different numbers of accepted draws from the prior (1000 vs.
5000); (2) two different transformations of the accepted draws
from the prior (simple rejection sampling vs. local regression);
and (3) two different summaries of the posterior (mean vs. mode).
The 1000 pseudo-observed datasets were simulated by randomly
drawing from the prior and the 1000 estimates were repeated under
the different ABC conditions above. In all cases, the same K =500,000 draws from the prior were used for every set of 1000 ABC
estimates using sample sizes identical to the black lava/Tularosa
Basin dark soil comparison. To evaluate estimates under these
various conditions we plotted the estimates with their true values.
We were able to compare ABC results to IM results for the
nonrecombining mitochondrial case to demonstrate that our con-
clusions regarding effective population size were robust to analysis
method. We ran IM with 10 MCMC coupled chains and a burn-in
time of 500,000 steps. We adjusted heating values so that the ini-
tial update rates were greater than 40% and swap rates between
adjacent chains were at least 50%. Migration was constrained to
be symmetric with a maximum value of 20. Divergence time was
constrained to be 0.2 (in units of the per gene per generation mu-
tation rate). IM default settings were used for all other parameter
priors.
ResultsCORROBORATING THE ROLE OF SELECTION
AND MIGRATION
As expected, the color of both lizards and substrates varied dra-
matically among habitats. The MANOVA based on PCA factor
scores was highly significant for substrate color [F6,6 = 59.60;
P < 0.001] and for lizard color [F6,128 = 59.28; P < 0.001].
Univariate ANOVA and post hoc Tukey tests for each principal
component showed that both substrates and lizards from differ-
ent habitats occupied different regions of color space, with lizard
color variation corresponding to substrate color variation. Sig-
nificant differences were observed among all habitats along PC1
for substrates [F2,5 = 85.48; P = 0.001] and for lizards [F2,66 =172.29; P < 0.001], and the vast majority of variation in sub-
strate and lizard coloration was explained by PC1, the brightness
aspect of color (92% and 98%, respectively). Significant differ-
ences among all habitats were observed along PC2 for substrate
[F2,5 = 53.71; P <0.001], but this axis explained only 2% of ob-
served variation. Significant differences along PC3 were observed
for lizard coloration [F2,66 = 24.82; P < 0.001], with dark soil
animals appearing unique, but again, this axis explained only 1%
of observed variation. No significant differences were observed
along PC3 for substrates or PC2 for lizards.
In contrast to patterns of phenotypic variation, AMOVA and
IBD results indicated that there was no strong substructuring of
genetic variation based on habitat, providing evidence for ongo-
ing gene flow among populations. As expected given more rapid
coalescence for markers with smaller effective population size,
mitochondrial data suggested higher overall levels of population
structure than nuclear data, but the hierarchical distributions of
genetic variation were nearly identical for nuclear and mitochon-
drial markers. For the nuclear dataset �ST = 0.12 (P < 0.001),
�SC = 0.09 (75% of �ST, P < 0.001), and �CT = 0.03 (25% of
�ST, P < 0.005). For the mitochondrial dataset �ST = 0.51 (P <
0.001), �SC = 0.46 (90% of �ST, P < 0.001), and �CT = 0.10
(20% of �ST, P > 0.05). Global estimates of �ST and �SC for
both mitochondrial and nuclear datasets indicated that individuals
in different habitats did not exhibit higher levels of differentia-
tion than individuals within habitats. Further, the relative effect
EVOLUTION DECEMBER 2007 2977

ERICA B. ROSENBLUM ET AL.
Table 2. Results from pairwise and partial Matrix Correspondence Tests for one mitochondrial locus (mtDNA) and 19 nuclear loci (nucDNA).
For each test, the correlation coefficient (r) and P-value (P) are given. Asterisks (∗) indicate statistically significant results following
Bonferroni correction for multiple comparisons.
Matrix Correspondence Test mtDNA r mtDNA P nucDNA r nucDNA P
Partial: phenotype and habitat given genotype 0.87 0.0001∗ 0.80 0.0001∗
Pairwise: phenotype and habitat 0.86 0.0001∗ 0.86 0.0001∗
Pairwise: phenotype and genotype 0.35 0.022 0.59 0.0001∗
Pairwise: habitat and genotype 0.18 0.233 0.56 0.0001∗
of permuting populations among habitat groups (�CT), the per-
mutation of greatest interest, was the smallest for both datasets
(and statistically undifferentiated from zero in the mitochondrial
dataset). AMOVA therefore indicated that most genetic variation
was found within and among populations rather than among dif-
ferent habitat groups. IBD analyses showed that there was a statis-
tically significant relationship between FST [FST/(1 − FST)] and
geography [Log(geographic distance)] for both nuclear and mito-
chondrial data [nuclear data: r2 = 0.33, P <0.001; mtDNA data:
r2 = 0.16, P <0.005)]. Overall, IBD analyses are consistent with
a model of gene flow in which migrants are exchanged among
geographically proximate populations, regardless of habitat
characteristics.
Previous studies have shown that color variation is not due to
phenotypic plasticity (Rosenblum 2005). To determine whether
patterns of phenotypic divergence among habitats are due to drift,
or whether divergent selection should be invoked, we used MCTs
(MCTs, Table 2). As predicted, the pairwise comparison between
the phenotype and habitat matrices was highly significant. Pair-
wise comparisons between phenotype and genetic matrices and
between habitat and genetic matrices were not significant for the
mitochondrial dataset, indicating again that mitochondrial varia-
tion was not well correlated with habitat boundaries. For nuclear
data, the pairwise comparisons between habitat and genetic matri-
ces and between phenotype and genetic matrices were statistically
significant. However, the salient result is that phenotypic variation
Table 3. Summary statistics for the 19 nuclear loci (nucDNA) and the single mitochondrial locus (mtDNA). Number of individuals (No.
Inds), number of variable sites (No. Var Sites), � (Tamura and Nei) and Watterson’s � are given for all combined samples, all combined
dark soil samples (populations G-J in Fig. 1), non-Tularosa Basin dark soil subsample (populations I, J), Tularosa Basin dark soil subsample
(populations G, H), white sand samples (populations A-C), and black lava samples (populations D-F).
Populations Sampled mtDNA mtDNA mtDNA mtDNA nucDNA nucDNA nucDNA nucDNANo. Inds No. Var. Sites � � No. Inds No. Var Sites � �
All Combined 89 64 0.0215 0.0156 91 191 0.0065 0.0074Dark Soil Combined 36 57 0.0241 0.0169 37 148 0.0063 0.0068Non-Tularosa Basin Dark Soil 17 25 0.0149 0.0091 17 105 0.0058 0.0047Tularosa Basin Dark Soil 19 46 0.0238 0.0162 20 112 0.0064 0.0065White Sand 29 26 0.0060 0.0082 29 119 0.0056 0.0059Black lava 24 10 0.0026 0.0033 25 115 0.0060 0.0054
(lizard color) was significantly correlated with habitat variation
(substrate color) even when controlling for the effects of genetic
variation (pairwise population FST) for both nuclear and mito-
chondrial datasets. In other words, phenotypic variation was bet-
ter explained by environmental variation than by neutral genetic
variation, exactly as predicted with strong, recent selection.
RECONSTRUCTING THE DEMOGRAPHIC SIGNATURE
OF COLONIZATION
Summary metrics of nuclear and mitochondrial diversity are pre-
sented in Table 3 and provide complementary perspectives on
the demographic history of populations inhabiting novel environ-
ments in the Tularosa Basin. For multilocus nuclear data, levels of
nucleotide diversity and nucleotide polymorphism were surpris-
ingly similar among habitats, and standard deviations of � and
� for all three habitat types were overlapping (Table 3, Fig. 3).
A stronger signal of reduced diversity in novel habitats was re-
covered with mitochondrial DNA. Populations in white sand and
black lava habitats did exhibit significant reductions in both nu-
cleotide diversity and nucleotide polymorphism at ND4 relative
to those in the Tularosa Basin dark soil and the combined dark
soil samples (Table 3, Fig. 3). This is particularly informative for
Watterson’s �, which is normalized for differences in sample sizes
among habitats. The mitochondrial data also revealed lower values
of � and � for black lava populations than white sand populations,
a pattern not seen with nuclear markers.
2978 EVOLUTION DECEMBER 2007

COLONIZATION OF NOVEL HABITATS
nucDNAmtDNA
Watters
on's
Theta
0
0.005
0.010
0.015
0.020
0.025
All WhiteSand
Black Lava
Dark Soil
Habitat
All WhiteSand
Black Lava
Dark Soil
0
0.002
0.004
0.006
0.008
0.010
Figure 3. Comparison of Watterson’s � for the total pooled sample and for subsamples of individuals inhabiting dark soil, white sand,
and black lava habitat for nuclear and mitochondrial loci.
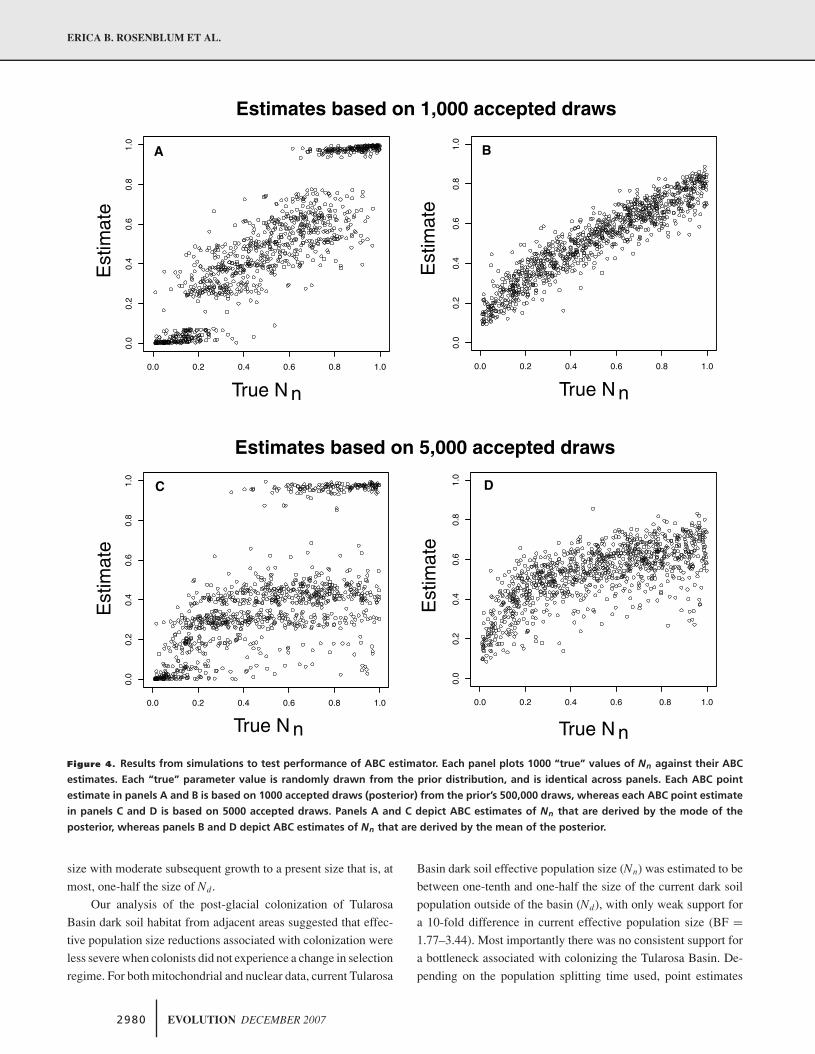
The ABC simulation analysis of performance suggested that
reliable estimates can be obtained with 1000 accepted draws from
the prior (0.2% of K = 500,000 simulated draws from the prior);
using the local regression algorithm, these estimates are moder-
ately close to their true value (Fig. 4A). Only results from the local
regression algorithm are presented because the simple rejection
sampling method did not perform as well. Although the correla-
tion between true values and corresponding estimates was more
consistent with estimates based on the means, there was a notable
upward bias if the true values were < 0.2 and downward bias if
true values were > 0.2 (Fig. 4B). In contrast, the estimates based
on the modes show the opposite pattern of bias (Fig. 4A). We
choose to report both types of posterior summaries for the empir-
ical data. We also explored the utility of using of means and vari-
ances (across loci) of our seven summary statistics instead of the
vector D, but these simulation results showed that this summary
of the data yields a much less reliable ABC estimator (not shown).
Although simple summary statistics only revealed strong ev-
idence for reduced diversity in the novel habitats when calculated
with mitochondrial data, the ABC analyses based on a wider array
of summary statistics recovered signatures of small population
size during the colonization phase for both novel habitats. This
result was evident for both nuclear and mitochondrial datasets,
although the strength of inference was more pronounced with the
mtDNA data (Table 4, Fig. 5). A genetic signature of reduced
effective population size was recovered for both white sand and
black lava habitats. In each novel habitat, both founding effective
population size (Nb) and current effective population size (Nn)
were inferred to be small (relative to Nd), suggesting strong initial
bottlenecks with partial but incomplete recovery. Again, we note
that these inferences on population size allow for effects of post-
colonization migration between populations in each novel habitat
and the surrounding dark soil environment. Results from each
novel environment are detailed below and presented in Table 4
and Figure 5.
In the white sand habitat, current effective population size
(Nn) was estimated from nuclear data to be approximately one-half
the effective size of the current Tularosa Basin dark soil popula-
tion (Nd), and was inferred with mitochondrial data to be between
one-tenth and one-third of Nd. The differences in magnitude be-
tween nuclear and mtDNA estimates of Nn were corroborated
by the higher Bayes factors given the mtDNA data (BF = 2.72–
3.68 for mtDNA whereas BF = 0.36–0.72 for nucDNA). The
stronger inference given mtDNA data was also found when esti-
mating Nb. Mitochondrial data suggested a dramatic population
reduction (with point estimates between 0.01 and 0.19) associated
with colonization, and this inference was strongly supported by
Bayes factors (BF = 7.6–12.1). Conversely nuclear data provided
weaker evidence for small historical effective population sizes
in this habitat (BF = 0.02–2.88) particularly for the model em-
ploying the maximal age of white sand formation (10,000 ybp).
Thus, there was evidence for an overall reduction in the size of
the blanched population on white sands relative to the surrounding
source population, but the signature of the initial bottleneck was
less pronounced in the nuclear data.
In the black lava habitat, current effective population size (Nn)
was estimated from nuclear data to be approximately one-half the
size of the current Tularosa Basin dark soil population (Nd), and
was inferred with mitochondrial data to be between one-tenth and
one-half of Nd. Similar to patterns at white sands, Bayes factors
provided only weak support for 10-fold reduced current effective
population sizes (BF = 1.27–2.67 for mtDNA and BF = 0.30–
1.24 for nucDNA). However, both nuclear and mitochondrial se-
quences provided strong support for dramatic historical reduction
in effective population size (Nb) in the black lava habitat. Point
estimates for Nb were small (0.09–0.22 for nuclear loci; 0.00–
0.17 for mtDNA), and Bayes factors provided strong support for
the hypothesis of a bottleneck associated with colonization (BF
= 5.86–21.40). In sum, for the melanic population on black lava,
evidence points to a very small colonizing effective population
EVOLUTION DECEMBER 2007 2979
ERICA B. ROSENBLUM ET AL.
0.0 0.2 0.4 0.6 0.8 1.0
0.0
0.2
0.4
0.6
0.8
1.0
0.0 0.2 0.4 0.6 0.8 1.0
0.0
0.2
0.4
0.6
0.8
1.0
Est
imat
eE
stim
ate
True N n
True N n
Estimates based on 1,000 accepted draws
Estimates based on 5,000 accepted draws
A
C
0.0 0.2 0.4 0.6 0.8 1.0
0.0
0.2
0.4
0.6
0.8
1.0
Est
imat
e
True N n
B
0.0 0.2 0.4 0.6 0.8 1.0
0.0
0.2
0.4
0.6
0.8
1.0
Est
imat
e
True N n
D
Figure 4. Results from simulations to test performance of ABC estimator. Each panel plots 1000 “true” values of Nn against their ABC
estimates. Each “true” parameter value is randomly drawn from the prior distribution, and is identical across panels. Each ABC point
estimate in panels A and B is based on 1000 accepted draws (posterior) from the prior’s 500,000 draws, whereas each ABC point estimate
in panels C and D is based on 5000 accepted draws. Panels A and C depict ABC estimates of Nn that are derived by the mode of the
posterior, whereas panels B and D depict ABC estimates of Nn that are derived by the mean of the posterior.
size with moderate subsequent growth to a present size that is, at
most, one-half the size of Nd.
Our analysis of the post-glacial colonization of Tularosa
Basin dark soil habitat from adjacent areas suggested that effec-
tive population size reductions associated with colonization were
less severe when colonists did not experience a change in selection
regime. For both mitochondrial and nuclear data, current Tularosa
Basin dark soil effective population size (Nn) was estimated to be
between one-tenth and one-half the size of the current dark soil
population outside of the basin (Nd), with only weak support for
a 10-fold difference in current effective population size (BF =1.77–3.44). Most importantly there was no consistent support for
a bottleneck associated with colonizing the Tularosa Basin. De-
pending on the population splitting time used, point estimates
2980 EVOLUTION DECEMBER 2007

COLONIZATION OF NOVEL HABITATS
Table 4. Point estimates and Bayes factors (BF) from ABC analyses. Results are given for two estimations of effective population size
relative to the current population size in the dark soil habitat (Nd): current effective population size of the novel habitat (Nn) and historical
effective population size of the novel habitat near the time of colonization (Nb). For each model, BFs are used to test the hypotheses of
extreme (> 1/10) population reductions. Finally, results are given for two geologically plausible population splitting times in each habitat
(i.e., minimum and maximum ages of the formations): 5000 versus 10,000 ybp for the white sands formation and 2000 versus 5000 ybp
for the black lava formation.
Estimator White sand White sand White sand White sand Black lava Black lava Black lava Black lavamtDNA mtDNA nucDNA nucDNA mtDNA mtDNA nucDNA nucDNA(5000 ybp) (10,000 ybp) (5000 ybp) (10,000 ybp) (2000 ybp) (5000 ybp) (2000 ybp) (5000 ybp)
Nn (mode) 0.06 0.06 0.41 0.55 0.15 0.08 0.56 0.26(mean) 0.37 0.33 0.51 0.61 0.46 0.38 0.60 0.41BF (10-fold reduction) 2.72 3.68 0.36 0.72 1.47 2.61 0.30 1.24Nb (mode) 0.01 0.02 0.04 0.64 0.00 0.12 0.01 0.00(mean) 0.13 0.19 0.31 0.65 0.14 0.17 0.22 0.09BF (10-fold reduction) 12.09 7.62 2.88 0.02 12.65 5.86 6.02 21.40
for Nb ranged from 0.01 to 0.98 and Bayes factors from 0.02 to
5.50.
Finally comparison between ABC and IM results for mito-
chondrial data suggests that our conclusions are robust to analysis
method. Comparable to our ABC inference that current effective
population sizes in the novel habitats (Nn) are smaller than that
of the Tularosa Basin dark soil population (Nd), theta in the novel
habitats (“q1”) was inferred by IM to be smaller than theta in the
nucDNA
0.0
0.5
1.0
0.0
0.5
1.0
0.5
1.0
1.5
2.0
0.0
0.5
1.0
0.0
1.0
0.5
1.0
1.5
2.0
0.0
0.5
1.0
0.0
0.5
1.0
1
2
3
mtDNA
0.0
0.5
1.0
0.0
0.5
1.0
1
2
3
NbNn
0.0
0.5
1.0
0.0
0.5
1.0
1
2
3
0.0
0.5
1.0
0.0
0.5
1.0
1
2
3
0.00.2
0.4
0.6
0.8
0.0
0.5
1.0
1
2
3
4
0.0
0.5
1.0
0.0
0.5
1.0
0.5
1.0
1.5
2.0
Join
t Pos
terio
r
Den
sity
NbNn
Join
t Pos
terio
r
Den
sity
0.5
White Sand Black Lava
5,000 10,000 2,000 5,000
Figure 5. Joint posterior summary graphs from ABC analysis for both mitochondrial (top row) and nuclear (bottom row) datasets. For
each novel habitat, the left column shows results from the minimum populations splitting time and the right column shows results from
the maximum population splitting time. Axis labels shown on leftmost plots: “Nb” represents relative historical effective population size,
“Nn” represents relative current effective population size, and “Joint Posterior Density” represents the joint posterior probability of Nb
and Nn given the data vector D.
dark soil population (“q2”). In fact IM point estimates for relative
population sizes in the colonized habitats (“q1/q2” = 1/3 − 1/20)
were quite similar to those obtained with ABC. Comparable to
our ABC inference that historical effective population sizes (Nb)
were small in the novel habitats, the proportion of the ancestral
population that was inferred by IM to found the novel populations
(“1 − s”) was extremely small (point estimates ranging from 0.005
to 0.0015). Finally, both ABC and IM results suggested greater
EVOLUTION DECEMBER 2007 2981

ERICA B. ROSENBLUM ET AL.
reductions in population size associated with colonizing the novel
habitats than with colonizing the Tularosa Basin itself.
DiscussionAlthough genetic and historical data have been combined previ-
ously to infer colonization histories (e.g., Estoup et al. 2004; Chan
et al. 2006), our study is novel in applying these methods to col-
onization of and adaptation to novel environments in the context
of continuing gene flow from the source population. That natural
selection has shaped among-habitat differences in color of S. un-
dulatus in this system is evident from the results of MCTs, which
showed that phenotypic variation was best explained by environ-
mental variation. We substantiated the hypothesis that gene flow
has been unhampered by habitat boundaries by the good fit of the
neutral genetic data to an IBD model and by the relative lack of ge-
netic differentiation among habitats recovered by an AMOVA. An
indication that colonization of white sand and black lava habitats
may have been associated with population reductions came from
reduced diversity of mitochondrial DNA in novel environments,
the black lava in particular. However, the strongest evidence for
transient or sustained reductions in effective population size asso-
ciated with the colonization of white sand and black lava habitats
came from ABC analyses based on a model that was explicitly de-
signed to incorporate biological and geological information about
this system. The signatures of small effective population sizes in
the novel habitats are particularly compelling given how difficult it
is to detect historical reductions in population size in the presence
of continuing migration (e.g., Bjorklund 2003).
Although signatures of population reductions were observed
for both novel habitats in the Tularosa Basin, we also observed
relatively high levels of genetic diversity. For example � estimates
calculated from nuclear markers for both novel habitats and for
the overall sample were all close to 0.006, nearly an order of mag-
nitude higher than that observed in humans (� = 0.00075, The
International SNP Map Working Group 2001). There are a num-
ber of mechanisms that could account for the relatively high levels
of current nucleotide variability while still remaining consistent
with our inference that populations in white sand and black lava
environments passed through a period of small effective popu-
lation size: for example, initial colonization by a small but ge-
netically diverse group of founders, multiple colonization events,
post-colonization population expansion, and ongoing gene flow.
One mechanism directly implied by our data is population expan-
sion. The ABC inference of population reductions in both novel
habitats looking backward in time is equivalent to a population ex-
pansion looking forward in time. Population expansion associated
with colonization of the novel Tularosa Basin habitats is consis-
tent with the observation that directional selection coupled with an
opportunity for population growth accompanies many examples
of rapid evolution (Reznick and Ghalambor 2001). Although no
direct test of the ecological community assemblage at the time of
colonization is possible, a less-diverse lizard community is found
on the white sand and black lava formations compared to the sur-
rounding dark soil habitat (E. Rosenblum, pers. obs.; Dixon 1967).
If S. undulatus was one of only few ecologically similar species
able to establish in the novel environments for ecological or adap-
tive reasons, exploitation of resources in these habitats could have
allowed for rapid population expansion following colonization. It
may also be that migration rates are sufficient to retain genetic di-
versity and population viability, but not so large as to overwhelm
local adaptation (Lenormand 2002; Holt et al. 2004). Uncertainty
about migration was incorporated in the ABC model presented
here but migration rates were not explicitly estimated; the balance
between selection and gene flow in this system is the subject of
future work with different analytical methods (e.g., cline analysis).
The broad-brush demographic and adaptive patterns observed
in the white sand and black lava habitats are remarkably sim-
ilar, suggesting that the signature of colonization is somewhat
predictable even in populations with complex histories. In both
habitats dorsal coloration evolved to better match substrate col-
oration, in both habitats there is evidence for a period of small
effective population size followed by moderate recovery, in both
habitats mitochondrial markers recorded more extreme reductions
in genetic diversity than did nuclear markers, and in both habi-
tats high levels of nuclear diversity were largely maintained during
the colonization process or recovered by subsequent immigration.
However, we also observed some important differences in demo-
graphic history between habitats. Most notably, the signature from
the nuclear data of a population bottleneck near the time of col-
onization was stronger for the black lava population than for the
white sand population. Although evidence of reduced effective
population size associated with colonization was recovered with
mitochondrial data for the white sand population, nuclear data did
not provide consistent support for a dramatic bottleneck in this
habitat. Additionally estimates of � and � based on mitochon-
drial data were significantly smaller for the black lava population
compared to the white sand population. Data therefore suggest
that a more dramatic population reduction, possibly followed by a
more rapid population recovery, was associated with colonization
or adaptation to the black lava habitat.
There are several possible explanations for why populations
colonizing the black lava environment may have suffered a greater
initial reduction in population size, more rapid subsequent popu-
lation growth, or why we have a clearer ability to detect effective
population size changes in this habitat. First, the greater potential
age of the white sands system may mean that earlier demographic
events have been obscured by subsequent migration from dark
2982 EVOLUTION DECEMBER 2007
COLONIZATION OF NOVEL HABITATS
soil populations or mutation accumulation. Second, although the
sizes of the white sand and black lava formations are compara-
ble, the lava formation is fairly linear whereas the sand formation
is more circular. Theoretical studies have demonstrated that ge-
netic diversity and effective population size can be correlated with
habitat geometry (Wilkins 2004) and proximity to habitat edge
(Wilkins and Wakeley 2002). For example, the larger edge to area
ratio of the black lava habitat could have resulted in higher post-
colonization immigration rates, facilitating population recovery
after an initial bottleneck (Holt et al. 2004; Alleaume-Benharira
et al. 2006). Third, there may have been differences in the strength
of natural selection between the black lava and the white sand
environments that could explain the more dramatic historical bot-
tleneck in the black lava habitat. For example, the geometry of
the black lava formation provides more vegetated edge habitat for
avian predators and could have lead to higher predator-induced
mortality rates. Finally, there may have been differences in the
genetic architecture of color traits in the black lava and the white
sand environments. For example, levels of standing genetic varia-
tion for color traits, the number of genes contributing to blanched
versus melanic coloration, the tempo and effect size of substi-
tutions at these genes, and allelic dominance patterns all could
influence the speed with which populations approached local dor-
sal color optima. Tests for association between novel phenotypes
and a candidate locus, Mc1r, revealed a significant, but incomplete
association between Mc1r genotype and the blanched phenotype
but not the melanic phenotype, suggesting that the genetic basis
of the two novel phenotypes may be different (Rosenblum et al.
2004; E. B. Rosenblum, unpubl. data).
Our study addresses the question of whether effective popu-
lation sizes are reduced during colonization of, and adaptation to,
novel environments. Half a century ago, Haldane formalized the
idea that natural selection may extract a demographic “price” from
a population experiencing a change in selection regime (Haldane
1957; see also Pease et al. 1989; Burger and Lynch 1995; Lande
and Shannon 1996). Simply put, the fixation of alleles conferring
fitness advantages in novel environments is not instantaneous, and
the mortality associated with phenotypes that are poorly adapted
can be high (depending on the genetic basis of the selected trait
and whether fitness is density dependent). Thus, even populations
that persist through environmental change likely experience a pe-
riod of negative growth and may retain a demographic signature
of natural selection. Similarly, gene flow from adjacent sources
may retard local adaptation and lengthen the period a colonizing
population is suffering the high demographic costs of maladap-
tation (Lenormand 2002). Here we have demonstrated evidence
for reductions in two S. undulatus populations that have been
subject to strong natural selection and ongoing gene flow. Of par-
ticular interest are the small effective population sizes observed
in the novel habitats relative to that in the dark soil population,
which colonized the Tularosa Basin in the last 12,000 years but did
not experience a change in selection regime. Additionally, results
suggest that colonization coupled with selection (i.e., dark soil
ancestors moving into white sand and black lava habitats) led to
more dramatic population reductions than colonization alone (i.e.,
dark soil ancestors moving into newly available dark soil habitat).
Empirical analysis of changes in effective population size in other
populations will begin to shed light on how selection, gene flow,
and population demography interact during the establishment and
persistence of populations in novel environments.
ACKNOWLEDGMENTSWe thank M. Slatkin, N. Belfiore, A. Estoup, and J. Novembre for helpfuldiscussion on SNP data collection and analysis. We thank M. Kiparsky,C. Colvin, and D. Betz for assistance in the field. Funding for this workwas provided by a National Science Foundation Doctoral DissertationImprovement Grant (to EBR, #DEB-0309327), the Museum of VertebrateZoology (to MJH), and income from the Walter and Virginia Gill Chair(to CM).
LITERATURE CITEDAlleaume-Benharira, M., I. R. Pen, and O. Ronce. 2006. Geographical patterns
of adaptation within a species’ range: interactions between drift and geneflow. J. Evol. Biol. 19:203–215.
Beaumont, M. A., W. Zhang, and D. J. Balding. 2002. Approximate Bayesiancomputation in population genetics. Genetics 162:2025–2035.
Bennett, A. T. D., and I. C. Cuthill. 1994. Ultraviolet vision in birds: what isits function? Vision Res. 34:1471–1478.
Bjorklund, M. 2003. Test for a population expansion after a drastic reductionin population size using DNA sequence data. Heredity 91:481–486.
Burger, R., and M. Lynch. 1995. Evolution and extinction in a changing envi-ronment: a quantitative-genetic analysis. Evolution 49:151–163.
Castellano, S., and E. Balletto. 2002. Is the partial Mantel test inadequate?Evolution 56:1871–1873.
Chan, Y., C. Anderson, and E. Hadly. 2006. Bayesian estimation of the timingand severity of a population bottleneck from ancient DNA. PLoS Genet.2:451–460.
Cuthill, I. C., A. T. D. Bennett, J. C. Partridge, and E. J. Maier. 1999. Plumagereflectance and the objective assessment of avian sexual dichromatism.Am. Nat. 153:183–200.
Dixon, J. R. 1967. Aspects of the biology of the lizards of the White Sands,New Mexico. Contrib. Sci. 129:1–22.
Estoup, A., I. J. Wilson, C. Sullivan, J.-M. Cornuet, and C. Moritz. 2001. Infer-ring population history from microsatellite and enzyme data in seriallyintroduced cane toads, Bufo marinus. Genetics 159:1671–1687.
Estoup, A., M. Beaumont, F. Sennedot, C. Moritz, and J.-M. Cornuet. 2004.Genetic analysis of complex demographic scenarios: spatially expandingpopulations of the cane toad, Bufo marinus. Evolution 58:2021–2036.
Excoffier, L., A. Estoup, and J.-M. Cornuet. 2005a. Bayesian analysis of anadmixture model with mutations and arbitrarily linked markers. Genetics169:1727–1738.
Excoffier, L., G. Laval, and S. Schneider. 2005. Arlequin ver. 3.0b: anintegrated software package for population genetics data analysis.Evol. Bioinformatics Online 1:47–50; available at http://cmpg.unibe.ch/software/arlequin3/.
Fu, Y.-X., and W.-H. Li. 1997. Estimating the age of the common ancestor ofa sample of DNA sequences. Mol. Biol. Evol. 14:195–199.
EVOLUTION DECEMBER 2007 2983

ERICA B. ROSENBLUM ET AL.
Gaggiotti, O. E., S. P. Brooks, W. Amos, and J. Harwood. 2004. Com-bining demographic, environmental and genetic data to test hypothe-ses about colonization events in metapopulations. Mol. Ecol. 13:811–825.
Gelman, A., J. B. Carlin, H. S. Stern, and D. B. Rubin. 2004. Bayesian dataanalysis. Chapman and Hall/CRC, Boca Raton, FL.
Grill, C. P., and V. N. Rush. 2000. Analysing spectral data: comparison andapplication of two techniques. Biol. J. Linn. Soc. 69:121–138.
Groombridge, J., C. Jones, M. Bruford, and R. Nichols. 2000. ‘Ghost’ allelesof the Mauritius kestrel. Nature 403:616.
Hadly, E. A., U. Ramakrishnan, Y. L. Chan, M. van Tuinen, K. O’Keefe, P.A. Spaeth, and C. J. Conroy. 2004. Genetic response to climatic change:insights from ancient DNA and phylochronology. PLoS Biol. 2:1600–1609.
Haldane, J. 1957. The cost of natural selection. J. Genetics 55:511–524.Hickerson, M. J., E. Stahl, and H. A. Lessios. 2006. Test for simultaneous di-
vergence using approximate Bayesian computation. Evolution 60:2435–2453.
Holt, R. D., T. M. Knight, and M. Barfield. 2004. Allee effects, immigration,and the evolution of species’ niches. Am. Nat. 163:253–262.
Hudson, R. R., and N. L. Kaplan. 1985. Statistical properties of the numberof recombination events in the history of a sample of DNA sequences.Genetics 111:147–164.
International SNP Map Working Group. 2001. A map of human genomesequence variation containing 1.42 million single nucleotide polymor-phisms. Nature 409:928–933.
Kocurek, G., M. Carr, R. Ewing, K. G. Havholm, Y. C. Nagar, and A. K.Singhvi. White Sands Dune Field, New Mexico: age, dune dynamicsand recent accumulations. Sediment. Geol.(In press)
Kuhner, M. K. 2006. LAMARC 2.0: maximum likelihood and Bayesianestimation of population parameters. Bioinformatics 22:768–770.
Kuhner, M. K., J. Yamato, and J. Felsenstein. 1998. Maximum likelihoodestimation of population growth rates based on the coalescent. Genetics149:429–434.
Lande, R., and S. Shannon. 1996. The role of genetic variability in adapta-tion and population persistence in a changing environment. Evolution50:434–437.
Leache, A. D., and T. W. Reeder. 2002. A comparison of parsimony, likelihood,and Bayesian approaches. Syst. Biol. 51:44–68.
Lenormand, T. 2002. Gene flow and the limits to natural selection. TrendsEcol. Evol. 17:183–189.
Lewis, T. H. 1949. Dark coloration in the reptiles of the Tularosa malpais,New Mexico. Copeia 3:181–184.
Loader, C. 1996. Local likelihood density estimation. Ann. Stat. 24:1602–1618.
Lowe, C. H., and K. S. Norris. 1956. A subspecies of the lizard Sceloporusundulatus from the white sands of New Mexico. Herpetologica 12:125–127.
Luke, C. A. 1989. Color as a phenotypically plastic character in the Side-blotched Lizard, Uta stansburiana. Unpublished Ph.D. Dissertation,Univ. of California at Berkeley, Berkeley, CA.
Nei, M., and W.-H. Li. 1979. Mathematical model for studying genetic varia-tion in terms of restriction endo nucleases. Proc. Natl. Acad. Sci. USA76:5269–5273.
Nosil, P., and B. J. Crespi. 2004. Does gene flow constrain adaptive divergenceor vice versa? A test using ecomorphology and sexual isolation in Timemacristinae walking-sticks. Evolution 58:102–112.
Nosil, P., T. H. Vines, and D. J. Funk. 2005. Perspective: reproductive isolationcaused by natural selection against immigrants from divergent habitats.Evolution 59:705–719.
Pease, C. M., R. Lande, and J. J. Bull. 1989. A model of population growth,dispersal and evolution in a changing environment. Ecology 70:1657–1664.
Plagnol, V., and S. Tavare. 2002. Approximate Bayesian computation andMCMC. Pp. 99–114 In H. Neiderreiter, ed. Monte Carlo and quasi-Monte Carlo methods. Springer-Verlag.
Polanski, A., M. Kimmel, and R. Chakraborty. 1998. Application of a time-dependent coalescence process for inferring the history of populationsize changes from DNA sequence data. Proc. Natl. Acad. Sci. USA95:5456–5461.
R Development Core Team. 2004. R: A language and environment for statis-tical computing. http://www.R-project.org, Vienna.
Ramakrishnan, U., E. A. Hadly, and J. L. Mountain. 2005. Detecting pastpopulation bottlenecks using temporal genetic data. Mol. Ecol. 14:2915–2922.
Raufaste, N., and F. Rousset. 2001. Are partial mantel tests adequate?. Evolu-tion 55:1703–1705.
Reznick, D. N., and C. K. Ghalambor. 2001. The population ecology of con-temporary adaptations: what empirical studies reveal about the condi-tions that promote adaptive evolution. Genetica 112–113:183–198.
Rosenblum, E. B. 2005. The role of phenotypic plasticity in color variation ofTularosa Basin lizards. Copeia 2005:586–596.
——— 2006. Convergent evolution and divergent selection: lizards at thewhite sands ecotone. Am. Nat. 167:1–15.
Rosenblum, E. B., H. E. Hoekstra, and M. W. Nachman. 2004. Adaptive reptilecolor variation and the evolution of the Mc1r gene. Evolution 58:1794–1808.
Rosenblum, E. B., N. Belfiore, and C. Moritz. 2007. Anonymous nuclearmarker discovery in the Eastern Fence Lizard, Sceloporus undulatus.Mol. Ecol. Notes 7:113–116.
Rousset, F. 1997. Genetic differentiation and estimation of gene flow fromF-statistics under isolation by distance. Genetics 145:1219–1228.
——— 2002. Partial Mantel tests: reply to Castellano and Balletto. Evolution56:1874–1875.
Rozas, J., J. C. Sanchez-DelBarrio, X. Messeguer, and R. Rozas. 2003. DnaSP,DNA polymorphism analyses by the coalescent and other methods.Bioinformatics 19:2496–2497.
Schneider, S., D. Roessli, and L. Excoffier. 2000. Arlequin ver. 2.000: a soft-ware for population genetics data analysis, Genetics and Biometry Lab-oratory, Univ. of Geneva, Switzerland.
Smouse, P. E., J. C. Long, and R. R. Sokal. 1986. Multiple regression andcorrelation extensions of the Mantel test of matrix correspondence. Syst.Zool. 35:627–632.
Stephens, M., and P. Donnelly. 2003. A comparison of Bayesian methods forhaplotype reconstruction from population genotype data. Am. J. Hum.Genet. 73:1162–1169.
Storz, J. F. 2002. Contrasting patterns of divergence in quantitative traits andneutral DNA markers: analysis of clinal variation. Mol. Ecol. 11:2537–2551.
Tajima, F. 1983. Evolutionary relationship of DNA sequences in finite popu-lations. Genetics 105:437–460.
———. 1989. Statistical method for testing the neutral mutation hypothesisby DNA polymorphism. Genetics 123:585–595.
Takahata, N., and M. Nei. 1985. Gene genealogy and variance of interpopu-lational nucleotide differences. Genetics 110:325–344.
Tallmon, D. A., G. Luikart, and M. A. Beaumont. 2004. Comparative evalua-tion of a new effective population size estimator based on approximateBayesian computation. Genetics 167:977–988.
Tamura, K., and M. Nei. 1993. Estimation of the number of nucleotide sub-stitutions in the control region of mitochondrial DNA in humans andchimpanzees. Mol. Biol. Evol. 10:512–526.
2984 EVOLUTION DECEMBER 2007

COLONIZATION OF NOVEL HABITATS
Thorpe, R. S., H. Black, and A. Malhotra. 1996. Matrix correspondence testson the DNA phylogeny of the Tenerife lacertid elucidate both historicalcauses and morphological adaptation. Syst. Biol. 45:335–343.
Tufto, J. 2001. Effects of releasing maladapted individuals: a demographic-evolutionary model. Am. Nat. 158:331–340.
Watterson, G. A. 1975. On the number of segregating sites in genetical modelswithout recombination. Theor. Popul. Biol. 7:256–276.
Weiss, G., and A. Von Haeseler. 1998. Inference of population history usinga likelihood approach. Genetics 149:1539–1546.
Wilkins, J. F. 2004. A separation-of-timescales approach to the coalescent ina continuous population. Genetics 168:2227–2244.
Wilkins, J. F., and J. Wakeley. 2002. The coalescent in a continuous, finite,linear population. Genetics 161:873–888.
Zimbelman, J. R., and A. K. Johnston. 2001. Improved topography of the Car-rizozo lava flow: implications for emplacement conditions. New MexicoMus. Nat. Hist. Sci. 18:131–136.
Associate Editor: A. Mooers
EVOLUTION DECEMBER 2007 2985