a model for analyzing emerging - new york university...
TRANSCRIPT
A Model for Analyzing Emerging A Model for Analyzing Emerging A Model for Analyzing Emerging A Model for Analyzing Emerging Market Corporate CreditsMarket Corporate CreditsMarket Corporate CreditsMarket Corporate Credits
Dr. Edward Altman
NYU Stern School of Business

A Model for Analyzing Emerging Market Corporate Credits
Dr. Edward I. AltmanMax L. Heine Professor of Finance
New York UniversityLeonard N. Stern School of Business
212-998-0709Email: [email protected]
Website: http://www.stern.nyu.edu/~ealtman
Step 1: U.S. Bond Rating Equivalent
•Evaluate each bond by its EM Score and classify it as to its stand
alone U.S. bond rating equivalent. We use a model based on the
well documented and established U.S. Z-Score Approach
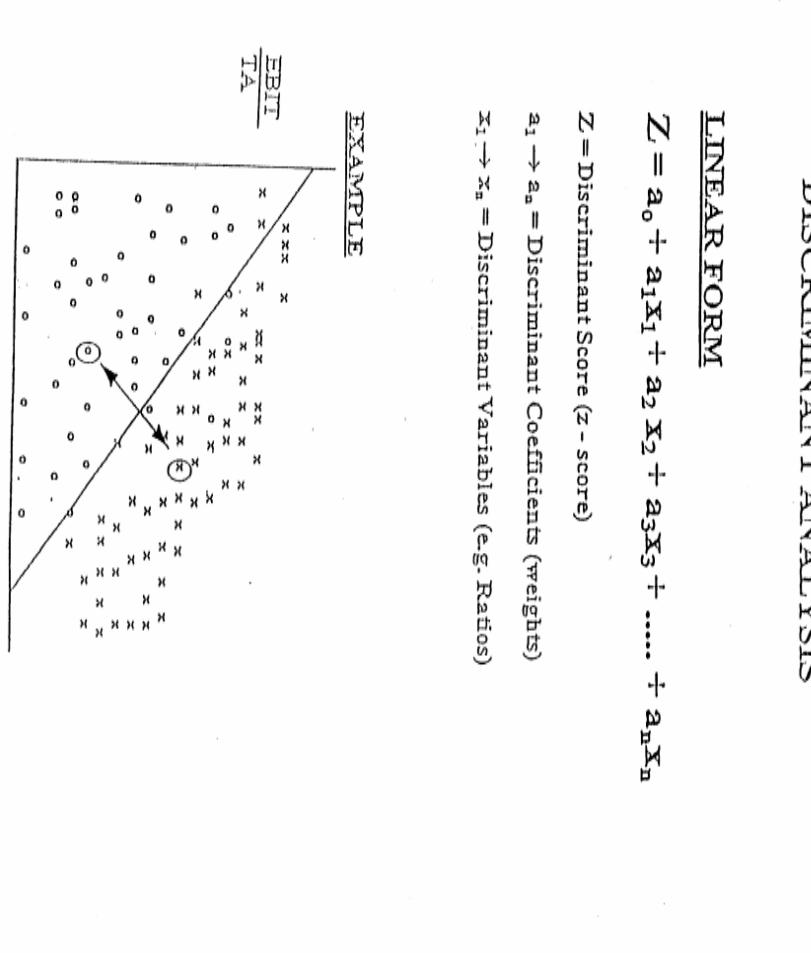

EM Score = 3.25 + 6.56 (X1) + (3.26) (X2) + 6.72 (X3) + 1.05 (X4)
Where X1 = Working Capital/Total Assets
X2 = Retained Earnings/Total Assets
X3 = EBIT/Total Assets
X4 = Book Value Equity/Total Liabilities
*An enhancement of E. Altman’s Z”-Score model, Corporate Financial Distressand Bankruptcy, John Wiley & Sons, N.Y. (1993), Chapter 8.
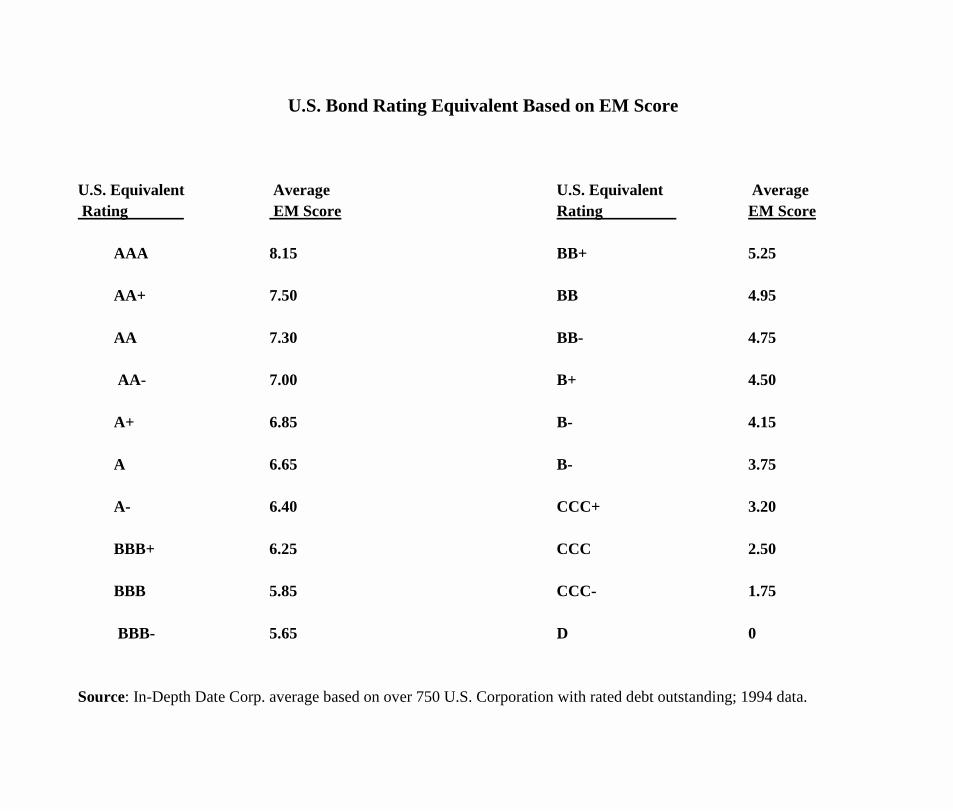
U.S. Bond Rating Equivalent Based on EM Score
U.S. Equivalent Average U.S. Equivalent AverageRating EM Score Rating EM Score
AAA 8.15 BB+ 5.25
AA+ 7.50 BB 4.95
AA 7.30 BB- 4.75
AA- 7.00 B+ 4.50
A+ 6.85 B- 4.15
A 6.65 B- 3.75
A- 6.40 CCC+ 3.20
BBB+ 6.25 CCC 2.50
BBB 5.85 CCC- 1.75
BBB- 5.65 D 0
Source: In-Depth Date Corp. average based on over 750 U.S. Corporation with rated debt outstanding; 1994 data.

Exhibit 1 – Mexican Corporate Issuers: EM Scores and Modified Ratings
DBBB+CCC-BBB+BB+A
BBB-B
BB-BB+BB-B-BB+BBB-BB-B+CCCBBB+B+AA+BB+B+A+BB+BBCCCCCC+
Modified Rating
NR/NR/NRNR/NR/BNR/NR/NRNR/NR/NRBa3/NR/NRBa2/NR/NRBa3/BB/BBNR/NR/NRNR/NR/NRNR/NR/NRNR/NR/CCCB3.NR/NRB1/BB-/B+NR/NR/NRBa2/NR/NRNR/NR/CCCNR/NR/NRBa2/NR/NRB1/BB-/NRNR/NR/NRNR/NR/NRNR/NR/NRNR/NR/NRBa2/BB-/NRNR/NR/NRNR/NR/NRNR/NR/CCCNR/NR/NR
DBBB-CCC
A-BB+AAABBB-BB-B
BB+BB-BBBBBBBB-BB+BB+CCC-AAB+
AAAA
BB-AAABB+BBB-BBB-B+CCC+
-4.425.542.596.375.408.485.574.674.235.284.684.855.965.565.185.171.597.294.518.966.644.789.855.345.515.454.423.34
AirlinesAuto ManufacturingAutopartsBottlingBottlingCementCementChemicalsConglomerateConglomerateConglomerateConstructionConstructionFood ProcessingGlassHotel and TourismTextile/ApparelCable and MediaPaper and Forest ProductsPaper and Forest ProductsPaper and Forest ProductsRetailRetailShippingSteelSteelSteelSteel Pipes
AeromexicoGrupo DinaSan LuisFemsaGemexApascoCemexCydsaDESCModernaSidekGMDEmpresas ICAGrumaVitroSiturSynkroTelevisaGIDUSA (Durango)Kimberly-Clark de MexicoPonderesaCCMLiverpoolTMMHylsamexUSASimecTAMSA
RatingsM/S&P/D&P
Bond-Rating Equivalent
EM Scores
IndustryCompany
NR: No rating: M: Moody’s; S&P: Standard & Poors; D&P: Duff & Phelps: Ratings are for senior long-term foreign debt Unless otherwise specified.Sources: Salomon Brothers Inc.

Step 2: Adjusted Bond Rating for Foreign Currency Fluctuation Vulnerability
•Each bond is analyzed as to the issuing firm’s vulnerability to problemsin servicing its foreign currency denominated debt if the local currencyis devalued
•Vulnerability is assessed based on (1) the relationship between non-localcurrency revenues minus costs compared to non-local currency interestexpense and (2) non-local currency revenues vs. non-local currency debt.Finally, (3) the level of cash is compared with the debt coming due in thenext year.
•If the firm has high vulnerability, e.g., low or zero non-local currencyrevenues and/or low or zero revenues/debt, and/or a substantial amountof foreign currency debt coming due with little cash liquidity, then the bond rating equivalent in step 1 is lowered by a full rating class, e.g.,BB+ to B+. Average vulnerability results in a one-notch, e.g., BB+ to BB,reduction. There is no upgrade for a good vulnerability assessment.
Step 3:Adjustment for Industry Risk
•The original (step 1) bond rating equivalent is compared to the generic
industry bond rating equivalent. For up to one full letter grade difference
between the two ratings, step 2’s bond rating equivalent is adjusted up or
down by one notch. For example, if the rating from step 1 is BBB and the
industry’s rating is BBB-, BB+, or BB, then the adjustment is one notch
down. If the difference is more than one full rating class but less than two
full ratings, there is a 2 –notch adjustment, etc.

Average Credit Safety of Industry Groups – Salomon Brothers
Average Sector Credit Safety12/94 12/00
Telecommunication High A High BBB1
Independent Finance High A Low ANatural Gas Utilities High A Low ABeverages High A Mid AHigh Quality Electric Utilities High A High BBBRailroads High A Low AFood Processing Mid A Mid BBBBottling Mid A Mid ADomestic Bank Holding Low A High ATobacco Low A Low BBMedium-Quality Electric Utilities Low A Mid BBBConsumer Products Industry Low A Mid AH.G. Diversified Mfg./Conglomerates Low A Low BBBLeasing Low A ----Auto Manufacturers Low A Mid BB
Chemicals Low A Low BB
Average Sector Credit Safety12/94 12/00
Energy Low A Mid BBBNatural Gas Pipelines High BBB Mid BBBPaper/Forest Products Mid BBB Low BBBRetail Mid BBB Mid BBP&C Insurance Mid BBB Mid BBAerospace/Defense Mid BBB Mid BBBInformation/Data Technology Mid BBB Mid BBBSupermarkets High BB High BBCable and Media High BB High BBBVehicle Parts High BB Mid BTextile/Apparel High BB Low BBLow-Quality Electric Utilities Mid BB Low BBGaming Mid BB Low BBRestaurants Mid BB Low BBConstruction Mid BB Mid BHotel/Leisure Mid BB Mid BBLow Quality Manufacturing Mid BB Mid BBAirlines Low BB Mid BBMetals High B -----
Source: Adapted from Six-Month Credit Quality Overview, Salomon Brothers Inc., January 18, 1995 and six month High-Grade Rankings, Salomon Smith Barney, January 2001 (terminology for rankings changed to numerical).
1Established telecommunications firms (Low B for most others)
Step 4:Adjustment for Competitive Position
•Step 3’s rating is adjusted up (or down) one notch if the firm is a dominant
(or not) company in its industry or if it is a domestic power in terms of
size, political influence and quality of management. It is possible that the
consensus competitive position result is neutral (no change in rating).

Step 5:Adjustment for Market Value vs. Book Value of Equity
Most Emerging Market Eurobond Issuers have public equity sharesoutstanding. Since market equity value should reflect expectations andbook equity reflects historical values, we adjust the bond rating equivalent (BRE) for the market/book equity ratio. EM Scores and their bond ratingequivalents are compared using the two measures of equity value. Wheresignificant differences manifest, a further adjustment is made:
Adjustment Process:
BRE (Book) vs. BRE (Market)
BRE Difference Adjustment
± 0,1 Notch = None
± 2 Notches = ± 1 Notch
≥≥≥≥ ± 3 Notches = ± 2 Notches
Step 6:Bond Specific Adjustment
•Any unique aspects of the bond, e.g., collateral, guarantees, etc., could
impact the final rating and spread.

Figure 1. Mexican Corporate Issuers – December 1995 Modified Ratings
NR/NR/NRNR/NR/NRBa2/NR/NRNR/NR/NRNR/NR/NRBa3/BB.BBNR/NR/NRNR/NR/BBNR/NR/NRB1/BB-/B+NR/NR/NRBa3/NR/NRB1/BB-/NRB3/NR/NRNR/NR/NRNR/NR/NRNR/NR/NRNR/NR/NRNR/NR/NRNR/NR/NRNR/NR/NRNR/NR/NRNR/NR/NRNR/NR/NRNR/NR/NRNR/NR/CCCNR/NR/CCCNR/NR/CCCNR/NR/NRNR/NR/NRNR/NR/NRBa2/NR/NR Ba3/BB/BBBa2/BB-/NRB1/B+/B NR/NR/NR
CCC+BBB-BB-BAA-BB+BBB-BBB+BBB+BB+B+BBBCCCBBB-ABBB+BB-BBB-BA+A+BBB-A+B-CCC-B+CCC-DB+AA-BBB-A-BBBCCCB
DNRBBB+BNRBBB-BBNRBB+BB-BBB-BB-BB+CCC+BBB+NRBB-BB-NRNRAA-A+BBBBBBB-B-BCCC+CCCB+AA-BBB+NRBB+CCC+BB-
DNRAB+NRBBB-B+NRBB+BBBBB+BB+BBB-BBB+NRBBBB-NRNRAAA+BB+BBCCC-BB-BCCCBAA-BBB+NRBB+B-BB
AirlinesSteel/ChemicalsCementRetailConglomerateCementChemicalsSteelConglomerateConstructionBottlingBottlingPaper & Forest ProductsConstructionFood ProcessingMiningSteelSteelSteelTelecommunicationPaper & Forest ProductsRetailConglomeratePaper & Forest ProductsAutopartsConglomerateSteelHotel and TourismTextile/ApparelSteel PipesTelecommunicationCable and MediaCementShippingConstructionGlass
AeromexicoAltaApascoCCMCarsoCemexCydsaCondumexDESCEmpresas ICAFemsaGemexDurangoGMDGrumaGrupo MexicoHylsamexIMSAIspal MexicanaIusacellKimberly-Clark De MexicoLiverpoolModernaEmpaques PonderosaSan LuisSidekSimecSiturSynkroTamsaTELMEXTelevisaTolmexTMMTribasaVitro
RatingsM/S&P/D&P
Dec 1995ModifiedRating
July 1995ModifiedRating
May 1995ModifiedRating
IndustryCompany
NR: No rating; M: Moody’s; S&P: Standard & Poor’s; D&P: Duff & Phelps.


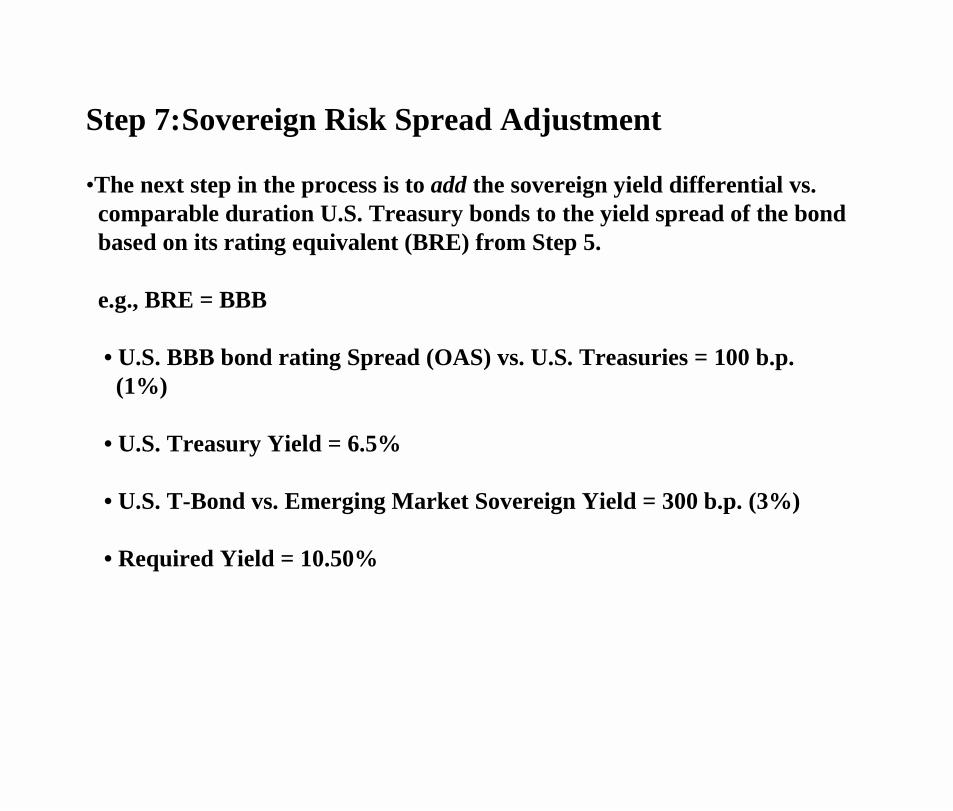
Step 7:Sovereign Risk Spread Adjustment
•The next step in the process is to add the sovereign yield differential vs.comparable duration U.S. Treasury bonds to the yield spread of the bondbased on its rating equivalent (BRE) from Step 5.
e.g., BRE = BBB
• U.S. BBB bond rating Spread (OAS) vs. U.S. Treasuries = 100 b.p. (1%)
• U.S. Treasury Yield = 6.5%
• U.S. T-Bond vs. Emerging Market Sovereign Yield = 300 b.p. (3%)
• Required Yield = 10.50%


EM Scores & Bond Rating EquivalentsMexican Companies
CCC-B
BBB+
DB-
DB
DCCC
2.4084.379
3.8675.512
(0.140)4.087
0.0844.405
(1.007)2.659
Jul-99
May-99
Mar-99
Mar-96
Oct-95
Construction
Automotive
Construction
Diversified Property
Apparel
Bufete Industrial S.A
Cons. G Grupo Dina S.A. De C.V.
Grupo Tribasa S.A. De C.V.
Grupo Situr S.A. De C.V.
Synkro S.A. De C.V.
Bond Rating Equivalent
EM Score(T-1/T-2)
Default Date
IndustryCompany

CCC+CCC
BBB-AA
B-BB-
CCCCCC
DCCC-
3.7434.379
5.6937.409
4.0104.087
2.7252.837
1.7242.328
Oct-99
Oct-97
Jul-97
Jul-97
Jul-97
Electronics
Electronics
Automotive Mfg.
Automotive Mfg
Metal Producer
Orion Electric Co. Ltd.
Tae IL Media Co., Ltd
Asia Motors Co., Ltd
Kia Motors Corp.
Kia Steel Co., Ltd.
Bond Rating Equivalent
EM Score(T-1/T-2)
Default Date
IndustryCompany
EM Scores & Bond Rating EquivalentsKorean Companies
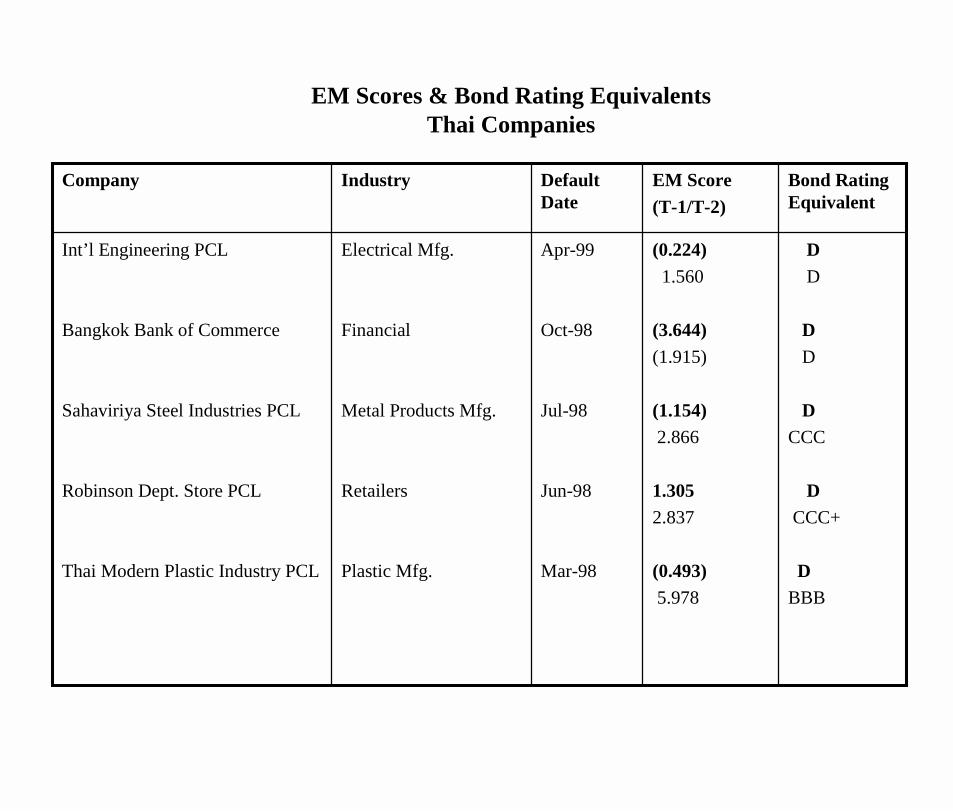
DD
DD
DCCC
DCCC+
DBBB
(0.224)1.560
(3.644)(1.915)
(1.154)2.866
1.3052.837
(0.493)5.978
Apr-99
Oct-98
Jul-98
Jun-98
Mar-98
Electrical Mfg.
Financial
Metal Products Mfg.
Retailers
Plastic Mfg.
Int’l Engineering PCL
Bangkok Bank of Commerce
Sahaviriya Steel Industries PCL
Robinson Dept. Store PCL
Thai Modern Plastic Industry PCL
Bond Rating Equivalent
EM Score(T-1/T-2)
Default Date
IndustryCompany
EM Scores & Bond Rating EquivalentsThai Companies
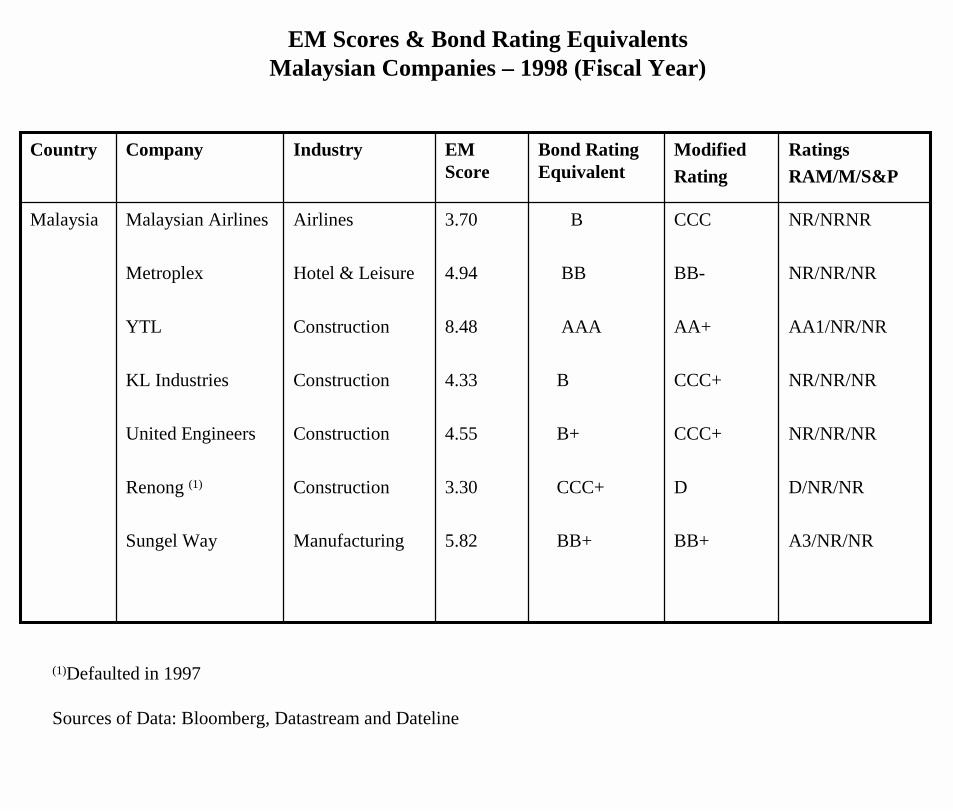
EM Scores & Bond Rating EquivalentsMalaysian Companies – 1998 (Fiscal Year)
B
BB
AAA
B
B+
CCC+
BB+
Bond Rating Equivalent
Airlines
Hotel & Leisure
Construction
Construction
Construction
Construction
Manufacturing
Industry
Malaysia
Country
Malaysian Airlines
Metroplex
YTL
KL Industries
United Engineers
Renong (1)
Sungel Way
Company
NR/NRNR
NR/NR/NR
AA1/NR/NR
NR/NR/NR
NR/NR/NR
D/NR/NR
A3/NR/NR
CCC
BB-
AA+
CCC+
CCC+
D
BB+
3.70
4.94
8.48
4.33
4.55
3.30
5.82
RatingsRAM/M/S&P
ModifiedRating
EM Score
(1)Defaulted in 1997
Sources of Data: Bloomberg, Datastream and Dateline

NR/NRNR
NR/NR/NR
NR/NR/NR
NR/NR/NR
NR/NR/NR
NR/NR/NR
NR/NR/NR
NR/NR/NR
CCC-
D
AA-
A-
BBB
BBB-
AA
AAA
BBB-
D
AA+
A-
BBB
BBB-
AA+
AAA
5.66
-4.57
7.93
6.42
5.97
5.77
7.98
9.51
Computers
Infrastructure
Property
Property
Property
Beverages
Motor vehicle
Manufacturing
IPC
Van Der Horst(1)
First Capital Corp
City Development
DBS Land
Fraser & Neave
Cycle & Carriage
Venture Mfg.
Singapore
RatingsRAM/M/S&P
ModifiedRating
Bond Rating Equivalent
EM ScoreIndustryCompanyCountry
EM Scores & Bond Rating EquivalentsSingapore Companies – 1998 (Fiscal Year)
(1)Technical Default, 1997.Source of Data: Bloomberg, Datastream and Dataline.
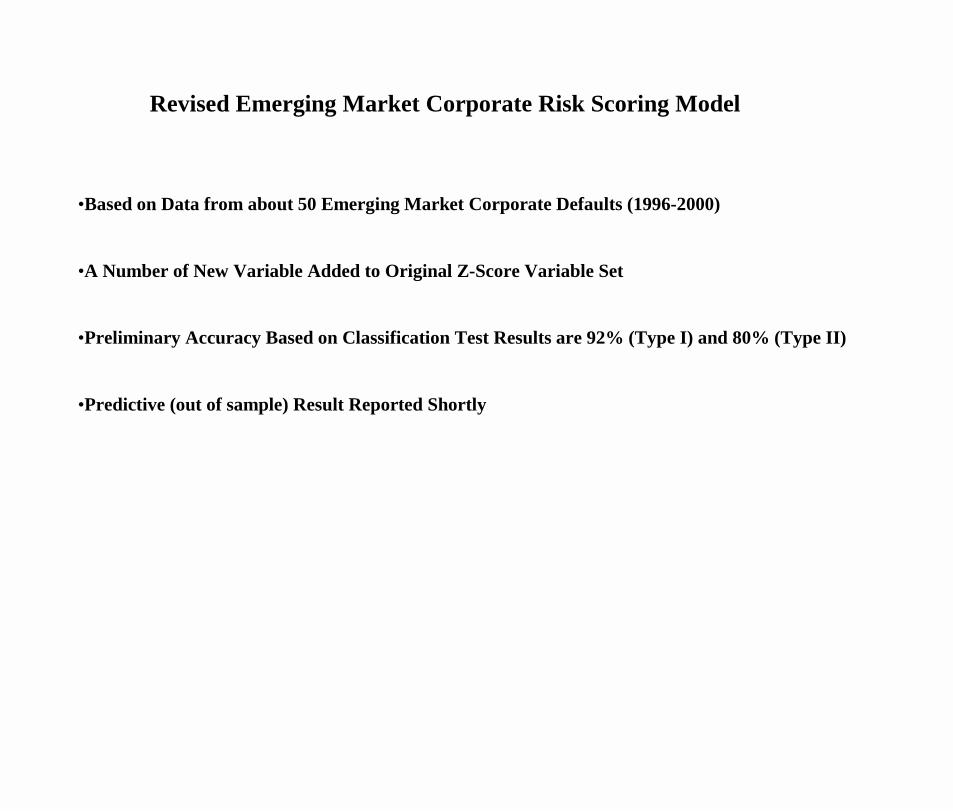
Revised Emerging Market Corporate Risk Scoring Model
•Based on Data from about 50 Emerging Market Corporate Defaults (1996-2000)
•A Number of New Variable Added to Original Z-Score Variable Set
•Preliminary Accuracy Based on Classification Test Results are 92% (Type I) and 80% (Type II)
•Predictive (out of sample) Result Reported Shortly