a mmonia b est m anagement p ractices for f eedlots and d airies
Post on 21-Dec-2015
216 views
TRANSCRIPT

AMMONIA BEST MANAGEMENT PRACTICES FOR FEEDLOTS AND DAIRIES
• Goals of 1st Ammonia NRCS-CIG grant (2006-2010)– Evaluate BMPs on-farm (feedlots and dairies)– Survey producers re BMP adoption and
constraints– Extend results through website and factsheets
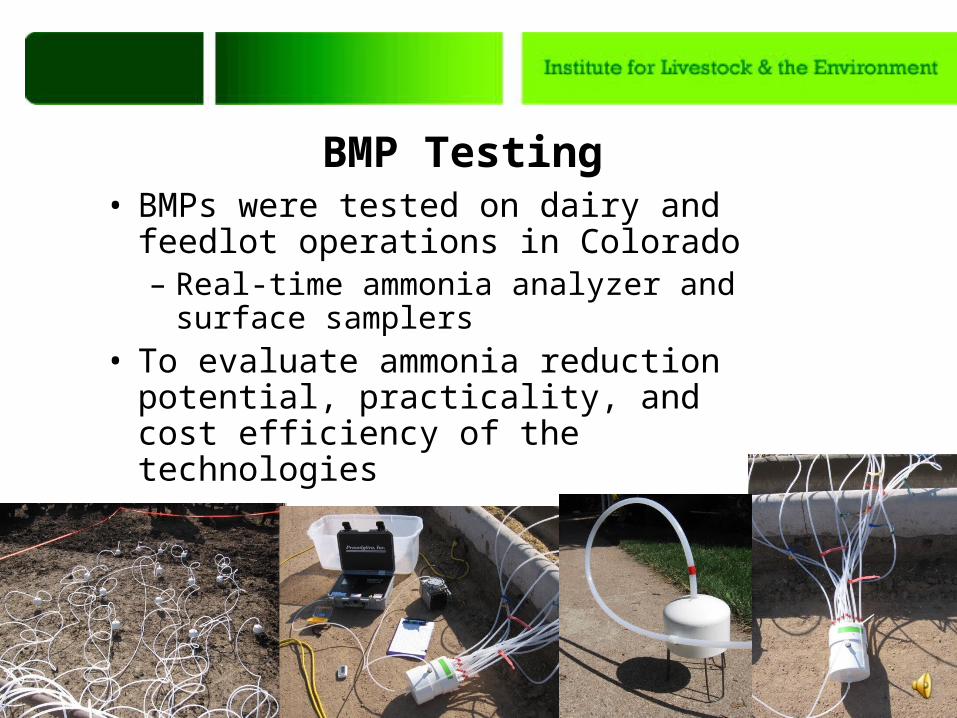
• BMPs were tested on dairy and feedlot operations in Colorado – Real-time ammonia analyzer and surface
samplers• To evaluate ammonia reduction potential,
practicality, and cost efficiency of the technologies
BMP Testing

BMP Testing: Dairy Freestall Bedding
• Sand vs. Compost - Sand tended to give off 43% higher NH3 concentrations than compost bedding (P = 0.06) when measured over a period of a month.
• Sand vs. Compost vs. Wood Shavings – Compost had significantly higher NH3 concentrations than the other two treatments in the short term (<7 days; P = 0.004), but lower concentrations over 30 days (P = 0.05). Sand and wood shavings did not differ (P = 0.82).

BMP Testing: Increasing Alley Cleaning Frequency in Dairy Freestalls
No Manure Removal
0
1
2
3
4
5
6
7
8
9
9:17
9:28
9:38
9:49
9:58
10:0
7
10:1
7
10:2
6
10:3
5
10:4
6
10:5
7
11:0
8
11:4
7
11:5
6
12:0
6
12:1
7
12:2
8
12:3
7
12:4
6
12:5
5
13:0
6
13:1
5
13:2
4
13:3
3
13:4
2
13:5
2
14:0
1
14:1
0
Time, hh:mm
NH
3, p
pm
0
10
20
30
40
50
60
70
80
NH3 Temp, F
•Twice daily manure removal tended to decrease NH3 concentrations by 10%.•Three times daily manure removal tended to increase NH3 concentrations by 34%.

BMP Testing: Harrowing Wood Chips into Drylot Dairy Pens
• We evaluated the practice of harrowing of wood chips into pen surfaces vs. no wood chips added.
• Pens with wood chips harrowed in tended to have 40% lower NH3 concentrations than no wood chips (P = 0.19).
• Use of wood chips was a good amendment to reduce pen moisture and increase cow health during wet periods.

Adoption Rates
Best Management Practice
Use feed additives 96% Measure and adjust crude protein to meet animal needs
93%
Practice group feeding (group by age, sex, etc) 88% Perform yearly soil test for cropland nutrients 78% Hire a nutritionist to formulate rations 77% Collect runoff water from buildings and pens 67% Remove manure more than four times per year 60% Test manure, effluent, or compost for nutrients 59% Provide bedding in drylot pens 52% Incorporate manure within 48 hours after application 42% Provide shade in drylot pens 34% Apply water to the surface of drylot pens 28% Apply an acidifier to the surface of drylot pens 3%
High
Low
Survey Results: Feedlots

Explanatory VariablesVariable DescriptionOperation VariablesSIZE Number of cattle CROP Acres of cropland STATE Dummy; 0= , 1= other stateREVENUE Percent revenue kept as profitINVEST Dollars DIVERSE Percent revenue from non-feedlot activityOWN Percent of cropland owned by respondentOperator VariablesAGE YearsEDUC Years of education starting from 1st gradeFUTURE Dummy; 0= invested, 1= divestedEXPER Number of years managing operationAttitudinal CharacteristicsPROFIT Perception of profitability of BMP from 1-5COST Perception of cost of BMP from 1-5TECH Perception of technical requirement of BMP from 1-5WATER Perception of benefiting water quality: Yes=1, No=0AIR Perception of benefiting air quality: Yes=1, No=0

Probability of Adopting BMP by Profit Perception
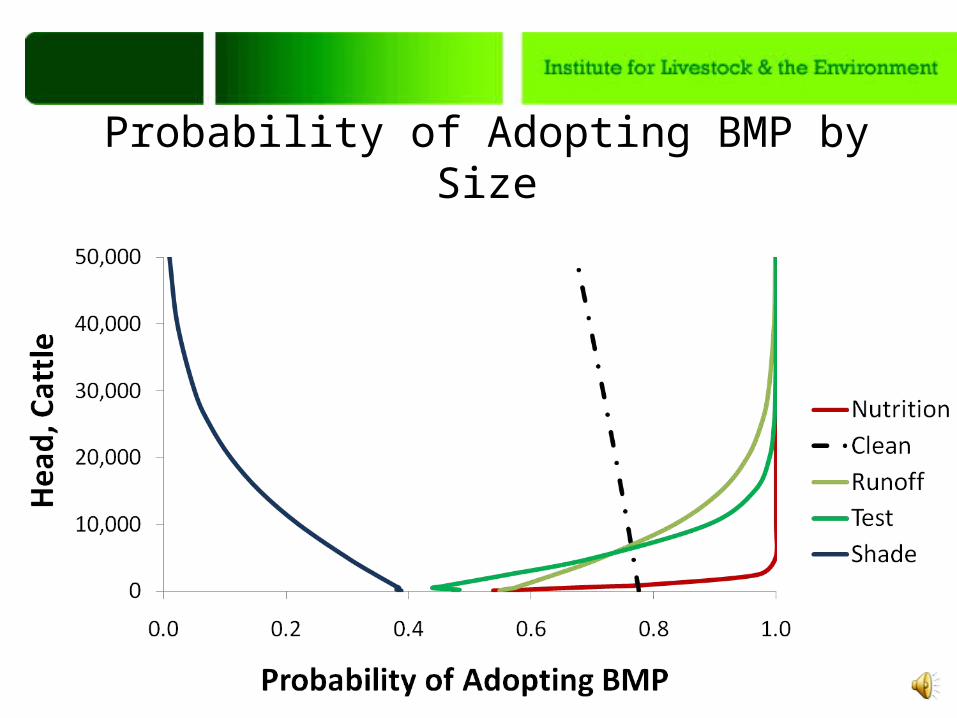
Probability of Adopting BMP by Size
Website: www.AmmoniaBMP.info
Thanks to: USDA-NRCS-CIG for funding and Colorado cattlefeeders and dairy
producers for their participation
