a minimax network flow model for characterizing the impact ... · nasa/tm–2010-216207 a minimax...
TRANSCRIPT

NASA/TM–2010-216207
A Minimax Network Flow Model forCharacterizing the Impact of Slot Restrictions
Douglas W. Lee and Stephen D. PatekUniversity of Virginia, Charlottesville, Virginia
Natalia AlexandrovNASA Langley Research Center, Hampton, Virginia
Ellen J. BassUniversity of Virginia, Charlottesville, Virginia
Rex K. KincaidCollege of William and Mary, Williamsburg, Virginia
March 2010
https://ntrs.nasa.gov/search.jsp?R=20100012119 2019-04-04T01:12:24+00:00Z

NASA STI Program . . . in Profile
Since its founding, NASA has been dedicated tothe advancement of aeronautics and space science.The NASA scientific and technical information (STI)program plays a key part in helping NASA maintainthis important role.
The NASA STI program operates under theauspices of the Agency Chief Information Officer. Itcollects, organizes, provides for archiving, anddisseminates NASA’s STI. The NASA STI programprovides access to the NASA Aeronautics and SpaceDatabase and its public interface, the NASA TechnicalReport Server, thus providing one of the largestcollections of aeronautical and space science STI inthe world. Results are published in both non-NASAchannels and by NASA in the NASA STI ReportSeries, which includes the following report types:
TECHNICAL PUBLICATION. Reports ofcompleted research or a major significant phaseof research that present the results of NASAprograms and include extensive data ortheoretical analysis. Includes compilations ofsignificant scientific and technical data andinformation deemed to be of continuingreference value. NASA counterpart of peer-reviewed formal professional papers, but havingless stringent limitations on manuscript lengthand extent of graphic presentations.
TECHNICAL MEMORANDUM. Scientificand technical findings that are preliminary or ofspecialized interest, e.g., quick release reports,working papers, and bibliographies that containminimal annotation. Does not contain extensiveanalysis.
• CONTRACTOR REPORT. Scientific andtechnical findings by NASA-sponsoredcontractors and grantees.
• CONFERENCE PUBLICATION. Collectedpapers from scientific and technicalconferences, symposia, seminars, or othermeetings sponsored or co-sponsored by NASA.
• SPECIAL PUBLICATION. Scientific,technical, or historical information from NASAprograms, projects, and missions, oftenconcerned with subjects having substantialpublic interest.
• TECHNICAL TRANSLATION. English-language translations of foreign scientific andtechnical material pertinent to NASA’s mission.
Specialized services also include creating customthesauri, building customized databases, andorganizing and publishing research results.
For more information about the NASA STIprogram, see the following:
• Access the NASA STI program home page athttp://www.sti.nasa.gov
• E-mail your question via the Internet [email protected]
• Fax your question to the NASA STI Help Deskat 443-757-5803
• Phone the NASA STI Help Desk at443-757-5802
• Write to:NASA STI Help DeskNASA Center for AeroSpace Information7115 Standard DriveHanover, MD 21076-1320
NASA/TM–2010-216207
A Minimax Network Flow Model forCharacterizing the Impact of Slot Restrictions
Douglas W. Lee and Stephen D. PatekUniversity of Virginia, Charlottesville, Virginia
Natalia AlexandrovNASA Langley Research Center, Hampton, Virginia
Ellen J. BassUniversity of Virginia, Charlottesville, Virginia
Rex K. KincaidCollege of William and Mary, Williamsburg, Virginia
National Aeronautics andSpace Administration
Langley Research CenterHampton, Virginia 23681-2199
March 2010
Acknowledgments
This research was funded in part by National Aeronautics and Space AdministrationCooperative Agreement NNX08AH39A. This technical report is in lieu of the final reportdue at the conclusion of the Cooperative Agreement for the period March 1, 2008through May 31, 2010.
The use of trademarks or names of manufacturers in this report is for accurate reporting and does notconstitute an official endorsement, either expressed or implied, of such products or manufacturers by theNational Aeronautics and Space Administration.
Available from:
NASA Center for AeroSpace Information7115 Standard Drive
Hanover, MD 21076-1320443-757-5802

Abstract
This paper proposes a model for evaluating long-term measures to reduce congestion atairports in the National Airspace System (NAS). This model is constructed with the goal ofassessing the global impacts of congestion management strategies, specifically slot restric-tions. We develop the Minimax Node Throughput Problem (MINNTHRU), a multicommod-ity network flow model that provides insight into air traffic patterns when one minimizes theworst-case operation across all airports in a given network. MINNTHRU is thus formulatedas a model where congestion arises from network topology. It reflects not market-drivenairline objectives, but those of a regulatory authority seeking a distribution of air trafficbeneficial to all airports,in response to congestion management measures. After discussingan algorithm for solving MINNTHRU for moderate-sized (30 nodes) and larger networks,we use this model to study the impacts of slot restrictions on the operation of an entirehub-spoke airport network. For both a small example network and a medium-sized networkbased on 30 airports in the NAS, we use MINNTHRU to demonstrate that increasing theseverity of slot restrictions increases the traffic around unconstrained hub airports as wellas the worst-case level of operation over all airports.
1 Introduction
In 2007, congestion at airports in the NAS contributed substantially to the 281.4 billionhours of delay experienced by domestic U.S. air passengers [33], and the Federal AviationAdministration (FAA) projects that the number of congested airports within the NAS willonly grow [37]. Long-term measures, such as slot restrictions, have been employed at air-ports to reduce or prevent congestion in advance of operation, but their use has not beenwidespread nor has there been a consensus about their impacts. This paper proposes a net-work flow model for assessing the NAS-wide effects of local airport-level decisions to addresscongestion, specifically the use of slot restrictions. For a given airport network representinga day or other multi-hour period of operation, our model determines the flow of aircraftassociated with the minimum worst-case level of operation over all airports. That is, theoutput of the model describes a routing of aircraft throughout the given network minimizingthe maximum amount of traffic at any airport. Using this model, we illustrate the impacts ofslot restrictions on small and moderately-sized airport networks with hub-spoke topologies.
A variety of mechanisms are at the disposal of the Federal Aviation Administration(FAA) to handle congestion, both in real-time and for long-term planning purposes. AirTraffic Flow Management (ATFM) encompasses the methods employed by the Federal Avi-ation Administration (FAA), in collaboration with airspace users (e.g., airlines), for identi-fying and mitigating short-term congestion within the NAS and particularly at airports [22].Frequently used and studied ATFM procedures include flight rerouting [4,10] – the directionof aircraft away from congested portions of airspace – and ground delay programs [5,39] –the assignment of delayed departure times to flights destined for a congested airport. Ata longer time scale, demand management, a set of measures used to constrain access toairports, is a key instrument for controlling congestion and resulting delays far in advanceof any scheduled flights. The primary forms of demand management are congestion pric-ing [30, 31] and slot restrictions [3, 29]. Congestion pricing involves no limit on aircrafttakeoffs and landings per unit time instead restricting capacity by adjusting typical aircraftweight-based landing fees [18]. Slot restrictions consist of setting an explicit upper boundon the number of movements per unit time at an airport and allocating a limited numberof slots (time intervals for an arrival/departure for a set of dates) among airlines and otheraircraft operators.
In the United States, slot restrictions have been used primarily at a select few of the
busiest airports in the NAS, initially using the FAA’s High Density Rules (HDR) at NewYork Kennedy, New York LaGuardia, Newark, Washington (now Reagan) National andChicago-O’Hare airports, transitioning through several formats into present-day restrictionsstill practiced at these airports [18]. Historical experience with slot restrictions at some ofthese airports has not all been positive (see e.g., [15,16]), but the most recent form of slotrestrictions at the New York City metroplex airports (Kennedy, LaGuardia and Newark)has been observed [23] to reduce the frequency and length of delays at those airports.
However, slot restrictions only address local effects. Due to heightened NAS activity,flight delays at the local level have significant global impact on air transportation oper-ations. Investigation of these global effects has been undertaken. For example, Beatty etal. [7] develop the concept of Delay Multiplier to quantify how the initial delay of an individ-ual flight propagates over an airline’s entire operating schedule. After the enactment of theWendell H. Ford Aviation Investment and Reform Act for the 21st Century (AIR-21) [38],many exemptions to existing slot restrictions at New York’s LaGuardia Airport (LGA) weregranted, increasing delays experienced by flights into and out of LGA and resulting in daysof NAS operation where “some 376 flights traveling to 73 airports experienced flight delaysbecause their aircraft passed through LaGuardia at least once” [2].
A number of system-level approaches to studying air traffic and congestion managementissues in the NAS have been proposed. For instance, Sun and Bayen [35] have formulated aset of models for estimating sector-level capacities and travel times and evaluating ATFMstrategies at an aggregate level. Network-theoretic analyses, such as those in [11] and [17],have provided insight into the roles of airports and the influence of airline trends on thestructure of the U.S. airport network. A model of the U.S. airport network by Donohue [19]has been used to estimate the network’s capacity and identify metrics affecting system ca-pacity and delay.
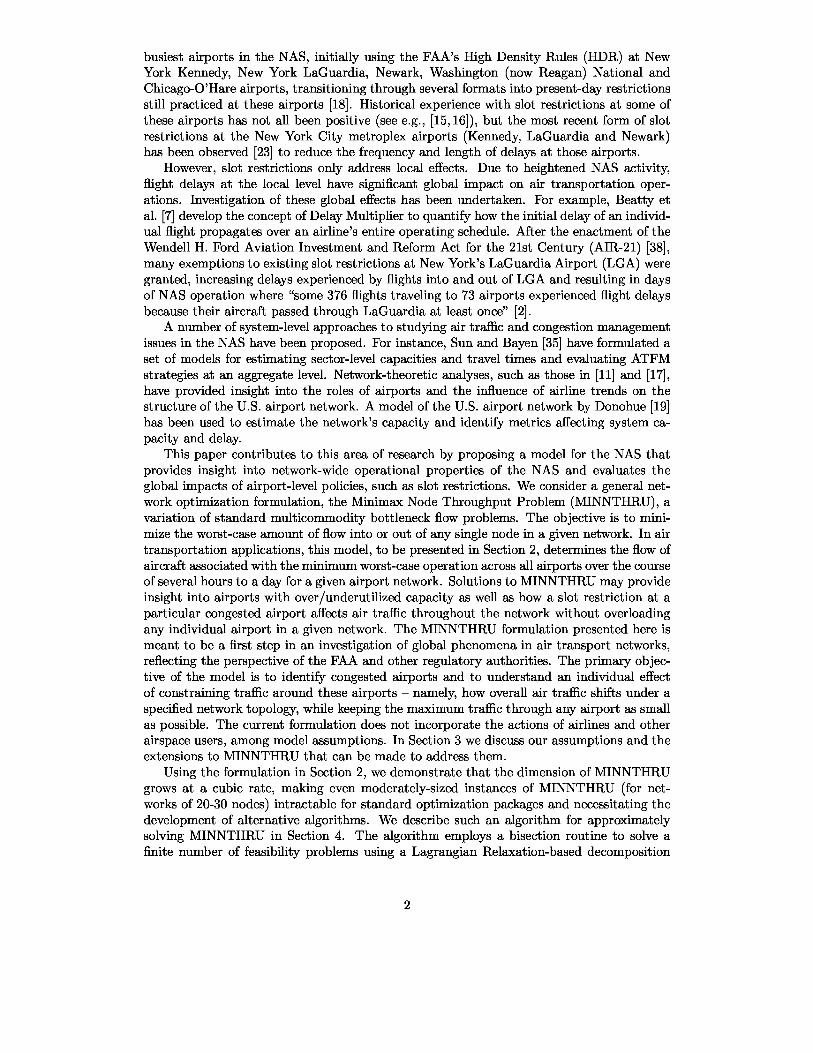
This paper contributes to this area of research by proposing a model for the NAS thatprovides insight into network-wide operational properties of the NAS and evaluates theglobal impacts of airport-level policies, such as slot restrictions. We consider a general net-work optimization formulation, the Minimax Node Throughput Problem (MINNTHRU), avariation of standard multicommodity bottleneck flow problems. The objective is to mini-mize the worst-case amount of flow into or out of any single node in a given network. In airtransportation applications, this model, to be presented in Section 2, determines the flow ofaircraft associated with the minimum worst-case operation across all airports over the courseof several hours to a day for a given airport network. Solutions to MINNTHRU may provideinsight into airports with over/underutilized capacity as well as how a slot restriction at aparticular congested airport affects air traffic throughout the network without overloadingany individual airport in a given network. The MINNTHRU formulation presented here ismeant to be a first step in an investigation of global phenomena in air transport networks,reflecting the perspective of the FAA and other regulatory authorities. The primary objec-tive of the model is to identify congested airports and to understand an individual effectof constraining traffic around these airports – namely, how overall air traffic shifts under aspecified network topology, while keeping the maximum traffic through any airport as smallas possible. The current formulation does not incorporate the actions of airlines and otherairspace users, among model assumptions. In Section 3 we discuss our assumptions and theextensions to MINNTHRU that can be made to address them.
Using the formulation in Section 2, we demonstrate that the dimension of MINNTHRUgrows at a cubic rate, making even moderately-sized instances of MINNTHRU (for net-works of 20-30 nodes) intractable for standard optimization packages and necessitating thedevelopment of alternative algorithms. We describe such an algorithm for approximatelysolving MINNTHRU in Section 4. The algorithm employs a bisection routine to solve afinite number of feasibility problems using a Lagrangian Relaxation-based decomposition

method. Having developed an algorithm to solve moderately-sized and larger instances ofMINNTHRU, we present in Section 5 an application of MINNTHRU to the analysis of theeffects of slot restrictions in hub-spoke airport networks. We first use a small, six-nodenetwork to allow for a detailed and instructive illustration of how MINNTHRU can provideinsights into the effects of a slot restriction on a hub airport. Then, using a 30-node networkwhose nodes correspond to NAS airports, we study how slot restrictions on a hub affect op-erations at unconstrained airports and the minimum worst-case level of performance overall airports. For both small and medium-sized hub-spoke network examples, we demon-strate that increasing the severity of slot restrictions at hub airports results in a similarincrease in both the worst-case level of operation throughout the network and in the flow ofaircraft through unconstrained hub airports. We revisit the results of this application anddiscuss their implications for airport operations and airline schedules in Section 6, while alsorevisiting the extensions of the basic MINNTHRU model in Section 2 and their potentialcontributions to the management of congestion in the NAS.
2 The Minimax Node Throughput Problem (MINNTHRU)We now offer a basic formulation for MINNTHRU, then describe the formulation in an airtransportation context and its applications to managing airspace/airport capacity. Through-out this section, we use the following notation:
• N: the set of nodes
— SC: a subset of N, the set of nodes with a flow constraint
• A: the set of arcs, where an arc is the ordered pair ( i, j) such that i, j E N and i =6 j
• K: the set of commodities, where a commodity k E K is defined by the triplet(sk , tk , dk ) with
— sk : the source node of commodity k
— tk : the destination node of commodity k
— dk : the demand vector associated with commodity k
• xijk: the amount of flow of commodity k on arc ( i, j)
• xk : for each commodity k, the vector of all ( i, j) arc flows xijk
• ui : the upper bound on of flow through node i E SC
• .lV: the node-arc incidence matrix, such that .lVij =+1 if arc (i, j) is directed away fromnode i, .lVij = −1 if arc (i, j) is directed towards node i and .lVij = 0 otherwise
• |W |: for any set W, the cardinality of W.
2.1 The Basic Formulation
We represent a multicommodity flow network by the simple, connected and directed graphG = (N, A), over which |K | commodities are to be transported. Each commodity k =(sk , tk , dk) E K is associated with an ordered pair of nodes ( sk , tk ), requiring a quantity offlow to be transported originating at sk and ending at tk . Associated with each commodity isthe demand vector dk whose skth entry is non-negative, tk th entry is the additive inverse of
the skth entry and remaining entries are zero, specifying the exact quantity to be transportedstarting from sk and ending at tk . We now formulate MINNTHRU as
minx,z z (1)
s.t. E E xijk < z, Vi E N \ SC (2)kEK jEO(i)
E E xijk < ui, Vi E SC (3)kEK jEO(i)
JVxk = dk , k E K (4)xijk > 0, V (i, j) E A, Vk E K, (5)
where for each i E N, O (i) = {m E N J (i, m) E Al and z denotes the feasible flow capacityon flow on all nodes. From the above formulation, the optimal solution to MINNTHRU,(z* , x* ), provides, for a given network, the worst-case flow through any unconstrained nodeand the set of flows associated with this worst-case level.
Adapting MINNTHRU for an air transportation application, N corresponds to a set ofairports within the NAS, SC the set of airports within the NAS subject to slot restrictions,A to all unidirectional one-stop connections that exist between each airport in N, and eachof the J K J commodities to each unique origin-destination route pair possible in the network.The demand associated with each commodity k = 1, ..., J K J corresponds to the numberof completed itineraries flown by an individual aircraft between for the O-D pair ( sk ,tk )during a given time window and flows are the quantity of flights between each distinct nodepair i, j E N. We can view the optimal objective function value of MINNTHRU as theworst-case number of aircraft movements any airport can handle for the period of operationrepresented by the network, a local measure of airport congestion.
A more systemic perspective on potential congestion in the NAS comes from the fullsolution of MINNTHRU, (z* , x*). The full solution represents the flow of aircraft in agiven network associated with the worst-case level of operation, allowing for computation ofrelative levels of congestion for each airport with respect to the most-congested one. Fromthe full solution of this model, we can identify theoretically feasible levels of operation forany given network topology, representing all available flight paths and demands on aircraft,and compare them to actual traffic patterns, perhaps allowing for a determination of theextent to which the flight schedule itself explains certain congestion phenomena. Along thesame line of investigation, we can use existing measures of airport capacity, such as theFAA’s own capacity benchmarks [21], in comparison to a MINNTHRU solution to identifyportions of the NAS where there may be over/underutilized capacity to focus upon directingtraffic towards/away.
Applying the MINNTHRU formulation to more dynamic purposes, we can compare thesolution of less-constrained MINNTHRU instances (e.g., where there are no slot-restrictedairports and so SC is empty) to instances where SC is non-empty, allowing for a very simplecharacterization of the effects of slot restrictions at a few select airports on the overall flowof traffic through the NAS. A deeper analysis of these effects can be generated by solvinga number of MINNTHRU instances with the same set of slot-restricted airports SC andvarying the movement capacities in small (e.g., unit) increments to compute marginal trafficflow estimates. Applying further the approach of Fan and Odoni [20] to calculating marginaldelays and delay costs, we can provide baseline estimates of the “value” of capacity atcongested airports.
4

3 MINNTHRU Model Assumptions
As presented in the previous section, the MINNTHRU model can provide a global perspec-tive on the effects of congestion around airports in the NAS. The current model’s intent isto give high-level insight into these effects to regulatory authorities. Thus, the model usesthe flow of aircraft as the primary effect of airport-level congestion and strategic measuresto alleviate congestion. We have not considered the actions of airlines and other airspaceusers and how they are affected by congestion and policies, such as slot restrictions. Bynot fully incorporating these behaviors, the present MINNTHRU model assumes severalsimplifications of airline behaviors.
First, we have assumed a single airline with the intent of presenting MINNTHRU asa “system” model. Since the model emphasizes analyzing congestion management on aglobal scale, and thus places importance on the total level of traffic around airports, thisassumption is reasonable at this stage of investigation. It may, however, lead to practicallyinfeasible solutions which do not account for specific airline hubs, roles of particular airlines(e.g., regional vs. major air carrier), etc. We can add authenticity to the model’s resultsby simply having an individual MINNTHRU instance for each airline we consider, then useeach airline’s specific network and historical slots at slot-restricted airports, and feed theresults of these MINNTHRU subproblems into a “master” MINNTHRU problem. An issuethat remains is the economics of each airline moving its aircraft in response to other airlinesand slot restrictions or other congestion management measure. This is an important issuethat will be addressed in future work.
The next assumption is that the operation of the one aggregate airline is simplified toquite an extreme. In particular, revenues and costs are not incorporated in the model, po-tentially leading to nonsensical aircraft routings (e.g., completing an itinerary whose originand destination are on the same coast by routing an aircraft to the opposite coast andback) and other routing decisions leading to lost revenues in actual operation. We havenot considered many other types of decisions made by airlines, such as the choice of air-craft and pricing of flight itineraries. Again, the solutions returned by MINNTHRU maybe unprofitable after factoring in these decisions. A potential extension would require: (1)modifying the minimax objective function from a strictly flow-based objective to a penaltyfunction accounting for prices, flight costs (based on distance and choice of aircraft), anddelay costs based on the congestion around airports and (2) expanding the commodity spaceto differentiate between flights by different aircraft types.
Finally, we have not considered the relationship between passenger demand and the man-agement of airport congestion. Still, the demands on aircraft are driven in part by travelerswith a desire to fly, so how passenger demand is affected by congestion and its managementand the resulting responses of airlines cannot be ignored completely. An analysis of therole passenger demand plays in congestion management might require a derivation of a rela-tionship between an airline’s passenger and aircraft demands, in conjunction with a modelof the economic decisions faced by airlines, and then solving MINNTHRU for a number ofinstances with different demand levels.
Assuming a single airline and not incorporating a notion of passenger demand in MIN-NTHRU do not present severe limitations to our model since it is mainly a model of the airtransport system as a whole, and focuses upon comparing total levels of aircraft operationsat airports. It is clear, however, that the various assumptions about the behavior of thesingle airline limit our model the most, and that incorporating economic concepts wouldresult in MINNTHRU solutions less likely to be unprofitable or not sensible in real airlineoperations. Our model still has value in that we have proposed it as a preliminary stepcatered to the interests of regulatory authorities aiming to understand some of the globaleffects of its congestion management policies. In this sense, this version of MINNTHRU

provides an idealized view of the effects of these policies considering only the flow of air-craft, allowing for the characterization of lower bounds on worst-case traffic and marginalchanges in flow resulting from slot restrictions.
4 An Algorithm to Solve MINNTHRU
In the formulation given by (1)-(5), we have assumed that the commodities 1, ..., I K I cor-respond to each distinct and ordered pair of nodes, so it follows that MINNTHRU is aproblem with O
(IN I3) constraints in O
(IN I2 IA I) variables. For networks where I N I and
IA I are large, MINNTHRU is intractable. For example, the linear programming routinelinprog in MATLAB 7.8’s Optimization Toolbox [28] can solve a MINNTHRU instanceof no larger than 15 nodes and approximately 80 arcs. We now describe an algorithm forsolving larger instances of MINNTHRU, using the minimax structure of the formulationgiven in (1)-(5). Our algorithm consists of a main loop in which we conduct a binary searchover the interval [0, I K I] for candidate values of z* , the optimal objective function value ofMINNTHRU, solving a feasible flow problem for each candidate value z, until the searchinterval is sufficiently reduced. Within the main loop, we must solve a feasible flow problemfor each z that is evaluated. These feasible flow problems are each a large multicommodityflow problem we can solve using well-known decomposition methods based on Lagrangianrelaxation [1] and subgradient optimization techniques [34].
4.1 Description of the Algorithm
Let us define the parameters clo and chi, which are, respectively, lower and upper endpointsof the search interval for potential values of z* . Let δ > 0 be the tolerance for the differencebetween clo and chi, thus serving as a termination criterion to the main loop of the algorithm.We initialize clo = 0 and chi = I K I, since there can be no flow into/out of any node greaterthan the total number of commodities.The main loop is as follows:
1. Set z = (chi + clo ) /2 and execute the procedure DECOMP (z).
2. If the result is FEASIBLE set chi = z, if INFEASIBLE, set clo = z.
3. If (chi — clo ) /z < δ, terminate. Otherwise return to step 1.
We use the procedure DECOMP (z) to determine whether a particular value of z is feasibleby specifying for each z, the following feasible flow problem associated with the MINNTHRUformulation from (1)-(5):
minx p (6)
s.t. E E xijk < z, Vi E N \ SC (7)kEK jEO(i)
E E xijk < ui, Vi E SC (8)kEK jEO(i)
Nxk = dk, Vk E K (9)xij k > 0, V (i, j) E A, Vk E K, (10)
where x = {xk I. This problem amounts to finding an x that satisfies the system of inequal-ities defined by (7)-(10). Denoting the optimal objective function value of this problem by

p* , p* = 0 if (7)-(10) is feasible and p* = oo if not.Forming the Lagrangian subproblem for the feasible flow problem (6)-(10), we have:
E vi ( E
E
iEN\SC kEK jEO(i)
Nxk = dk , dk E Kxij k > 0, d( i , j ) E A,
⎞
xijk — z + E wl E E xijk — ul⎠ (11) (lESC kEK jEO(l)
(12)dk E K, (13)
L, (v, w) = infx
s.t.
where vi and wl as the Lagrange multipliers associated with the capacity constraints onnode i E N \ SC and l E SC, and v = {vi} and w = {wl } as the vectors of the Lagrangemultipliers. We may express this more compactly through the dual function
⎛ ⎞
L, (v, w) SEX
vi xijk — z + E wl xijk — ul , (14)iEN\SC kEK jEO(i) lESC ( kEKjEO(l)
where X ⊆ R J A JJ K J is the set of all x satisfying the non-negativity and flow conservationconstraints (12)-(13). The dual problem associated with (14) is to maximize L, (v, w) subjectto v > 0 and w > 0. Denoting d* to be the optimal value of the dual problem, we observethat we can make d* as large as possible, depending on what x E X achieves the infimumfor a particular (v, w) in (14). By weak duality, d* < p* , so for any v > 0 and w > 0, suchthat if solving the dual problem results in L, (v, w) = oo, p* = oo and the inequality system(7)-(10) is infeasible. The alternative result, however, is the case where L, (v,w) < 0 forany v > 0 and w > 0, indicating that (7)-(10) is indeed feasible, in which case p* = 0. Itfollows that
v, w > 0, L, (v, w) > 0 ⇔ (7) -(10) is infeasible. (15)
Thus, the procedure DECOMP (z) can determine if a particular value of z is infeasible if itcan find a v and w such that the left hand side of (15) is satisfied within a sufficiently largenumber of iterations.
We can now describe the procedure DECOMP (z) as follows:
1. Initialization Set q = 1, wqi > 0 for all i E N \ SC, vq
l > 0 for all l E SC and defineQ, the maximum number of iterations, and e > 0 the feasibility tolerance parameters.Solve |K | single-commodity minimum cost flow subproblems where for each commodityk, arc ( i, j) has cost vq
i if i E N \ SC (cost wqi if i E SC) and unit capacity.
2. Let yijk be the optimal solution to the kth subproblem. If for all i E N \ SC,PkEK
PjEO(i) yijk < z and for all l E SC,
PkEK
PjEO(l) yljk < ul , then (6)-(10)
is FEASIBLE and terminate. If⎛ ⎞ ⎛ ⎞
Ev9 yijk — z + E wi E E yljk — ul > e, (16)
iEN\SC kEK jEO(i) lESC kEK jEO(l)
or if q > Q, then (6)-(10) is INFEASIBLE and terminate.
3. Update vqi and wq
l for each i E N \ SC and l E SC, respectively, according to the
7

subgradient update formulas:⎡ ⎤ +
q+1 q ( )vi = vi + Bq yijk - z , 17kEK jEO(i)
⎡ ⎤ +
w11 = wl +θq yljk - ul (18)kEK jEO(l)
where [x ] + is the positive part of x and θq = a/ (b + q) is a stepsize parameter withpositive constants a and b, and set q = q + 1.
4. At iteration q = 2,..., Q, form the residual graph Gqk under the current flow yijk and
dual prices vqi and vq
l and run the procedure BFNC(Gqk ) to solve the subproblem for
each commodity k = 1, ..., I K I and return to step 2.
The procedure BFNC (G) for any graph G = (N, A) is a version of the Bellman-Fordalgorithm [8,25] with the addition of a procedure for identifying negative-cost directed cycles.After a dual price update, the optimal solution for some of the IN I • IN- 1 I commodities mayremain optimal while for others it may not. We can identify the commodities whose solutionsdo not remain optimal by constructing, for each commodity k at iteration q, the residualgraph Gq
k resulting from the current flow yijk and updated dual prices wqi and running
BFNC(Gqk ) to determine if there is a negative-cost cycle around which we can reroute the
flow yijk at lower cost. If there is one, we augment flow over this cycle to obtain a newsolution under dual prices wq
i , form the resulting new residual graph, and continue runningBFNC(Gq
k) until there is no negative-cost cycle. At that point, we keep the solution yijk
and move on to the next commodity. Letting r denote the current Bellman-Ford iteration,and VT (i)and FT (i)the distance label and predecessor of node i after Bellman-Ford iterationr, we summarize the procedure BFNC (G) for the case where G = Gq
k for commodity k anditeration q as follows:
1. Run I N I - 1 Bellman-Ford iterations on G and record VT (i) and FT (i) for each nodei E N for r = I NI- 1
2. Run one additional Bellman-Ford iteration. If VT+1 (i) = VT (i)for all i E N, terminateand return the flow yijk. Otherwise, move to step 3.
3. Pick any node j such that FT+1(j) =6 FT (j ) . Trace back from j and FT+1(j) throughthe predecessors VT until a cycle C is identified. Find the capacity M of the cycle andaugment M units of flow across C.
4. Update the flow yijk and the graph G and return to step 1.
4.2 Discussion of the Algorithm
The algorithm described in the previous section combines several existing methods to solveMINNTHRU. Employing a bisection algorithm to solve a series of feasibility problems inorder to solve a more complicated optimization problem, as in our algorithm’s main loop,is a typical procedure (see e.g., [12], Chapter 4.2) used in solving both quasiconvex andminimax optimization problems. MINNTHRU belongs to this class of problems. It followssimply that the main loop of our algorithm will terminate in log IK I/δ iterations, being abinary search over an interval of length I K I.
8

Within the main loop, we employ a Lagrangian relaxation-based, price-directive decom-position scheme that has been employed extensively for standard minimum-cost multicom-modity network flow problems as detailed in numerous references, such as [1, 24,32]. Wemodify the standard price-directive approach to incorporate node (rather than arc) capacityconstraints that are to be relaxed, as well as by using feasibility problems whose optimalvalues are identically zero as Lagrangian subproblems. Using the procedure DECOMP (z),for a given z, we find a sequence of dual prices (v 1 , w1 ), .., (vq , wq ), ... which can be shownto converge [26] to the optimal ( v*, w*) maximizing the dual function Lz (v, w) under thefollowing conditions on the stepsizes θq :
∞
θq —> 0, E θq = 00 (19)q=0
and we have selected one of the more simple forms of a stepsize satisfying these conditions.It has, however, been noted (e.g., [13]) that the Lagrangian relaxation and subgradient-
based decomposition algorithms inspiring DECOMP (z) are slow to converge. As part ofaddressing these issues, we observe that any decomposition breaks MINNTHRU into a set ofsingle-commodity problems which can be solved as shortest-path problems where there areopportunities to reroute flow at arbitrarily lower cost, hence our use of the Bellman-Fordalgorithm with negative-cost cycle detection and identification in the graph G = (N, A),BFNC (G) in DECOMP (z). This application of a shortest-path/negative-cycle detec-tion algorithm to solving multicommodity flow problems has been implemented extensively,see [32] for one example.
Our specification of BFNC (G) relies on one of the simpler methods [1,14, 27] for de-tecting a negative-cost cycle in a given graph: run the Bellman-Ford algorithm at least I N Iiterations and check for a decrease in the distance label LT (i) in any node i E N duringiteration r = IN I. If there is no cycle, Bellman-Ford terminates after at most I N I — 1iterations. With a cycle, all distance labels LT (i) for each i E N become arbitrarily nega-tive. [14] We choose to run twice as many Bellman-Ford iterations to let the presence of anynegative-cost cycle C run its course, so to speak, before attempting to specifically identifyit. The actual procedure for identifying C takes advantage of including the predecessors FT
at each Bellman-Ford iteration r. Then we can backtrack from any node whose distancelabel continues to update beyond I N I — 1, and add all nodes found through FT until somenode is repeated.
5 The Global Effects of Slot Controls: Illustrative CaseStudies
In this section, we illustrate the application of MINNTHRU to an investigation of globalimpacts of local, airport-level slot restrictions through two case studies. In both cases, theinput networks to MINNTHRU are hub-spoke networks where spoke-to-spoke travel mustutilize a hub, i.e., there are no point-to-point connections. We start with a two-hub, six-nodeexample whose purpose is to show the fundamental differences between unconstrained andconstrained (slot-restricted) cases of MINNTHRU, in terms of the decision variables, feasiblesolutions, and optimal solutions. We then introduce a NAS-like network of 30 nodes, whichinclude five hubs, corresponding to NAS airports. Using this network, we study on a largerscale, how slot restrictions affect the flow of aircraft, particularly the worst-case levels acrossall airports and the increases in operations on unconstrained airports, especially other hubs.

Figure 1. Simple network that illustrates MINNTHRU. H1 and H2 act as hubs connectingspokes S1, S2, S3 and S4. Commodities are associated with pairs of spokes and have unitdemand.
5.1 A Small Example
We begin with a simple hub-spoke network depicted in Figure 1, consisting of two hub nodes(H1 and H2), such that traveling between any distinct pair of the four spoke nodes (S1-S4)requires a stopover at either hub. Each edge connecting a pair of nodes in the networkcorresponds to an arc in both directions between those nodes. Assume also that there is aunit demand for each commodity corresponding to a distinct pair of spoke nodes and zerodemand for any other pair of nodes in the network, so that there are twelve commodities intotal. Each of these commodities is analogous to a complete routing of an individual aircraftfrom an origin airport to a destination airport over a relevant service period. That is, thereare no aircraft which fly between the two hubs or from any spoke to any hub exclusively.
Now consider finding a MINNTHRU solution for the network in Figure 1, with thegiven commodities and demands, when there are no flow constraints on any node. As eachspoke node serves as an origin for three commodities (where the destinations are each ofthe remaining spokes), any feasible assignment of flow results in at least three units of flowon arcs outgoing from each spoke node. Since spoke S1 is only connected to hub H1, it isclear that the six commodities, in which S1 is either an origin or destination, must travelthrough H1. It follows that in any feasible assignment of flow, there will be at least sixunits of flow on arcs outgoing from H1. The remaining six commodities do not have to berouted exclusively through just H1 or just H2, they may be routed through either or both.However, we can feasibly route all six of these commodities by sending flow exclusivelythrough H2, resulting in at least six units of flow on outgoing arcs from H2. Observing thatall commodities with S1 as either origin or destination may be routed exclusively throughH1, we arrive at an assignment of flows in which all spoke nodes have three units of flowon outgoing arcs and both hubs have six units of outgoing flow. This assignment is theoptimal solution and six units of flow is the unconstrained minimax node throughput, sinceany alternate routing for any commodity increases the amount of flow on either H1 or H2and results in greater than six units of flow outgoing from either hub, and we have alreadyestablished that there cannot be fewer than six units of outgoing flow from all nodes in any
10

Figure 2. Optimal unconstrained MINNTHRU solution for the network from Figure 1. Anarc (i, j) corresponds to a positive flow of aircraft from airport i to airport j. The numberson any arc represent the units of flow on that arc associated with the optimal solution. Wecan easily see that all spokes S1 through S4 have three units of outgoing flow and both H1and H2 have six units of outgoing flow.
feasible assignment of flow. We depict this solution in Figure 2.Suppose now we implement a slot restriction by constraining outgoing flow on any node
in the network depicted in Figure 1. Since each spoke must have at least three units of flowon outgoing arcs and we have shown that we can arrive at a solution where there are exactlythree units of flow outgoing from all spoke nodes, no flow constraint on a spoke node whichadmits a feasible solution (that is, constraining outgoing flow from any spoke to less than orequal to at least three units) will alter the optimal MINNTHRU solution from that of theunconstrained case. Similarly, a constraint on outgoing flow on H1 that admits a feasiblesolution (constraining outgoing flow to be less than or equal to at least six units) does notchange the optimal MINNTHRU solution from that of the unconstrained case, since we haveshown that we can arrive at a solution where there are exactly six units of flow outgoingfrom H1 so that any constraint at least as large does not affect the flow assignment.
The same cannot be said for a constraint on flow outgoing from H2. Denote the upperbound on outgoing flow from H2 by uH2 > 0. We see that there is no level 0 < u < 12such that we can set uH2 < u and make the problem infeasible since no commodities mustbe routed exclusively through H2. If we set uH2 > 6, then we cannot alter the optimalMINNTHRU solution from that of the unconstrained case since the optimal objective ofsix units of outgoing flow from H2 in the optimal unconstrained solution remains feasible.However, if we set uH2 < 6, the optimal unconstrained MINNTHRU solution will changesince the six units of outgoing flow from H2 can no longer be accommodated. Since eachcommodity in which S1 is neither origin nor destination can be routed with H1 alone, atleast 6 — uH2 units of outgoing flow are shifted from H2 to H1, resulting in at most uH2
units of outgoing flow from H2 and at least 6 + (6 — uH2 ), or 12 — uH2 units of outgoing flowfrom H1, with all outgoing flows on spoke nodes remaining at three units. At optimality, theminimum possible flow is rerouted with the outgoing flow from H2 at uH2 units and fromH1 at 12 — uH2 units, the latter becoming the minimax node throughput when a constraintof uH2 < 6 is imposed on outgoing flow from H2. Figure 3 illustrates how the solution
11

Figure 3. Optimal MINNTHRU solution for the network from Figure 1, when we set theupper bound on outgoing flow from H2 µH2 = 5. To obtain this solution, the commodityassociated with O-D pair (2,3) is rerouted through H1. The dashed arcs indicate the changesin the assignment of flows in this constrained optimal solution compared to that of theunconstrained optimal solution. Again we clearly observe that all spokes have three unitsof outgoing flow, but now H2 has only five units of outgoing flow and H1 has seven units.
changes when we set uH2 = 5 and arbitrarily reroute the commodity for the O-D pair (2,3)through H1 instead of H2.
5.2 A NAS-like Example
We now consider a larger network (Figure 4) based on the NAS. We choose 30 nodes cor-responding to a subset of the 35 FAA Operational Evolution Partnership (OEP) airportsconsidered to be the busiest airports in the United States, and model aggregate operationsover these airports for a six-hour block. We exclude OEP airports outside the continen-tal United States and close to other, busier airports. These excluded airports are ChicagoMidway (MDW), Fort Lauderdale-Hollywood International (FLL), Honolulu International(HNL), New York John F. Kennedy International (JFK), and Reagan National (DCA). Eachline between airports, as in the small network example, indicates that travel is possible inboth directions between the two airports. It should be noted that while we selected realairport locations, this example does not represent the actual operations of the airports used.
From the network in Figure 4, we can see five hubs corresponding to Atlanta HartsfieldInternational (ATL), Chicago O’Hare International (ORD), Dallas-Fort Worth International(DFW), Denver International (DEN), and Minneapolis-St. Paul International (MSP), withthe remaining 25 airports acting as spokes. ORD (whose connections are indicated by blacklines) is the most connected of these, as it is connected to 20 other airports, followed, inorder, by ATL (gray lines) with 16 connections, DEN (blue lines) and DFW (red lines) with15 connections each and MSP (green lines) with 13 connections. Let us denote these hubsH1 through H5, in ascending order of their degrees so H1 corresponds to MSP, H2 to DFW,H3 to DEN, H4 to ATL and H5 to ORD. For each commodity whose origin and destina-tion nodes are both spokes, there is a unit demand representing one aircraft completing anitinerary between the involved nodes. All remaining commodities have zero demand: that
12
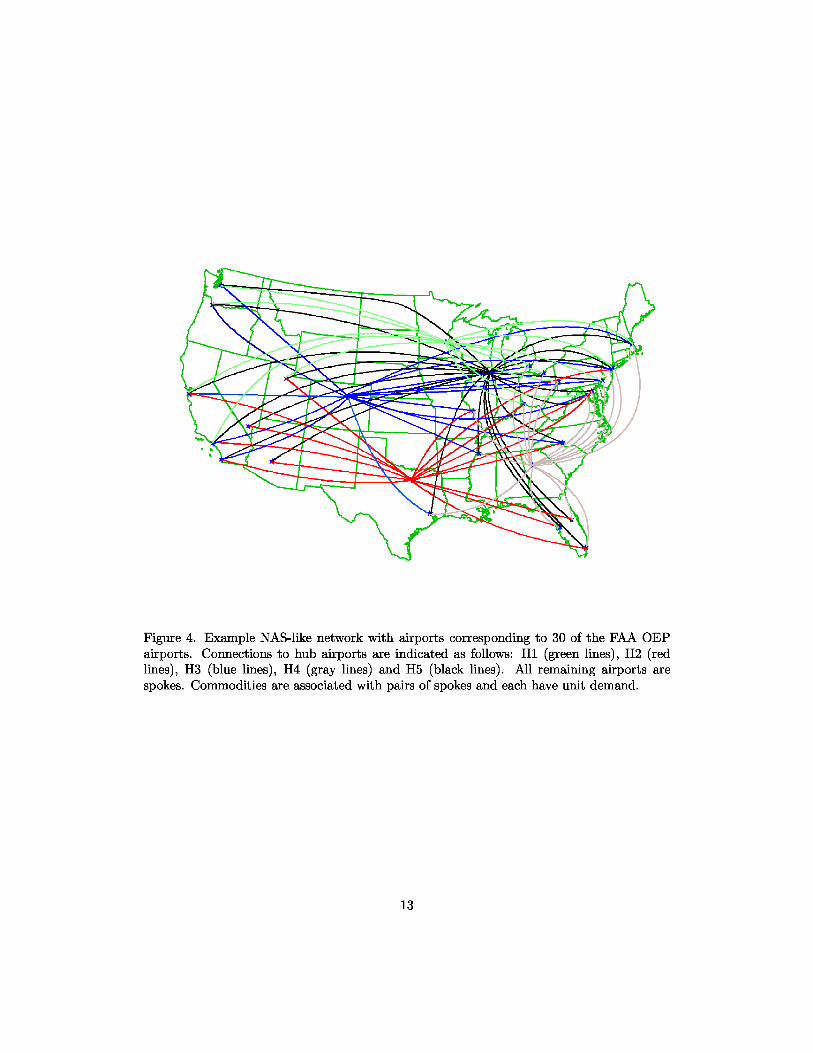
Figure 4. Example NAS-like network with airports corresponding to 30 of the FAA OEPairports. Connections to hub airports are indicated as follows: H1 (green lines), H2 (redlines), H3 (blue lines), H4 (gray lines) and H5 (black lines). All remaining airports arespokes. Commodities are associated with pairs of spokes and each have unit demand.
13
meaning aircraft do not fly complete itineraries from hub to spoke (or vice versa) or fromhub to hub.
For this example, we will study the global effects of slot restrictions by looking at thefollowing two questions:
• Do slot restrictions induce a rearrangement of the flow of aircraft that results in themost connected, unconstrained hub airport receiving the most flow or the biggestincrease in flow?
• Do stricter slot restrictions necessarily increase the minimum worst-case level of flowthrough any airport (i.e., the minimax node throughput)?
In the small network example,the answer to both questions was affirmative. While thisexample is clearly more complicated, due to the larger number of airports, hubs and con-nections, we should expect the answer to the latter question to be similar. With the addedcomplexity it is reasonable to expect that the minimum worst-case level of flow throughany airport might not change substantially until the slot restrictions become increasinglystrict. However, given the increase in airports, hubs and connections, it is not reasonableto expect that the most connected unconstrained airport will experience either the greatestraw amount or increase in flow of aircraft after a slot restriction. In order to answer thesequestions, we will use the network depicted in Figure 4 as an input to MINNTHRU, firstwith no slot restrictions on any airport. After identifying the bottleneck airport and thelevel of outgoing flow associated with it, we place slot restrictions on the bottleneck airportin decrements of five from the unconstrained minimum worst-case flow and observe the re-sults from using these networks as inputs to MINNTHRU. If there is a tie for the bottleneckairport in the unconstrained case, then the same slot restrictions are applied to no morethan two of the airports, since there are only five hubs and these are going to be the airportswith the most outgoing flow.
With five hubs and 30 overall airports in our example network, there are too manypossible slot restriction combinations to evaluate to definitively answer both of the abovequestions. In both cases, we focus on the hubs, since – as in the smaller example – in theoptimal MINNTHRU solution, the outgoing flow from each spoke is the flow associated withthe commodities where the spoke is the origin airport. To address the first question, wewill only evaluate the effects of slot restrictions at the bottleneck airports to illustrate theseeffects. We will take a more systematic approach in applying slot restrictions to evaluatethe second question, evaluating results for progressively more restrictive slot restrictionsapplied one at a time. Without slot restrictions, the optimal solution to MINNTHRU forthe network in Figure 4 results in the flow of aircraft through the five hubs as follows: 172units for H1, 138 units for H2, 172 units for H3, 84 units for H4, and 50 units for H5. Weobserve that the most connected hub, H5, has the lowest amount of outgoing flow, whiletwo lesser-connected hubs, H1 and H3, have the most flow. While this result may not seemintuitive, recall that the objective of MINNTHRU is minimizing the worst-case flow throughany airport and not finding the maximum throughput for any airport.
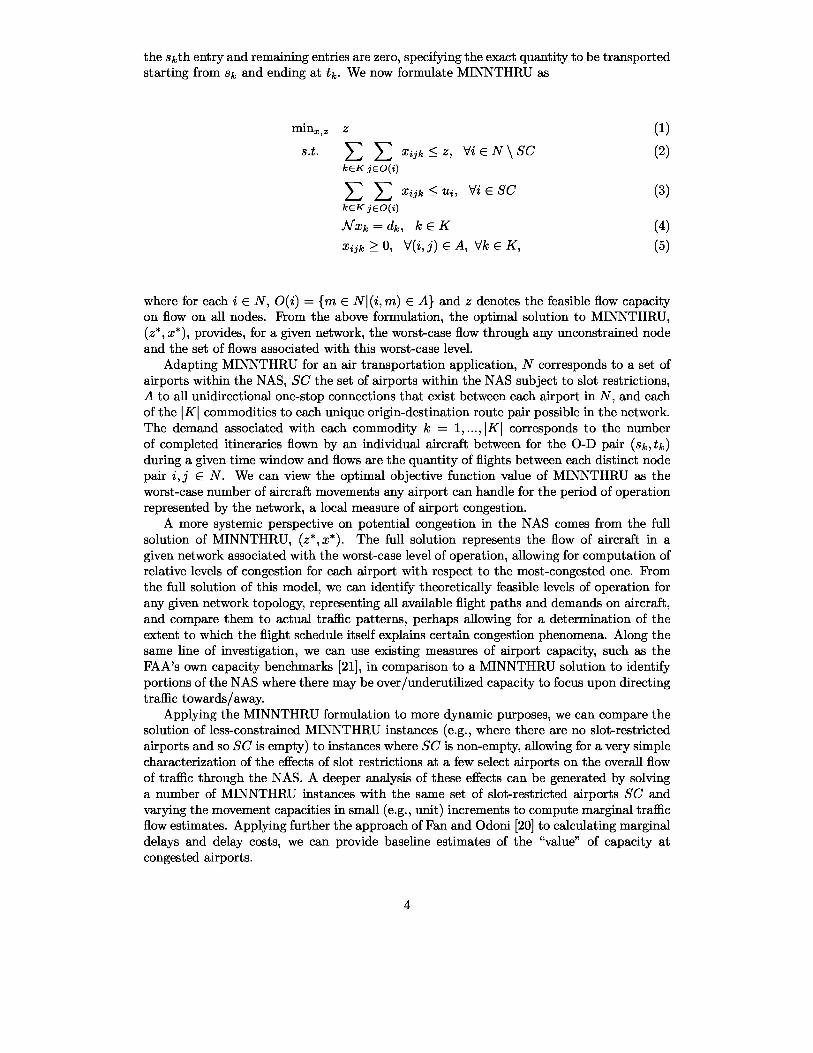
With a tie between two hubs for having the minimum worst-case flow at 172 units, weput slot restrictions on both H1 and H3, first constraining each node to accommodate nomore than 170 units of outgoing flow, then decrementing from that level in units of five.Figure 5 displays the increase in the outgoing flow through the unconstrained hubs H2, H4,and H5 from their unconstrained levels as functions of the capacity reduction on the bottle-neck airports H1 and H3 from their unconstrained levels. The initial reduction of capacityon H1 and H3 by just two units induces a substantial increase in flow through both H2 andH4, with further reduction only leading to more flow on H4 and H5. The most significantincrease is eventually experienced by H5, the most connected hub in Figure 4, once the
14

r-a 80L_
Q
= 600La-+
0 40Ca^
c' 20CO
U
100
00 20 40 60 80 100
Capacity Reduction on Bottleneck Hubs
Figure 5: The increase in outgoing flow on each of the three unconstrained hub airports inthe network from Figure 4, as a function of the reduction in the capacity of the bottleneckhubs H1 and H3 from their unconstrained level of operation of 172 units each. All spokeairports are unconstrained throughout. Expectedly, the flow through each unconstrainedhub increases as the capacities on H1 and H3 are reduced, with the most connected ofthese hubs, H5, eventually experiencing the largest increase. The increase in flow is notmonotonic for H4, perhaps due to the extent of the decrease in flow through H1 and H3 astheir capacities are reduced from 172 units (see Figure 6).
15
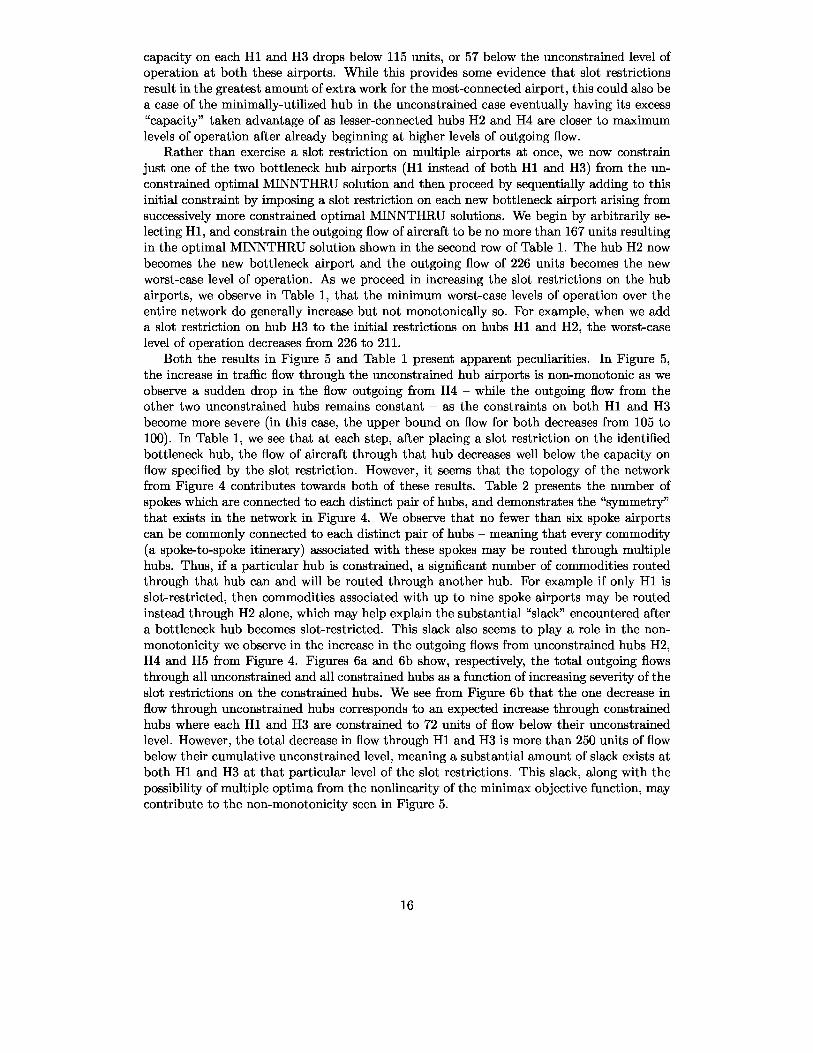
capacity on each H1 and H3 drops below 115 units, or 57 below the unconstrained level ofoperation at both these airports. While this provides some evidence that slot restrictionsresult in the greatest amount of extra work for the most-connected airport, this could also bea case of the minimally-utilized hub in the unconstrained case eventually having its excess“capacity” taken advantage of as lesser-connected hubs H2 and H4 are closer to maximumlevels of operation after already beginning at higher levels of outgoing flow.
Rather than exercise a slot restriction on multiple airports at once, we now constrainjust one of the two bottleneck hub airports (H1 instead of both H1 and H3) from the un-constrained optimal MINNTHRU solution and then proceed by sequentially adding to thisinitial constraint by imposing a slot restriction on each new bottleneck airport arising fromsuccessively more constrained optimal MINNTHRU solutions. We begin by arbitrarily se-lecting H1, and constrain the outgoing flow of aircraft to be no more than 167 units resultingin the optimal MINNTHRU solution shown in the second row of Table 1. The hub H2 nowbecomes the new bottleneck airport and the outgoing flow of 226 units becomes the newworst-case level of operation. As we proceed in increasing the slot restrictions on the hubairports, we observe in Table 1, that the minimum worst-case levels of operation over theentire network do generally increase but not monotonically so. For example, when we adda slot restriction on hub H3 to the initial restrictions on hubs H1 and H2, the worst-caselevel of operation decreases from 226 to 211.
Both the results in Figure 5 and Table 1 present apparent peculiarities. In Figure 5,the increase in traffic flow through the unconstrained hub airports is non-monotonic as weobserve a sudden drop in the flow outgoing from H4 – while the outgoing flow from theother two unconstrained hubs remains constant – as the constraints on both H1 and H3become more severe (in this case, the upper bound on flow for both decreases from 105 to100). In Table 1, we see that at each step, after placing a slot restriction on the identifiedbottleneck hub, the flow of aircraft through that hub decreases well below the capacity onflow specified by the slot restriction. However, it seems that the topology of the networkfrom Figure 4 contributes towards both of these results. Table 2 presents the number ofspokes which are connected to each distinct pair of hubs, and demonstrates the “symmetry”that exists in the network in Figure 4. We observe that no fewer than six spoke airportscan be commonly connected to each distinct pair of hubs – meaning that every commodity(a spoke-to-spoke itinerary) associated with these spokes may be routed through multiplehubs. Thus, if a particular hub is constrained, a significant number of commodities routedthrough that hub can and will be routed through another hub. For example if only H1 isslot-restricted, then commodities associated with up to nine spoke airports may be routedinstead through H2 alone, which may help explain the substantial “slack” encountered aftera bottleneck hub becomes slot-restricted. This slack also seems to play a role in the non-monotonicity we observe in the increase in the outgoing flows from unconstrained hubs H2,H4 and H5 from Figure 4. Figures 6a and 6b show, respectively, the total outgoing flowsthrough all unconstrained and all constrained hubs as a function of increasing severity of theslot restrictions on the constrained hubs. We see from Figure 6b that the one decrease inflow through unconstrained hubs corresponds to an expected increase through constrainedhubs where each H1 and H3 are constrained to 72 units of flow below their unconstrainedlevel. However, the total decrease in flow through H1 and H3 is more than 250 units of flowbelow their cumulative unconstrained level, meaning a substantial amount of slack exists atboth H1 and H3 at that particular level of the slot restrictions. This slack, along with thepossibility of multiple optima from the nonlinearity of the minimax objective function, maycontribute to the non-monotonicity seen in Figure 5.
16

600
550
500
450
400
350
300
25% 20 40 60 80 100Capacity Reduction on Bottleneck Hubs
(a) Unconstrained hubs
350
300
250
200
150
1000
50 20 40 60 80 100Capacity Reduction on Bottleneck Hubs
(b) Constrained hubs
Figure 6. Total flow on the unconstrained (H2, H4, H5) and constrained (H1,H3) hubairports in the network from Figure 3, as a function of the reduction in capacity of H1 and H3from their unconstrained level of operation, while all spoke airports remain unconstrained.Flow through the constrained hubs decreases as capacity on them is reduced, shifting to theunconstrained hubs, although these relationships are not monotonic. The initial reductionin capacity at both H1 and H3 by two units of flow produces a substantially larger reductionin flow through these two constrained hub airports. This unused capacity at both H1 andH3 perhaps contributes to the non-monotonicity of the increase (decrease) in flow throughthe unconstrained (constrained) hubs.
17

Capacity Outgoing FlowH1 H2 H3 H4 H5 H1 H2 H3 H4 H500 00 00 00 00 172 138 172 84 50167 00 00 00 00 48 226 120 172 50167 221 00 00 00 80 64 226 196 50167 221 221 00 00 99 211 172 84 50167 206 221 00 00 48 142 120 256 50
Table 1. Optimal flow levels for each hub airport (last five columns) and correspondingcapacities for each hub (first five columns) in each row. First row corresponds to the uncon-strained case, and each subsequent row corresponds to a case where a hub either becomesslot-restricted (by placing a finite capacity) or increases the severity of its slot restriction(by reducing the capacity). Bold values indicate the minimum worst-case level of operationfor the given instance of the network.
H1 H2 H3 H4 H5H1 x 9 6 8 9H2 x x 6 9 12H3 x x x 8 13H4 x x x x 11
Table 2. Number of spoke airports connected to each distinct pair of hubs in the networkin Figure 4
6 Concluding Remarks
In response to increasing delays and congestion at airports within the national airspacesystem, much attention has been devoted to studying strategies for managing demand andcapacity for scarce airport resources both on a short-term level and on longer time horizonsfor the purpose of constraining or modifying airport demand patterns. Most strategies foradjusting congestion focus on congestion management at individual airports, without fullyrecognizing that there are global consequences affecting the entire national airspace. Inview of a need for less localized models for strategic decision-making in air transportation,this paper has presented a model for global analysis of the NAS, particularly as it operateswith some degree of local congestion. The MINNTHRU model defines a high-level aggre-gate model of NAS operations, without specifying all details of aircraft, airline and airportoperations, to provide policy makers and regulatory authorities a simple and quick toolfor evaluating potential congestion and capacity issues within the system and the effects ofdecisions to mitigate these issues. This model specifically evaluates congestion as it arisessolely from an airport network topology, with the objective of producing a flow of aircraftwhich minimizes the load on the busiest airport.
One type of decision for reducing congestion is the use of slot restrictions on congestedairports. In a set of case studies on one small network and one medium-sized, “NAS-like”network, we show how MINNTHRU may be used to assess the effects of slot restrictions onthe operation of an entire airport network. For both small and medium networks, whichare hub-spoke type networks, stricter slot restrictions on a congested hub airport lead toincreases in the minimum worst-case operation of any airport and the operation of all uncon-strained hub airports. While these case studies demonstrate the capacity for MINNTHRUto be used in supporting decisions made by airspace users to manage congestion throughthe NAS, they are performed on simplified example networks without accounting for actualflight itineraries and connections as may be found using data from the BTS Origin and
18

Destination Survey [36]. Furthermore, in our analysis, we varied the level of slot restrictionsat airports and observed the global responses. A more relevant question for policymakersand regulatory authorities is what the optimal slot restriction is. The development of atrue strategic NAS testbed for evaluating this and other issues concerning the system-wideimpact of slot restrictions will require a version of MINNTHRU populated with exactly thiskind of data. We anticipate that the future of our model will provide this analysis, as wellas a process of comparison and validation to the known results of previous slot restrictionsin practice.
References
1. Ahuja, R.K., T.L. Magnanti and J.B. Orlin. (1993). Network Flows, Upper Saddle River:Prentice Hall.
2. Ball, M.O., L.M. Ausubel, F. Bernadino, P. Cramton, G. Donohue, M. Hansen andK. Hoffman. (2007). Market-based alternatives for managing congestion at New York’sLaGuardia Airport, Proceedings of the Airneth Annual Conference: Optimal Use ofScarce Airport Capacity, The Hague, April 2007.
3. Ball, M. O., G. Donohue and K. Hoffman, 2005, ”Auctions for the Safe, Efficient and Eq-uitable Allocation of Airspace System Resources”, in Combinatorial Auctions (Cramton,P., Y. Shoham and R. Steinberg, eds.), Cambridge: MIT Press.
4. Ball, M. O., A. Futer, R. Hoffman, J. Sherry. (2002). Rationing schemes for en routeair traffic management. CDM paper, http://www.metronaviation.com/cdm/cr/long_term.html
5. Ball, M. O. and G. Lulli, (2004), ”Ground Delay Programs: Optimizing over the IncludedFlight Set Based on Distance”, Air Traffic Control Quarterly, 12, 1-25.
6. Bazaraa, M.S. and H.D. Sherali. (1981). On the choice of step size in subgradient opti-mization, European Journal of Operational Research, 7, 380-388.
7. Beatty, R., R. Hsu, L. Berry and J. Rome. (1998). Preliminary evaluation of flight delaypropagation through an airline schedule, 2nd USA/Europe Air Traffic Management R& D Seminar, Orlando, December 1-4.
8. Bellman, R.E. (1958). On a routing problem. Quarterly Applied Mathematics, 16, 87-90.
9. Bertsekas, D.P. (1999). Nonlinear Programming (2nd ed.), Belmont: Athena Scientific.
10. Bertsimas, D., S.S. Patterson. (2000). The traffic flow management rerouting problemin air traffic control: A dynamic network flow approach, Transportation Science, 34(3),239-255.
11. Bonnefoy, P.A. and R.J. Hansman. (2007). Scalability and evolutionary dynamics ofair transportation networks in the United States, in 7th AIAA Aviation Technology,Integration and Operations Conference, Belfast, September 18-20.
12. Boyd, S. and L. Vandenberghe. (2004). Convex Optimization, New York: CambridgeUniversity Press.
13. Camerini, P., L. Fratta and F. Maffioli. (1975). On improving relaxation methods bymodified gradient techniques, Mathematical Programming Study, 3, 26-34.
19

14. Cherkassky, B.V. and A.V. Goldberg. (1999). Negative-cycle detection algorithms,Mathematical Programming, 85(2), 277-311.
15. “Congestion Management Rule for John F. Kennedy International Airport and NewarkLiberty International Airport; Final Rule,” Federal Register 73:198 (10 October 2008).
16. “Congestion Management Rule for LaGuardia Airport; Final Rule,” Federal Register73:198 (10 October 2008).
17. DeLaurentis, D., E-P. Han and T. Kotegawa. (2008). Network-theoretic approach foranalyzing connectivity in air transportation networks, Journal of Aircraft, 45(5), 1669-1679.
18. de Neufville, R. and A. Odoni. (2003). Airport Systems: Planning, Design and Manage-ment, New York: McGraw-Hill.
19. Donohue, G.L. (2001). A macroscopic air transportation capacity model: metrics anddelay correlation, in New Concepts and Methods in Air Traffic Management (L. Bianco,P. Dell’Omo, and A.R. Odoni, eds.), Berlin: Springer-Verlag.
20. Fan, T.P. and A. Odoni. (2002). A practical perspective on airport demand management,Air Traffic Control Quarterly, 10(3), 285-306.
21. Federal Aviation Administration. (2004). Airport capacity benchmark report2004. http://www.faa.gov/about/office_org/headquarters_offices/ato/
publications/bench/2004download.htm
22. Federal Aviation Administration. (2007). Traffic flow management in the na-tional airspace system. http://www.fly.faa.gov/Products/Training/Traffic_Management_for_Pilots/TFM_NASv2.pdf
23. Ferguson, J., K. Hoffman, L. Sherry, A.Q. Kara and G. Calderon. (2009). Effects offuel prices and slot controls on air transportation performance at New York airports,in Eighth USA/Europe Air Traffic Management Research and Development Seminar,January 23, 2009.
24. Fisher, M. (1985). An applications oriented guide to lagrangian relaxation, Interfaces,15(2), 10-21.
25. Ford, L.R. and D.R. Fulkerson. (1962). Flows in Networks, Princeton: Princeton Uni-versity Press.
26. Held, M., P. Wolfe and H.P. Crowder. (1974). Validation of subgradient optimization,Mathematical Programming, 6, 62-88.
27. Kleinberg, J. and E. Tardos. (2005). Algorithm Design, Addison-Wesley.
28. Mathworks, Inc. (2009). MATLAB Version 7.8 [Computer Software]. Natick.
29. Mehndiratta, S.R., Kiefer, M., 2003. Impact of slot controls with a market-based alloca-tion mechanism at San Francisco International Airport. Transportation Research PartA, 37, 555-578.
30. Odoni, A.R. (2001). Congestion pricing for airports and en route airspace, in NewConcepts and Methods in Air Traffic Management (L. Bianco, P. Dell’Omo, and A.R.Odoni, eds.), Berlin: Springer-Verlag.
20

31. Pels, E., Verhoef, E.T., (2004). The economics of airport congestion pricing, Journal ofUrban Economics, 55, 257-277.
32. Schneur, R. (1991). Scaling algorithms for multicommodity flow problems and networkflow problems with side constraints, Ph.D. Thesis, Massachusetts Institute of Technol-ogy, Cambridge.
33. Sherry, L. and G. Donohue. (2008). U.S. airline passenger trip delay report 2007, Centerfor Air Transportation Systems Research Report, George Mason University, pp. 5.
34. Shor, N.Z. (1998). Nondifferentiable optimization and polynomial problems, Dordrecht:Kluwer Academic.
35. Sun, D. and A.M. Bayen. (2008). Multicommodity Eulerian-Lagrangian large-capacitycell transmission model for en route traffic, Journal of Guidance, Control and Dynamics,31(3), 616-628.
36. U.S. Bureau of Transport Statistics, http://www.bts.gov [accessed March 22, 2009]
37. U.S. Department of Transportation. (2005). FAA Aerospace Forecasts Fiscal Years 2006-2017, Office of Aviation Policy and Plans, Tech. Rep., March 2005.
38. U.S. House of Representatives. (2000). Wendell H. Ford Aviation Investment and ReformAct for the 21st Century, H.R. 1000, 106th Cong.
39. Vossen, T., Ball, M.O., Hoffman, R. and Wambsganss, M., (2003). A general approachto equity in traffic flow management and its application to mitigating exemption biasin ground delay programs, Air Traffic Control Quarterly, 11, 277-292.
21

REPORT DOCUMENTATION PAGEOForm Approved
MB No. 0704-0188
The public reporting burden for this collection of information is estimated to average 1 hour per response, including the time for reviewing instructions, searching existing data sources,gathering and maintaining the data needed, and completing and reviewing the collection of information. Send comments regarding this burden estimate or any other aspect of thiscollection of information, including suggestions for reducing this burden, to Department of Defense, Washington Headquarters Services, Directorate for Information Operations andReports (0704-0188), 1215 Jefferson Davis Highway, Suite 1204, Arlington, VA 22202-4302. Respondents should be aware that notwithstanding any other provision of law, no personshall be subject to any penalty for failing to comply with a collection of information if it does not display a currently valid OMB control number.PLEASE DO NOT RETURN YOUR FORM TO THE ABOVE ADDRESS.
1. REPORT DATE (DD-MM-YYYY) 2. REPORT TYPE 3. DATES COVERED (From - To)
01-03 - 2010 Technical Memorandum4. TITLE AND SUBTITLE 5a. CONTRACT NUMBER
A Minimax Network Flow Model for Characterizing the Impact of SlotRestrictions 5b. GRANT NUMBER
5c. PROGRAM ELEMENT NUMBER
6. AUTHOR(S) 5d. PROJECT NUMBER
Lee, Douglas W.; Patek, Stephen D.; Alexandrov, Natalia; Bass, Ellen J.;Kincaid, Rex K. 5e. TASK NUMBER
5f. WORK UNIT NUMBER
305295.02.07.07.027. PERFORMING ORGANIZATION NAME(S) AND ADDRESS(ES) 8. PERFORMING ORGANIZATION
NASA Langley Research Center REPORT NUMBER
Hampton, VA 23681-2199L-19841
9. SPONSORING/MONITORING AGENCY NAME(S) AND ADDRESS(ES) 10. SPONSOR/MONITOR'S ACRONYM(S)
National Aeronautics and Space Administration NASAWashington, DC 20546-0001
11. SPONSOR/MONITOR'S REPORTNUMBER(S)
NASA/TM-2010-21620712. DISTRIBUTION/AVAILABILITY STATEMENTUnclassified - UnlimitedSubject Category 03Availability: NASA CASI (443) 757-580213. SUPPLEMENTARY NOTES
14. ABSTRACT
This paper proposes a model for evaluating long-term measures to reduce congestion at airports in the National Airspace System (NAS). This model isconstructed with the goal of assessing the global impacts of congestion management strategies, specifically slot restrictions. We develop the Minimax NodeThroughput Problem (MINNTHRU), a multicommodity network flow model that provides insight into air traffic patterns when one minimizes the worst-caseoperation across all airports in a given network. MINNTHRU is thus formulated as a model where congestion arises from network topology. It reflects notmarket-driven airline objectives, but those of a regulatory authority seeking a distribution of air traffic beneficial to all airports, in response to congestionmanagement measures. After discussing an algorithm for solving MINNTHRU for moderate-sized (30 nodes) and larger networks, we use this model to studythe impacts of slot restrictions on the operation of an entire hub-spoke airport network. For both a small example network and a medium-sized network basedon 30 airports in the NAS, we use MINNTHRU to demonstrate that increasing the severity of slot restrictions increases the traffic around unconstrained hubairports as well as the worst-case level of operation over all airports.
15. SUBJECT TERMS
Air transportation; Multicommodity flows; Minimax problems; Congestion management; Airport capacity; Transportationnetworks; Slot restrictions
16. SECURITY CLASSIFICATION OF: 17. LIMITATION OF 18. NUMBER 19a. NAME OF RESPONSIBLE PERSONABSTRACT
PAOFPAGESGES Help Desk email: hel sti.nasa. ovp ( p@ g )a. REPORT b. ABSTRACT c. THIS PAGE
19b. TELEPHONE NUMBER (Include area code)
U U U UU 26 (443) 757-5802Standard Form 298 (Rev. 8-98)Prescribed by ANSI Std. Z39.18