a microarray-based genetic screen for yeast chronological ......model eukaryotic organisms such as...
TRANSCRIPT

A Microarray-Based Genetic Screen for YeastChronological Aging FactorsMirela Matecic1, Daniel L. Smith, Jr.1, Xuewen Pan2, Nazif Maqani1, Stefan Bekiranov1, Jef D. Boeke2,
Jeffrey S. Smith1*
1 Department of Biochemistry and Molecular Genetics, University of Virginia Health System, School of Medicine, Charlottesville, Virginia, United States of America,
2 Department of Molecular Biology and Genetics, High Throughput Biology Center, Johns Hopkins University School of Medicine, Baltimore, Maryland, United States of
America
Abstract
Model organisms have played an important role in the elucidation of multiple genes and cellular processes that regulateaging. In this study we utilized the budding yeast, Saccharomyces cerevisiae, in a large-scale screen for genes that function inthe regulation of chronological lifespan, which is defined by the number of days that non-dividing cells remain viable. Apooled collection of viable haploid gene deletion mutants, each tagged with unique identifying DNA ‘‘bar-code’’ sequenceswas chronologically aged in liquid culture. Viable mutants in the aging population were selected at several time points andthen detected using a microarray DNA hybridization technique that quantifies abundance of the barcode tags. Multipleshort- and long-lived mutants were identified using this approach. Among the confirmed short-lived mutants were thosedefective for autophagy, indicating a key requirement for the recycling of cellular organelles in longevity. Defects inautophagy also prevented lifespan extension induced by limitation of amino acids in the growth media. Among theconfirmed long-lived mutants were those defective in the highly conserved de novo purine biosynthesis pathway (the ADEgenes), which ultimately produces IMP and AMP. Blocking this pathway extended lifespan to the same degree as calorie(glucose) restriction. A recently discovered cell-extrinsic mechanism of chronological aging involving acetic acid secretionand toxicity was suppressed in a long-lived ade4D mutant and exacerbated by a short-lived atg16D autophagy mutant. Theidentification of multiple novel effectors of yeast chronological lifespan will greatly aid in the elucidation of mechanismsthat cells and organisms utilize in slowing down the aging process.
Citation: Matecic M, Smith DL, Jr., Pan X, Maqani N, Bekiranov S, et al. (2010) A Microarray-Based Genetic Screen for Yeast Chronological Aging Factors. PLoSGenet 6(4): e1000921. doi:10.1371/journal.pgen.1000921
Editor: Stuart K. Kim, Stanford University Medical Center, United States of America
Received August 24, 2009; Accepted March 24, 2010; Published April 22, 2010
Copyright: � 2010 Matecic et al. This is an open-access article distributed under the terms of the Creative Commons Attribution License, which permitsunrestricted use, distribution, and reproduction in any medium, provided the original author and source are credited.
Funding: This work was funded by grants from the National Institutes of Health (http://www.nih.gov/) to JSS (RO1 AG022685) and JDB (R24 DK082840). Thefunder had no role in study design, data collection and analysis, decision to publish, or preparation of the manuscript.
Competing Interests: The authors have declared that no competing interests exist.
* E-mail: [email protected]
Introduction
Model eukaryotic organisms such as Drosophila and C. elegans
have played important roles in the identification of genes and the
molecular characterization of cellular and biochemical pathways
that affect the aging process [1]. For example, large-scale
systematic RNAi knockdown screens for lifespan extension with
C. elegans have implicated multiple genes that regulate metabolism,
signal transduction, protein turnover, and gene expression [2,3].
The budding yeast, Saccharomyces cerevisiae, has also been particu-
larly useful, especially in characterizing the NAD+-dependent
protein deacetylase, Sir2, as a replicative lifespan (RLS) factor [4].
RLS is defined by the number of mitotic cell divisions that a
mother cell undergoes prior to senescencing [5].
Yeast lifespan can also be measured chronologically, where the
time that non-dividing cells remain viable is monitored [6]. This
chronological lifespan (CLS) is typically measured in cells that
have entered stationary phase (G0). Both types of yeast aging share
multiple effectors of lifespan related to nutrient signaling. Deletion
of SCH9 extends both RLS and CLS [6,7]. Sch9 is related to the
serine/threonine kinase (Akt), that in higher eukaryotes functions
in insulin-like growth factor (IGF) signaling pathways that have
been linked to lifespan regulation [6]. Mutations in the Target of
Rapamycin (TOR) signaling pathway also extend both types of
lifespan in yeast [8–10], as well as in C. elegans [11]. The overlap
between CLS and RLS extends to the effects of calorie restriction
(CR), a dietary regimen shown to extend the mean and maximum
lifespan of rodents [12]. In the yeast system, CR consists of
reducing the glucose concentration in the growth medium from
the non-restricted (NR) level of 2% (w/v) to the CR level of 0.5%
or lower [13,14]. CR extends both RLS and CLS [13–16],
consistent with the general theme of conserved nutrient signaling
pathways playing major roles in longevity. CR, sch9D, and tor1Dconditions all cause a shift in glucose metabolism from
fermentation toward respiration in both lifespan systems
[10,16,17], revealing a strong link with mitochondrial function.
Despite the numerous similarities in nutrient-mediated responses
between RLS and CLS, there are also significant differences. One
of the most striking is that while SIR2 promotes RLS and is
reported to be required for lifespan extension by CR [14], deletion
of SIR2 mildly extends CLS and is not required for CR-mediated
lifespan extension in this system [15,16]. Instead, Sir2-mediated
deacetylation of the gluconeogenesis enzyme Pck1 limits the large
extension of CLS caused by extreme CR conditions [18].
Due to its simplicity, CLS has been amenable to genome-wide
functional aging screens. A previous screen for long-lived mutants
PLoS Genetics | www.plosgenetics.org 1 April 2010 | Volume 6 | Issue 4 | e1000921

used the yeast knockout (YKO) collection of individual diploid
deletion mutants to individually test each mutant for CLS while
incubating in 96-well plates. Several deletion mutants downstream
of the TOR signaling pathway were identified, thus implicating
TOR signaling in lifespan control [8]. In our study we have
utilized the YKO collection to identify additional genetic factors
that influence CLS through a different approach. A microarray-
based genetic screen was performed on the collection, with the
goal of determining which deletion mutants shorten or extend
lifespan under NR or CR growth conditions. We report the
identification of several classes of short-lived mutants, including
those that affect mitochondrial function and the autophagy
pathway. We also identify and characterize long-lived mutants in
the highly conserved de novo purine biosynthesis pathway that
generates IMP, AMP, and GMP. Deletion of genes in this
pathway extended lifespan equally to the effect of CR, and CR did
not further extend the lifespan of the mutants, suggesting that
there are overlapping mechanisms between these two conditions
that promote longevity. We show that the de novo purine
biosynthesis mutants alter the surrounding growth medium in a
way that extends the lifespan of WT cells, pointing to a cell-
extrinsic component of CLS regulation.
Results
A microarray-based screen for yeast genes involved inchronological life span
We took advantage of the YKO collection of gene deletion
mutants [19], in which each individual gene is replaced by the
selection marker (kanMX4) and flanked by specific UPTAG and
DNTAG sequences (Figure 1A). Viable mutants from the haploid
collection were pooled together and grown in synthetic complete
(SC) medium that contained either 2% glucose (non-restricted/
NR) or 0.5% glucose (calorie restricted/CR). On days 1, 9, 21,
and 33, aliquots were removed and spread onto YPD plates to
recover mutants that remained viable (Figure 1B). The TAG
sequences present in the recovered cells were PCR amplified using
universal primers labeled with Cy3 for day 1, or Cy5 for days 9,
21, and 33 (Figure 1B). Following microarray co-hybridizations,
the relative abundance of each mutant was determined by the
ratio of Cy5 signal (days 9, 21, or 33) to the Cy3 signal (day 1). (see
Table S1 for ratios).
Under- or over-representation of a particular mutant’s DNA in
the aging population was predicted to be indicative of its CLS
relative to the other mutants. As expected, the abundance ratios of
the TAG signals for most mutants decreased over time in the NR
culture (Figure 1C), indicating that most mutants in the population
lost viability (aged). By day 33, when the WT strain was completely
dead (Figure 1B, spot assay), there were a limited number of viable
mutants in the population that could potentially be extremely
long-lived (Figure 1C, data shown for the NR population). The
viability of most mutants at day 33 was greater in the CR growth
condition than in the NR condition (Figure 1D), suggesting that
most mutants respond to CR by extending their CLS.
Specific classes of short-lived and CR–unresponsivemutants
To conservatively choose a subset of mutants for retesting
the predicted short CLS phenotype, we set two separate threshold
criteria. First, the abundance ratios at day 9 for both TAGs had to
be ranked in the bottom 200. Second, the abundance ratio at day
21 had to be less than 0.3 for both TAGs, which represented the
bottom quartile for this time point (Figure 1C). The day 33
abundance ratios were not considered because most mutants were
dead by then (Figure 1C). The result was 117 candidate mutants
predicted to be short-lived (Table S2). Out of this list of 117
mutants, we individually retested 16 of them for CLS, and found
13 (81.3%) to actually be short-lived (Table S2). Interestingly, 42
of the 117 candidate genes were related to mitochondrial function
in some way (Table S2), most likely because respiration defects
prevent cells from properly transitioning through the diauxic shift,
thus reducing stationary phase viability [20]. Another major sub-
class from the 117 candidates included 10 of the ‘‘ATG’’ genes
involved in autophagy. As shown in Figure 2A, the autophagy
mutants that we directly tested generally caused a short CLS in 2%
glucose as predicted by the screen. The CLS of these mutants was
fully extended by the CR condition (Figure 2A), which was
somewhat surprising because earlier work in C. elegans showed
that autophagy was required for dietary restriction (DR)-mediated
extension of lifespan [21,22]. All mutants that were tested
for various reasons in this study and found to have a short
CLS in 2% glucose, including the atg mutants, are listed in
Table S3.
We were also interested in identifying mutants whose lifespan
was not extended by CR. Such mutants were predicted to have
similar abundance ratios in the NR and CR conditions across the
time course. Many mutants initially appeared to fit this category,
which required them to have average NR and CR log rations
within 10% of each other (see Materials and Methods). However,
only 2 of 41 mutants retested (4.9%) were actually confirmed as
being CR-unresponsive. These two affected genes were NFU1 and
FET3, both of which encode proteins involved in iron homeostasis.
The CLSs of these two mutants were slightly shorter than WT
when grown under NR conditions, and, as predicted from the
screen, were not extended by CR (Figure 2B and 2C, and data not
shown). NFU1 encodes a mitochondrial matrix protein thought to
be involved in iron-sulfur complex biogenesis [23], an important
part of the electron transport cascade within the mitochondrial
membrane. Its close link with respiration could explain why the
nfu1D mutant had a shorter lifespan in the CR condition than in
the NR condition (data not shown).
FET3 encodes a multicopper oxidase, that along with the iron
permease (Ftr1), comprises a high affinity iron uptake system [24],
initially suggesting that high affinity transport of iron is required in
Author Summary
The aging process is associated with the onset of severalage-associated diseases including diabetes and cancer. Inrodent model systems, the dietary regimen known ascaloric restriction (CR) is known to delay or prevent thesediseases and to extend lifespan. As a result, there is a greatdeal of interest in understanding the mechanisms bywhich CR functions. The budding yeast, Saccharomycescerevisiae, has proven to be an effective model for theanalysis of genes and cellular pathways that contribute tothe regulation of aging. In this study we have performed amicroarray-based genetic screen in yeast that identifiedshort- and long-lived mutants from a population thatcontained each of the viable haploid gene deletionmutants from the yeast gene knockout collection thatwere pooled together. Using such an approach, we wereable to identify genes from several pathways that had notbeen previously implicated in aging, including some thatappear to contribute to the CR effect induced byrestriction of either amino acids or sugar. These resultsare expected to provide new groundwork for futuremechanistic aging studies in more complex organisms.
Screening for Yeast Aging Factors
PLoS Genetics | www.plosgenetics.org 2 April 2010 | Volume 6 | Issue 4 | e1000921
CR-induced CLS determination. However, even though an ftr1Dmutant exhibited a slight shortening of CLS in the NR condition
similar to the fet3D mutant, CR still induced full CLS extension
(Figure 2D). Another protein, Fit3, is one of three secreted
mannoproteins that functions in the retention of siderophore-iron
in the cell wall, which can be released and then imported by the
Fet3/Ftr1 transport system [25]. Deletion of FIT3 had no affect on
CLS, and like the ftr1D mutant, its CLS was extended by CR
(Figure 2D). Taken together, these results suggest that Fet3 may
have a function independent of Ftr1-mediated iron transport at the
plasma membrane that is important for CLS during CR growth
conditions.
Identification of long-lived mutantsTo identify long-lived mutants, we again defined conservative
thresholds in which the day 33/day1 signal ratio had to be in
the top 500 for both the UP-and DN-tags. The day 21/day1
ratio also had to be greater than 1.0 for both TAGs, resulting in
a list of 40 mutants (Table 1). Twelve out of the 39 mutants
retested (30.7%) had a long CLS (several shown in Figure 3A).
Isolation of the de novo NAD+ biosynthesis gene, BNA2, was
consistent with the long CLS of a strain lacking BNA1 [16].
YPL056C, YLR104W, and YGL085C, were previously unchar-
acterized and have now been named based on their Long
Chronological Lifespan phenotype as LCL1, LCL2, and LCL3,
respectively. The lcl1D mutant was previously shown to be
resistant to the antifungal drug fluconazole [26], and the lcl2Dmutant has deficient levels of mannosylphosphate in the cell wall
[27], suggesting that both of these genes may function in cell
wall integrity. DCW1 encodes a putative mannosidase involved
in cell well biosynthesis [28], again pointing to the importance
of cell wall structure and function in longevity. LCL3 encodes a
protein with homology to Staphylococcus aureus nuclease [29].
Three of the long-lived mutants were involved in either de novo
purine biosynthesis (ADE3 and ADE4) or purine import (FCY2)
[30–32]. Ade4 catalyzes the first step of the pathway, while
Ade3 functions in one-carbon metabolism, which donates
tetrahydrofolate-linked carbon units for synthesis of the purine
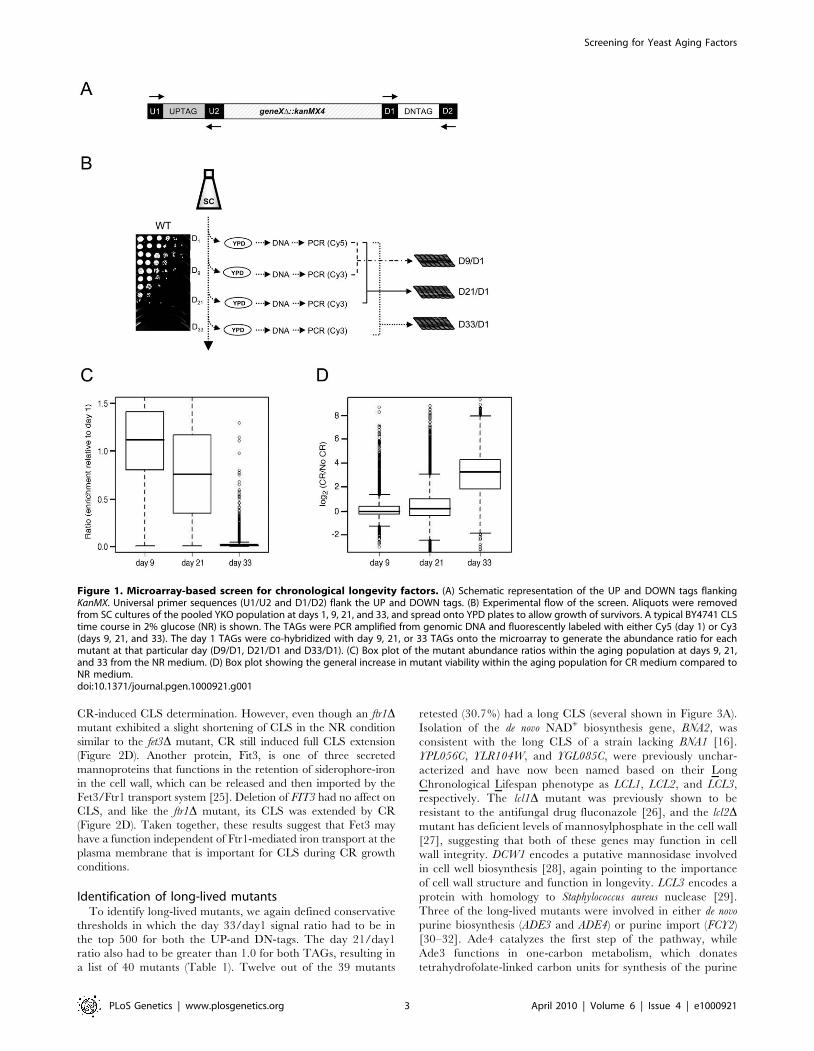
Figure 1. Microarray-based screen for chronological longevity factors. (A) Schematic representation of the UP and DOWN tags flankingKanMX. Universal primer sequences (U1/U2 and D1/D2) flank the UP and DOWN tags. (B) Experimental flow of the screen. Aliquots were removedfrom SC cultures of the pooled YKO population at days 1, 9, 21, and 33, and spread onto YPD plates to allow growth of survivors. A typical BY4741 CLStime course in 2% glucose (NR) is shown. The TAGs were PCR amplified from genomic DNA and fluorescently labeled with either Cy5 (day 1) or Cy3(days 9, 21, and 33). The day 1 TAGs were co-hybridized with day 9, 21, or 33 TAGs onto the microarray to generate the abundance ratio for eachmutant at that particular day (D9/D1, D21/D1 and D33/D1). (C) Box plot of the mutant abundance ratios within the aging population at days 9, 21,and 33 from the NR medium. (D) Box plot showing the general increase in mutant viability within the aging population for CR medium compared toNR medium.doi:10.1371/journal.pgen.1000921.g001
Screening for Yeast Aging Factors
PLoS Genetics | www.plosgenetics.org 3 April 2010 | Volume 6 | Issue 4 | e1000921

ring (see Figure 3B). Fcy2 is a purine/cytosine permease that
mediates transport of purine bases (adenine, guanine, hypoxan-
thine), and a specific pyrimidine base (cytosine) across the
plasma membrane into the cell. Additional mutants were
analyzed for CLS outside of the selection criteria. Those
mutants that exhibited an extended lifespan under NR
conditions are listed in Table S4, while those with a normal
lifespan under NR conditions are listed in Table S5.
Characterization of the ADE pathway in CLS regulationThe effects of the de novo purine biosynthesis pathway on aging
have not been well studied. In Drosophila melanogaster, mutations in
the pathway cause pleiotropic effects due to general purine
deficiency, one of them being a short lifespan [33]. In yeast, the
pathway was not previously implicated in lifespan regulation. The
de novo purine biosynthesis pathway is highly conserved and
consists of ten consecutive reactions catalyzed by the ADE gene
products that convert 5-phosphoribosyl 1-pyrophosphate (PRPP)
to inosine monophosphate (IMP), which is then used for AMP and
GMP synthesis (Figure 3B). There are also purine salvage
pathways that either import extracellular purines via Fcy2 or
utilize endogenous purines to synthesize IMP, GMP or AMP
through only a few enzymatic steps (Figure 3C; for review see
[34]). Deleting other genes in the de novo synthesis pathway such as
ADE1, ADE2, ADE5,7, ADE6, or ADE12 significantly extended
CLS (Figure 3C and data not shown). ADE13 is essential and
ade8D was not available in our KO collection, so they were not
tested. The lone exception encountered was an ade17D mutant,
which had a lifespan modestly, but reproducibly, shorter than WT
(Figure 3C). Ade17, as well as Ade16, catalyzes the conversion of
5-aminoimidazole-4-carboxamide-1-b-D-ribofuranoside (AICAR)
into 59-phosphoribosyl-5-formaminoimidazole-4-carboxamide
(FAICAR). The major enzyme in this step is Ade17, being
responsible for ,90% of AICAR transformylase activity [35].
Mutants in the purine salvage pathways (AAH1, APT1, or HPT1)
or the one-carbon metabolism pathway (MTD1, SHM2, or SHM1)
also extended CLS, but to a lesser extent than mutants in the de
novo pathway (Figure 3C). The effects of these two pathways on
CLS may, therefore, be mediated by a secondary effect on
regulation of the de novo pathway.
Figure 2. Deletion mutants that shorten CLS. (A) Various deletions of autophagy genes isolated from the screen as short-lived were retestedindividually for CLS in NR and CR media. (B) Semi-quantitative CLS assay comparing a fet3D mutant to WT in NR and CR media. (C) Quantitative CLSassay for the same fet3D and WT strains in NR and CR media. Colony forming units (CFU) are plotted over time. (D) CLS assay showing CR-mediatedextension of lifespan in ftr1D and fit3D mutants.doi:10.1371/journal.pgen.1000921.g002
Screening for Yeast Aging Factors
PLoS Genetics | www.plosgenetics.org 4 April 2010 | Volume 6 | Issue 4 | e1000921
The de novo synthesis of purine nucleotides is regulated at the
genetic and enzymatic levels. Enzymatically, the first step of the
pathway catalyzed by Ade4 is feedback-inhibited by the end
products ADP and ATP [36]. Genetically, excess adenine has a
repressing effect on ADE regulon genes, while depletion of adenine
results in transcriptional up-regulation due to the activity of
transcription factors Bas1 and Bas2/Pho2 [37,38]. Regulation of
all the de novo pathway genes, with the exception of ADE16, is
achieved via the Bas1/Pho2 complex [39]. It is proposed that the
AICAR or SAICAR intermediates promote Bas1-Pho2 dimeriza-
tion, resulting in the up-regulation of ADE-gene transcription
[36,38,40]. Since we observed CLS extension in ade mutants
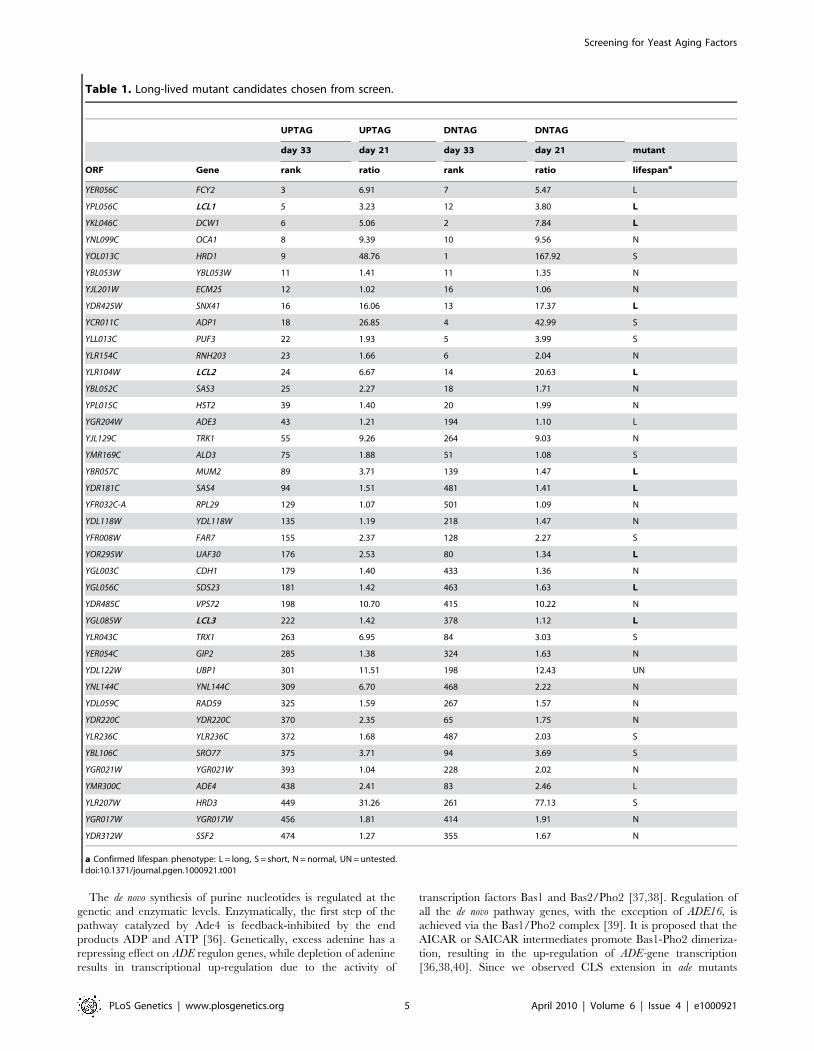
Table 1. Long-lived mutant candidates chosen from screen.
UPTAG UPTAG DNTAG DNTAG
day 33 day 21 day 33 day 21 mutant
ORF Gene rank ratio rank ratio lifespana
YER056C FCY2 3 6.91 7 5.47 L
YPL056C LCL1 5 3.23 12 3.80 L
YKL046C DCW1 6 5.06 2 7.84 L
YNL099C OCA1 8 9.39 10 9.56 N
YOL013C HRD1 9 48.76 1 167.92 S
YBL053W YBL053W 11 1.41 11 1.35 N
YJL201W ECM25 12 1.02 16 1.06 N
YDR425W SNX41 16 16.06 13 17.37 L
YCR011C ADP1 18 26.85 4 42.99 S
YLL013C PUF3 22 1.93 5 3.99 S
YLR154C RNH203 23 1.66 6 2.04 N
YLR104W LCL2 24 6.67 14 20.63 L
YBL052C SAS3 25 2.27 18 1.71 N
YPL015C HST2 39 1.40 20 1.99 N
YGR204W ADE3 43 1.21 194 1.10 L
YJL129C TRK1 55 9.26 264 9.03 N
YMR169C ALD3 75 1.88 51 1.08 S
YBR057C MUM2 89 3.71 139 1.47 L
YDR181C SAS4 94 1.51 481 1.41 L
YFR032C-A RPL29 129 1.07 501 1.09 N
YDL118W YDL118W 135 1.19 218 1.47 N
YFR008W FAR7 155 2.37 128 2.27 S
YOR295W UAF30 176 2.53 80 1.34 L
YGL003C CDH1 179 1.40 433 1.36 N
YGL056C SDS23 181 1.42 463 1.63 L
YDR485C VPS72 198 10.70 415 10.22 N
YGL085W LCL3 222 1.42 378 1.12 L
YLR043C TRX1 263 6.95 84 3.03 S
YER054C GIP2 285 1.38 324 1.63 N
YDL122W UBP1 301 11.51 198 12.43 UN
YNL144C YNL144C 309 6.70 468 2.22 N
YDL059C RAD59 325 1.59 267 1.57 N
YDR220C YDR220C 370 2.35 65 1.75 N
YLR236C YLR236C 372 1.68 487 2.03 S
YBL106C SRO77 375 3.71 94 3.69 S
YGR021W YGR021W 393 1.04 228 2.02 N
YMR300C ADE4 438 2.41 83 2.46 L
YLR207W HRD3 449 31.26 261 77.13 S
YGR017W YGR017W 456 1.81 414 1.91 N
YDR312W SSF2 474 1.27 355 1.67 N
a Confirmed lifespan phenotype: L = long, S = short, N = normal, UN = untested.doi:10.1371/journal.pgen.1000921.t001
Screening for Yeast Aging Factors
PLoS Genetics | www.plosgenetics.org 5 April 2010 | Volume 6 | Issue 4 | e1000921
lacking an enzyme upstream of the AICAR intermediate and CLS
shortening for the ade17D mutant that likely accumulates AICAR
[40], we generated an ade4D ade17D double mutant and tested
CLS. As shown in Figure 4A, the ade4D mutation was epistatic to
the ade17D mutation for lifespan in the double mutant, initially
consistent with a hypothesis that accumulation of AICAR shortens
CLS of the ade17D mutant. However, completely blocking the
AICAR to FAICAR step of the de novo pathway with an ade16D
ade17D double mutant, surprisingly resulted in CLS extension
(Figure 4A).
Since excess adenine represses the de novo purine synthesis
pathway, we next tested whether excess adenine would extend
CLS. The SC medium contained either our standard limiting
concentration of adenine (30 mg/L) or a 4-fold excess (120 mg/L),
which represses the de novo pathway. Surprisingly, excess adenine
did not extend the CLS of a WT strain, but instead suppressed the
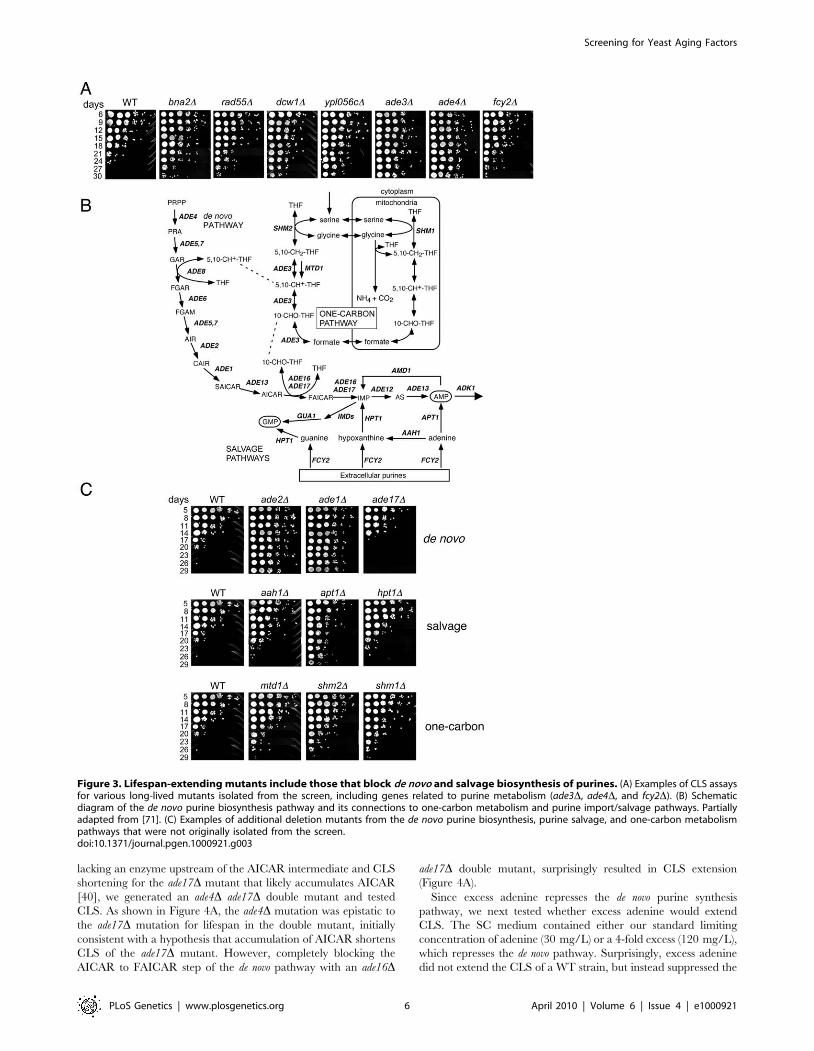
Figure 3. Lifespan-extending mutants include those that block de novo and salvage biosynthesis of purines. (A) Examples of CLS assaysfor various long-lived mutants isolated from the screen, including genes related to purine metabolism (ade3D, ade4D, and fcy2D). (B) Schematicdiagram of the de novo purine biosynthesis pathway and its connections to one-carbon metabolism and purine import/salvage pathways. Partiallyadapted from [71]. (C) Examples of additional deletion mutants from the de novo purine biosynthesis, purine salvage, and one-carbon metabolismpathways that were not originally isolated from the screen.doi:10.1371/journal.pgen.1000921.g003
Screening for Yeast Aging Factors
PLoS Genetics | www.plosgenetics.org 6 April 2010 | Volume 6 | Issue 4 | e1000921
long CLS phenotype of ade2D, ade3D, or ade4D mutants (Figure 4B
and data not shown). This effect was specific to the long-lived ade
mutants, because excess adenine did not shorten the CLS of two
long-lived mutants with inhibited TOR signaling, tor1D and gln3D(Figure 4B). The fcy2D mutation blocks adenine transport, so the
addition of excess adenine did not affect CLS.
The long CLS of the ade mutants was reminiscent of the CR
effect, suggesting there could be some degree of overlap between
the two. To test this idea, CLS of the WT and ade4D mutant was
measured using the semi-quantitative spot growth assay
(Figure 5A), and a quantitative colony forming unit assay that
can detect more subtle changes in CLS (Figure 5B). Both assays
showed there was no additive effect on CLS when combining the
genetic factor (ade4D) and the environmental factor (CR), at least
for the duration of the experiment (36 days). This was consistent
with some overlap in function or involved pathways. To further
test this possibility, we also examined the effect of deleting ADE4
on the CLS of an autophagy mutant (atg16D). While the CR
growth condition fully extended CLS of the atg16D mutant
(Figure 2A), deleting ADE4 from the atg16D mutant only resulted
in a partial extension of CLS (Figure 4A). Therefore, one of the
differences between CR and the ade4D mutant in CLS extension is
a differential requirement for autophagy.
Media effects on CLSAn earlier large-scale screen for long-lived yeast mutants did not
uncover the de novo purine biosynthesis pathway genes [8]. We
noticed that one of the differences between our study and the
earlier study was the media composition used for the CLS assays.
In general, the SC medium used in our study (Hopkins mix) is
relatively rich in most amino acids compared to the SC medium
used in the earlier study, which is described in Current Protocols
in Molecular Biology [41], and abbreviated here as ‘‘CPMB’’ mix
(Table S6). We compared the effects of each SC mix on the CLS
of WT, ade4D, atg16D, and fet3D strains. As shown in Figure 5C,
CLS of the WT strain was significantly longer in the CPMB media
than in the Hopkins medium, even though glucose was 2% in
both. As a result, the WT and ade4D lifespans were indistinguish-
able in the CPMB medium. Interestingly, the CPMB media did
not extend the short CLS of the atg16D mutant (Figure 5C), even
though reducing the glucose concentration in Hopkins medium
fully extended its CLS (Figure 2A). Similar results were observed
with several other autophagy mutants (data not shown), consistent
with autophagy being required for mediating the effects of amino
acid restriction on CLS. In contrast, the short CLS of the fet3Dmutant, which was not extended by glucose CR (Figure 2B), was
also not extended by the CPMB media (Figure 5C), making Fet3
important for mediating the effects of both glucose restriction and
amino acid restriction on CLS.
Cell-extrinsic effects on CLSConsidering the large effects of media composition on CLS, we
next investigated whether any of the mutants isolated from the screen
could influence longevity via cell-extrinsic factors that are secreted or
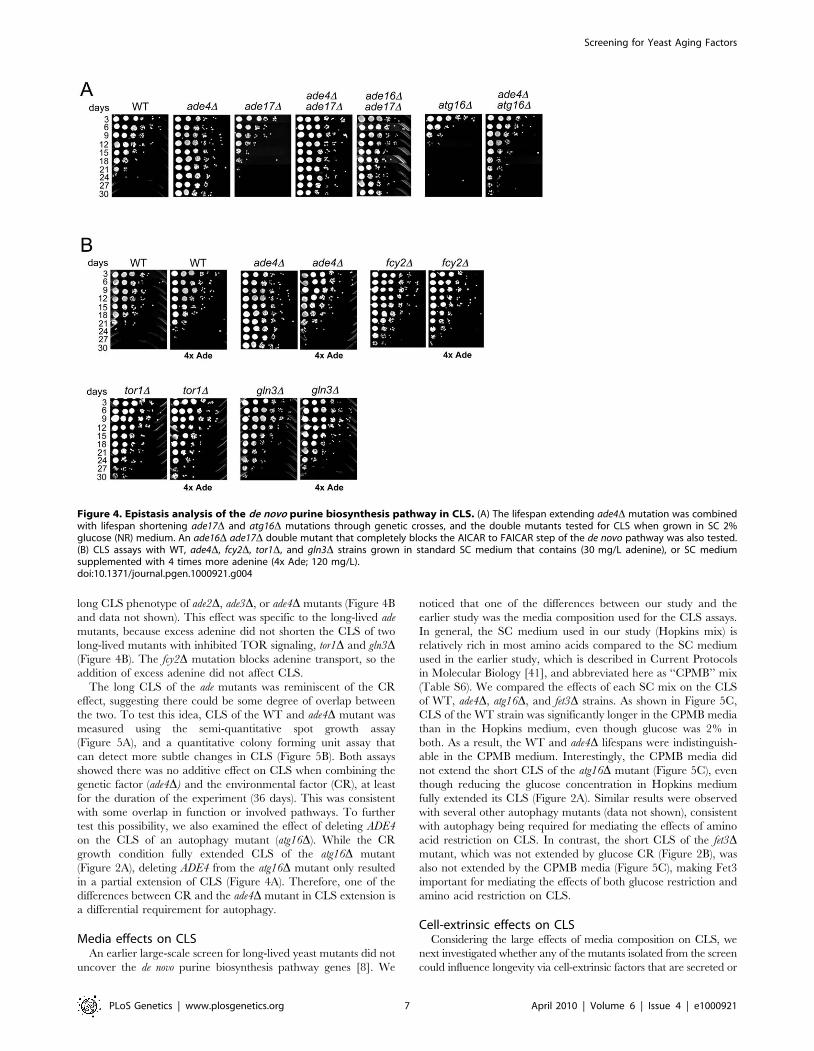
Figure 4. Epistasis analysis of the de novo purine biosynthesis pathway in CLS. (A) The lifespan extending ade4D mutation was combinedwith lifespan shortening ade17D and atg16D mutations through genetic crosses, and the double mutants tested for CLS when grown in SC 2%glucose (NR) medium. An ade16D ade17D double mutant that completely blocks the AICAR to FAICAR step of the de novo pathway was also tested.(B) CLS assays with WT, ade4D, fcy2D, tor1D, and gln3D strains grown in standard SC medium that contains (30 mg/L adenine), or SC mediumsupplemented with 4 times more adenine (4x Ade; 120 mg/L).doi:10.1371/journal.pgen.1000921.g004
Screening for Yeast Aging Factors
PLoS Genetics | www.plosgenetics.org 7 April 2010 | Volume 6 | Issue 4 | e1000921
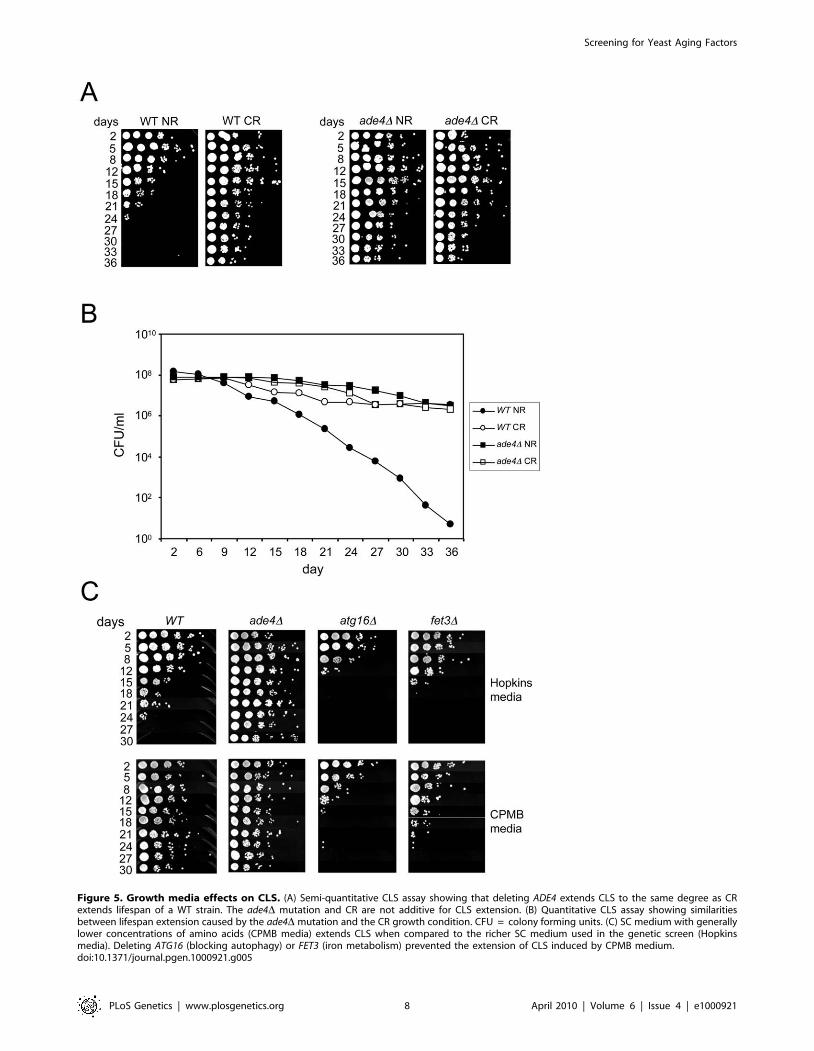
Figure 5. Growth media effects on CLS. (A) Semi-quantitative CLS assay showing that deleting ADE4 extends CLS to the same degree as CRextends lifespan of a WT strain. The ade4D mutation and CR are not additive for CLS extension. (B) Quantitative CLS assay showing similaritiesbetween lifespan extension caused by the ade4D mutation and the CR growth condition. CFU = colony forming units. (C) SC medium with generallylower concentrations of amino acids (CPMB media) extends CLS when compared to the richer SC medium used in the genetic screen (Hopkinsmedia). Deleting ATG16 (blocking autophagy) or FET3 (iron metabolism) prevented the extension of CLS induced by CPMB medium.doi:10.1371/journal.pgen.1000921.g005
Screening for Yeast Aging Factors
PLoS Genetics | www.plosgenetics.org 8 April 2010 | Volume 6 | Issue 4 | e1000921

released into the growth media. For example, secreted purine
compounds such as adenine and hypoxanthine have previously been
implicated in the regulation of meiosis within a sporulating yeast
culture [42]. Additionally, we noticed during this study that expired
medium from NR cultures would reverse the long CLS of CR-grown
cells, and expired medium from CR cultures would extend CLS of
NR-grown cells (D.L. Smith Jr., unpublished data). A similar finding
was recently published by the Kaeberlein lab, who reported that
acetic acid secreted into the medium during NR growth conditions
correlated with the short lifespan, and that CR conditions prevented
acetic acid secretion [43]. Reduced exposure to acetic acid in the CR
cultures was specifically shown to extend CLS, therefore providing a
possible mechanism for how CR extends CLS. Interestingly, other
conditions that extend CLS such as high media osmolarity or deletion
of SCH9 have been proposed to make the cells more resistant to the
acetic acid accumulation, rather than blocking organic acid
production and secretion [43]. Taken together, these observations
raised the question of whether any mutants isolated from our screen
could affect CLS through a similar cell extrinsic mechanism.
To test for cell extrinsic effects we grew WT, ade4D, and atg16Dstrains in SC 2% glucose (NR) medium for 5 days into stationary
phase. The cells were then pelleted and the expired medium was
filtered and swapped in various combinations (Figure 6A). For
example, the WT cells received expired medium from the ade4D or
atg16D cells, and vice versa. The media-swapped cultures were
then followed through a standard CLS assay (Figure 6B).
Interestingly, the CLS of WT and atg16D cells was extended
when incubated in expired medium from the long-lived ade4Dcells. In the reciprocal swap, medium from the WT cells largely
suppressed the long CLS of the ade4D mutant, but had no effect on
the atg16D mutant. Expired medium from the short-lived atg16Dmutant did not shorten CLS of the WT strain, but shortened CLS
of the ade4D mutant (Figure 6B). The expired atg16D medium also
tended to induce an adaptive regrowth effect, as shown in
Figure 6B for the ade4D mutant, where nutrients released by dying
cells in the stationary phase culture allow some of the remaining
viable cells to regrow and populate the culture [44]. The ade4Dand atg16D mutants therefore do alter the growth media in a way
that can impact CLS.
The secretion of organic acids (including acetic acid) and CO2
into the growth medium during fermentation results in a reduction
of pH. The toxicity of acetic acid on yeast cells requires a low pH
[43]. Therefore, we next tested whether CLS of these mutants
correlated with changes in media pH. WT, ade4D, ade17D, and
atg16D strains were grown in SC medium containing 2% glucose
(NR) or 0.5% glucose (CR), and the pH of the media was
measured over time. As expected, the pH of NR medium for WT
cells decreased from ,3.9 to ,3.15 during the first 24 hr of
growth and then leveled off. For WT cells in CR medium, the pH
still decreased, but only to ,3.5 by day 5. Media from the short-
lived atg16D and ade17D mutants had pH profiles across the time
course that were similar to the long-lived ade4D mutant regardless
of the starting glucose concentration, indicating that CLS did not
correlate with overall pH of the media. However, the lack of a
correlation between pH and CLS did not rule out the possibility
that acetic acid could still be involved in the extrinsic CLS
regulation, especially since the pH remained relatively low (,4.0)
in each conditions. Furthermore, an acidic environment is not
sufficient to chronologically age yeast cells in the absence of acetic
acid [43]. If acetic acid was involved in the extrinsic CLS effects,
then raising the medium pH close to neutral should suppress the
relatively short CLS of the WT and atg16D strains. Indeed, raising
the medium pH to 6.0 either at the time of inoculation (D0) or
after two days of growth (D2) (Figure 7A), resulted in a dramatic
extension of CLS for the WT and atg16D strains that was at least as
strong as the ade4D mutant effect or the CR growth condition
(Figure 7B).
To determine whether the ade4D and atg16D mutants had any
effect on acetic acid accumulation in the growth medium, the
acetic acid concentration was measured from log phase, day 2, or
day 5 cultures. As shown in Figure 8A, acetic acid accumulated to
,3 mM in the WT culture on day 5. For the atg16D mutant,
acetic acid accumulated earlier (day 2) and at a higher
concentration by day 5 (,11 mM), which was consistent with
the short CLS of this mutant. In contrast, the long-lived ade4Dmutant did not accumulate acetic acid at all compared to WT,
which was very similar to the effect of CR on blocking acetic acid
accumulation (Figure 8A). Therefore, the amount of acetic acid
secreted into the medium for these two mutants was inversely
correlated with their respective CLSs. Since the short CLS
phenotype of the atg16D mutant was rescued by raising the pH to
6.0 (Figure 7), we were curious whether the higher pH was
accompanied by a decrease in acetic acid concentration. The pH
was again adjusted to 6.0 at the time of inoculation for WT and
atg16D strains, and then acetic acid concentration measured at day
2 and day 5 (Figure 8B). Unexpectedly, the acetic acid
concentration was elevated in the WT strain and reduced in the
atg16D strain at both time points when the pH was adjusted to 6.0
at the time of inoculation (Figure 8B). Such variations in acetic
acid accumulation apparently have no effect on CLS because the
pH is too high to support the toxicity.
Since a long-lived sch9D mutant was previously shown to make
yeast cells more resistant to acetic acid [43], we tested whether the
ade4D and atg16D mutations affected cell survival when cultures
grown for 2 or 5 days were challenged with 300 mM acetic acid
for 200 minutes (Figure 8B). In the day 2 cultures, the ade4Dmutant was significantly more resistant to acetic acid than the WT
strain, again consistent with the long CLS of this mutant.
However, resistance of the atg16D mutant was indistinguishable
from WT. The CR condition made all three strains highly
resistant to the acetic acid treatment. In the day 5 NR cultures (the
time of the media swaps in Figure 6), there were no significant
differences in the acetic acid resistance between the three strains,
and surprisingly, the CR growth condition no longer made the
cells more resistant. Resistance to acetic acid could potentially play
a role in CLS extension for the ade4D mutant, which would be
consistent with its ability to survive in the pooled mutant culture
used for the screen, where many mutants would secrete acetic
acid. In contrast, the short CLS of the atg16D mutant may not be
due to acetic acid hypersensitivity. These results suggest that
secreted acetic acid can commonly impact CLS through a cell
extrinsic mechanism that is dependent on media pH.
Discussion
A microarray-based screen for short- and long-lived mutants
from the YKO collection led to the identification of several
pathways that regulate CLS, including autophagy and the de novo
purine biosynthesis pathway. An earlier screen for chronologically
long-lived deletion mutants revealed that reduced TOR signaling
extends CLS [8]. The strongest TOR-related mutant from that
screen was a gln3 deletion. In our screen, the gln3D mutant just
missed the conservative selection criteria because its day 33
abundance ratios fell outside the top 500 (781 for DNTAG and
738 for UPTAG). However, its day 21 ratios were much higher
than 1.0, consistent with the long CLS that was observed when
tested directly (Figure 4). A direct test of gln3D and tor1D mutants
also confirmed that TOR signaling controlled CLS in haploid
Screening for Yeast Aging Factors
PLoS Genetics | www.plosgenetics.org 9 April 2010 | Volume 6 | Issue 4 | e1000921

yeast and growth media used in our study. A total of 117 potential
short-lived mutants were isolated from the screen, with 13 of the
16 individually retested mutants confirmed to have a short CLS.
Similarly, a total of 40 potential long-lived mutants were isolated,
with 12 of the 39 retested mutants confirmed to have an extended
CLS. From all the mutants tested individually for various reasons
as part of this study, 69 short-lived and 57 long-lived mutants were
found to affect CLS and are listed in Table S3 and Table S4,
respectively.
Autophagy is required for chronological longevity inyeast
Autophagy is a multi-step process in which a portion of the
cytoplasm is sequestered into a de novo-formed double membrane
vesicle called the autophagosome. These vesicles fuse with a
lysosome (the vacuole in yeast) and release the inner single-
membrane vesicle called the autophagic body. Any sequestered
organelle or other cellular matter in the autophagic body is
degraded and recycled into amino acids, fatty acids, sugars, etc.
Figure 6. Cell-extrinsic effects of the atg16D and ade4D mutants on CLS. (A) Schematic diagram of a reciprocal media swap experiment. WTand mutant cell cultures were grown to day 5 in standard SC media containing 2% glucose (NR), at which point the cells were pelleted. The mediawas removed, filtered, and then exchanged such that the cell pellets received expired media derived from the mutant (E-mutD) or WT (E-WT) strains.The cultures were then allowed to age and the standard CLS assay continued. (B) CLS assay of the media swap experiment. WT, ade4D and atg16Dstrains without the swapped media are included as controls. (C) pH measurements of the SC growth media over time in NR and CR conditions. WT,ade4D, ade17D, and atg16D mutants were tested. A four-fold excess of adenine was added to the WT and ade4D strains under the NR conditionwhere indicated.doi:10.1371/journal.pgen.1000921.g006
Screening for Yeast Aging Factors
PLoS Genetics | www.plosgenetics.org 10 April 2010 | Volume 6 | Issue 4 | e1000921
[45]. This process is especially important during times of stress
when cellular components can become damaged and aggregate, or
when nutrients are depleted. Chronological aging of yeast cells is
characterized by the ability to survive during extended incubation
in starvation phase, making the ability to recycle resources critical.
The identification of multiple deletion mutants in the autophagy
pathway that shorten CLS therefore makes sense, not only because
of the need to regenerate cellular components, but to potentially
eliminate damaged proteins that arise as the cells age. Our results
are consistent with results in Drosophila where mutation of the
ATG7 gene shortens lifespan [46], and a more recent study in yeast
showing that atg1D and atg7D mutants have a short CLS in
synthetic growth medium [47]. The atg7D mutant was one of the
autophagy mutants also isolated from our screen. Surprisingly,
most autophagy gene deletion mutants have a normal RLS in rich
YPD medium [48]. Similarly, the atg16D mutant had a normal
RLS when we tested it in SC medium (Figure S1), making it a
CLS-specific longevity factor.
Disruption of autophagy in C. elegans prevents the extension of
lifespan caused by a daf-2 mutation or dietary restriction
[21,22,49]. Deleting ATG15, but not the other autophagy genes,
blocks CR-mediated RLS extension in yeast [48]. ATG15 was not
isolated from our screen, and hence not tested for CLS, but every
other autophagy mutant we tested responded to CR with CLS
extension (Figure 2A). Interestingly, we found that deleting
ATG16, ATG2, or ATG6 (VPS30) prevented CLS extension
induced by the CPMB variety of SC media used in the Powers
et al. screen, which has a normal 2% glucose level but generally
has lower concentrations of amino acids compared to the Hopkins
mix (Figure 5C). This result is consistent with the strong
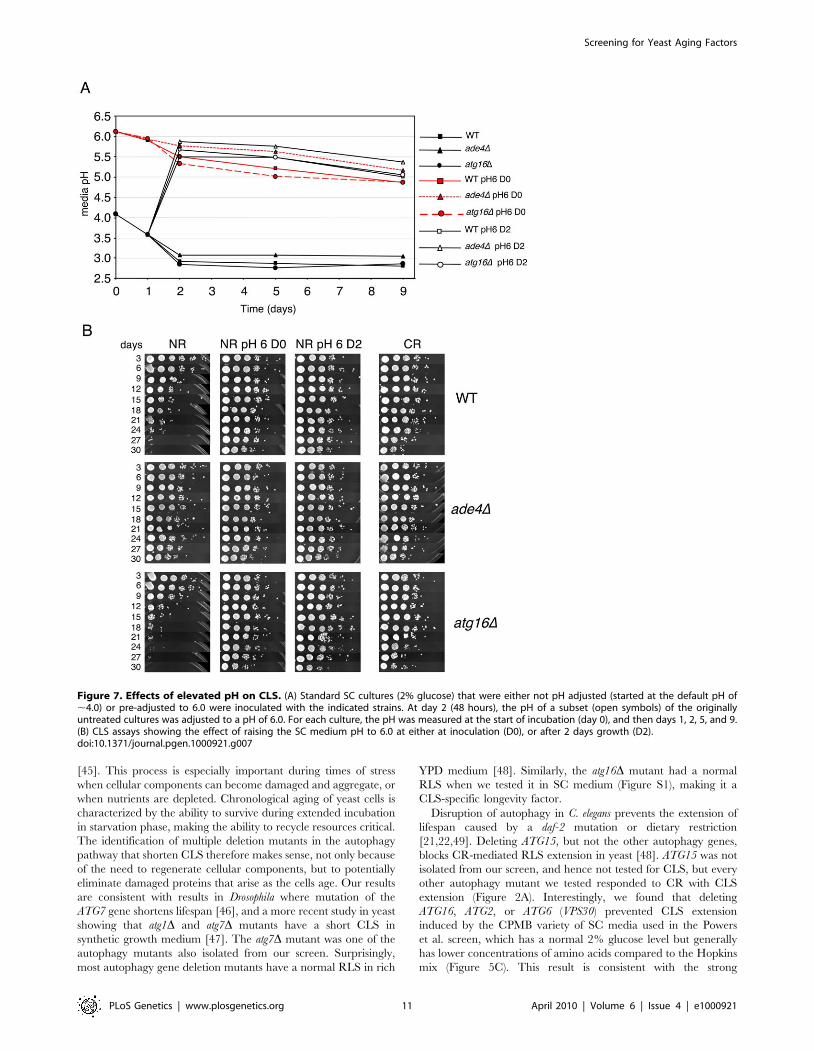
Figure 7. Effects of elevated pH on CLS. (A) Standard SC cultures (2% glucose) that were either not pH adjusted (started at the default pH of,4.0) or pre-adjusted to 6.0 were inoculated with the indicated strains. At day 2 (48 hours), the pH of a subset (open symbols) of the originallyuntreated cultures was adjusted to a pH of 6.0. For each culture, the pH was measured at the start of incubation (day 0), and then days 1, 2, 5, and 9.(B) CLS assays showing the effect of raising the SC medium pH to 6.0 at either at inoculation (D0), or after 2 days growth (D2).doi:10.1371/journal.pgen.1000921.g007
Screening for Yeast Aging Factors
PLoS Genetics | www.plosgenetics.org 11 April 2010 | Volume 6 | Issue 4 | e1000921
stimulation of autophagy triggered by nitrogen limitation or amino
acid depletion [50,51]. Indeed, maintenance of amino acid
homeostasis via the general amino acid control system is important
for proper CLS [47]. Furthermore, the long CLS of a tor1Dmutant requires the autophagy gene ATG16 (data not shown).
Similarly, autophagy was recently shown to be required for the
extension of CLS induced by low concentrations of rapamycin
[52], an inhibitor of the TOR signaling pathway. Future studies on
the links between autophagy, amino acid depletion, and lifespan
extension are clearly warranted.
Iron metabolism and caloric restrictionTwo proteins (Fet3 and Nfu1) involved in iron homeostasis/
metabolism were isolated as mutants whose CLS was not extended by
the CR growth condition. Iron accumulates to high levels in the
vacuole of yeast cells where it can be accessed during times of need,
such as low iron growth conditions. Another key time of iron release
from the vacuole is during the diauxic shift when the balance of iron is
shifted to the mitochondria, where it is needed for mitochondrial
biogenesis. The iron is incorporated into iron/sulfur complexes
within multiple mitochondrial proteins, including aconitase and
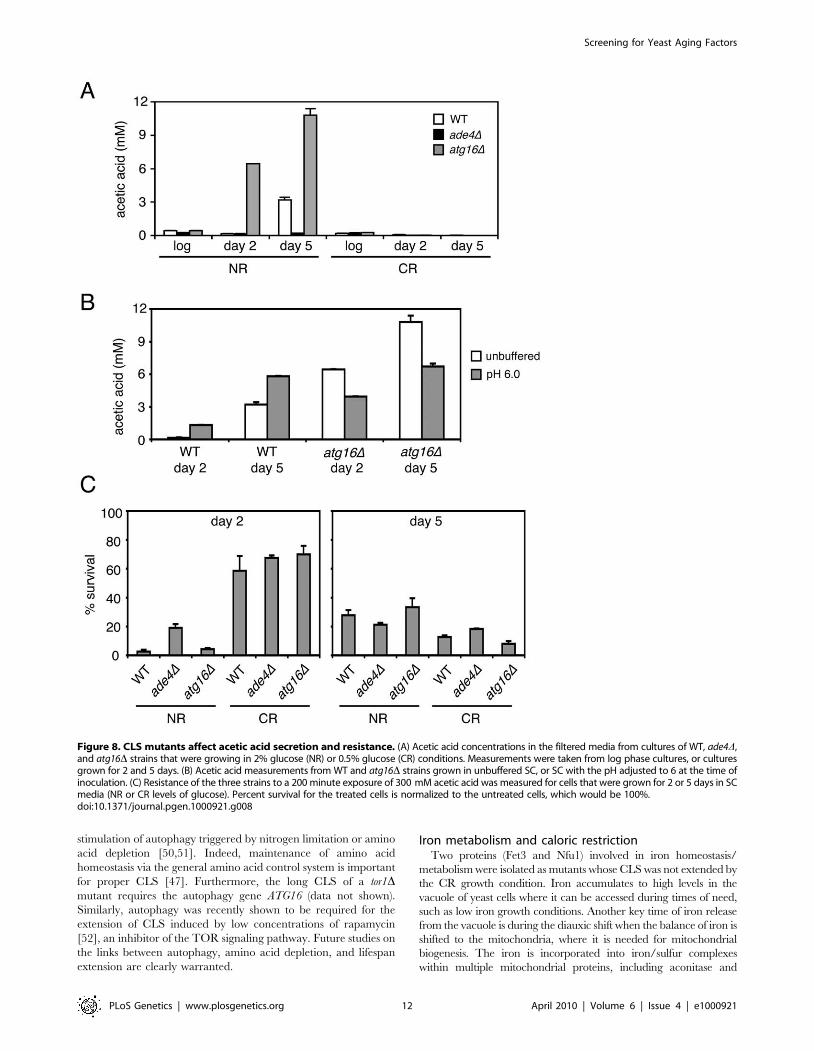
Figure 8. CLS mutants affect acetic acid secretion and resistance. (A) Acetic acid concentrations in the filtered media from cultures of WT, ade4D,and atg16D strains that were growing in 2% glucose (NR) or 0.5% glucose (CR) conditions. Measurements were taken from log phase cultures, or culturesgrown for 2 and 5 days. (B) Acetic acid measurements from WT and atg16D strains grown in unbuffered SC, or SC with the pH adjusted to 6 at the time ofinoculation. (C) Resistance of the three strains to a 200 minute exposure of 300 mM acetic acid was measured for cells that were grown for 2 or 5 days in SCmedia (NR or CR levels of glucose). Percent survival for the treated cells is normalized to the untreated cells, which would be 100%.doi:10.1371/journal.pgen.1000921.g008
Screening for Yeast Aging Factors
PLoS Genetics | www.plosgenetics.org 12 April 2010 | Volume 6 | Issue 4 | e1000921
components of the electron transport chain. A defect in iron
homeostasis could affect mitochondrial processes. One of the
phenotypes observed during chronological aging is an accumulation
of intracellular iron. Much of this iron is likely tied up in lipofuscin, an
insoluble aggregate of proteins and lipid that is high in iron and
accumulates in aging cells. Interestingly, CR reduces this accumu-
lation of lipofuscin and iron [53]. The reduction in iron could
contribute to the corresponding reduction in reactive oxygen species
because a major source of reactive oxygen species is generated via
iron through the Fenton reaction. It is not clear why a fet3D mutant
would block the CR effect, but perhaps the iron oxidase activity of
Fet3 has an additional function in iron homeostasis beyond its role in
high affinity transport. Interestingly, a recent report showed that
FET3 is one of several iron related genes that are up-regulated in
response to increasing strength of CR [54]. FET3 was also required
for the extension of CLS induced by the low amino acid CPMB
medium (Figure 5C), pointing to iron and possibly mitochrondrial
function being important for both glucose and amino acid restriction
effects on CLS.
The de novo purine biosynthesis pathway and longevityThe de novo purine biosynthesis pathway is familiar to yeast
researchers because the AIR intermediate that accumulates in ade2
mutants takes on a red pigmentation when it is oxidized and
concentrated in the vacuole of respiring cells. Multiple genetic assays
have taken advantage of this visual phenotype [55,56]. Limiting the
amount of adenine in the growth medium promotes development of
the red color by increasing flux through the pathway. The 30 mg/L
of adenine in Hopkins mix SC is limiting in this context. Excess
adenine suppresses the red color by reducing flux through the
pathway, thus reducing AIR formation. Excess (4X) adenine also
suppresses the long CLS of the ade2D, ade3D, and ade4D mutants, but
had no effect on CLS of the WT strain. One possible mechanism for a
block in this pathway to regulate CLS is that reduced production of
AMP and/or IMP leads to lifespan extension. Consistent with this
idea, deletion of the adenylate kinase 1 gene ADK1, which leads to a
large increase in cellular AMP concentration [57], also shortens CLS
(Table S3). AMP is an allosteric effector of multiple enzymes in
metabolism, including phosphofructokinase (PFK), a key regulatory
step in the glycolytic pathway who’s activity is enhanced by AMP
binding. CR has been shown to reduce PFK activity in mouse liver
[58]. Lower AMP levels could mimic CR by reducing glycolytic flux.
This model also fits the extended CLS of the fcy2D mutant, which
would also reduce AMP production by blocking the import of
extracellular adenine. The compensatory increase in AMP produc-
tion by the de novo purine synthesis pathway would partially suppress
the effect, resulting in the more modest increase in lifespan for this
mutant compared to the ade4D mutant. Since the de novo purine
biosynthesis pathway and Fcy2-mediated transport of guanine also
regulate GMP production (and subsequently GTP/GDP levels,
reduced GMP levels could also contribute to the lifespan extension
via effects on the Ras/cAMP/PKA pathway, as inhibition of Ras2
results in extension of CLS [59]. Consistent with this possibility, we
have found that deletion of BCY1, which constitutively activates PKA,
shortens CLS (Table S3).
A second possible mechanism for the de novo purine biosynthesis
pathway to regulate CLS is through the control of AICAR
concentration. Severe accumulation of AICAR induced by ADE4
over-expression in an ade16 ade17 double mutant causes synthetic
lethality [40]. The less severe accumulation predicted for an
ade17D mutant is not lethal, but instead leads to a short CLS
(Figure 3C). However, any putative negative effect of AICAR
accumulation from a defect in this step of the pathway is
overcome, in terms of CLS, by a double deletion of ADE16 and
ADE17. This double mutant behaves like any other deletion
mutant in the de novo pathway (long-lived), suggesting that effects
on IMP/AMP production or other unknown mechanisms are
dominant to the AICAR effect. If AICAR does have a negative
effect on CLS, then it is modest and opposite of that observed in
higher eukaryotes. In metazoans, AICAR acts as an agonist of
AMP-activated protein kinase (AMPK) [60], an enzyme that
functions in mediating some aspects of longevity in C. elegans
[61,62]. The yeast paralog of AMPK, Snf1, is not activated by
AMP or AICAR [63]. Furthermore, the snf1D mutant was found
to have a short CLS (Table S2), a phenotype that is likely due to
the roles of Snf1 in promoting respiration and autophagy [64,65].
Given the complex nature of purine biosynthesis regulation and its
links to the regulation of other metabolic pathways, including
amino acid biosynthesis, other mechanisms leading to lifespan
extension are certainly possible. For example, secreted adenine-
related compounds could contribute to the cell-extrinsic effects of
the ade mutants on CLS. In fact, the temporal secretion of various
purines into the media and their subsequent uptake and utilization
is a key signal that synchronizes the sporulation process between
cells in a dense culture [42].
Acetic acid and the regulation of CLSAcetic acid accumulates to low millimolar concentrations in
stationary phase yeast cultures that are grown in SC medium with
2% glucose (NR). Exposure to this acetic acid, coupled with the
acidic environment of the expired medium contributes to
chronological aging [43]. CR growth conditions block the acetic
acid accumulation, and long-lived mutants such as sch9D and
ras2D tend to be resistant to acetic acid toxicity, suggesting that
resistance to acetic acid may be a general property of
chronologically long-lived yeast cells [43]. We found that the
long-lived ade4D mutant blocked acetic acid accumulation in the
growth medium as effectively as CR, while the short-lived atg16Dmutant accumulated significantly higher concentrations of acetic
acid than did the WT strain (Figure 8A). In addition to greatly
reducing acetic acid levels (Figure 8A), we found that CR makes all
three strains more resistant to acetic acid when the exposure
occurs after 2 days growth, but is no longer effective with 5-day
cultures (Figure 8B). While the ade4D mutant was moderately
resistant to acetic acid at day 2 when compared to WT, by day 5
there was very little difference in sensitivity between the two
mutants and WT. This is an important point, because the expired
media swaps between the WT, ade4D, and atg16D strains were
performed with 5-day old cultures. Perhaps chronologically aged
yeast cells are simply programmed to be more resistant to acetic
acid as a defense against this by-product of fermentation. These
were short-term acetic acid exposures (200 minutes), so it is
possible that prolonged exposure of the day 5 cultures, or lack of
exposure for the ade4D expired media, could still affect CLS. This
would also correlate well with the extension of CLS induced by
raising the pH to 6.0 (Figure 7B), which would neutralize the
toxicity of acetic acid. The ade4D mutation therefore both
suppresses acetic acid accumulation and promotes acetic acid
resistance, a phenotypic combination also induced by the CR
growth condition.
It remains unclear why a defect in autophagy (atg16D) results in
hyper-accumulation of acetic acid, while a block in de novo purine
biosynthesis prevents acetic acid accumulation. An important
function of autophagy is the turnover of organelles, including
mitochondria. In mice deficient for Atg7, mitochondrial dysfunc-
tion has been observed that is accompanied by elevated reactive
oxygen species [66]. Perhaps a defect in mitochondrial function
would promote fermentation during NR conditions by preventing
Screening for Yeast Aging Factors
PLoS Genetics | www.plosgenetics.org 13 April 2010 | Volume 6 | Issue 4 | e1000921
the yeast cells from fully transitioning from fermentation to
respiration at the typical diauxic shift, and thus favoring acetic acid
production. This would also account for the large number of
mitochondria-related mutants that were isolated from the screen
as being short-lived. Given the similarities of the ade4D CLS
phenotype to CR, it is possible that the ade4D mutant could also
enhance a shift from fermentation toward respiration, which could
reduce acetic acid production. For the various mutants isolated
from the screen, it will therefore be interesting to further compare
the relative CLS contributions of their actual cellular defects with
their acetic acid secretion and toxicity profiles. Specific combina-
tions of intracellular and extracellular effects are likely going to be
CLS determinants.
Efficacy of large-scale screens for chronological agingfactors
The microarray-based genetic screen performed in this study
was successful in identifying several novel longevity genes, but its
quantitative ability to predict long-lived mutants based on the
abundance ratios from the arrays was modest. Similar difficulties
were previously observed using the YKO collection in a different
type of longevity screen, in which each mutant was individually
grown in a 96-well plate, and ability to re-grow was tested over
time. In that screen, only 5 of 90 predicted long-lived mutants
(5.6%) were confirmed when retested [8,67]. In our case, 12 of the
39 candidate mutants (30.8%) were confirmed as long-lived when
retested (Table 1). Not surprisingly then, only 4 of the 12
confirmed long-lived mutants isolated from our screen (LCL1,
DCW1, LCL2, and MUM2) were ranked in the top 1000 long-lived
candidates from the earlier Powers et al. CLS screen. These results
are likely indicative of inherent variability in large-scale screens for
long CLS, as well as subtle differences in the growth conditions.
Large-scale screening for short-lived mutants is much more
efficient, which is reflected in the fact that 68 of the 117 short-
lived candidates from our screen (58.1%) are also in the bottom
1000 short-lived candidates from the Powers et al. screen (Table
S2). Having multiple screening approaches is advantageous, as
mutants not detected by one method may be detected by another.
There are several possible reasons for the variability associated
the microarray-based longevity screen, especially for long-lived
mutants. One possibility is the adaptive regrowth phenomenon, in
which a subpopulation of cells in an aging stationary phase culture
adapts to utilize the nutrients released by dead cells to re-grow and
populate the culture [44]. If a mutant underwent gasping during
aging of the pooled collection, then it would register an artificially
high abundance ratio, and fail to be long-lived when individually
retested. Another possibility that would be unique to the mixed
population approach is the introduction of competition between
the strains, where mutants with improved overall fitness could
have an advantage that is lost when they are retested individually.
In a related scenario, certain mutants in the mixed population are
likely highly resistant or overly sensitive to changes in medium
composition (such as acetic accumulation) that occurred as the
cultures were aging. Certain mutants could directly influence the
medium composition, thus altering the lifespan of the highly
sensitive mutants in the process. A good example is the ade4Dmutant, whose expired SC medium extended the lifespan of the
WT and atg16D strains (Figure 6), possibly through the reduction
of acetic acid accumulation (Figure 8A). In applying the
microarray/barcode approach to other aging or age-related
problems, it is likely that the amount of variability would be
more limited with the addition of duplicate or triplicate screens.
However, even with the inherent variability, this microarray
screen successfully identified several novel longevity regulators that
will be the subject of future studies.
Materials and Methods
Yeast strains and mediaYeast strains used in this study were isogenic to the haploid
strain BY4741 (MATa his3D1 leu2D0 met15D0 ura3D0), and were
obtained from the yeast gene knockout collection [19]. The ade16Dade17D mutant strain (Y1093) was kindly provided by Bertrand
Daignon-Fornier [68]. Most in vivo assays were performed in
synthetic complete (SC) medium following the recipe provided in
the Cold Spring Harbor Yeast Genetics Course Manual [69], and
sold by QBioGene as ‘‘Hopkins mix’’. The alternative SC medium
is derived from Current Protocols in Molecular Biology [41],
which we refer to as ‘‘CPMB’’ mix. Chemical compositions of the
various SC media types are listed in Table S6. Glucose was added
to the SC media to a final concentration of either 0.5% (CR-
Calorie Restricted) or 2% (NR-Non Restricted). Where indicated,
the Hopkins mix SC medium was buffered to pH 6.0 with a citrate
phosphate buffer (6.42 mM Na2HPO4 and 1.79 mM citric acid,
final concentration), as previously described [43]. For buffering the
medium at day 2, a 106 concentrate of the citrate phosphate
buffer was added to SC. For pH measurements of expired media,
small aliquots were removed from the cultures and then discarded
to prevent contamination of the long-term culture.
Genetic screen for longevity and TAG–microarray analysisTo begin the screen, 1 ml (15 OD600 units) of the pooled
haploid knockout collection was inoculated into 200 ml SC
medium containing either 2% glucose (NR) or 0.5% glucose
(CR). The next day (day 0), aliquots of 100 ml were transferred into
10 ml of fresh SC-NR and SC-CR media, respectively. Twenty
such cultures were inoculated for each glucose concentration and
allowed to age at 30uC in the roller drum to provide aeration [16].
Starting with day 1 (D1), 100 ml of each culture was plated onto
YPD plates every 3 days to allow viable cells in the population to
re-grow. These YPD plates were incubated at 30uC for 2 days and
the cell lawns harvested by scraping and pooled together, then
washed with ice cold water and stored at 280uC. Once the time
course was completed (day 33), genomic DNA was isolated from
the cell pellets [41].
The UP- and DNTAGs were labeled with Cy5 (day 1) or Cy3
(days 9, 21, and 33) by PCR amplification of genomic DNA using
primer pairs U1/U2 and D1/D2, respectively, as previously
described [70]. The Cy5-labeled UP- and DNTAGs from day 1
were then co-hybridized with the Cy3-labeled UP- and DNTAGSs
on custom-designed ‘‘Hopkins TAG-arrays’’ from Agilent Tech-
nologies (AMADID 011443) as previously described [70].
Fluorescence signal intensities were measured by scanning the
arrays with a Genepix 4000B instrument coupled with GenePix
Pro software. The signal intensity ratios were then calculated for
days 9, 21, and 33 compared to day 1 as the control using
Microsoft Excel. The signal ratios for all essential genes on the
array were averaged and considered the background. Any non-
essential genes with up- or down-tag ratios lower than this
background average were eliminated from the analysis, thus
ensuring that only genes with signals from both tags were included
(2715 genes, which included most of those in the DNTAG list in
Table S1). Box plots of the ratios in Figure 1 were assembled from
the 3478 genes in the UPTAG list (Table S1) using R Software.
Mutants with similar average NR and CR log ratios were
identified by applying two criteria to their values at every time
point: (1) ratios were within 10% of each other and (2) the null
Screening for Yeast Aging Factors
PLoS Genetics | www.plosgenetics.org 14 April 2010 | Volume 6 | Issue 4 | e1000921
hypothesis that were the same according to a t-test. In the case of
(1), we calculated the fractional difference between the average
NR and CR log ratios (i.e., difference between these values divided
by their average). The absolute value of the fractional difference
was required to be less than 0.1. We then applied a t-test to the
NR and CR log ratios and required their p-value to be less than
0.05 (i.e., their means are not significantly different).
Chronological life span assaysQuantitative (colony forming unit) and semi-quantitative (10-
fold serial dilution spot-test) chronological life span (CLS) assays
were performed as previously described [16]. For the media swap
experiments, the 10 ml cultures were grown for 5 days. The
cultures were then pelleted in a swinging bucket rotor (2500 RPM)
at room temperature in an Eppendorf 5810R tabletop centrifuge.
The supernatants were removed and passed through a 0.2 micron
syringe filter prior to the swap.
Acetic acid measurements and treatmentsFor the measurement of acetic acid concentration in growth
media, cells were grown in the appropriate SC medium (10 ml in
culture tubes) to the indicated time points. Log phase cells (OD600
of 0.8) and cells grown to day 2 and day 5 were pelleted by
centrifugation, and the clarified media was passed through a 0.2
micron syringe filter. The filtrate was used for measuring the acetic
acid concentration using an Acetic Acid Kit (R-Biopharm AG,
Darmstadt, Germany), following the manufacturer’s directions.
Three biological replicas were assayed for each condition to
provide mean millimolar concentrations and standard deviations.
To determine sensitivity/resistance of the mutant strains to
exogenously added acetic acid, cultures were challenged for 200
minutes with 300 mM acetic acid either at day 2 or day 5 of the
CLS assay. Cells were diluted in water and then spread onto YPD
plates to allow viable cells to grow into colonies, which were then
counted. The percent survival was calculated by dividing the
colony forming units (CFU) of the treated samples by the
untreated samples. Three biological replicates were tested for
each condition.
Supporting Information
Figure S1 Replicative lifespan (RLS) measurements of WT
(BY4741), atg16D, and ade4D strains. For each strain, a total of 70
mother cells were analyzed on SC media containing 2% glucose.
Mean RLS values were as follows: WT (25.4), atg16D (25.2), and
ade4D (24.9).
Found at: doi:10.1371/journal.pgen.1000921.s001 (0.16 MB PDF)
Table S1 Ranks of mutants for each particular time point and
glucose condition.
Found at: doi:10.1371/journal.pgen.1000921.s002 (3.20 MB
XLS)
Table S2 Predictions of putative short-lived mutants.
Found at: doi:10.1371/journal.pgen.1000921.s003 (0.06 MB
XLS)
Table S3 List of tested mutants with shortened CLS.
Found at: doi:10.1371/journal.pgen.1000921.s004 (0.03 MB
XLS)
Table S4 List of tested mutants with extended CLS.
Found at: doi:10.1371/journal.pgen.1000921.s005 (0.03 MB
XLS)
Table S5 List of tested mutants with no effect on lifespan.
Found at: doi:10.1371/journal.pgen.1000921.s006 (0.03 MB
XLS)
Table S6 Chemical composition of various SC media recipes.
Found at: doi:10.1371/journal.pgen.1000921.s007 (0.02 MB
XLS)
Acknowledgments
We thank David Auble, Marty Mayo, Dan Burke, Daniel Yuan, and
members of the Smith lab for helpful advice, discussions, and comments.
We also thank Matt Kaeberlein and Christopher Burtner for advice on
measuring acetic acid concentrations, Bertrand Daignon-Fornier for
providing strain Y1093, and Mitch Smith for providing individual strains
from the yeast knockout collection for retesting lifespan.
Author Contributions
Conceived and designed the experiments: MM DLSJ SB JSS. Performed
the experiments: MM DLSJ XP NM SB. Analyzed the data: MM DLSJ
XP NM SB JDB JSS. Contributed reagents/materials/analysis tools: JDB.
Wrote the paper: MM XP JSS.
References
1. Partridge L (2008) Some highlights of research on aging with invertebrates,
2008. Aging Cell 7: 605–608.
2. Hamilton B, Dong Y, Shindo M, Liu W, Odell I, et al. (2005) A systematic RNAi
screen for longevity genes in C. elegans. Genes Dev 19: 1544–1555.
3. Hansen M, Hsu AL, Dillin A, Kenyon C (2005) New genes tied to endocrine,
metabolic, and dietary regulation of lifespan from a Caenorhabditis elegans genomic
RNAi screen. PLoS Genet 1: e17. doi:10.1371/journal.pgen.0010017.
4. Kaeberlein M, McVey M, Guarente L (1999) The SIR2/3/4 complex and SIR2
alone promote longevity in Saccharomyces cerevisiae by two different mechanisms.
Genes Dev 13: 2570–2580.
5. Mortimer RK, Johnston JR (1959) Life span of individual yeast cells. Nature
183: 1751–1752.
6. Fabrizio P, Pozza F, Pletcher SD, Gendron CM, Longo VD (2001) Regulation
of longevity and stress resistance by Sch9 in yeast. Science 292: 288–290.
7. Fabrizio P, Pletcher SD, Minois N, Vaupel JW, Longo VD (2004) Chronological
aging-independent replicative life span regulation by Msn2/Msn4 and Sod2 in
Saccharomyces cerevisiae. FEBS Lett 557: 136–142.
8. Powers RW, 3rd, Kaeberlein M, Caldwell SD, Kennedy BK, Fields S (2006)
Extension of chronological life span in yeast by decreased TOR pathway
signaling. Genes Dev 20: 174–184.
9. Kaeberlein M, Powers RW, 3rd, Steffen KK, Westman EA, Hu D, et al. (2005)
Regulation of yeast replicative life span by TOR and Sch9 in response to
nutrients. Science 310: 1193–1196.
10. Bonawitz ND, Chatenay-Lapointe M, Pan Y, Shadel GS (2007) Reduced TOR
signaling extends chronological life span via increased respiration and
upregulation of mitochondrial gene expression. Cell Metab 5: 265–277.
11. Vellai T, Takacs-Vellai K, Zhang Y, Kovacs AL, Orosz L, et al. (2003) Genetics:
influence of TOR kinase on lifespan in C. elegans. Nature 426: 620.
12. McCay CM, Crowell MF (1934) Prolonging the life span. Sci Mon 39: 405–414.
13. Jiang JC, Jaruga E, Repnevskaya MV, Jazwinski SM (2000) An intervention
resembling caloric restriction prolongs life span and retards aging in yeast.
FASEB J 14: 2135–2137.
14. Lin S-J, Defossez P-A, Guarente L (2000) Requirement of NAD and SIR2 for
life-span extension by calorie restriction in Saccharomyces cerevisiae. Science 289:
2126–2128.
15. Fabrizio P, Gattazzo C, Battistella L, Wei M, Cheng C, et al. (2005) Sir2 blocks
extreme life-span extension. Cell 123: 655–667.
16. Smith DL, Jr., McClure JM, Matecic M, Smith JS (2007) Calorie restriction
extends the chronological lifespan of Saccharomyces cerevisiae independently of the
Sirtuins. Aging Cell 6: 649–662.
17. Lin SJ, Kaeberlein M, Andalis AA, Sturtz LA, Defossez PA, et al. (2002) Calorie
restriction extends Saccharomyces cerevisiae lifespan by increasing respiration.
Nature 418: 344–348.
18. Lin YY, Lu JY, Zhang J, Walter W, Dang W, et al. (2009) Protein acetylation
microarray reveals that NuA4 controls key metabolic target regulating
gluconeogenesis. Cell 136: 1073–1084.
Screening for Yeast Aging Factors
PLoS Genetics | www.plosgenetics.org 15 April 2010 | Volume 6 | Issue 4 | e1000921
19. Winzeler EA, Shoemaker DD, Astromoff A, Liang H, Anderson K, et al. (1999)
Functional characterization of the S. cerevisiae genome by gene deletion andparallel analysis. Science 285: 901–906.
20. Gray JV, Petsko GA, Johnston GC, Ringe D, Singer RA, et al. (2004) ‘‘Sleeping
beauty’’: quiescence in Saccharomyces cerevisiae. Microbiol Mol Biol Rev 68:187–206.
21. Hansen M, Chandra A, Mitic LL, Onken B, Driscoll M, et al. (2008) A role forautophagy in the extension of lifespan by dietary restriction in C. elegans. PLoS
Genet 4: e24. doi:10.1371/journal.pgen.0040024.
22. Jia K, Levine B (2007) Autophagy is required for dietary restriction-mediated lifespan extension in C. elegans. Autophagy 3: 597–599.
23. Schilke B, Voisine C, Beinert H, Craig E (1999) Evidence for a conserved systemfor iron metabolism in the mitochondria of Saccharomyces cerevisiae. Proc Natl Acad
Sci U S A 96: 10206–10211.24. Kosman DJ (2003) Molecular mechanisms of iron uptake in fungi. Mol
Microbiol 47: 1185–1197.
25. Philpott CC, Protchenko O, Kim YW, Boretsky Y, Shakoury-Elizeh M (2002)The response to iron deprivation in Saccharomyces cerevisiae: expression of
siderophore-based systems of iron uptake. Biochem Soc Trans 30: 698–702.26. Anderson JB, Sirjusingh C, Parsons AB, Boone C, Wickens C, et al. (2003) Mode
of selection and experimental evolution of antifungal drug resistance in
Saccharomyces cerevisiae. Genetics 163: 1287–1298.27. Conde R, Pablo G, Cueva R, Larriba G (2003) Screening for new yeast mutants
affected in mannosylphosphorylation of cell wall mannoproteins. Yeast 20:1189–1211.
28. Kitagaki H, Wu H, Shimoi H, Ito K (2002) Two homologous genes, DCW1
(YKL046c) and DFG5, are essential for cell growth and encode glycosylpho-
sphatidylinositol (GPI)-anchored membrane proteins required for cell wall
biogenesis in Saccharomyces cerevisiae. Mol Microbiol 46: 1011–1022.29. Ponting CP (1997) P100, a transcriptional coactivator, is a human homologue of
staphylococcal nuclease. Protein Sci 6: 459–463.30. Ferreira T, Brethes D, Pinson B, Napias C, Chevallier J (1997) Functional
analysis of mutated purine-cytosine permease from Saccharomyces cerevisiae. A
possible role of the hydrophilic segment 371-377 in the active carrierconformation. J Biol Chem 272: 9697–9702.
31. Guetsova ML, Lecoq K, Daignan-Fornier B (1997) The isolation andcharacterization of Saccharomyces cerevisiae mutants that constitutively express
purine biosynthetic genes. Genetics 147: 383–397.32. Kurtz JE, Exinger F, Erbs P, Jund R (1999) New insights into the pyrimidine
salvage pathway of Saccharomyces cerevisiae: requirement of six genes for cytidine
metabolism. Curr Genet 36: 130–136.33. Malmanche N, Clark DV (2004) Drosophila melanogaster Prat, a purine de novo
synthesis gene, has a pleiotropic maternal-effect phenotype. Genetics 168:2011–2023.
34. Rolfes RJ (2006) Regulation of purine nucleotide biosynthesis: in yeast and
beyond. Biochem Soc Trans 34: 786–790.35. Tibbetts AS, Appling DR (1997) Saccharomyces cerevisiae expresses two genes
encoding isozymes of 5-aminoimidazole-4-carboxamide ribonucleotide transfor-mylase. Arch Biochem Biophys 340: 195–200.
36. Rebora K, Desmoucelles C, Borne F, Pinson B, Daignan-Fornier B (2001) YeastAMP pathway genes respond to adenine through regulated synthesis of a
metabolic intermediate. Mol Cell Biol 21: 7901–7912.
37. Daignan-Fornier B, Fink GR (1992) Coregulation of purine and histidinebiosynthesis by the transcriptional activators BAS1 and BAS2. Proc Natl Acad
Sci U S A 89: 6746–6750.38. Zhang F, Kirouac M, Zhu N, Hinnebusch AG, Rolfes RJ (1997) Evidence that
complex formation by Bas1p and Bas2p (Pho2p) unmasks the activation function
of Bas1p in an adenine-repressible step of ADE gene transcription. Mol Cell Biol17: 3272–3283.
39. Denis V, Boucherie H, Monribot C, Daignan-Fornier B (1998) Role of the myb-like protein bas1p in Saccharomyces cerevisiae: a proteome analysis. Mol Microbiol
30: 557–566.
40. Rebora K, Laloo B, Daignan-Fornier B (2005) Revisiting purine-histidine cross-pathway regulation in Saccharomyces cerevisiae: a central role for a small molecule.
Genetics 170: 61–70.41. Ausubel FM, Brent R, Kingston RE, Moore DD, Seidman JG, et al. (2000)
Current Protocols in Molecular Biology. New York: John Wiley & Sons, Inc.42. Jakubowski H, Goldman E (1988) Evidence for cooperation between cells during
sporulation of the yeast Saccharomyces cerevisiae. Mol Cell Biol 8: 5166–5178.
43. Burtner CR, Murakami CJ, Kennedy BK, Kaeberlein M (2009) A molecularmechanism for chronological aging in yeast. Cell Cycle 8: 1256–1270.
44. Fabrizio P, Battistella L, Vardavas R, Gattazzo C, Liou LL, et al. (2004)Superoxide is a mediator of an altruistic aging program in Saccharomyces cerevisiae.
J Cell Biol 166: 1055–1067.
45. Yorimitsu T, Klionsky DJ (2005) Autophagy: molecular machinery for self-eating. Cell Death Differ 12 Suppl. 2: 1542–1552.
46. Juhasz G, Erdi B, Sass M, Neufeld TP (2007) Atg7-dependent autophagy
promotes neuronal health, stress tolerance, and longevity but is dispensable for
metamorphosis in Drosophila. Genes Dev 21: 3061–3066.
47. Alvers A, Fishwick L, Wood M, Hu D, Chung H, et al. (2009) Autophagy and
amino acid homeostasis are required for chronological longevity in Saccharomyces
cerevisiae. Aging Cell 8: 353–369.
48. Tang F, Watkins JW, Bermudez M, Gray R, Gaban A, et al. (2008) A life-span
extending form of autophagy employs the vacuole-vacuole fusion machinery.
Autophagy 4: 874–886.
49. Melendez A, Talloczy Z, Seaman M, Eskelinen EL, Hall DH, et al. (2003)
Autophagy genes are essential for dauer development and life-span extension in
C. elegans. Science 301: 1387–1391.
50. Droge W (2004) Autophagy and aging. Mech Aging Dev 125: 161–168.
51. Takeshige K, Baba M, Tsuboi S, Noda T, Ohsumi Y (1992) Autophagy in yeast
demonstrated with proteinase-deficient mutants and conditions for its induction.
J Cell Biol 119: 301–311.
52. Alvers A, Wood M, Hu D, Kaywell A, Jr.W D, et al. (2009) Autophagy is
required for extension of yeast chronological life span by rapamycin. Autophagy
5: 847–849.
53. Reverter-Branchat G, Caiscol E, Tamarit J, Ros J (2004) Oxidative damage to
specific proteins in replicative and chronological-aged Saccharomyces cerevisiae.
J Biol Chem 279: 31983–31989.
54. Lee YL, Lee CK (2008) Transcriptional response according to strength of calorie
restriction in Saccharomyces cerevisiae. Mol Cells 26: 299–307.
55. Hieter P, Mann C, Snyder M, Davis R (1985) Mitotic stability of yeast
chromosomes: A colony color assay that measures nondisjunction and
chromosome loss. Cell 40: 381–392.
56. Koshland D, Kent J, Hartwell L (1985) Genetic analysis of the mitotic
transmission of minichromosomes. Cell 40: 393–403.
57. Gauthier S, Coulpier F, Jourdren L, Merle M, Beck S, et al. (2008) Co-
regulation of yeast purine and phosphate pathways in response to adenylic
nucleotide variations. Mol Microbiol 68: 1583–1594.
58. Hagopian K, Ramsey JJ, Weindruch R (2003) Influence of age and caloric
restriction on liver glycolytic enzyme activities and metabolite concentrations in
mice. Exp Gerontol 38: 253–266.
59. Fabrizio P, Longo VD (2003) The chronological life span of Saccharomyces
cerevisiae. Aging Cell 2: 73–81.
60. Sullivan JE, Brocklehurst KJ, Marley AE, Carey F, Carling D, et al. (1994)
Inhibition of lipolysis and lipogenesis in isolated rat adipocytes with AICAR, a
cell-permeable activator of AMP-activated protein kinase. FEBS Lett 353:
33–36.
61. Narbonne P, Roy R (2009) Caenorhabditis elegans dauers need LKB1/AMPK to
ration lipid reserves and ensure long-term survival. Nature 457: 210–214.
62. Schulz T, Zarse K, Voigt A, Urban N, Birringer M, et al. (2007) Glucose
restriction extends Caenorhabditis elegans life span by inducing mitochondrial
respiration and increasing oxidative stress. Cell Metab 6: 280–293.
63. Wilson WA, Hawley SA, Hardie DG (1996) Glucose repression/derepression in
budding yeast: SNF1 protein kinase is activated by phosphorylation under
derepressing conditions, and this correlates with a high AMP:ATP ratio. Curr
Biol 6: 1426–1434.
64. Wang Z, Wilson WA, Fujino MA, Roach PJ (2001) Antagonistic controls of
autophagy and glycogen accumulation by Snf1p, the yeast homolog of AMP-
activated protein kinase, and the cyclin-dependent kinase Pho85p. Mol Cell Biol
21: 5742–5752.
65. Wright RM, Poyton RO (1990) Release of two Saccharomyces cerevisiae cytochrome
genes, COX6 and CYC1, from glucose repression requires the SNF1 and SSN6
gene products. Mol Cell Biol 10: 1297–1300.
66. Wu J, Quijano C, Chen E, Liu H, Cao L, et al. (2009) Mitochondrial
dysfunction and oxidative stress mediate the physiological impairment induced
by disruption of autophagy. Aging 1: 425–437.
67. Murakami CJ, Burtner CR, Kennedy BK, Kaeberlein M (2008) A method for
high-throughput quantitative analysis of yeast chronological life span.
J Gerontol A Biol Sci Med Sci 63: 113–121.
68. Pinson B, Vaur S, Sagot I, Coulpier F, Lemoine S, et al. (2009) Metabolic
intermediates selectively stimulate transcription factor interaction and modulate
phosphate and purine pathways. Genes Dev 23: 1399–1407.
69. Burke D, Dawson D, Stearns T (2000) Methods in Yeast Genetics. Cold Spring
Harbor: Cold Spring Harbor Laboratory Press. 205 p.
70. Pan X, Yuan DS, Ooi SL, Wang X, Sookhai-Mahadeo S, et al. (2007) dSLAM
analysis of genome-wide genetic interactions in Saccharomyces cerevisiae. Methods
41: 206–221.
71. Gelling CL, Piper MD, Hong SP, Kornfeld GD, Dawes IW (2004) Identification
of a novel one-carbon metabolism regulon in Saccharomyces cerevisiae. J Biol Chem
279: 7072–7081.
Screening for Yeast Aging Factors
PLoS Genetics | www.plosgenetics.org 16 April 2010 | Volume 6 | Issue 4 | e1000921