a methodology to simulate automotive disc brake tribology
TRANSCRIPT
A methodology to simulate automotive disc brake tribology and emissions
GABRIELE RIVA
Academic dissertation which, with the due permission of the KTH Royal Institute of Tech-
nology, will be submitted for public defence for the Degree of Doctor of Philosophy on Fri-
day 30 October 2020 at 09.00 in Gladan, Brinnelvägen 83, Stockholm.
Doctoral Thesis in Machine Design
KTH Royal Institute of Technology
Stockholm, Sweden 2020
© Gabriele Riva
TRITA-ITM-AVL 2020:39
ISBN 978-91-7873-657-7
Printed by: Universitesservice US-AB, Sweden 2020

iii

iv
v
Abstract
Airborne particle emissions from road vehicles are one of the main issues affecting urban
air quality. Vehicle disc brakes are one of the most important sources of non-exhaust emis-
sions, which have recently been considered to be as important as exhaust emissions. In disc
brakes, the pads are pushed against the rotating disc to slow down the vehicle. The contact
surfaces of the disc and pads are worn, some of the debris becomes airborne and can be
harmful to human health if inhaled. Particle emissions from disc brakes are influenced by a
greater amount of contact phenomena at the sliding interfaces, e.g. friction, wear, contact
temperature, contact pressure and surface topography. Due to the difficulty in accessing the
pad-to-disc contact in the brake system during testing, it is hard to study contact phenom-
ena. Moreover, experiments need the friction material and brake system to be produced at
least in their prototype configuration. The aim of this thesis is to develop a methodology
based on simulation to better understand contact phenomena and to evaluate the tribologi-
cal and emission performance of friction material and brake systems in the early design
phase.
Different simulation approaches can be adopted, depending on what is to be evaluated.
A macro-scale approach based on finite element analysis (FEA) can be used to evaluate
wear, particle emission and the coefficient of friction (COF) of the entire brake system. A
meso-scale approach based on cellular automaton (CA) simulation can be used to evaluate
the local contact behaviour on the disc and pad surfaces, and the influence of the single
components of the friction mixture. These two different-scale simulation approaches can be
integrated to generate an overall multi-scale simulation procedure to investigate and predict
the contact phenomena in brake systems.
Paper A investigates the particle motion inside the pin-on-disc (POD) chamber and eval-
uates the sampling efficiency. The output is used to correct the results in the comparison
between the simulation and experiments in Paper B.
Paper B develops an FEA to evaluate the wear and particle emissions from the disc
brakes, starting from a POD material characterization. The simulation results are compared
with the experimental results performed on a full-scale dyno bench.
Paper C develops an FEA to evaluate the COF of a disc brake, starting from a POD ma-
terial characterization. The simulation results are compared with the experimental results
performed on a full-scale dyno bench.
Paper D develops a CA to investigate the influence of standard cast iron and coated disc
surfaces in the local contact areas.
Paper E extends the CA methodology of Paper D to investigate the influence of the disc
surface roughness of a coated disc on the local contact pressure and contact area.
Paper F develops a multi-scale simulation approach combining FEA, CFD and CA sim-
ulations to investigate the local contact temperature on Cu-full and Cu-free commercial
pads.

vi

vii
Sammanfattning
Luftburna partikelutsläpp från vägfordon är en betydande källorna till dålig luftkvalitet
i städer. Fordonsskivbromsar är en av den största källan till icke-avgasutsläpp som nyligen
visat sig lika stora som avgasutsläpp. I skivbromsar trycks bromsbeläggen mot den
roterande skivan för att bromsa fordonet. Både skivan och beläggen är slits och en del av
slitaget kan bli luftburen. Dessa partiklar kan vara farliga för människors hälsa om de
inandas. Mängden partikelutsläpp från skivbromsar påverkas av en större mängd
kontaktfenomen som t.ex. friktion, slitage, kontakttemperatur, kontakttryck och topografi.
Det är svårt att experimentellt studera vad som händer i kontakten mellan skiva och belägg
under en inbromsning. Dessutom behöver experimenten att friktionsmaterialen och
bromssystemet redan är tillverkat. Syftet med avhandlingen är att utveckla en
simuleringsmetodik för att bättre förstå kontaktfenomen och att utvärdera friktionsmaterial
och bromssystemets tribologiska och emissionsprestanda i den tidiga utvecklingsfasen av
nya bromssystem.
Olika simuleringsmetoder kan användas beroende på vad man vill utvärdera. Ett
makroskopiskt tillvägagångssätt baserat på Finit elementanalys (FEA) kan användas för att
utvärdera slitaget, partikelemissionen och friktionskoefficient (COF) för hela bromssystem.
Ett mesoskopiskt angreppsätt baserat på Cellulära Automater (CA) kan användas för att
utvärdera det lokala kontaktbeteendet mellan skiva och belägg, och påverkan av olika
ingredienser i beläggens friktionsmaterial. Dessa två simuleringsmetoder kan integreras för
att skapa en övergripande simuleringsmetodik som kombinerar flera skalor för att
undersöka och förutsäga kontaktfenomen i bromssystem.
I artikel A undersöks luftburna partiklars rörelse i en box som omsluter en pinne på skiva
tribometer (POD) och utvärderar samplingseffektiviteten. Resultatet används för att
korrigera resultaten då simulerade och uppmätta resultat jämförs i artikel B.
Artikel B beskriver en FEA för att utvärdera slitage och partikelutsläpp från skivbromsar
utifrån materialkarakterisering med tribometer. Simuleringsresultat jämförs med
experimentella resultat som utförs med en fullskalig bromsbänk.
Artikel C beskriver en FEA för att utvärdera COF för en skivbroms med utgångspunkt
från en tribologisk materialkaraktärisering. Simuleringsresultatet jämförs med
experimentella resultat från en bromsbänk.
Artikel D beskriver en CA för att undersöka skillnaden i kontakten mellan en
gjutjärnsskiva och en keramiskt belagd gjutjärnsskiva.
I artikel E utökas CA-metodiken i artikel D för att kunna studera hur keramiskt belagda
bromsskivor kan påverka det lokala kontakttrycket och kontaktarean.
I artikel F utvecklas en flerskalig simuleringsmetodik som kombinerar FEA-, CFD- och
CA-simuleringar för att undersöka den lokala kontakttemperaturen för Cu-fulla och Cu-fria
kommersiella bromsbelägg.

viii

ix
List of appended publications
Paper A A CFD study of a pin-on-disc tribometer setup focusing on airborne par-
ticle sampling efficiency
Published in the conference proceedings of the 6th European COnference on TRIBology 7–9 June
2017, Ljubljana, Slovenia.
Gabriele Riva planned the work, performed the simulation work, evaluated the results and
was responsible for most of the writing.
Paper B An FEA Approach to Simulate Disc Brake Wear and Airborne Particle
Emissions
Published in Tribology International 138 (2019) 90–98.
Gabriele Riva performed part of the simulation work, evaluated the results and was respon-
sible for most of the writing.
Paper C A finite element analysis (FEA) approach to simulate the coefficient of
friction of a brake system starting from material friction characterization
Published in Friction.
Gabriele Riva planned the work, performed part of the simulation work, evaluated the re-
sults, and was responsible for most of the writing.
Paper D A numerical study of disc brakes wear dependence of rotor surface coat-
ing
Published in the conference proceedings of Eurobrake, 22–24 May 2018, The Hague, Netherlands.
Gabriele Riva performed the simulation work, evaluated the results, and was responsible
for most of the writing.
Paper E Simulation of contact area and pressure dependence of initial surface
roughness for cermet-coated discs used in disc brakes
Published in Tribology in Industry Vol. 41, No. 1 (2019) 1–13.
Gabriele Riva planned part of the work, performed the simulation work, evaluated the re-
sults, and was responsible for most of the writing.
Paper F A Multi-Scale Simulation Approach to Investigate Local Contact Tem-
peratures for Commercial Cu-Full and Cu-Free Brake Pads
Published in Lubricants 7, 80 (2019).
Gabriele Riva planned the work, performed most of the simulation work, evaluated the re-
sults, and was responsible for most of the writing.

x
List of additional publications
Paper G CFD simulation of a meso-combustor with detailed kinetics
Published in the conference proceedings of the XXXVI Meeting of the Italian Section of the Com-
bustion Institute, 13–15 June 2013, Procida, Italy.
Paper H Design, Set-up and Validation of an Aerodynamic Bench for Wheel Cor-
ner Flow Investigation in Vented Brake Disc Testing
Accepted by the conference proceedings of Eurobrake 2020 (accepted on 9 March, 2020).

xi

xii

xiii
Acknowledgements
Most of the presented work has been conducted at the Department of Machine Design at
KTH Royal Institute of Technology in collaboration with Brembo S.p.A. that also funded
this project.
I would like to thank my main supervisor Jens Wahlström to have always been focused on
this project and to have supported me every time I needed. I would like to thank my indus-
trial supervisor Guido Perricone to have always supported and sponsored me in this project.
Thanks also to my Brembo managers Alessandro Ciotti, Raffaello Cornolti and Pietro Barale.
I would like to thank my co-authors and colleagues Mattia Alemani, Matteo Redaelli, Gior-
gio Valota, Giacomo Valsecchi, Francesco Varriale and Fabrizio Venanzoni for the support
to my work during these years.
A special thank goes to my Stockholm friends Pouya, Yang, Nico, Patrick, Abbos, Naveen,
Simo, Elisa, José, Rocco, Benedetta, Bertrand, Gabriel, Bin Bin, Ying Ying, and all the others
I am forgetting. Thank you for the time spent together, I really enjoyed Stockholm with you.
Thanks to my Italian friends Robi, Pago, Emi, Brian, Vincio, Forti, Davide, Albi and Marco.
I would like to thank my mum Maria and my sister Gloria to always support and trust me.
Finally, the biggest thank goes to my girlfriend Valeria, wherever we are I always feel home
with you.

xiv
xv
Acronyms
UN: United Nations
CA: Cellular Automaton
CFD: Computational Fluid Dynamic
COF: Coefficient of Friction
Cu: Copper
ELPI: Electrical Low Pressure Impactor
FE: Finite Elements
FEA: Finite Element Analysis
HTC: Heat Transfer Coefficient
LACT: Los Angeles City Traffic
MCA: Movable Cellular Automaton
MD: Molecular Dynamics
PhD: Philosophiae Doctor (Doctor of Philosophy)
PM10: particulate matter 10 micrometres or less in aerodynamic diameter
POD: Pin on Disc
RQ: Research Question
SDG: Sustainable Development Goal

xvi
xvii
Contents
1. Introduction ........................................................................................................................1
1.1 Background ................................................................................................................. 2
1.2 Research questions ..................................................................................................... 3
1.3 Thesis outline .............................................................................................................. 4
2. Disc brake systems .............................................................................................................5
2.1 Disc .............................................................................................................................. 5
2.2 Calliper ........................................................................................................................ 6
2.3 Pads ............................................................................................................................. 7
3. Proposed simulation methodology ...................................................................................9
3.1 Pin-on-disc tribometer.............................................................................................. 10
3.2 Dyno .......................................................................................................................... 10
3.3 Finite Element Analysis ........................................................................................... 11
3.4 Thermal CFD simulation ......................................................................................... 13
3.5 CA .............................................................................................................................. 14
4. Summary of results of the appended papers ................................................................. 17
4.1 POD particle sampling efficiency (Paper A)........................................................... 17
4.2 Brake system wear, particle emissions and COF (Paper B and Paper C) ............. 18
4.3 Contact meso-scale results (Paper D, Paper E and Paper F) ................................. 20
5. Discussion, conclusions and future work ....................................................................... 25
5.1 Discussion ................................................................................................................. 25
5.1.1 RQ1 .................................................................................................................... 25
5.1.2 RQ2 .................................................................................................................... 25
5.1.3 RQ3 .................................................................................................................... 28
5.1.4 RQ4 .................................................................................................................... 29
5.2 Conclusions ............................................................................................................... 29
5.3 Future challenges ...................................................................................................... 31
6. Bibliography ..................................................................................................................... 33
Appended papers

xviii
List of Figures
Figure 1: 3D model of a brake system (Paper F). .................................................................. 5
Figure 2: 3D model of a cast iron integral disc. On the left the entire disc; on the right the
disc sectioned in the middle of the ventilation (pillars). ........................................................... 6
Figure 3: 3D model of a fixed aluminium calliper. On the left, the calliper assembly; on
the right, the pads and piston components. .............................................................................. 7
Figure 4: Pad picture. On the left a picture of the entire pad after testing (disc rotation
counter-clockwise). On the right a light optical microscope picture of the friction material.
The red patches are mostly copper fibres; the yellow patches are mostly brass fibres; the blue
patches are mostly steel fibres and the grey/black patches are mostly the homogeneous part
made by the other components described [30]. ......................................................................... 8
Figure 5: Schematic view of the methodology procedure. .................................................. 9
Figure 6: An overview of the inertia dyno bench setup with the important parts marked
(Paper F). .................................................................................................................................... 11
Figure 7: FEA simulation routine. ....................................................................................... 12
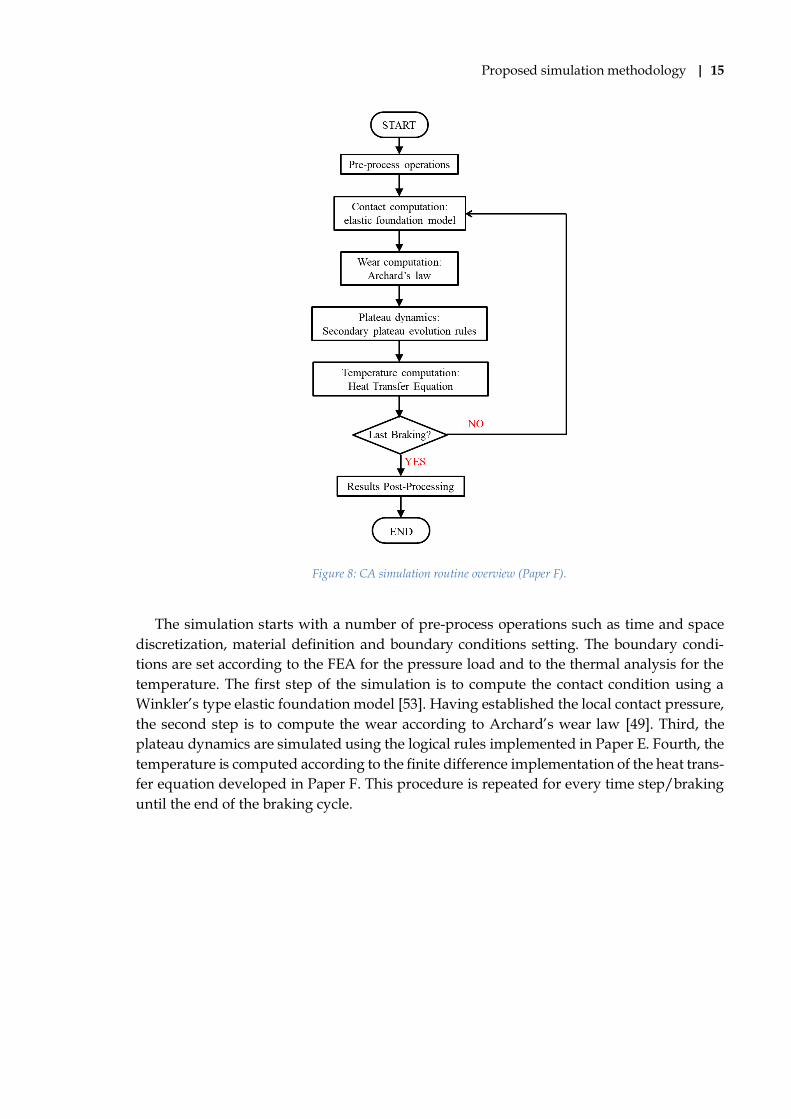
Figure 8: CA simulation routine overview (Paper F). ........................................................ 15
Figure 9: Velocity profile at the sampling point (Paper A). ............................................... 17
Figure 10: Simulated mass loss for pads and rotor during one reduced LACT. Left
column: cumulative mass loss. Right column: mass loss per each individual brake event
(Paper B). .................................................................................................................................... 18
Figure 11: Measured (upper row) and simulated (lower row) PM10 emission for brake
event 1–100 of LACT (Paper B). ................................................................................................ 19
Figure 12: COF time history during the selected braking. Experimental COF in black; FEA
COF in red (Paper C). ................................................................................................................ 20
Figure 13: Simulated disc surface topography after braking (Paper D). .......................... 21
Figure 14: Simulated disc surface profile after 3000 seconds. Upper: real disc surface
profile as input. Lower-left: surface profile of the real surface divided by 10. Lower-right:
surface profile of the real surface divided by 100 (Paper E). .................................................. 21
Figure 15: Contact pressure on the pin surfaces. On the left the pin coupled to the coated
disc; on the right the pin coupled to the standard cast iron disc (Paper D). ......................... 22
Figure 16: Simulated contact pressure distribution after 3000 seconds. Upper: real disc
surface profile as input. Lower-left: surface profile of the real surface divided by 10. Lower-
right: surface profile of the real surface divided by 100 (Paper E). ........................................ 22
Figure 17: Simulated contact area. Black: real disc surface profile as input. Blue: surface
profile of the real surface divided by 10. Red: surface profile of the real surface divided by
100 (Paper E). ............................................................................................................................. 23
Figure 18: Pad surface temperature distributions after brake event no. 4 for the Cu-full
and Cu-free materials. Disc rotation counter: clockwise (Paper F). ....................................... 24

xix
List of Tables
Table 1: Isokinetic sampling efficiency. .............................................................................. 17
Table 2: Measured and simulated mass loss after five reduced LACT tests (Paper B). .. 18
Table 3: Measured and simulated airborne PM10 emissions of LACT (Paper B). .......... 19

xx

Introduction | 1
1. Introduction
Low air quality is a problem that affects around 90% of the global population [1]. Conse-
quently, in 2012, air quality improvement has been included in the United Nation’s (UN)
sustainable development goals (SDGs) [2] in order to drive institutions, the scientific com-
munity and companies to focus their attention on this topic. One of the most important pa-
rameters to quantify air quality is the particle concentration. The presence of particles in the
air can affect human health [3]–[5]. Particles emitted from a source can fall to the ground or
adhere to other surfaces, or they can be airborne particles, which can be inhaled by both
humans and animals. Airborne particles in urban areas can come from different sources [6],
such as natural dust and sea salt, industrial activities (e.g. power generation), domestic fuel
combustion and road traffic. Road traffic is actually the primary source of particle emissions
in urban areas [7]. Road traffic emissions are generated from vehicles and can be divided
into two main groups based on the nature of the source: exhaust and non-exhaust emissions.
Exhaust emissions are from vehicle engines and, historically, are the source of all studies.
Recently, non-exhaust emissions have been considered to be as important as engine emis-
sions [8]. Emissions from friction brakes are one of the main sources of non-exhaust emis-
sions from road traffic [9].
Brake emissions are highly dependent on the pad-to-disc contact situation. This means
that all the main phenomena in the sliding contact interface have to be studied, for example,
friction [10], wear [11], contact pressure [12]–[13], contact temperature [14]–[15] and particle
emission [16] itself. The actual approach used by brake manufacturers to design new friction
material is based on experience and trial-and-error processes, in which several formulations
must be produced and several tests performed to evaluate the performance of the friction
material. At the same time, knowing the friction material itself is not enough, because the
same frictional material can show different behaviours if used in different brake systems.
This means that in order to know the performance of an entire brake system, it is necessary
to wait until the system has been manufactured and tested, at least in its prototype form.
Moreover, due to its limited accessibility, it is difficult to fully investigate pad-to-disc con-
tact experimentally in terms of contact pressure, contact area, local wear, local coefficient of
friction (COF), etc. Thus, in this respect, a simulation approach could be beneficial.
The work presented in this thesis deals with the simulation of the contact between disc
and pads in brake systems for commercial vehicles (mainly passenger cars). The develop-
ment of a simulation methodology that is capable of predicting and investigating friction
material and brake system performance not only allows an understanding of the phenom-
ena that are difficult to study through experiments, it also allows the evaluation of the per-
formance of new friction material and new brake systems in the early design phase. This
results in savings in resource consumption in terms of cost and time and a consequential
increase in the sustainability of product development.

Introduction | 2
1.1 Background
From a historical perspective, interest in the contact between pads and disc in brake sys-
tems started with studies based on experimental activities, in which the contact surfaces
were analysed before and after testing. Different kind of tests can be identified according to
the scale of the test and the system involved. Starting from full-scale tests on entire vehicles,
there are road tests [17] in which the brake system is tested with the whole vehicle on roads
or tracks, and chassis dyno tests [18], in which the vehicle is tested in a controlled room with
inertia rolls under the wheels to simulate braking. Always taking into account a full-scale
brake system but without the full-scale vehicle, tests can be performed on a dyno bench or
inertia dynamometer [19]. This is conducted by assembling the disc on a rotating shaft and
the calliper on a fixed support. The dyno bench can be equipped with a clean chamber to
perform tests that focus on particle emissions [20]. Regarding scaled samples, several tribo-
meter systems have been developed. Two main tribometers have been identified: a mini or
scaled dyno [21] and a pin on disc (POD) [22]. Both systems are equipped with a scaled
brake disc and a sample of friction material sliding against the disc. The main difference is
that dynamic braking can be evaluated on a scaled dyno, since the pressure is applied
through a pneumatic system and the disc is assembled on an inertia shaft, while constant
pressure and constant velocity braking can be evaluated on a POD, since the pressure is set
by weights. The issue with physical experiments is that the contact between pads and disc
is not accessible during the test. Thus, the contact behaviour can only be investigated meas-
uring correlated variables such as wear, friction coefficient and particle emissions. The phe-
nomena acting at the interfaces can only be studied a posteriori and it is not possible to eval-
uate what happens in the interface during the contact. Thus, a simulation could help to in-
vestigate the contact behaviour and predict it before testing.
Different kinds of simulation approaches can be used to simulate the pad-to-disc contact
in brake systems, depending on what is to be simulated. The simulation approaches found
in the literature can be divided into two main categories: meso/micro-scale and macro-scale
approaches. Also, a smaller-scale approach, called molecular dynamics, which considers the
interaction between molecules, has been used in the literature, although it will not be the
subject of this work.
The first category is primarily approached using two kinds of simulation: movable cellu-
lar automaton [23]–[25] and cellular automaton [26]–[31]. The movable cellular automaton
method mainly focuses on the simulation of the nanometre third layer, which is formed
during the contact of friction material with the sliding disc. The wear debris detaches from
the two bodies and forms a very thin film (10–100 nm) that is mainly responsible for the
friction properties developed by the contact. The cellular automaton, however, is more fo-
cused on the two contacting bodies interacting with each other, meaning the disc and pad.
Due to the wear from the bodies during contact, some debris that has not been released into
the environment builds up on the original surfaces and modifies the surface topography.
The modification of the two surfaces during contact can be described using some logical
Introduction | 3
rules. In general, the macroscopic wear, friction and particle emission behaviour can be ex-
plained by the formation and destruction of some plateaus, known as secondary plateaus,
on the disc and pad surfaces.
The second category considers the phenomena that mainly act at the macro scale, in
which the design of the brake system components is taken into account and is generally
simulated using finite element analysis (FEA) [32]–[38]. Using this approach, it is possible
to study the macro-contact conditions for a given pad-disc pair. Here, the influence between
different brake systems can also be evaluated. Starting from a tribological characterization
of friction material-disc contact, it is possible to evaluate the wear, friction and particle emis-
sion characteristics of a brake system. In macro-scale approaches, thermal CFD (computa-
tional fluid dynamics) simulation [39]–[42] can also be used to focus on the temperature of
the brake system and study the particle motion inside the test environment.
In the literature, a lack of studies has been identified on the interaction between the two
groups of phenomena and the two groups of simulation. The aim of this thesis is to develop
a simulation procedure capable of making the different scale phenomena interact, starting
from single simulations and then combining them. Moreover, a lack of studies has also been
identified on the virtual characterization of friction material starting from the basic constit-
uents (e.g. fibres, resin). Thus, the aim of the meso-scale simulation also applies to this vir-
tual characterization.
1.2 Research questions
The main objective of this thesis is to develop a simulation methodology to investigate
the performance of the friction materials of a brake system. Performance mainly refers to
friction, wear and particle emission. This main objective can be divided into four main parts.
First, we want to identify the main phenomena that influence the pad-to-disc contact, the
scales involved, and how these different scale phenomena can be simulated. Second, we
study which phenomena can be investigated using the developed methodology. Third, we
compare the simulated and experimental results to verify the simulation validity and to un-
derstand whether the simulation approach can be used to predict observed phenomena.
Lastly, we evaluate how the proposed methodology can impact the sustainable develop-
ment goals.
The objectives described can be summarized in the following research questions (RQs)
that guided the PhD work:
RQ1 How can the sliding contacts in disc brakes be simulated on different size scales to study
tribological effects and airborne emissions?
RQ2 Can simulations be used to explain the system phenomena observed during physical experi-
ments?
Introduction | 4
RQ3 Can simulations be used to predict the tribological and airborne emission performance of disc
brakes?
RQ4 How can the developed simulation methodology impact the sustainable development goals?
1.3 Thesis outline
Chapter 1 starts with a general overview of the work, how this work can be useful – and
its objectives. Chapter 2 introduces disc brake systems in general. Chapter 3 describes the
proposed simulation methodology. Chapter 4 presents the results of the simulation. Chapter
5 discusses the results, the conclusions and presents the next steps for continuing the work.
Disc brake systems | 5
2. Disc brake systems
An automotive brake system is a component of automotive vehicles that has the function
of slowing down a vehicle, keeping a constant speed when going downhill, or keeping the
vehicle steady when parked. Such functions make the brake system a safety-critical compo-
nent of vehicles. A friction brake system transforms the kinetic energy of the vehicle into
frictional heat. Passenger cars can be equipped with two different kinds of friction brake
systems: disc brakes or drum brakes [43]. Nowadays, the better heat dissipation perfor-
mance of disc brake systems has driven car manufacturers to equip their vehicles with these
kinds of brakes, or at least disc brakes on the front, which usually carry most of the load,
and drum brakes on the rear [44]. Recently, electric vehicles have become increasingly pop-
ular. In electric vehicles, part of the standard braking is provided by a regenerative electric
system. These kinds of vehicles are also equipped with standard disc brakes to transform
kinetic energy into heat during all braking conditions in which the regenerative braking
cannot provide a consistent deceleration of the vehicle [45]. For a standard passenger vehicle
equipped with a disc brake system, the braking input is provided by the driver, who de-
presses the brake pedal, or by some active controls (e.g. adaptive cruise control and collision
detection systems). When braking, all the brake fluid inside the system is placed under pres-
sure through a pump. The brake fluid, which is also inside the calliper, pushes one or more
pistons against the pads. The pads, in turn, are pushed against a rotating disc that generates
a tangential force. This tangential force is the braking force and is dependent on the contact
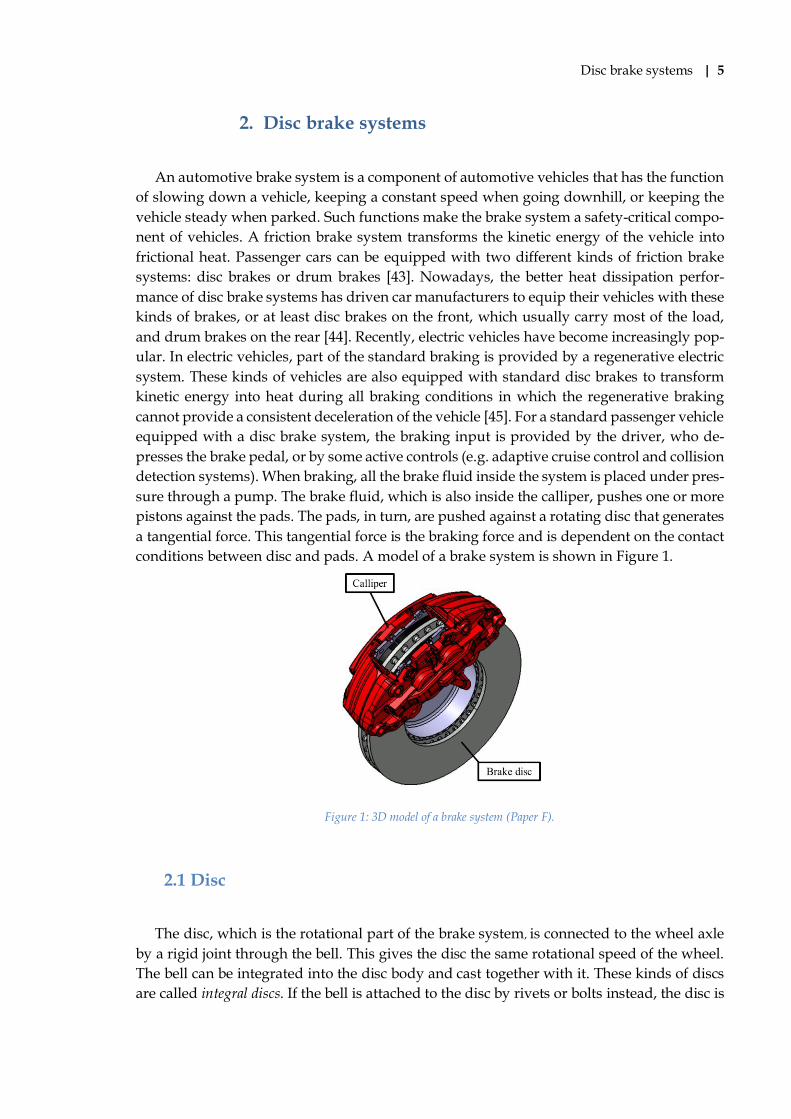
conditions between disc and pads. A model of a brake system is shown in Figure 1.
Figure 1: 3D model of a brake system (Paper F).
2.1 Disc
The disc, which is the rotational part of the brake system, is connected to the wheel axle
by a rigid joint through the bell. This gives the disc the same rotational speed of the wheel.
The bell can be integrated into the disc body and cast together with it. These kinds of discs
are called integral discs. If the bell is attached to the disc by rivets or bolts instead, the disc is
Disc brake systems | 6
called floating disc. In this kind of disc, the bell is usually manufactured using a different
material.
A third family can be identified when the bell is made of a different material but it is co-cast
with the disc. These are called co-cast discs.
Most discs used in passenger and commercial vehicles are made of cast iron through a
casting process. Sometimes, the brake rings of cast iron discs are coated to increase perfor-
mance. Some expensive and/or performance cars use carbon ceramic brakes in which the
brake disc is made of a ceramic matrix reinforced with carbon fibres. However, carbon ce-
ramic brakes will not be discussed in this work.
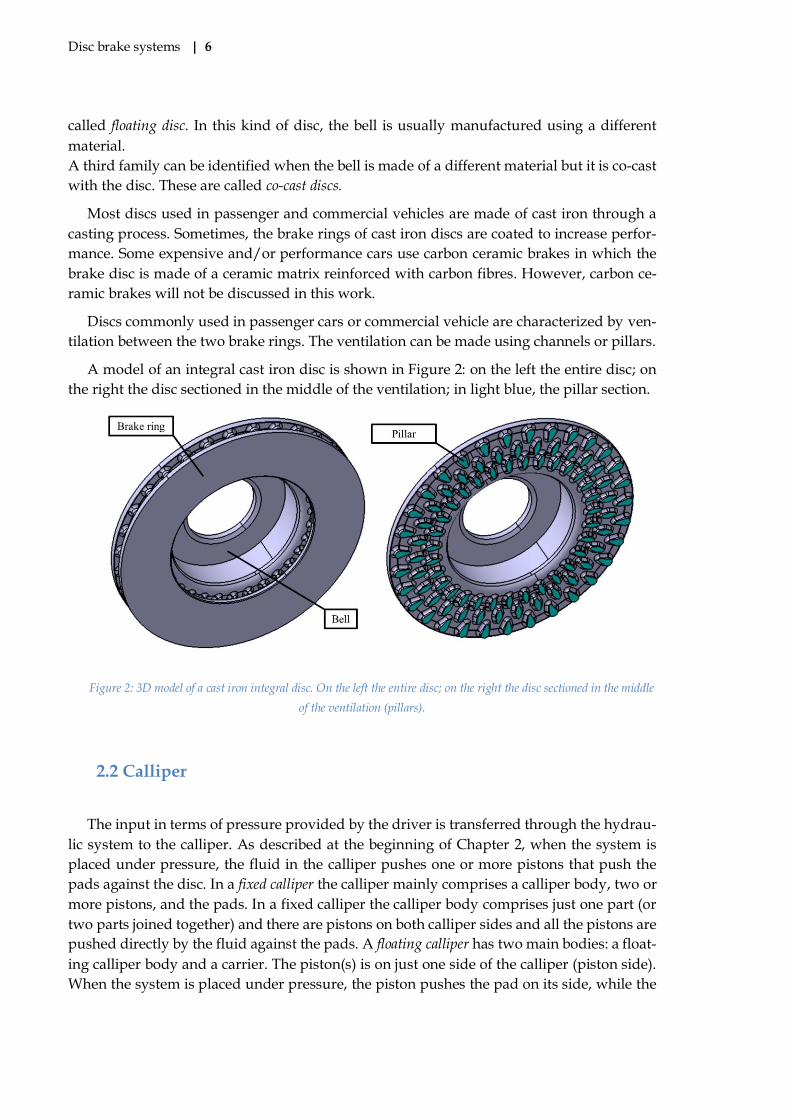
Discs commonly used in passenger cars or commercial vehicle are characterized by ven-
tilation between the two brake rings. The ventilation can be made using channels or pillars.
A model of an integral cast iron disc is shown in Figure 2: on the left the entire disc; on
the right the disc sectioned in the middle of the ventilation; in light blue, the pillar section.
Figure 2: 3D model of a cast iron integral disc. On the left the entire disc; on the right the disc sectioned in the middle
of the ventilation (pillars).
2.2 Calliper
The input in terms of pressure provided by the driver is transferred through the hydrau-
lic system to the calliper. As described at the beginning of Chapter 2, when the system is
placed under pressure, the fluid in the calliper pushes one or more pistons that push the
pads against the disc. In a fixed calliper the calliper mainly comprises a calliper body, two or
more pistons, and the pads. In a fixed calliper the calliper body comprises just one part (or
two parts joined together) and there are pistons on both calliper sides and all the pistons are
pushed directly by the fluid against the pads. A floating calliper has two main bodies: a float-
ing calliper body and a carrier. The piston(s) is on just one side of the calliper (piston side).
When the system is placed under pressure, the piston pushes the pad on its side, while the
Disc brake systems | 7
calliper can slide on two pins and the reaction, which is on the other side (finger side), can
push the other pad. Fixed callipers are generally made of aluminium alloy and are normally
used on more expensive and/or performance vehicles. Floating callipers are usually made
of cast iron. They are less costly and are normally used in commercial vehicles or smaller
cars.
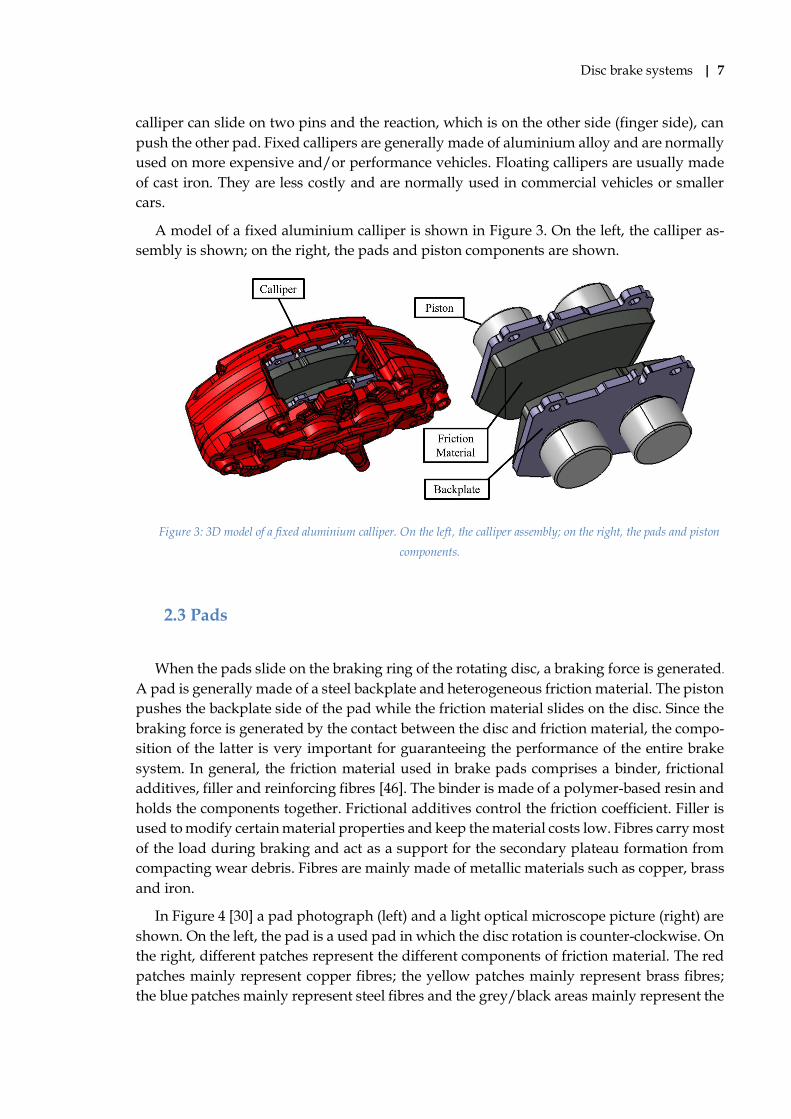
A model of a fixed aluminium calliper is shown in Figure 3. On the left, the calliper as-
sembly is shown; on the right, the pads and piston components are shown.
Figure 3: 3D model of a fixed aluminium calliper. On the left, the calliper assembly; on the right, the pads and piston
components.
2.3 Pads
When the pads slide on the braking ring of the rotating disc, a braking force is generated.
A pad is generally made of a steel backplate and heterogeneous friction material. The piston
pushes the backplate side of the pad while the friction material slides on the disc. Since the
braking force is generated by the contact between the disc and friction material, the compo-
sition of the latter is very important for guaranteeing the performance of the entire brake
system. In general, the friction material used in brake pads comprises a binder, frictional
additives, filler and reinforcing fibres [46]. The binder is made of a polymer-based resin and
holds the components together. Frictional additives control the friction coefficient. Filler is
used to modify certain material properties and keep the material costs low. Fibres carry most
of the load during braking and act as a support for the secondary plateau formation from
compacting wear debris. Fibres are mainly made of metallic materials such as copper, brass
and iron.
In Figure 4 [30] a pad photograph (left) and a light optical microscope picture (right) are
shown. On the left, the pad is a used pad in which the disc rotation is counter-clockwise. On
the right, different patches represent the different components of friction material. The red
patches mainly represent copper fibres; the yellow patches mainly represent brass fibres;
the blue patches mainly represent steel fibres and the grey/black areas mainly represent the
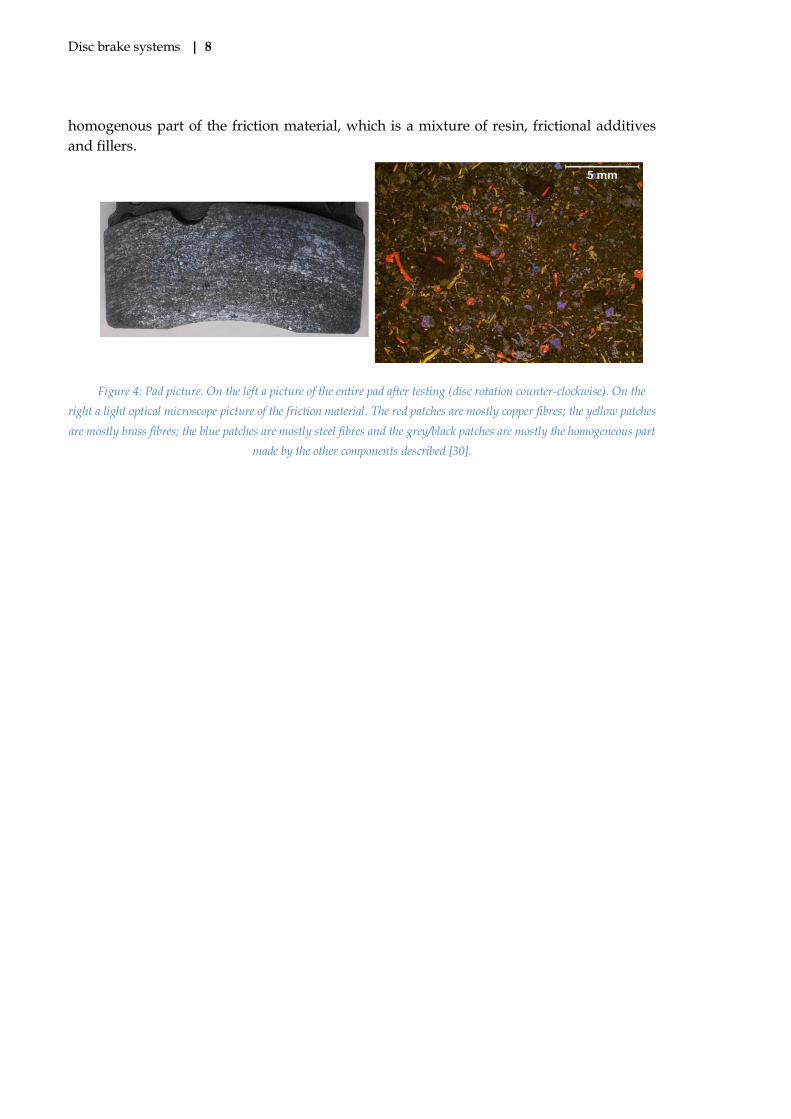
Disc brake systems | 8
homogenous part of the friction material, which is a mixture of resin, frictional additives
and fillers.
Figure 4: Pad picture. On the left a picture of the entire pad after testing (disc rotation counter-clockwise). On the
right a light optical microscope picture of the friction material. The red patches are mostly copper fibres; the yellow patches
are mostly brass fibres; the blue patches are mostly steel fibres and the grey/black patches are mostly the homogeneous part
made by the other components described [30].
Proposed simulation methodology | 9
3. Proposed simulation methodology
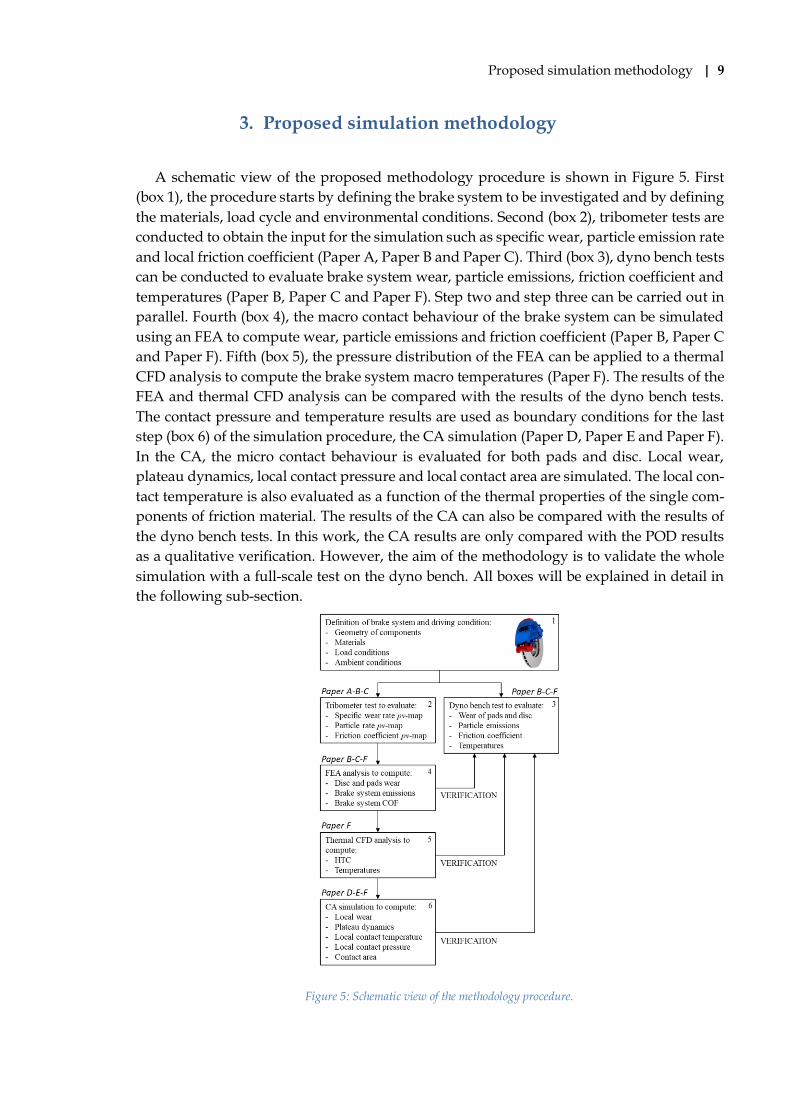
A schematic view of the proposed methodology procedure is shown in Figure 5. First
(box 1), the procedure starts by defining the brake system to be investigated and by defining
the materials, load cycle and environmental conditions. Second (box 2), tribometer tests are
conducted to obtain the input for the simulation such as specific wear, particle emission rate
and local friction coefficient (Paper A, Paper B and Paper C). Third (box 3), dyno bench tests
can be conducted to evaluate brake system wear, particle emissions, friction coefficient and
temperatures (Paper B, Paper C and Paper F). Step two and step three can be carried out in
parallel. Fourth (box 4), the macro contact behaviour of the brake system can be simulated
using an FEA to compute wear, particle emissions and friction coefficient (Paper B, Paper C
and Paper F). Fifth (box 5), the pressure distribution of the FEA can be applied to a thermal
CFD analysis to compute the brake system macro temperatures (Paper F). The results of the
FEA and thermal CFD analysis can be compared with the results of the dyno bench tests.
The contact pressure and temperature results are used as boundary conditions for the last
step (box 6) of the simulation procedure, the CA simulation (Paper D, Paper E and Paper F).
In the CA, the micro contact behaviour is evaluated for both pads and disc. Local wear,
plateau dynamics, local contact pressure and local contact area are simulated. The local con-
tact temperature is also evaluated as a function of the thermal properties of the single com-
ponents of friction material. The results of the CA can also be compared with the results of
the dyno bench tests. In this work, the CA results are only compared with the POD results
as a qualitative verification. However, the aim of the methodology is to validate the whole
simulation with a full-scale test on the dyno bench. All boxes will be explained in detail in
the following sub-section.
Figure 5: Schematic view of the methodology procedure.
Proposed simulation methodology | 10
3.1 Pin-on-disc tribometer
The friction material and disc material can be tested using a pin-on-disc tribometer, as
conducted by Wahlström et al. [22]. The pin-on-disc tests are performed as described in Pa-
per B. These scaled tests are conducted to obtain a characterization of the friction material
and the disc material in terms of specific wear, local friction coefficient and particle emission
rate. The tests are performed in 12 different conditions and the test results are linearly inter-
polated to obtain three pv maps describing a set of conditions. These maps are used as input
for the FEA simulation described in sub-section 3.3.
Regarding particle emissions, the isokinetic efficiency has been studied in Paper A. This
was carried out to compare the simulation results with the dyno bench test results in which
the facility has been designed to have an isokinetic condition at the sampling point. The
efficiency was evaluated using a two-phase flow analysis performed with the commercial
software StarCCM+ [47]. The particle emission computed by the simulation was corrected
by the POD efficiency to include the effect of anisokinetic sampling.
3.2 Dyno
The dyno bench used is the facility developed by Perricone et al. [20], described in Paper
B, and is shown here in Figure 6. It comprises a clean chamber built inside a dyno bench test
for brake systems. In the dyno bench, the entire brake system was tested with the same
braking load that would have been applied in a road test. The clean chamber was built with
a focus on particle emission measurements. For tests that only focus on friction and wear, a
standard dyno bench without a clean chamber can be used.
The measurement of wear (Paper B) involved weighing the pads and the disc before and
after the test to measure the difference in weight using a Sartorius balance MSE14202S (re-
peatability ±0.01g).
Particle emission measurements (Paper B) were carried out using an ELPI+ (electrical
low pressure impactor). ELPI+ registers the mass concentration at a frequency of 1 Hz. The
PM10 particles were measured, meaning all particles with an aerodynamic diameter of less
than 10 µm.
COF measurement (Paper C) was carried out measuring the normal force with a pressure
sensor and the braking torque with a torque meter. By then dividing the tangential force by
the normal force, it is possible to obtain the COF of the brake system.

Proposed simulation methodology | 11
Figure 6: An overview of the inertia dyno bench setup with the important parts marked (Paper F).
3.3 Finite Element Analysis
An FEA was performed using the commercial software Abaqus [48] coupled to a user-
developed subroutine. Two different analyses were developed: the first for computing wear
and particle emissions (Paper B) and the second for computing the COF (Paper C). These
two different analyses have been developed because of the different time scale characteris-
tics of the simulated phenomena. The first two phenomena are interesting if observed dur-
ing a complete cycle, since wear and particle emissions do not present relevant results after
just a single braking sequence. However, the COF is also very interesting if studied during
the same braking, to investigate phenomena such as the in-stop growth of the COF, local
hot spots and stability of the COF itself during a braking event. The two different analyses
could be combined in order to have just one FEA capable of computing all the quantities.
Also, because from a process perspective, the two analyses are quite similar, they will be
described here as just one single process. Figure 7 shows the FEA simulation routine.

Proposed simulation methodology | 12
Figure 7: FEA simulation routine.
The simulation procedure starts with a number of pre-process operations such as definition
of the geometries, mesh and load cycle. Second, an FEA is conducted in order to compute
the contact pressure between pads and disc. In the FEA model, the calliper is fixed with two
constraints corresponding to the fixing points, pressure is applied to the back of the pistons
and against the entire canalization wall, and the disc is put in rotation. All the components
described in Chapter 2 are considered in the simulation. Third, wear, particle emissions and
the COF are computed, taken into account the local conditions of pressure and velocity, in
which local means in every node that is in contact.
Wear computation (Paper B) can be obtained using Archard’s wear law [49]. For the pads,
the wear depth is computed as follows:
( , )p ph k p v p s (1)
where kp is the specific wear rate of the pad obtained by the specific wear map described
in section 3.1, and is a function of pressure and velocity, p is the cell contact pressure, and
Δs is the node sliding distance. Assuming a constant deceleration during braking, the disc
wear can be computed as follows [33]:
2
0
( , ) ( , )
2 2d d
p r p rh k r
(2)
Proposed simulation methodology | 13
where α is the rotation angle, r and θ are the cylindrical coordinates, and kd is the disc
specific wear rate.
The mass particle emissions for every braking event (Paper B) can be computed starting
with the local pressure and sliding velocity values, as was the case for wear:
1
1
( , )n
nodalparticles POD ELPI i
i pin
Am n p v s
A
(3)
where ηPOD is the particle sampling efficiency of the pin-on-disc tribometer as a result of
anisokinetic sampling, computed in Paper A; nELPI+ is the particle emission per sliding dis-
tance and is given by the pv map; Anodal is the nodal area of the FEA mesh; and Apin is the pin
area.
The brake system COF for every time step (Paper C) can be computed by dividing the tan-
gential force by the normal force:
1
1
2
N
i ci ni
isys p
p Ap A
(4)
where psys is the pressure applied to the brake system; Ap is the piston(s) area; µi is the
local COF obtained by the map mentioned in section 3.1 and is a function of the local contact
pressure and the local sliding velocity; pci is the local contact pressure; and Ani is the nodal
area.
After the wear, particle emission and COF have been computed, the mesh can be updated
and the analysis can be performed for the next braking until the end of the cycle.
3.4 Thermal CFD simulation
Thermal CFD simulation was performed using the commercial software StarCCM+ [47]
(Paper F). The simulation procedure was assisted by two different simulation models: the
first model was a CFD model in which the aerodynamic field was solved to compute the
heat transfer coefficients (HTCs) on the wall of the brake system; the second model was a
thermal model in which the computed HTCs were set as boundary conditions and the tem-
peratures of the brake system were computed.
The CFD model represents the dyno bench described in sub-section 3.2. The Reynolds-
averaged Navier-Stokes (RANS) equations were solved together with the energy equation
and coupled to a k-ε turbulence model [50]. Referring to Figure 6, the mass flow was set at
the inlet and the ambient pressure was set at both the outlets. The rotation was set using a
moving reference frame (MRF) to the disc. The temperature was set on all brake system
components described in section 2 to compute the HTCs. The CFD simulations were run at
different velocities and the HTC maps were linearly interpolated between these different
conditions and represented as a function of velocity.
Proposed simulation methodology | 14
In the thermal model, all components described in section 2 were simulated. The Fourier
equation [51] was solved to compute the temperature of the brake system. Conduction, con-
vection and radiation between the components were taken into account. For convection, the
HTC distribution obtained by the CFD analysis was mapped on the brake system and line-
arly interpolated as a function of velocity.
3.5 CA
CA is a kind of simulation in which an object is discretized and treated as a set of small
elements, the automata. Every automaton is characterized by a status. The principle of func-
tionality is given by the implementation of logical rules between adjacent automata. These
logical rules are based on what has been observed during the experiments [52]. Moreover,
mechanical equations are computed between different bodies to solve contact and wear, and
thermal equations are also solved in order to find the temperature distribution of the studied
objects. In this thesis, CA methodology has been used to study the formation and destruc-
tion of secondary plateaus on the contact surfaces. Thus, every automaton can change its
status from one that describes the initial surface to secondary plateaus, or return to its orig-
inal status if the secondary plateau is, respectively, created or destroyed on the surface. This
CA simulation procedure has been developed in Paper D, Paper E and Paper F. In Paper D
and Paper E, the simulation approach used by Wahlström [30] to simulate the plateau dy-
namics on the pad surface has been extended to include the plateau dynamics on the disc
surface. In Paper F, the CA has been integrated into a multi-scale procedure to incorporate
the macro boundary conditions of the FEA and thermal CFD simulation. Moreover, the CA
simulation procedure has been extended to compute the temperature inside the friction ma-
terial. The friction material model was also implemented to take into account the different
materials that comprise the friction material mixture. Thus, every single-material compo-
nent modelled has its own thermal properties and the real meso-temperature distribution
on the contact surface can be studied. In Paper F, the disc has been simplified as a flat rigid
surface in order to reduce the computational costs. However, the same approach including
temperature computation can also be extended to the disc. The complete CA simulation
procedure is described below and the CA simulation procedure is shown in Figure 8.
Proposed simulation methodology | 15
Figure 8: CA simulation routine overview (Paper F).
The simulation starts with a number of pre-process operations such as time and space
discretization, material definition and boundary conditions setting. The boundary condi-
tions are set according to the FEA for the pressure load and to the thermal analysis for the
temperature. The first step of the simulation is to compute the contact condition using a
Winkler’s type elastic foundation model [53]. Having established the local contact pressure,
the second step is to compute the wear according to Archard’s wear law [49]. Third, the
plateau dynamics are simulated using the logical rules implemented in Paper E. Fourth, the
temperature is computed according to the finite difference implementation of the heat trans-
fer equation developed in Paper F. This procedure is repeated for every time step/braking
until the end of the braking cycle.

| 16

Summary of results of the appended papers | 17
4. Summary of results of the appended papers
In the following sub-sections, the results are presented. Every sub-section shows the re-
sults referred to a single simulation comprising the overall simulation process described in
section 3-Figure 5: two-phase flow simulation of the POD; FEA to compute brake system
wear, particle emissions and the COF; and meso-scale results from the CA simulation.
4.1 POD particle sampling efficiency (Paper A)
Figure 9 shows the velocity profile at the outlet of the POD chamber (Paper A), which is
the sampling point for airborne particle emissions. As can be seen, the velocity at the outlet
is not parallel to the outlet axis itself. Thus, the unisokinetic particle efficiency will be
proportional to the angle between the probe axis and the velocity vector at this specific
point. The sampling efficiency resulting from the velocity field at the outlet is reported in
Table 1. The efficiency is divided into ultrafine, fine and coarse particles. A confidence
interval has also been added that takes the different velocity angles at different points. The
efficiency results are the same for all the particle sizes considered.
Figure 9: Velocity profile at the sampling point (Paper A).
Table 1: Isokinetic sampling efficiency.
Efficiency % Ultrafine Parti-
cles
Fine Particles Coarse Particles
ηθ 80.8% (±16.5%) 80.8% (±16.5%) 80.8% (±16.5%)
Summary of results of the appended papers | 18
4.2 Brake system wear, particle emissions and COF (Paper B and Paper C)
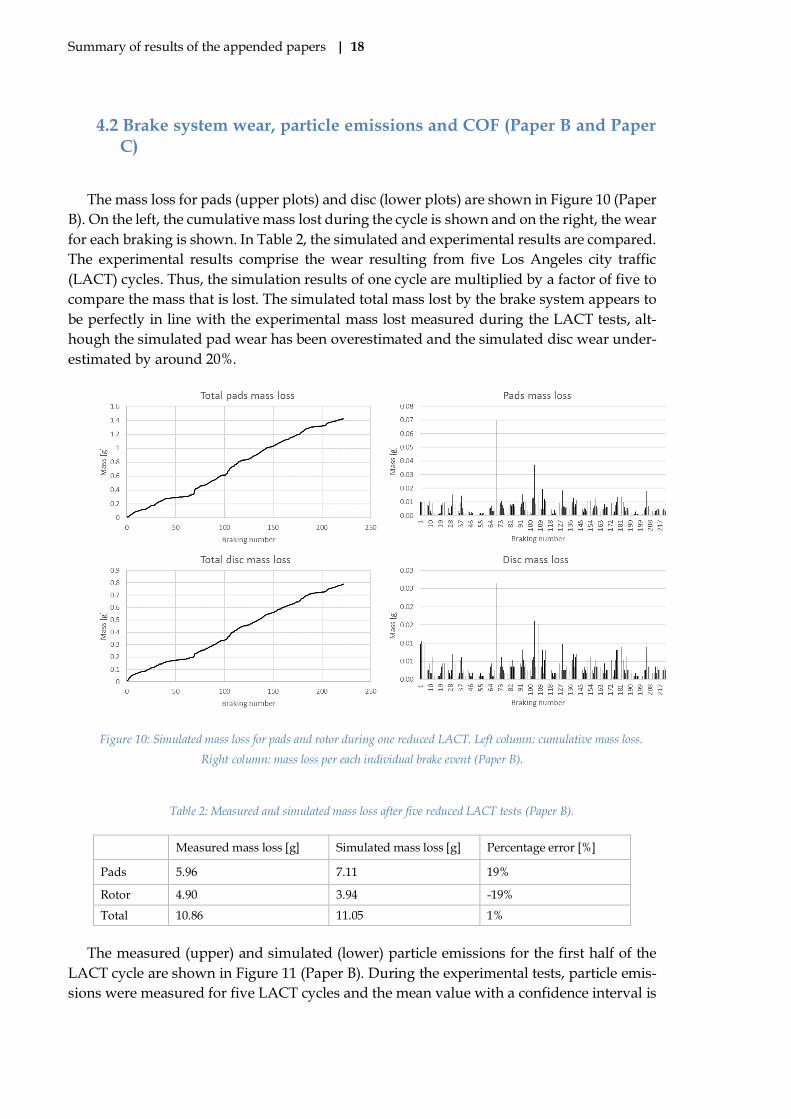
The mass loss for pads (upper plots) and disc (lower plots) are shown in Figure 10 (Paper
B). On the left, the cumulative mass lost during the cycle is shown and on the right, the wear
for each braking is shown. In Table 2, the simulated and experimental results are compared.
The experimental results comprise the wear resulting from five Los Angeles city traffic
(LACT) cycles. Thus, the simulation results of one cycle are multiplied by a factor of five to
compare the mass that is lost. The simulated total mass lost by the brake system appears to
be perfectly in line with the experimental mass lost measured during the LACT tests, alt-
hough the simulated pad wear has been overestimated and the simulated disc wear under-
estimated by around 20%.
Figure 10: Simulated mass loss for pads and rotor during one reduced LACT. Left column: cumulative mass loss.
Right column: mass loss per each individual brake event (Paper B).
Table 2: Measured and simulated mass loss after five reduced LACT tests (Paper B).
Measured mass loss [g] Simulated mass loss [g] Percentage error [%]
Pads 5.96 7.11 19%
Rotor 4.90 3.94 -19%
Total 10.86 11.05 1%
The measured (upper) and simulated (lower) particle emissions for the first half of the
LACT cycle are shown in Figure 11 (Paper B). During the experimental tests, particle emis-
sions were measured for five LACT cycles and the mean value with a confidence interval is

Summary of results of the appended papers | 19
shown in Figure 11. A comparison between the experimental and simulation results is
shown in Table 3, grouping the braking events into four groups. The results appear to be
qualitatively in line and are generally always within the confidence interval of one standard
deviation, or very close to it.
Figure 11: Measured (upper row) and simulated (lower row) PM10 emission for brake events 1–100 from LACT (Pa-
per B).
Table 3: Measured and simulated airborne PM10 emissions from LACT (Paper B).
Brake event Measured PM10 [mg] Simulated PM10 [mg] Relative error [-]
1–55 74 ± 17 77 4%
56–109 190 ± 47 139 -27%
110–163 106 ± 25 86 -18%
164–217 72 ± 16 68 -6%
1–217 (total) 442 ± 105 370 -16%
Figure 12 (Paper C) shows the friction coefficient during 12 braking events taken from
the LACT cycle, for both the experimental (in black) and simulation (in red) results. The
results show a good correlation between simulation and experiments on the COF develop-
ment during a single braking, although the simulated COF is always larger than the meas-
ured COF.

Summary of results of the appended papers | 20
Figure 12: COF time history during the selected braking events. Experimental COF in black; FEA COF in red (Paper
C).
4.3 Contact meso-scale results (Paper D, Paper E and Paper F)
The CA results represent a portion of the disc and pad surfaces analysed after one or
more braking simulations. The results of the CA allow an analysis of how the contact sur-
faces changed as a result of wear and plateau formation; how these secondary plateaus from
wear debris are distributed; what the real parts of the surface in contact are, and thereby the
real contact pressure distribution and contact area; and the contact temperature distribution,
taking into account the influence of the real contact pressure and the nature of the single
material of the friction mixture in contact. A summary of the main meso-scale results of the
CA obtained in this thesis is presented below.
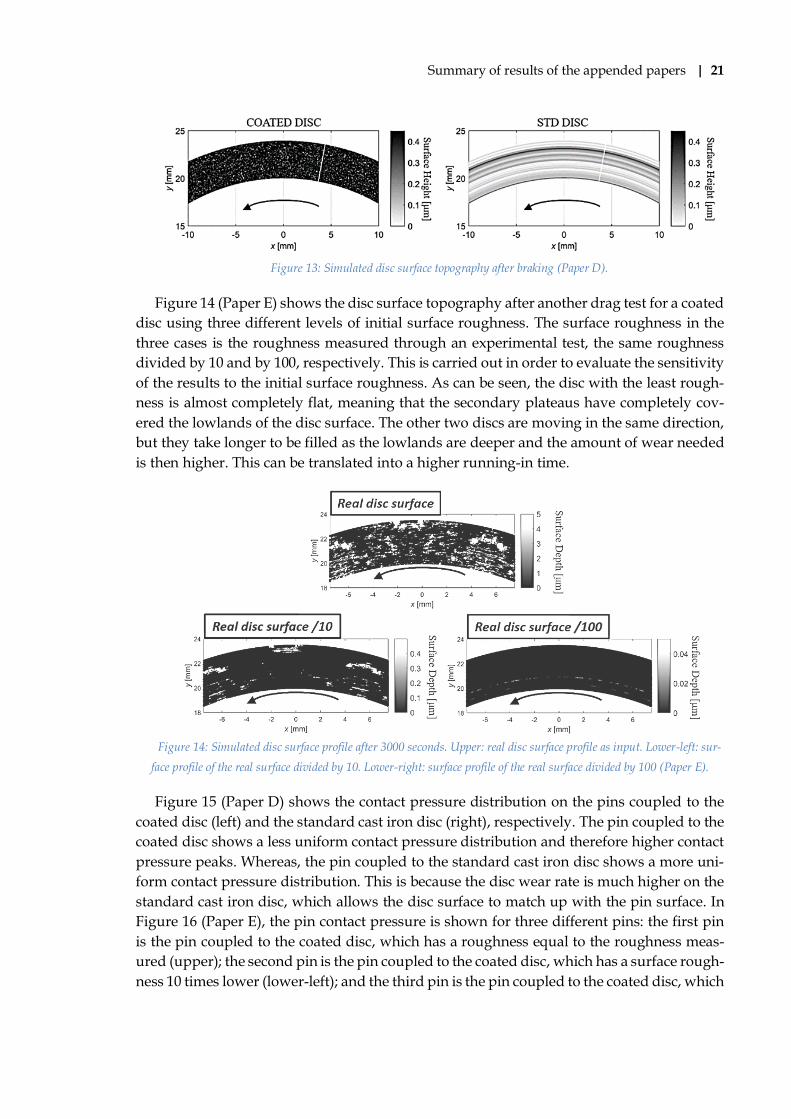
Figure 13 (Paper D) shows the simulated disc surface topography after a drag test for a
coated disc (left) and a standard cast iron disc (right), respectively. The coated disc still
shows a non-uniform surface topography after the simulated test. This is the combination
of two effects: first, the very low specific wear rate given by the coating to the disc surface
does not allow the surface to wear and become smoother; second, the secondary plateau
formation in the lowlands of the disc surface is not enough to fill all of the gaps. Instead, the
standard cast iron disc shows a band topography with a different surface height at different
radii. This is explained by the surface wear, which also significantly reduces the lowlands
of the disc surface and then the deposition of the secondary plateau itself. Consequently, the
secondary plateaus on the disc surface are actually much higher on the coated disc, which
still has more gaps to fill.
Summary of results of the appended papers | 21
Figure 13: Simulated disc surface topography after braking (Paper D).
Figure 14 (Paper E) shows the disc surface topography after another drag test for a coated
disc using three different levels of initial surface roughness. The surface roughness in the
three cases is the roughness measured through an experimental test, the same roughness
divided by 10 and by 100, respectively. This is carried out in order to evaluate the sensitivity
of the results to the initial surface roughness. As can be seen, the disc with the least rough-
ness is almost completely flat, meaning that the secondary plateaus have completely cov-
ered the lowlands of the disc surface. The other two discs are moving in the same direction,
but they take longer to be filled as the lowlands are deeper and the amount of wear needed
is then higher. This can be translated into a higher running-in time.
Figure 14: Simulated disc surface profile after 3000 seconds. Upper: real disc surface profile as input. Lower-left: sur-
face profile of the real surface divided by 10. Lower-right: surface profile of the real surface divided by 100 (Paper E).
Figure 15 (Paper D) shows the contact pressure distribution on the pins coupled to the
coated disc (left) and the standard cast iron disc (right), respectively. The pin coupled to the
coated disc shows a less uniform contact pressure distribution and therefore higher contact
pressure peaks. Whereas, the pin coupled to the standard cast iron disc shows a more uni-
form contact pressure distribution. This is because the disc wear rate is much higher on the
standard cast iron disc, which allows the disc surface to match up with the pin surface. In
Figure 16 (Paper E), the pin contact pressure is shown for three different pins: the first pin
is the pin coupled to the coated disc, which has a roughness equal to the roughness meas-
ured (upper); the second pin is the pin coupled to the coated disc, which has a surface rough-
ness 10 times lower (lower-left); and the third pin is the pin coupled to the coated disc, which

Summary of results of the appended papers | 22
has a surface roughness 100 times lower (lower-right). The contact pressure is proportional
to the roughness: the higher the roughness, the higher the peaks of contact pressure, and the
contact pressure itself is less uniformly distributed.
Figure 15: Contact pressure on the pin surfaces. On the left the pin coupled to the coated disc; on the right the pin
coupled to the standard cast iron disc (Paper D).
Figure 16: Simulated contact pressure distribution after 3000 seconds. Upper: real disc surface profile as input.
Lower-left: surface profile of the real surface divided by 10. Lower-right: surface profile of the real surface divided by 100
(Paper E).
Summary of results of the appended papers | 23
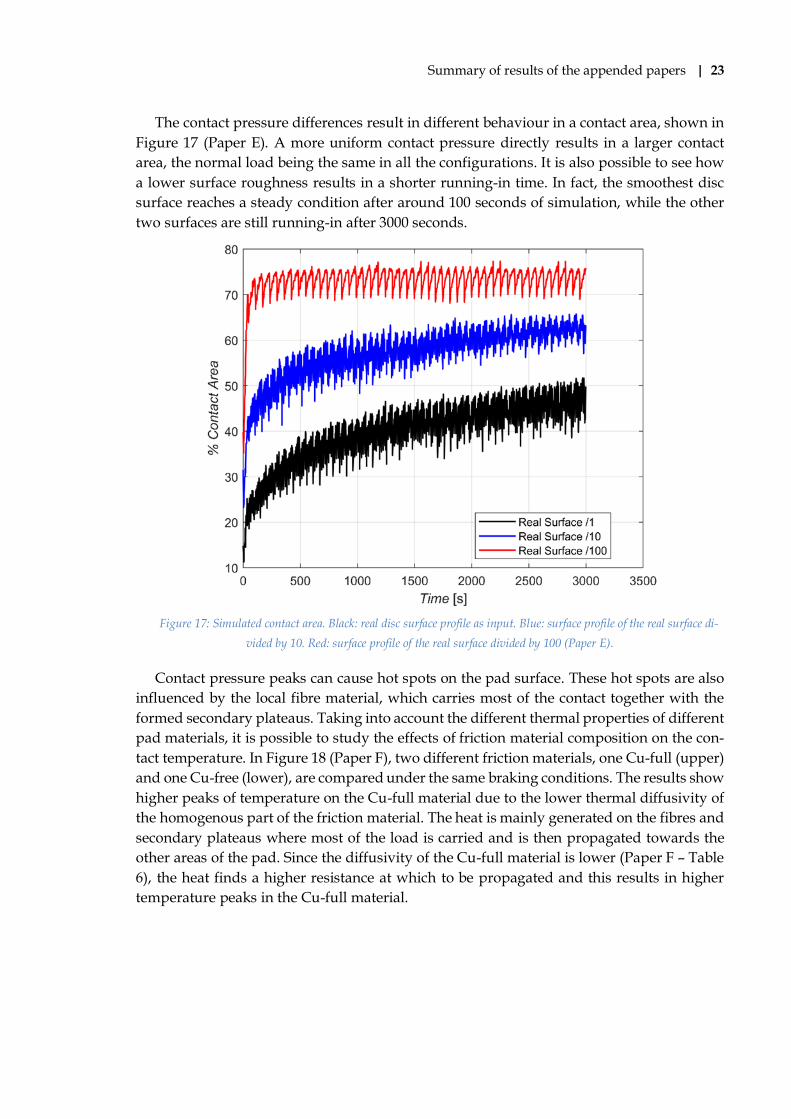
The contact pressure differences result in different behaviour in a contact area, shown in
Figure 17 (Paper E). A more uniform contact pressure directly results in a larger contact
area, the normal load being the same in all the configurations. It is also possible to see how
a lower surface roughness results in a shorter running-in time. In fact, the smoothest disc
surface reaches a steady condition after around 100 seconds of simulation, while the other
two surfaces are still running-in after 3000 seconds.
Figure 17: Simulated contact area. Black: real disc surface profile as input. Blue: surface profile of the real surface di-
vided by 10. Red: surface profile of the real surface divided by 100 (Paper E).
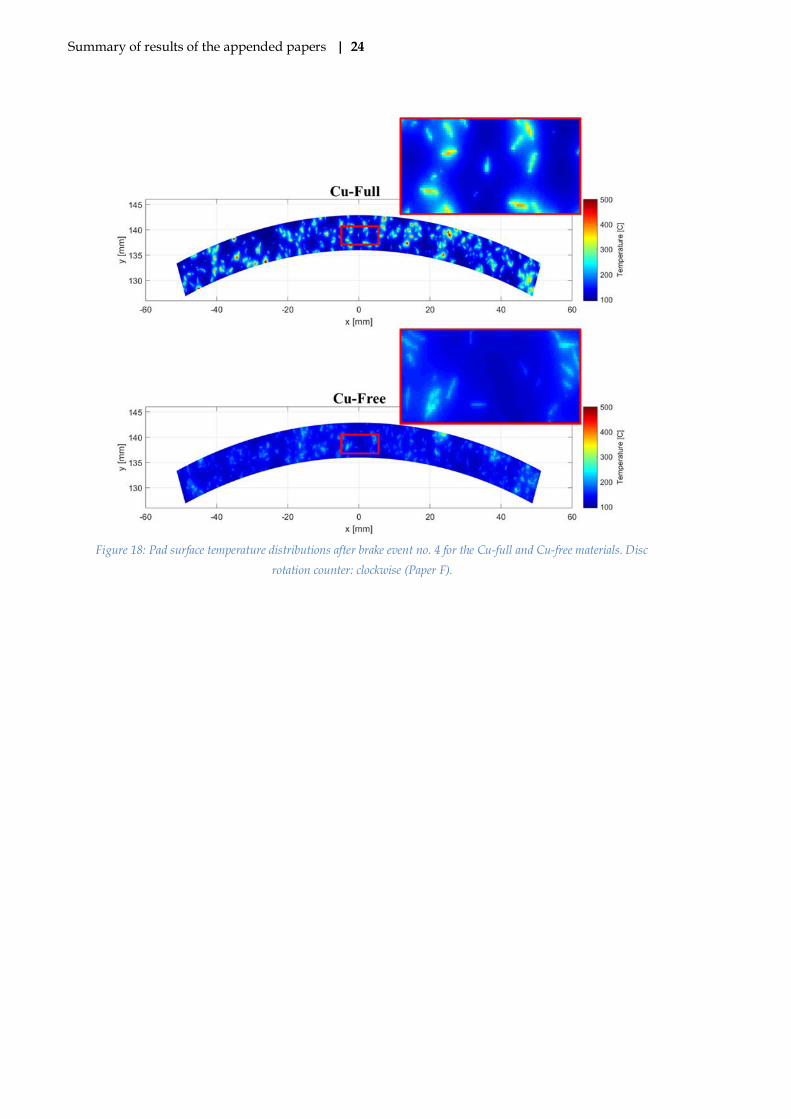
Contact pressure peaks can cause hot spots on the pad surface. These hot spots are also
influenced by the local fibre material, which carries most of the contact together with the
formed secondary plateaus. Taking into account the different thermal properties of different
pad materials, it is possible to study the effects of friction material composition on the con-
tact temperature. In Figure 18 (Paper F), two different friction materials, one Cu-full (upper)
and one Cu-free (lower), are compared under the same braking conditions. The results show
higher peaks of temperature on the Cu-full material due to the lower thermal diffusivity of
the homogenous part of the friction material. The heat is mainly generated on the fibres and
secondary plateaus where most of the load is carried and is then propagated towards the
other areas of the pad. Since the diffusivity of the Cu-full material is lower (Paper F – Table
6), the heat finds a higher resistance at which to be propagated and this results in higher
temperature peaks in the Cu-full material.
Summary of results of the appended papers | 24
Figure 18: Pad surface temperature distributions after brake event no. 4 for the Cu-full and Cu-free materials. Disc
rotation counter: clockwise (Paper F).
Discussion, conclusions and future work | 25
5. Discussion, conclusions and future work
5.1 Discussion
The results shown in section 4 are a summary of the main outcomes of the simulation
procedure developed during this PhD. These results are discussed below according to the
research questions presented in sub-section 1.2.
5.1.1 RQ1
How can the sliding contacts in disc brakes be simulated on different size scales to study tribolog-
ical effects and airborne emissions?
The sliding contacts in disc brakes can be simulated by dividing the phenomena into two
main groups: macro-scale phenomena, in which the characteristic length is in the order of
the brake system size (mm), and meso-scale phenomena, in which the characteristic length
is in the order of µm, typical of the single components of friction material. Thus, the macro-
scale results focus on the entire brake system and are mainly obtained using an FEA. The
meso-scale results mainly focus on the friction and disc surface and composition, and are
obtained using a CA approach. Moreover, the results of airborne particle investigation in
the POD chamber have been also shown at the beginning. These results are useful for sup-
porting an FEA in particle emission computation. The two different scale simulation ap-
proaches are interdependent and can be coupled, as explained in section 3. The results from
the FEA in terms of pressure distribution and the results from the thermal CFD analysis in
terms of pad temperature distribution can be used as boundary conditions in the CA anal-
ysis to study the mesoscopic contact conditions in a real operational brake system environ-
ment.
5.1.2 RQ2
Can simulations be used to explain system phenomena observed during experiments?
The macro results from the FE simulations can be used to describe three main physical
phenomena: wear (Figure 10 – Paper B), particle emissions (Figure 11 – Paper B) and friction
coefficient (Figure 12 – Paper C). The computed wear provides a description of how the disc
and pad surfaces are modified during braking and how the contact situation changes from
one braking to another. Particle emissions are a consequence of wear, since wear debris can
be released into the environment, forming an aerosol with the air. These particles can prop-
agate in the environment and can be harmful to human health. The third main phenomenon
identified is the friction coefficient developed in the sliding pad-to-disc contact that deter-
mines the brake system’s performance. The study of the COF allows some phenomena to be
investigated such as the in-stop increase or decrease in the COF. All these phenomena de-
pend on the local pad-to-disc contact conditions. In the FEA, these local conditions are taken
into account using as input wear, particle emission rate and friction maps (see sub-section
3.1).

Discussion, conclusions and future work | 26
In the literature ([32] and [34]), a similar FEA has been used to simulate wear and air-
borne emissions, simplifying the model without considering the calliper. This method is
adopted to reduce the required computational effort. This method could work if the brake
system being considered has quite a uniform contact pressure and the calliper does not in-
fluence the way in which the pads press against the disc. Introducing the calliper, instead,
allows this effect to be considered and also a comparison to be made of the geometries of
different brake systems and their impact on wear and emissions. Valota et al. [33] introduced
the calliper in a similar model, without considering the contact condition dependence of the
local contact pressure and sliding velocity. Again, this does not allow a full comparison of
two different brake systems to be made using different materials because the wear depend-
ence of the contact pressure and sliding velocity is only considered in Archard’s wear law
(Eq. 1) in terms of the pressure and the sliding distance, but not implicitly in the specific
wear rate.
The increase in the COF is visible in Figure 12 and is usually verified during the running-
in process of every single braking sequence. The decrease in the COF can be explained by
considering the temperature effects on the friction material, which can result in fading con-
ditions in the friction material itself and then a decrease in the COF. This can be compared
to what is shown in [30]. A similar increase in the COF is seen at the beginning of the brak-
ing. Following this, in [30] it is possible to see a stabilization of the COF. This can be ex-
plained by considering the energy of the applied braking, since higher energy braking re-
sults in a shorter running-in time. In the experimental results it is possible to see a decrease
in the COF. This can be explained by the fact that the temperature continues to increase and
some fading effects can cause a decrease in the COF. By evaluating the local COF on the pad
surface, it is possible to identify the area in which the COF is higher. Consequently, the
higher power that is generated results in a higher temperature and therefore possible fading
effects. Extending the methodology and the COF map (Paper C) to also consider the tem-
perature variable would allow these phenomena to be better represented in the simulation
model. The extension of the methodology to include temperature can be carried out by de-
veloping a dynamic FE model in which the heat is generated directly at the interface accord-
ing to the local COF obtained by extended maps. Although this model could achieve more
accurate results in terms of COF estimation, it has to be considered that during an urban
traffic cycle, which is the most common way of using a brake system, high temperatures
occur just on the friction material and disc. The heat generation is usually not sufficient to
heat up all the other components (e.g. calliper body), where it can be considered reasonable
to neglect the thermo-elastic effects during a city traffic load cycle. Instead, the thermo-elas-
tic effects on the entire brake system can be important when studying high energy braking
load cycles. Also, dynamics and instabilities should be taken into account if the focus is on
NVH phenomena. It is important to note that the COF computation approach developed
here can be directly transferred to different FEA that focus on thermo-elastic effects and/or
NVH phenomena.
Macro phenomena are also correlated with the mesoscale phenomena discussed in Paper
D, Paper E and Paper F. Wear on the mesoscale is computed in the same way as wear on the
Discussion, conclusions and future work | 27
macroscale and it affects the surface topography (Figure 13 and Figure 14). The plateau dy-
namics, together with the wear, also affect the surface topography on the mesoscale. The
higher formation of secondary plateaus on the surface of the coated disc [57] can be ex-
plained by the low specific wear rate resulting from the coating. Due to very low specific
wear, the coated disc does not significantly modify its surface, keeping the lowlands on
which the secondary plateaus can be formed (Figure 13). However, the standard cast iron
disc surface wears, becomes more uniform and does not allow the secondary plateaus to
deposit consistently. Also, the roughness of the coated disc surface results in different sur-
face topographies after testing (Figure 14) that modify the pressure distributions (Figure 15)
and the different contact area levels (Figure 17). The different levels of roughness result in a
different COF [58]: lower disc roughness shows a higher COF. Taking into account the nano-
sized thick tribofilm [59] formed between the contact surfaces, the COF is lower at higher
pressure, since it is easier for this third layer to shear, as discussed by Österle et al. [60]. In
this way, the results of the work on contact pressure and contact area presented in this thesis
could be used to explain the influence of disc surface roughness level on the COF. The COF
could also be investigated by considering the influence of every single component of the
friction material, as was the case in Paper F for the local contact temperature. In fact, the
local friction coefficient together with the local thermal properties of a specific material, and
the local pressure and sliding velocity conditions, could influence the local temperature dis-
tribution. The local contact temperature (Paper F – Figure 18) can then influence all the pre-
viously described phenomena, since all the variables involved are temperature dependent.
Then, if the mechanical properties are known as a function of temperature, the thermo-elas-
tic effects can also be taken into account. The single components of friction material and the
disc surface can be subjected to thermal expansion and/or thermal softening, modifying the
contact situation. Due to different stiffness values at different temperatures, the gaps be-
tween the surfaces can change affecting the development of secondary plateaus. Moreover,
softening of fibre and secondary plateau stiffness at high temperatures could result in more
uniform pressure distribution. In turn, this more uniform pressure distribution could influ-
ence the contact temperature distribution itself (Figure 18). In addition, the heat partition
between disc and pads could be also affected by the temperature and the status of the con-
tact bodies. Here, for the sake of simplicity, the formula proposed by Vernotte [61], which
considers the surfaces and the thermal properties of the two components in contact, has
been used. Extending Vernotte’s approach, the temperature of the surfaces in contact and a
contact resistance that simulates the third layer can also be considered. This heat partition
choice can influence the surface contact temperature and, consequently, all the phenomena
described above [62]. Taking all these effects into account could help identify, for example,
where fading effects occur and how the single components of friction material influence
them or explain high local wear.
Discussion, conclusions and future work | 28
5.1.3 RQ3
Can simulations be used to predict the tribological and airborne emission performance of disc
brakes?
The simulation results have been compared with the experimental results to investigate
the validity of the simulation. The validity of the simulation approach can allow future pre-
dictions of the tribological and airborne performance.
Starting from the entire brake system results from the FEA, Table 2 reports the experi-
mental and simulation mass lost during an LACT cycle for both pads and disc (rotor). It
should be noted that in the test, the mass lost has been computed by weighing the compo-
nents both before and after five repetitions of the test, while in the simulation, one test was
performed and the mass lost has been multiplied by a factor of five. The total simulated
wear appears to be fully in line with the experimental wear measured, even if the pad wear
has been overestimated and the disc wear underestimated. Figure 11 and Table 3 show the
comparison between measured and simulated emissions. The breaking emissions in the his-
togram comparison and the sum of the group of emissions reported in Table 3 suggest that
the simulation results are qualitatively in line with the experimental measures. Figure 12
shows the comparison of the COF between the experimental and the simulation results. The
simulated COF appears to be fully aligned with the experimental COF regarding the devel-
opment during a single braking, representing the in-stop increase in COF for every simu-
lated braking event. However, there is a positive offset of the simulated COF which is not
constant for every braking event.
Regarding the mesoscopic results of the CA simulation, there is no explicit validation of
the results of this work, although there are some comparisons with experimental results
from the literature. The comparison of a standard cast iron disc and a coated disc surface
simulated in Paper D appears to be qualitatively in line with the POD experiments per-
formed by Lyu et al. [57]. As mentioned in sub-sub-section 5.1.2, the disc surface of the
standard cast iron disc is smoother and has circumferential bands, while the coated disc
surface appears to be less uniform. The same applies to the pins, in which the pin coupled
to the standard cast iron disc has a more uniform surface compared to the pin coupled to
the coated disc, which can be translated into the higher contact pressure distribution of the
second pin shown in Figure 15. Also, the influence of the surface roughness (Paper E) on the
coated disc presented in this thesis is qualitatively in line with what has been presented by
Federici et al. [58]. Lower surface roughness results in a higher COF, which can be consid-
ered to be in line with the higher contact area of Figure 17, as mentioned in sub-sub-section
5.1.2. In general, we can say that the results from the CA appear to be qualitatively in line
with the experimental results and move in the same direction. However, more comprehen-
sive tests are needed in the future. As mentioned in 3 (Figure 5), the idea is to validate the
CA results directly using full scale dyno tests.

Discussion, conclusions and future work | 29
5.1.4 RQ4
How can the developed simulation methodology impact the sustainable development goals?
In 2015, world leaders agreed to identify 17 common goals [2] focusing on the future
order to create a more sustainable world for everyone. Every strategy and/or research pro-
ject should take into account these goals. Below is an explanation of how this work can im-
pact some of these goals.
The first goal affected by the present work is SDG3: “Good health and well-being”. The
specific target in focus is 3.9: “By 2030, substantially reduce the number of deaths and ill-
nesses from hazardous chemicals and air, water and soil pollution and contamination.” As
described in the introduction, urban air quality is affected by particle emissions. Brakes are
one of the main causes of non-exhaust particle emissions. Particle emissions are affected by
all the contact phenomena. Thus, a methodology to simulate these phenomena could help
to better understand particle emissions, develop brake systems with particle emission stand-
ards, and then move forwards towards improving air quality.
The second goal affected by the present work is SDG9: “Industry, innovation and infra-
structure”. The specific target in focus is 9.5: “Enhance scientific research, upgrade the tech-
nological capabilities of industrial sectors in all countries, in particular developing countries,
including, by 2030, encouraging innovation and substantially increasing the number of re-
search and development workers per 1 million people and public and private research and
development spending”. The aim of this work is to investigate and predict brake system
performance affected by contact phenomena in order to innovate brake system technology.
At the same time, the phenomena object of this study are still not 100% clear. Thus, further
research on this topic could improve the understanding of sliding contact physics.
The third and final goal affected by the present work is SDG11: “Sustainable cities and
communities”. The specific target in focus is 11.6: “By 2030, reduce the adverse per capita
environmental impact of cities, including by paying special attention to air quality and mu-
nicipal and other waste management”. This is related to the first target discussed here. Brake
system emissions primarily affect urban air quality. Thus, studying these phenomena can
reduce the environmental impact in cities in terms of higher air quality.
5.2 Conclusions
A simulation procedure comprising different simulation scales and different analyses has
been developed to study the friction material, disc and tribological and emission perfor-
mance of the entire brake system. Two main approaches have been used: an FEA, which
focuses on macro-scale phenomena, and a CA simulation, which focuses on meso-scale phe-
nomena. These two main simulation approaches have not only been shown to simulate the
phenomena of different scales but have also been combined together to establish an overall
simulation procedure. This new proposed methodology is capable of studying the main
contact phenomena such as wear, particle emissions, COF, surface topography and plateau
Discussion, conclusions and future work | 30
dynamics, local contact pressure, real contact area and local contact temperature. The simu-
lation results have also been compared with the experimental results to evaluate the validity
of the proposed approach. A results comparison suggests that the approach is promising
and can be useful for studying and predicting brake performance in the very early design
phase, and for studying friction material before its final formulation has been produced. The
answers to the research questions are summarized below.
RQ1 How can the sliding contacts in disc brakes be simulated on different size scales to study
tribology and airborne emission?
The sliding contact in disc brakes can be simulated using an FEA to evaluate the
macro performance of the brake system and a CA approach to investigate the meso
performance of the friction material. Brake system wear, emissions and COF perfor-
mance can be evaluated using an FEA approach that starts from the local character-
ization of the friction material-to-disc contact. The local characterization is intended
to be a map of specific wear rate, specific emission rate and a COF as a function of
local pressure and sliding velocity conditions, respectively. These maps that de-
scribe the local conditions are obtained through POD tests. The pad-to-disc local
contact behaviour in terms of surface topography evolution, secondary plateau dy-
namics, local contact pressure, local contact area and fibre material influence on the
local contact temperature can be evaluated using a CA approach. This approach can
be also integrated into a multi-scale simulation procedure, in which the macro-scale
results can be used as boundary conditions.
RQ2 Can simulations be used to explain system phenomena observed during experiments?
The developed simulation procedure can explain phenomena observed during ex-
periments. Non-uniform wear can be studied by analysing the wear distribution
from the FEA analysis, as well as the dependency of the emissions on the braking
conditions. The increase in the in-stop COF can also be studied through the FEA
analysis. The different running-in times starting from the different disc surfaces, in
terms of coated or standard cast iron and in terms of surface roughness, can be ex-
plained using the CA. Phenomena affecting the performance of a disc-pad pair, such
as fading effects, can be evaluated by analysing the local contact pressure and the
local contact temperature distribution. How the local temperature distribution is af-
fected by the fibre materials can also be taken into account.
RQ3 Can simulations be used to predict the tribological and airborne emission performance of disc
brakes?
The simulation can be used to predict the tribological and airborne emission perfor-
mance of disc brakes. FEA results have been directly compared with dyno bench
results in which the entire brake system has been tested. The comparison shows a
qualitatively good correlation for wear, emissions and COF. The performance of the
brake system can then be predicted if the material characterization from the POD is
available. In such cases, no tests of the entire brake system would be needed a priori
to run the simulation. Some comparisons between CA simulation and POD tests
Discussion, conclusions and future work | 31
show a qualitative correlation. Using the presented methodology, the influence of
the fibre materials on the contact temperature can already be predicted. Other types
of performance, depending on the composition of the friction material can be pre-
dicted if a characterization of the single components is made. In general, notwith-
standing the good correlation shown, more tests are needed to confirm the reliability
of the results and to use the methodology as a virtual validation tool.
RQ4 How can the developed simulation methodology impact the sustainable development goals?
The developed methodology mainly affects three sustainable development goals.
The first goal affected is SDG3, since the study of particle emissions can help im-
prove the air quality and, consequently, the health of people and animals. The sec-
ond goal affected is SDG9, since this work studies the physics of contact phenomena
that are still not clear, and support the development of innovative brake systems.
The last main goal to be affected is SDG11, which is related to the first goal here
mentioned. Brake emissions mainly affect the air quality in urban areas, thus, if
greener brake systems are produced, they will contribute to developing more sus-
tainable cities.
5.3 Future challenges
The results of this PhD work may be interesting to both the scientific community and to
industrial partners. The research group has several future steps in mind, which can be de-
scribed as follows:
- Implement test procedures to characterize the friction material as described in sub-
section 3.1 to also include temperature as a variable in addition to contact pressure
and sliding velocity. The FEA can then also be extended to take into account the brake
system temperature computation. This could enable better investigation of the phe-
nomena, e.g. in-stop temperature increase and fading effects.
- In the CA simulation, some single components of the friction mixture have been mod-
elled in order to consider their influence on the contact temperature. The thermo-
mechanical properties of single materials could also be taken into account in the con-
tact model. Some nano-tribometer tests could then be performed to evaluate the
thermo-mechanical properties of these single components. In this way, the thermo-
mechanical effects on the local pressure and temperature distribution can be consid-
ered.
- In the CA simulation, the COF computation could be implemented to identify the
contribution of every single component of the friction material mixture. To achieve
this, a friction characterization of the single components must be carried out. In this
respect, tests on tribometer (POD, mini-dyno or nano-tribometer) must be designed
and performed. In this way, different friction materials can be compared in terms of
their friction performance before their final formulation is realized.
Discussion, conclusions and future work | 32
- The same approach in the previous bullet point can be used for wear, identifying the
contribution made by the single components of the friction material being modelled.
This would enable a comparison to be made of the wear performance of the different
friction materials before their final formulation is realized.
- The third layer influence on tribological and emission performance must be further
investigated, e.g. using simulation techniques such as movable cellular automaton
(MCA) and molecular dynamics (MD).
- All the simulation approaches developed can be combined to realize an out-of-the-
box tool ready for use.
Bibliography | 33
6. Bibliography
[1] Ambient air pollution: A global assessment of exposure and burden of disease. World Health Organization (2016).
[2] https://www.un.org/development/desa/disabilities/envision2030.html [3] OECD. Health at a Glance 2017: OECD Indicators [Internet]. OECD Publishing, 2017,
p. 210. [4] GBD 2015 Risk Factor mental and occupational, and metabolic risks or clusters of risks
1990–2015: a systematic analysis for the Global Burden of Disease Study 2015.rs Col-laborators. Global, regional, and national comparative risk assessment of 79 behav-ioural, enviro. Lancet (London, England) [Internet]. 2016;388(10053):1659–724.EEA, “The European environment – state and outlook 2010, 2011”.
[5] IARC, 2013. [6] F Karaguliana, C A Belisd, C Francisco, C Dorab, A M Prüss-Ustünb, S Bonjourb, H
Adair-Rohanib, M Amannc. Contributions to cities' ambient particulate matter (PM): A systematic review of local source contributions at global level. Atmospheric Envi-ronment November 2015, Vol. 120, 475–483.
[7] P A Kassomenosa, S Vardoulakisb, A Chaloulakouc, A K Paschalidoua, G Grivasc, R Borged, J Lumbrerasd. Study of PM10 and PM2.5 levels in three European cities: Anal-ysis of intra and inter urban variations. Atmospheric Environment April 2014, 87, 153–163.
[8] F Amato. Non-Exhaust Emissions: An Urban Air Quality Problem for Public Health. San Diego: Academic Press ELSEVIER 2018; 342.
[9] T Grigoratos, T Martini G. Brake wear particle emissions: a review. Environ Sci Pollut Res 2015; 22:2491–504.
[10] M Müller, G P Ostermeyer. Cellular automata method for macroscopic surface and friction dynamics in brake systems. Tribol. Int. 2007, 40, 942–952.
[11] M Müller,G P Ostermeyer. A cellular automaton model to describe the three-dimen-sional friction and wear mechanism of brake systems. Wear 2007, 263, 1175–1188.
[12] J Wahlström, A Söderberg, U Olofsson. A cellular automaton approach to numerically simulate the contact situation in disc brakes. Tribol. Lett. 2011, 42, 253–262.
[13] B C Goo. A study on the contact pressure and thermo-elastic behavior of a brake disc-pad by infrared images and finite element analysis. Appl. Sci. 2018, 8, 1639.
[14] P Dufrénoy, M Naıt-Abdelaziz. Third body influence on thermal friction contact prob-lems: Application to braking. J. Tribol. 2005, 127, 89–95.
[15] K Bode, G P Ostermeyer. A comprehensive approach for the simulation of heat and heat-induced phenomena in friction materials. Wear 2014, 311, 47–56.
[16] J Wahlström, Y Lyu, V Matjeka, A Söderberg. A pin-on-disc tribometer study of disc brake contact pairs with respect to wear and airborne particle emission. Wear 2017; 384-385: 124–130.
[17] J Glisovic, R Radonjic, M Babic, D Miloradovic, D Cati. Design of vehicle road testing method for determination of brake pad friction characteristics. Tribological Associa-tion Vol. 17, No 4, 513–525 (2011).
[18] A J Martyr, M A Plint. Engine Testing (Fourth Edition) 2012, Pages 451–482, Chapter 17 – Chassis or Rolling-Road Dynamometers.
Bibliography | 34
[19] A Grkić, R Slavko Muzdeka, S Perić, V D Cedomir. Application of an inertia dyna-
mometer to check braking performance against theoretical predictions. 6th Interna-tional Heavy Vehicle Seminar, At Christchurch, New Zealand, July 1996, doi: 10.13140/RG.2.1.4132.8081
[20] G Perricone, J Wahlström, U Olofsson. Towards a test stand for standardized meas-urements of the brake emissions. Proceedings of the Institution of Mechanical Engi-neers. Part D, Journal of Automobile Engineering 2016; vol. 230, no. 11, pp. 1521–1528.
[21] https://webmagazine.unitn.it/evento/dii/56846/inaugurazione-sub-scale-dyno-brembo.
[22] J Wahlström, V Matějka, Y Lyu, A Söderberg. Contact Pressure and Sliding Velocity Maps of the Friction, Wear and Emission from a Low-Metallic/Cast-Iron Disc Brake Contact Pair. Tribology in Industry 2017; Vol. 39, No. 4, 460–470.
[23] W Österle, H Kloss, I Urban, A I Dmitriev. 2007. Towards a better understanding of brake friction materials. Wear, 263 (7–12), 1189–1201.
[24] W Österle, A I Dmitriev, H Kloß. Possible impacts of third body nanostructure on fric-tion performance during dry sliding determined by computer simulation based on the method of movable cellular automata, Trib. Int. 2012, 48, 128–136.
[25] W Österle, A I Dmitriev. Functionality of conventional brake friction materials – Per-ceptions from findings observed at different length scales, Wear 2011, 271, 2198–2207.
[26] M Müller, G P Ostermeyer. A cellular automaton model to describe the three- dimen-sional friction and wear mechanism of brake systems. Wear 2007, 263 (7–12), 1175–1188.
[27] G P Ostermeyer, J H Merlis. Modelling the friction boundary layer of an entire brake pad with an abstract cellular automaton. Lubricants 2018, 6 (2), art. no. 44.
[28] J Wahlström, A Söderberg, U Olofsson. A cellular automaton approach to simulate the contact situation between the pad and disc in disc brakes. Tribology Letters 2011, 42, 253–262.
[29] J Wahlström. Towards a cellular automaton to simulate friction, wear, and particle emission of disc brakes. Wear 2014, 313, 75–82.
[30] J Wahlström. A comparison of measured and simulated friction, wear, and particle emission of disc brakes. Tribology International 2015, 92, 503–511.
[31] J Wahlström. A Factorial Design to Numerically Study the Effects of Brake Pad Prop-erties on Friction and Wear Emissions. Advances in Tribology 2016. Vol. 2016, Article ID 8181260.
[32] A Söderberg, U Sellgren, S Andersson. Using finite element analysis to predict the brake pressure needed for the effective rotor cleaning in disc brakes. SAE International 2008.
[33] G Valota, S De Luca, A Söderberg. Using a finite element analysis to simulate the wear in disc brakes during a dyno bench test cycle. Eurobrake 2017: EB2017-SVM-003.
[34] J Wahlström, A Söderberg, U Olofsson. Simulation of airborne wear particles from disc brakes. SAE Technical Paper 2009-01-3040.
[35] A R AbuBakar, H Ouyangb. Wear prediction of friction material and brake squeal us-ing the finite element method. Wear 2008; 264, 1069–1076.
[36] J Han, C H Lee, T W Park, J M Park, S M Son. Coupled Thermo-Mechanical Analysis and Shape Optimization For Reducing Uneven Wear Of Brake Pads. Myeong. Inter-national Journal of Automotive Technology 2017; Vol. 18, No. 6, pp. 1027−1035.

Bibliography | 35
[37] A Schmidt, T Schmidt, O Grabherr, D Bartel. Transient wear simulation based on three-dimensional finite element analysis for a dry running tilted shaft-bushing bear-ing. Wear 2018; 408–409, 171–179.
[38] Y Sun, Y Guo, W Zhai. Prediction of rail non-uniform wear – Influence of track ran-dom irregularity. Wear 2019; 420–421, 235–244.
[39] Y Hacisalihoglu, B Dalga, D Akca, E Ergin, B Aydin. Brake cooling modelling & cor-relation. In Proceedings of the Eurobrake Conference, Dresden, Germany, 21–23 May 2019; EB2019-SVM-031.
[40] A Thuresson. CFD and Design Analysis of Brake Disc. Master’s Thesis, Chalmers Uni-versity of Technology, Göteborg, Sweden, 2014.
[41] A Belhocine, C D Cho, M Nouby, Y B Yi, A Bakar, A Rahim. Thermal analysis of both ventilated and full disc brake rotors with frictional heat generation. Appl. Comput. Mech. 2014, 8, 5–24.
[42] A Afzal, M A Mujeebu. Thermo-mechanical and structural performances of automo-bile disc brakes: A review of numerical and experimental studies. Arch. Comput. Methods Eng. 2018, 1–15.
[43] J P Pompon. The brake disc handbook. 2nd ed. Brembo S.p.A., 1998. [44] H P Khairnar, V M Phalle, S Mantha. Comparative Frictional Analysis of Automobile
Drum and Disc Brakes. Tribology in Industry Vol. 38, No. 1 (2016) 11–23. [45] D Patel Sahil, V Shah Amit, C Gosai Dipak. Use of Disc Brake in E-Car: A Review.
IJSTE, International Journal of Science Technology & Engineering, Volume 3, Issue 05, November 2016.
[46] D Chan, G W Stachowiak. Review of automotive brake friction materials. Proc. Inst. Mech. Eng. Part D J. Automob. Eng., 2004, 218, 953–966, doi:10.1243/0954407041856773.
[47] https://www.plm.automation.siemens.com/global/it/products/simcenter/STAR-CCM.html
[48] Information about Abaqus available at: https://www.3ds.com/products-ser-vices/simulia/products/abaqus/.
[49] J F Archard. Contact and rubbing of flat surfaces. J Appl Phys 1953; 24:981–8. [50] S B Pope. Turbulent Flows; 7th Printing 2010 (first edition 2000); Cambridge Univer-
sity Press: Cambridge, UK, 2010; pp. 369–385. [51] R Bernatz. Fourier Series and Numerical Methods for Partial Differential Equations,
1st ed.; Wiley: New York, NY, USA, 2010; Chapters 7–9. [52] M Eriksson, J Lord, S Jacobson. Wear and contact conditions of brake pads: dynamical
in situ studies of pad on glass, Wear 2001, vol. 249, iss. 3–4, pp. 272–278, doi: 10.1016/S0043-1648(01)00573-7.
[53] A Söderberg, S Björklund. Validation of a simplified numerical contact model. Tribol. Int. 2008, 41, 926–933, doi:10.1016/j.triboint.2008.02.013.
[54] A Söderberg, U Sellgren, S Andersson. Using finite element analysis to predict the brake pressure needed for the effective rotor cleaning in disc brakes. SAE Int 2008 01-2565.
[55] J Wahlström, A Söderberg, U Olofsson. Simulation of airborne wear particles from disc brakes. SAE Technical Paper 2009-01-3040.
[56] G Valota G, S De Luca, A Söderberg. Using a finite element analysis to simulate the wear in disc brakes during a dyno bench test cycle. Eurobrake 2017. EB2017-SVM-003.
[57] Y Lyu., J Wahlström, V Matejka, A Söderberg. Ranking of conventional and novel disc brake materials with respect to airborne particle emissions. EB2017-MDS-012.

Bibliography | 36
[58] M Federici, C Menapace, A Moscatelli, S Gialanella, G Straffelini. Effect of roughness
on the wear behavior of HVOF coatings dry sliding against a friction material, Wear, vol. 368–369, pp. 326–334, 2016, doi: 10.1016/j.wear.2016.10.013.
[59] W Österle, I Urban. Friction layers and friction films on PMC brake pads, Wear, vol. 257, iss. 1–2, pp. 215–226, 2004, doi: 10.1016/j.wear.2003.12.017.
[60] W Österle, I Urban. Third body formation on brake pads and rotors, Tribol Int, vol. 39, iss. 5, pp. 401–408, 2006, doi: 10.1016/j.triboint.2005.04.021.
[61] P Vernotte. Thermocinétique Générale. Publications Scientifiques et Technique du Mi-nisteère de L’Air (379); 1961.
[62] A Yevtushenko, P Grzes. Finite element analysis of heat partition in a pad/disc brake system. Numer Heat Transf, Part A: Appl: Int J Comput Methodol 2011;59:521–42.