a methodology to estimate bicyclists’ acceleration and...
TRANSCRIPT

Figliozzi, Wheeler, and Monsere 1
A Methodology to Estimate Bicyclists’ Acceleration and Speed Distributions at Signalized Intersections
*Miguel Figliozzi Associate Professor
Portland State University
Nikki Wheeler Civil Engineer I
Massachusetts DOT
Christopher Monsere Associate Professor
Portland State University
*Corresponding Author [email protected]
Portland State University Civil and Environmental Engineering
PO Box 751 Portland, OR 97207-0751
Submitted for publication in the Journal of the Transportation Research Board
Revised March 15, 2013
Number of words: 5,083 + 5 Figures + 5 Tables = 7,583

Figliozzi, Wheeler, and Monsere 2
ABSTRACT As cities across North America install infrastructure to accommodate a growing number and variety of bicyclists, installation of bicycle-specific traffic signals is a common design element. A recent survey showed a lack of consistency in design and timing. In particular, minimum green signal timing is highly dependent on the assumed acceleration and speed performance of bicyclists, but no detailed methodology exists to estimate these performance values. However, recent American Association of State Highway and Transportation Officials (AASHTO), Caltrans and National Association of City Transportation Officials (NACTO) documents require that an adequate clearance interval shall be provided, and that in determining this minimum interval field investigation of bicyclists’ speeds is recommended. Furthermore, even if detailed video trajectories are available, the determination of a value for field speed and acceleration is not trivial because values of speeds and accelerations are a function of time and individual bicyclist performance. The purpose of this research is to develop and apply a general methodology to estimate bicyclists’ acceleration and speed for traffic signal timing applications. Utilizing physical equations of motion, this research analytically derives expressions that can be used to classify an individual bicyclist’s performance as a function of the observed acceleration profile. The analysis indicates that four basic acceleration profiles are possible and the profiles can be obtained using a parsimonious field-data collection method. The methodology is successfully applied to two intersections in Portland, OR. A detailed statistical analysis shows that the results are intuitive and that the methodology successfully categorizes bicyclists’ performance variations due to topography or demographic characteristics. Keywords: bicycle performance, speed, acceleration, green time

Figliozzi, Wheeler, and Monsere 3
INTRODUCTION Many cities in North America are making significant investments in bicycling infrastructure to improve cycling conditions. This is, in part, motivated by research that indicates that in order to grow bicycle ridership, facilities should be designed to accommodate all riders, particularly those demographic groups that may not otherwise choose to cycle in the typical urban setting because riding is a stressful experience (1). A majority of bicycle-vehicle crashes in urban areas occur at intersections (2). Thus, traffic signal timing plays a significant role in making cycling a safe and attractive option for city travel. Because urban intersections must accommodate motor vehicles, pedestrians and cyclists, and the performance of these users varies between and within groups, the setting of many timing parameters is a delicate balance. If movements are separated by users (e.g., a bicycle-specific phase) it becomes important to have field-observed performance values for safety and efficiency. For example, unnecessarily long minimum green times to accommodate cyclists can lead to excessive delays and increased emissions from motor vehicles. On the other hand, inadequately short bicycle-specific minimum green times can create stressful, uncomfortable and even unsafe bicycle environments (3). Because there may be performance differences among cycling demographics, it is possible that only strong or high-performance riders may have the acceleration/speed necessary to clear an intersection safely in situations where clearance and green time may be minimal. However, a user who requires more time to cross comfortably (such as a child or older cyclist) may be caught midway through an intersection when opposing traffic receives a green. This situation is not only unsafe, but also can be a deterrent to bicycling as a viable alternative. To adequately meet the needs of bicycle riders and other intersection users, it is vital to understand the performance of bicycle riders. Extensive literature and professional experience describes operational strategies and design issues of traffic signals for motorized vehicles and pedestrians. In contrast, the literature and engineering experience for bicycle-specific signal design is newer and relatively scarce. A recent survey (4) indicates a lack of consistency across North American cities regarding bicycle signal design, detection and timing parameters. In particular, the survey found a wide range of assumed bicycle speeds (from 2.2 to 18.7 feet per second) across bike signals in North American cities. A relatively wide range of published cyclist performance data (perception-reaction times, rolling speed and accelerations) can guide the selection of basic signal parameters such as minimum green, yellow and all-red clearance intervals, and extension times. The new AASHTO (5), Caltrans (6) and NACTO (7) documents require that an adequate clearance interval shall be provided and that in determining this minimum interval, field investigation of bicyclists’ speeds is recommended. The guide suggests intervals sufficient for 15th percentile speeds should be used. Absent field data, the guides suggest that a value of approximately 15 feet/second may be used as a default speed. AASTHO (5) also recommends that extended crossing times should be given to some types of riders (e.g., young riders near schools, section 4.12.4, page 4-44). While the guidance documents (5-7) recommend field-obtained values and 15th percentile speeds, there is no consistent methodology to determine field speeds or acceleration. Furthermore, as later discussed in this research, the determination of field bicyclists’ acceleration and cruising speed is not a trivial exercise. In the literature, there is no comprehensive mathematical framework to estimate bicycle riders’ acceleration and cruising speeds at intersections.

Figliozzi, Wheeler, and Monsere 4
The purpose and main contribution of this research is to develop and apply a general mathematical framework to estimate bicyclists’ acceleration and cruising speed for traffic signal timing applications to data that can be extracted from a simple video data-collection procedure. Since the simultaneous estimation of acceleration and cruising speed values is not trivial, the methodology contained in this paper can be used to estimate acceleration and cruising speed distributions in intersections with unique or special characteristics.
By analyzing physical equations of motion, this research analytically derives expressions that can be used to classify an individual bicyclist’s performance as a function of the observed acceleration profile. In turn, the acceleration profile can be used to classify the individual bicyclist’s performance at an intersection and the performance of different demographics and acceleration/speed distributions. Finally, recommended minimum green times obtained from current guidance documents are compared to field estimations using 85th percentile crossing times.
LITERATURE REVIEW The recently released 2012 AASHTO Guide for the Development of Bicycle Facilities provides a revised treatment of the information that relates bicyclists’ types and minimum green crossing time. The three classes of cyclists (A, B and C) presented in the 1999 guide have been replaced by two new classes named “Experienced and Confident” and “Casual and Less Confident” (5). The new guide presents timing issues separately for standing and rolling bicyclists. For stopped bicyclists, the guide presents the equations to determine the minimum green required for a cyclist to start from stop and clear the intersection width. Both acceleration and crossing speeds must be known to estimate minimum green crossing times. For a bicycle starting from a stopped position, the default acceleration value is 1.5 feet/second2; the default rolling speed is 10 mph or 14.7 feet/second. For rolling cyclists, the guide also presents an equation for determining the rolling crossing time. A cyclist who enters the intersection just at the end of green should have sufficient time to clear the intersection during the yellow change and all-red clearance intervals. The rolling time is presented as the sum of the braking distance, intersection width, and length of bicycle divided by the assumed rolling speed (suggested as 10 mph or 14.7 feet/second). The new AASHTO guide states that “the yellow interval is based on the approach speeds of automobiles, and therefore, should not be adjusted to accommodate bicycles” (pp 4-46). The guide suggests modifying the all-red time, or if that is insufficient, to provide for extension time using a dedicated bicycle detector and controller settings to add sufficient time to clear the intersection. A speed of approximately 10 mph (14.7 feet/second) is now cited in the latest bicycle design guides AASHTO (5), Caltrans (6) and NACTO (7) as an assumed rolling speed. The NACTO guide requires that an “adequate clearance interval (i.e., the movement’s combined time for the yellow and all-red phases) shall be provided to ensure that bicyclists entering the intersection during the green phase have sufficient time to safely clear the intersection before conflicting movements receive a green indication.” In determining this minimum interval, field investigation of bicyclists’ speed is recommended. The guide suggests intervals sufficient for 15th percentile speeds should be used. Absent field data, the NACTO guide suggests that “14 feet per second (9.5 miles per hour) may be used as a default speed.” The AASHTO guide provides a formula to estimate minimum green for bicycles from a standing position:

Figliozzi, Wheeler, and Monsere 5
2
where: BMG = Bicycle minimum green interval (sec) PRT = Perception and reaction time, 1 (sec) Y = Length of yellow interval (sec) Rclear = Length all red clearance interval (sec) W = Intersection width (feet) L = Typical bicycle length = 6 (feet) a = Bicycle acceleration = 1.5 (feet/sec2) V = Bicycle crossing speed = 14.7 (feet/sec)
The California Manual on Uniform Traffic Control Devices (6) provides detection guidance and provisions on the minimum timing parameters. The manual states that “for all phases, the sum of the minimum green, plus the yellow change interval, plus any red clearance interval should be sufficient to allow a bicyclist riding a bicycle 6 feet long to clear the last conflicting lane at a speed of 10 mph (14.7 ft/s) plus an additional effective start-up time of six seconds”, according the formula:
6 sec6
14.7 /
where: Gmin = Length of minimum green interval (sec) Y = Length of yellow interval (sec) Rclear = Length of red clearance interval (sec) W = Distance from limit line to far side of last conflicting lane (feet)
The AASHTO and California formulas estimate similar numbers, with the default AASHTO values of perception-reaction (1 second), speed (14.7 feet/second), and acceleration (1.5 feet/second2), the first two terms of the AASHTO equation (1) are approximately six seconds.
6 . Empirical evidence indicates a wide range of acceleration and speed performance may need to be accommodated based on individual locations (8-11). Most published studies have used different measurement techniques to derive these values. Wachtel et al. (8), one of the first studies about bicyclists’ minimum green time, highlights that the most common signal timing issue related to vehicle-bicycle collisions: that of a cyclist hit after lawfully entering an intersection on a yellow phase by a motorist on the intersecting street restarting or accelerating into the intersection upon receiving a green phase. In this situation, the clearance time is not sufficient for a cyclist at cruising speed to travel safely across the intersection. Another signal timing issue can occur at the start of a green phase at an actuated signal. If the signal provides only a minimum green time designed for motor vehicles (a result of low vehicle demand), the green time may not be long enough to accommodate the time needed for cyclists to react,

Figliozzi, Wheeler, and Monsere 6
accelerate and traverse the intersection, especially at wide intersections and/or in situations where multiple cyclists have formed a queue. A handful of studies has measured average speeds and accelerations and compared them to the guidance documents. Pein measured the average speed and approximated the acceleration of cyclists on multiuse paths and at three-leg intersections (9). Rubins and Handy measured intersection clearance times for cyclists in Davis, CA., from stopped, slowed and rolling positions across a wide age range (10). A study conducted in Portland, OR., found statistically significant performance differences between male and female bicyclists’ and when comparing flat and uphill intersections (11). A Federal Highway Administration (FHWA) report investigated trail users, collecting data from active and passive study participants using skateboards, kick scooters, tandem cycles, manual and power wheelchairs, electric bicycles, inline skates and hand cycles, among several other emerging trail user types (12). When studying the cyclist group, the study found that after an initial increase in the acceleration rate, the rate decreases with increasing speed—counter to the AASHTO equation, which assumes a constant acceleration (5). More recently, researchers used video-image and processing software to extract each cyclist’s trajectory through the intersection (13-14). The trajectories were synchronized to signal phases and were used to determine start-up time and cruising speed through intersections. The study presented evidence that performance varies by intersection population; at a location populated mainly by recreational cyclists and families, speeds were found to be slower than a location largely made up of commuting college students. Bicyclists’ demographics do affect performance (11, 15, 16). Research by Navin found that young males achieve higher speeds than average when climbing on a grade (15). A U.K. study found no statistically significant difference between male and female speeds on flat roadways, but significantly lower speeds (for females) riding uphill roadways (17).
THE ACCELERATION AND SPEED DETERMINATION PROBLEM The determination of field bicyclists’ acceleration and speed is recommended by the guidance documents (4-6) as well as by using 15th percentile speeds. However, no methodology to determine field speeds or acceleration is provided. It should be noted that automated methods to extract object trajectories from video data are possible (18), though not widely available. Even if detailed video trajectories are available, the determination of a value for field speed and acceleration is not trivial because values of speeds and accelerations are a function of time and individual bicyclist performance. For example, starting from a standing position initial speed is zero and it takes a time to reach cruising speed. The change of speed is, in turn, a function of the acceleration from time zero (the time when bicyclists’ movement is imminent) to the time . As expected from physics and real observations, the value of acceleration is not a constant but tends to decrease as speed increases (11). Hence, many potential acceleration values can be observed in a second-by-second trajectory analysis. To compare against guidance acceleration and speed values a consistent methodology is necessary, one derived from fundamental physics equations of motion, to obtain representative average acceleration and speed values. It is not trivial to obtain representative average acceleration and speed values. For an individual bicyclist, it is possible to observe the time to cover a given distance from a standing position. If the goal is to obtain an average acceleration, denoted and a cruising speed
, assuming constant acceleration, the time to reach cruising speed is and the distance traveled is equal to .
avc tc vc / a
dc 1/ 2a(tc)2 (vc )2 / 2a

Figliozzi, Wheeler, and Monsere 7
The time elapsed up to the first observations is equal to:
Replacing and into :
In equation two values are known from measurement ( , and two unknowns, and . Hence, the problem is indeterminate. It is not possible to estimate both values simultaneously. This indetermination can be broken by taking another observation. In addition to ( , it is possible to obtain a second pair of observations timing the cyclists’ time to cover a given distance from a standing position and starting at time/distance ( , . Without loss of generality, let’s assume that and . Using the observations ( , and ( , , it is possible to have four different acceleration profiles based on the point at which each bicycle rider has finished accelerating (i.e., the cyclist has reached a cruising speed). These cases are described as follows:
Case 1: The cyclist reaches cruising speed within, at or before reaching the time/distance ( , .
Case 2: The cyclist reaches cruising speed after ( , but before reaching ( , . Case 3: The cyclist reaches cruising speed after ( , . Case 4: The cyclist does not have a non-decreasing speed profile.
To simplify the notation and expressions, the prime symbol is introduced to denote the differences. For example, the partial time/distance between observation 1 and 2 are denoted: Similarly, the partial time/distance between observation 0 and 1 are denoted:
Determining Case 1
t1 tc (t1 tc ) tc (d1 dc ) / vc (1)
vc t ca dc (vc)2 / 2a (1)
t1 vc
a
d1 (vc)2 / 2a
vc
t1 vc
2a
d1
vc
(2)
(2) vc a

Figliozzi, Wheeler, and Monsere 8
The cyclist reaches cruising speed within, at or before reaching the time/distance ( , ; hence, it is possible to solve the indeterminacy because the second period is travelled at a cruising speed:
Replacing into we obtain the value of :
,
Given that accelerations cannot be negative, Case 1 holds when this obvious inequality is valid:
Determining Case 2 The cyclist reaches cruising speed after ( , but before reaching ( , ; hence, in Case 2 we can estimate the acceleration in the first period:
However, and are still unknown. In this case, is reached in the time interval and equation must be written as:
Expressing equation as a 2nd order equation:
Replacing, we obtain:
To obtain real roots, the term inside the square root must be positive:
vc (d2 d1) /(t2 t1) d2' / t2' (3)
(3) (2) a
t1 d2'
2at2'
d1t2'
d2'
a d2'
2t2' (t1 d1
d2'
t2' )(4)
tc vc / a
d2'
d1
t2'
t1
a 2d1
(t1)2 (5)
tc vc vc [t1, t2 ](2)
t2 vc
2a
d2
vc
(6)
(6)
(vc )2
2a t2vc d2 0
vc at2 (at2 )2 2ad2 (7)

Figliozzi, Wheeler, and Monsere 9
From the analysis of equation only one root may be feasible. This root is infeasible:
This is proved because the cruising speed must satisfy (i.e., in Case 2 the cruising speed is assumed to be reached in the time interval ). For the only potentially feasible root (see expression ), the feasibility constraint indicates that the cruising speed is reached in the time interval as shown in expression .
Determining Case 3 For Case 3, the cyclist reaches cruising speed after ( , . Hence, we may have two average accelerations in each period, and :
From we know that:
From we obtain:
Since , a feasibility constraint is that:
, The distance traveled in the interval must be larger than the distance that would be traveled if the speed at time is maintained (i.e., if ). If this condition does not hold, the bicyclist is decreasing speed (i.e., 0), and the speed profile is no longer a non-decreasing function of time. This is not what is usually expected from a cyclist crossing an intersection
(at2 )2 2ad2 0
t22 2d2 / a
(7)
vc at2 (at2 )2 2ad2 (8)
vc at2
[t1, t2 ](9)
[t1, t2 ] (10)
vc at2 (at2 )2 2ad2 (9)
t1a vc t2a (10)
a1 a2
d1 1/ 2a(t1)2 (11)
d2' v1t2' a2 (t2' )
2
2(12)
(11)
a1 2d1
(t1)2(13)
(12)
a2 2(d2' a1t1t2' )
(t2' )2
a2 0
d2' 2a1t1t2' d2' v1t2' (14)
[t1, t2 ]t1 a2 0

Figliozzi, Wheeler, and Monsere 10
from a standing position; a bicylist’s intuitive behavior would be to break to reach a standing position. This latter case naturally brings up the final case.
Determining Case 4 From a standing position, Cases 1 to 3 have assumed a positive acceleration until the cyclist eventually reaches cruising speed, (i.e., the speed profile is non-decreasing). However, in Case 4 the cyclist does not have a non-decreasing speed profile and does not fit any of the previous cases. For example, the cyclist may accelerate to a maximum speed and then decelerate to a final cruising speed.
Determining Acceleration and Speed Distributions Utilizing two time/distance measurements and the formulas presented in this section, it is possible to classify a bicyclist’s performance case, acceleration and cruising speed value. This framework is applied to two intersections in Portland utilizing data previously collected (11). Each bicycle crossing time is allocated to an acceleration case, and then average acceleration and cruising speed values are calculated for each bicycle rider. By aggregating individual rider performance values, it is possible to put together distribution functions of average acceleration and cruising speeds. These distributions can be used to calculate average and 15th percentile values. Finally, it should be noted that the speed and acceleration distributions are a function of the intersection width and the chosen values for (d1,d2). For the sake of consistency this research has utilized d1 = d2 in all the case studies and calculations. Field data description, results and insights are provided in the following sections.
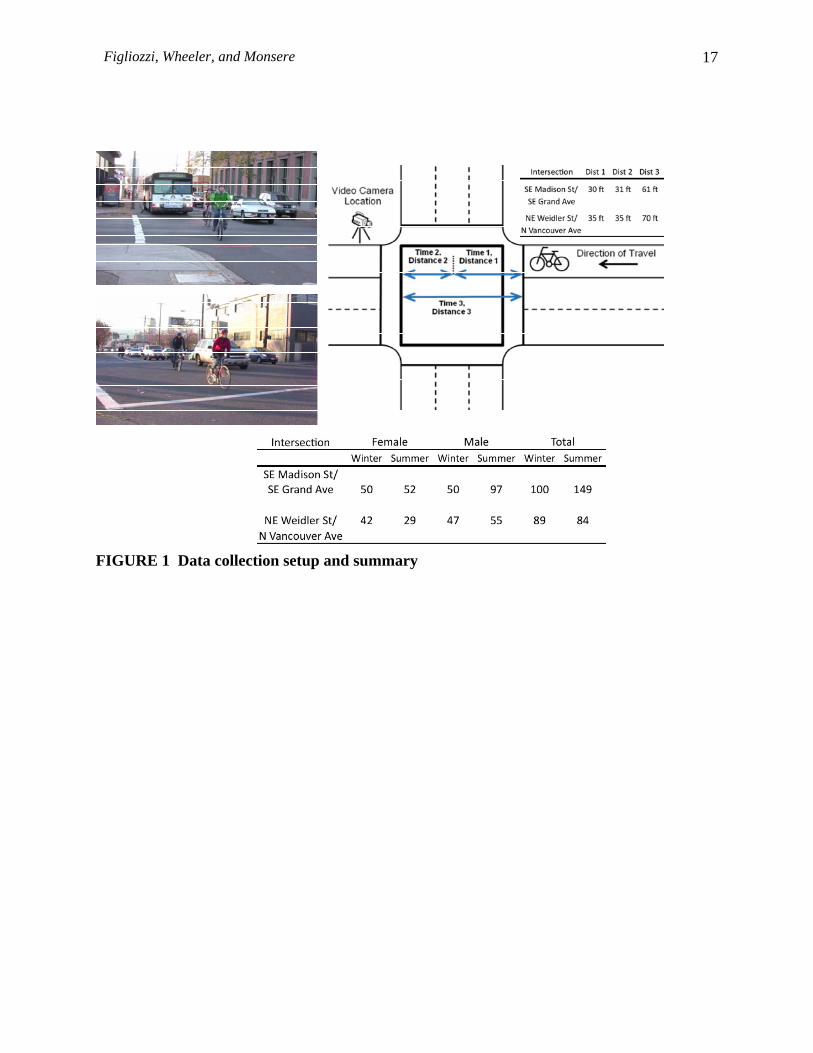
CASE STUDY DESCRIPTION This case study includes two intersections. Data have been collected during the winter and summer, and these particular intersections were chosen because they are located along popular commute routes and had good pavement conditions at the time of data collection. The first investigation, referred to hereafter as the “flat” intersection study, is the intersection of Southeast Madison Street and Grand Avenue in Portland. Crossing-time data were collected for cyclists traveling on Madison Street westbound and crossing Grand Avenue. Because the intersection of Madison Street and Grand Avenue is located along a popular morning commute route, data collection took place during the expected peak hours of 7 and 10:30 a.m.. The second investigation, referred to hereafter as the “grade” intersection study, was the intersection of Northeast Weidler Street and North Vancouver Avenue in Portland. Crossing time data were collected for cyclists traveling uphill on Weidler Street eastbound and crossing Vancouver Avenue. This intersection is located along a popular commute route leaving downtown Portland, so the collection period coincided with the expected afternoon peak hour period between 3 and 6:30 p.m. Crossing-time data were obtained using video footage of the data collection. For each intersection, a video camera was located at the far side of the intersection (relative to the direction of bike traffic), on the sidewalk adjacent to the bike lane. This provided a view of the cyclists approaching the intersection, stopping at the near side of the intersection on a red light, and traveling through the intersection on a green light. Figure 1 shows the view from the video camera at each intersection and a diagram of the field setup: Clockwise from top left is the video camera perspective for the level intersection study on Madison Street; field setup diagram with intersection distance measurements; summary

Figliozzi, Wheeler, and Monsere 11
of cyclists by group; and video camera perspective for the grade intersection on Weidler Street facing west. For consistency, researchers collected data only from the cyclists who: 1) came to a complete stop at the intersection; 2) stopped at the first crosswalk line and were the first cyclists in a queue; and 3) who had at least one foot on the ground. This allowed researchers to capture the reaction and start-up time required for a cyclist from the same reference point, and eliminated cyclists balancing on their bike before receiving a green. Perception and reaction time is not included in the following measurements.
Each intersection was divided into two sections: a painted pavement line midway through the intersection separating distances 1 and 2 (d1’ and d2’ using the notation in the previous section). Distance 3 = d1’ + d2’ refers to the entire intersection and is the sum of the previous two. During each data collection, two data collectors were present to film and collect rider and bicycle characteristics.
Figure 2 and Figure 3 present the total crossing time (d1’ + d2’) distributions using the same scale to facilitate comparisons. As shown in the figures, the crossing times are skewed towards the left. Both the flat and grade intersections show a long “tail” of cyclists falling to the right, who had longer than average crossing times. It can be easily observed that the flat intersection has shorter crossing times and less spread/standard deviation than the grade intersection.
STATISTICAL ANALYSIS OF ACCELERATION AND RIDERS’ PERFORMANCE
and Table 2 show results from the statistical analysis of crossing times at the flat and grade intersections, respectively. Comparisons were made using the unpaired T-test and non-central T-test and studied the female and male demographics.
The comparison of gender groups at the flat intersection (see Table 1) shows that the mean and 85th percentile crossing times were statistically significantly different, with females having a longer crossing time at a significance level greater than 99% only in the second interval. Bolded italic values indicate > 99% significance.
The comparison of gender groups at the grade intersection (shown in Table 2) shows that the mean and 85th percentile crossing times t1’, t2’ and t1’ + t2’ were found to be statistically significantly different, with females having a longer crossing time at a significance level greater than 99.9%. These results suggest that males tend to achieve higher acceleration/speeds on grades, which is consistent with previous results in the literature.
Results seem to indicate that males tend to go faster in the second period in the flat intersection and in both periods in the grade intersection. The interpretation of the differences between groups is facilitated when the acceleration cases developed in Section 3 are applied. The results are shown in Table 3. At the flat intersection, males have a greater tendency to keep increasing their speed in the second half of the intersection (more Case 2 and 3 types). As expected, both groups at the grade intersection require more time to reach cruising speeds. At the flat intersection, both groups tend to achieve a cruising speed in the second part or even after the intersection. The chi-square tests indicate that there is a significant difference (>99%) between the distribution of acceleration cases at the flat and grade intersection (Case 4 observations are zero and were not included in the chi-square test).
At the flat intersection, the majority of cyclists reach cruising speed in the first half of the intersection (Case 1), with few cyclists in Case 2 and even fewer in Case 3. However, at the grade intersection most cyclists are identified as Case 1, but in comparison to the flat intersection

Figliozzi, Wheeler, and Monsere 12
a greater percentage of cyclists are still accelerating through the second half of the intersection. This means that the grade must impact riders in such a way that cyclists continue to accelerate over a longer distance on a grade. Figures 4 and 5 present histograms of accelerations for the flat and grade intersection studies. It is clear that the values of the acceleration at the flat intersection are significantly higher than those at the flat intersection. Tables 4 and 5 show that at the flat intersection there is no statistically significant difference between male and female cyclist mean and 15th percentile acceleration for both study periods. However, the mean cruising velocities show a statistically significant difference (with 99.9 percent significance) in both study periods; male cyclists achieve greater speed in comparison to female cyclists. As indicated previously, this suggests that although the rate of acceleration is not significantly different, male cyclists continue to accelerate for a longer period of time than female cyclists, reaching a greater cruising speed. This is consistent with the finding of acceleration case distributions discussed previously, where a greater percentage of male cyclists were identified as Case 2 and 3 at the flat intersection, reaching cruising speed in the second half of the intersection or beyond. At the grade intersection, there are statistically significant differences, with male cyclists achieving greater acceleration. This seems to verify a physical impact of the hill on acceleration and cruising speed, which is evident when looking at performance by gender.
DISCUSSION Current AASHTO (4) and CALTRANS (5) guidelines recommend field measurements or an acceleration of 1.5 feet/second2 and a bicycle cruising speed of 14.7 feet/second. It is worth mentioning that a recent survey found that the timing plans for some bicycle-specific signals the assumed speed was 18.7 feet/second (4). In the Portland case, the application of the AASHTO and CALTRANS guidelines result in 10.6 seconds and 11.2 seconds for the flat and grade intersection, respectively. The flat intersection has a W = 61 feet and the grade intersection a W = 70 feet. The field measurement of the 85th percentile of crossing times indicates that these values are 6.4 seconds and 7.8 seconds, respectively, for the flat and grade intersection. If one second for perception and reaction time is added (as suggested by AASHTO), then the crossing time is estimated as 7.4 and 8.8 seconds, respectively (see figures 2 and 3). A comparison of the acceleration and speed values from Table 5 and the existing guidelines indicate that the biggest difference is found in the value of acceleration (higher in the field) and that speeds in the field are actually less than 14.7 feet/second for riders starting from the stopped position. The application of an assumed speed of 14.7 feet/second (higher than the field-observed 15th percentile of 13 feet/second) over a wider intersection also helps to reduce the difference between calculated and field minimum green crossing times. The existing guidelines are 3.2 seconds and 2.4 seconds of green time longer for the flat and grade intersections, respectively. In percentages, the existing guidelines are adding 30 percent and 21 percent of crossing times when compared to the 85th percentile for flat and grade intersections, respectively. AASHTO’s recommended values are closer to the 98th percentile, but they are still higher than the observed 98th percentile. In addition, it is worth mentioning that adequate yellow and all-red time is also very critical to ensure the safety of bicyclists who start to cross the intersection as the signal turns yellow. In the Portland case, longer green times are not an issue since these intersections have a high volume of cyclists. It is also clear that the engineer should provide signal times that are

Figliozzi, Wheeler, and Monsere 13
appropriate under less favorable (weather, bicycle queuing, etc.) conditions. On the other hand, in some cases these additional times can have a significant accumulated impact on vehicle delays, fuel consumption and emissions if the green time is provided on a minor crossing (with no pedestrian crossing request) and the red is extended for the main congested arterial. The methodology proposed in this paper can be used to estimate field distributions of acceleration and cruising speeds and to justify longer crossing times when a special type of rider needs special accommodation (e.g., young riders near schools). It is always good practice to add room for additional safety by using lower-than-AASHTO-suggested acceleration or crossing speed. However, it is recommended that the additional safety is justified by using field estimations of acceleration and speed distributions, especially if safer and more comfortable bicycle traffic signal designs generate high costs in delays, fuel consumption and emissions.
CONCLUSIONS This paper demonstrated how field-collected observations from a basic video setup can be used to successfully estimate design acceleration and speed values using equations of motion. It is shown that it is not trivial to obtain distributions of cyclists’ acceleration and speed distributions. The proposed analytical procedure allows for further statistical analysis of cyclist acceleration and cruising speed performance by demographic group and intersection grade (if these data are collected), or to justify longer crossing times when a special type of rider needs special accommodation (e.g., young riders near schools or older riders near a retirement home). Findings from the statistical analysis are intuitive and consistent with the expected performance of bicycle riders by gender and intersection grade. The existing policy guidelines (AASHTO, Caltrans and NACTO) require that an adequate clearance interval be provided and that in determining this minimum interval, field investigation of bicyclists’ speeds is recommended. Clearly, as other work has shown, the performance values derived for a particular intersection crossing location depend on intersection location, the type of cyclist, and the time of the data collection. Traffic engineers should be cognizant of this issue when deploying data collection equipment and reducing data for analysis. In particular, field estimations of acceleration and speed distributions should be provided if bicycle traffic signal designs that exceed AASHTO-recommended values result in high costs in terms of delays, fuel consumption and emissions.
ACKNOWLEDGEMENTS The authors gratefully acknowledge the Oregon Transportation, Research and Education Consortium (OTREC), the Oregon Department of Transportation and the FHWA for sponsoring different parts of this research. Ryan Conrad provided assistance with data collection and analysis of the crossing time data for the initial study (11). Any errors or omissions are the sole responsibility of the authors.

Figliozzi, Wheeler, and Monsere 14
REFERENCES 1. Pucher, J., and R. Buehler. Cycling for a Few or for Everyone: The Importance of Social
Justice in Cycling Policy. World Transport Policy & Practice, Vol. 15, No. 1, 2009, pp. 57-64.
2. Hunter, W. W., J. C. Stutts, W. E. Pein, and C. L. Cox. Pedestrian and Bicycle Crash Types of The Early 1990’s. FHWA Report RD-95-163, 1996.
3. Mekuria, M., Furth, P, Nixon, H., Low-Stress Bicycling and Network Connectivity, Mineta Transportation Institute, Final Report 11-19. 2011.
4. Thompson, S.R., Monsere, C., Figliozzi, M. Koonce, P. Obery. G.,Bicycle Specific Signals: Results from a State of the Practice Survey in North America, paper 13-0536, Proceedings TRB Annual Meeting, January 2013
5. AASHTO. Guide for the Development of Bicycle Facilities. American Association of State Highway and Transportation Officials, U.S. Department of Transportation, Washington, D.C. 5th ed., 2012.
6. State of California Department of Transportation. California Manual on Uniform Traffic Control Devices. State of California Department of Transportation; 2010.
7. NACTO, National Association of City Transportation Officials, Urban Bikeway Design Guide, 2011, http://www.c4cguide.org/
8. Wachtel, A., J. Forester, and D. Pelz. Signal Clearance Timing for Bicyclists. ITE Journal, Vol. 65, No. 3, 1995, pp. 38-45.
9. Pein, W. (1997). Bicyclist Performance on a Multiuse Trail. Transportation Research Record, (1578), 127-131
10. Rubins, D. I., and S. Handy. Times of Bicycle Crossings: Case Study of Davis, California. Transportation Research Record: Journal of the Transportation Research Board, Vol. 1939, Transportation Research Board of the National Academies, Washington, D.C., 2005, pp. 22–27.
11. Wheeler, N., Conrad, R., & Figliozzi, M. A. (2010). A Statistical Analysis of Bicycle Rider Performance: The Impact of Gender on Riders’ Performance at Signalized Intersections. 89th Annual Meeting of the Transportation Research Board.
12. Pein, W. Bicyclist Performance on a Multi-Use Trail. Transportation Research Record: Journal of the Transportation Research Board, Vol. 1578, Transportation Research Board of the National Academies, Washington, D.C., 1997, pp. 127–131.
13. Landis, B. W, T. A Petritsch, and H. F Huang. Characteristics of Emerging Road Users and Their Safety. FHWA-HRT-04-103. Federal Highway Administration Turner-Fairbank Highway Research Center, October 2004.
14. Shladover, S. E., Z. W. Kim, M. Cao, A. Sharafsaleh, and J. Q. Li. Bicyclist Intersection Crossing Times: Quantitative Measurements for Selecting Signal Timing. Transportation Research Record: Journal of the Transportation Research Board, Vol. 2128, Transportation Research Board of the National Academies, Washington, D.C., 2009, pp. 86-95.
15. Shladover, S. E., Z. W. Kim, M. Cao, A. Sharafsaleh, and S. Johnston. Bicyclist Intersection Crossing Times: Quantitative Measurements at Diverse Intersections. In 90th Annual Meeting of the Transportation Research Board. CD-ROM. Transportation Research Board of the National Academies, Washington, D.C., 2011.
16. Navin, F. Bicycle Traffic Flow Characteristics: Experimental Results and Comparisons. ITE Journal, Vol. 64, No. 3, 1994, pp. 31–36.
17. Parkin, J., and J. Rotheram. Design Speeds and Acceleration Characteristics of Bicycle

Figliozzi, Wheeler, and Monsere 15
Traffic, Planning, Design and Appraisal. Transport Policy, Vol. 17, 2010, pp. 335-341. 18. Zaki, M., Sayed, T., Ismail, K., Alrukaibi, F. (2012) “Identification of Pedestrians Non-
Conforming Behavior at Urban Intersections using Computer Vision”, Transportation Research Record: Journal of the Transportation Research Board, In Press, Transportation Research Board of the National Academies, Washington, D.C., 2012.

Figliozzi, Wheeler, and Monsere 16
LIST OF FIGURES Figure 1 Data collection setup and summary Figure 2 Histogram of total crossing time, flat intersection, n=249 Figure 3 Histogram of total crossing time, grade intersection, n=173 Figure 4 Histogram of accelerations, flat intersection, n=249 Figure 5 Histogram of accelerations, grade intersection, n=172
Figliozzi, Wheeler, and Monsere 17
FIGURE 1 Data collection setup and summary

Figliozzi, Wheeler, and Monsere 18
FIGURE 2 Histogram of total crossing time, flat intersection, n=249

Figliozzi, Wheeler, and Monsere 19
FIGURE 3 Histogram of total crossing time, grade intersection, n=173

Figliozzi, Wheeler, and Monsere 20
FIGURE 4 Histogram of accelerations, flat intersection, n=249

Figliozzi, Wheeler, and Monsere 21
FIGURE 5 Histogram of accelerations, grade intersection, n=172
Figliozzi, Wheeler, and Monsere 22
LIST OF TABLES Table 1 T-test between mean crossing times, and noncentral T-test between 85th percentile crossing times, flat intersection Table 2 T-test between mean crossing times, and noncentral T-test between 85th percentile crossing times, grade intersection Table 3 Acceleration case by gender (%) Table 4 Unpaired T-tests between mean acceleration and cruising speed Table 5 Noncentral T-tests on 15th percentile acceleration and cruising speed

Figliozzi, Wheeler, and Monsere 23
TABLE 1 T-test between mean crossing times, and noncentral T-test between 85th percentile crossing times, flat intersection
T-test between Mean Crossing Times (sec)
T-test between 85th Percentile Crossing Times (sec)
Fem
ale
vs M
ale
Crossing Time female male t-stat p-value female,
85th male, 85th t-stat t0.05,247 p-value
t1’ 3.71 3.61 1.41 1.61E-01 4.05 4.15 -1.43 -1.19 7.95E-02
t2’ 2.22 2.05 4.92*** 1.00E-04 2.45 2.25 5.60*** 2.34 9.58E-07
t1’ + t2’ 5.93 5.65 3.07** 2.40E-03 6.49 6.31 1.97** 0.54 1.10E-03
* Indicates > 95% significance, ** Indicates > 99% significance, *** Indicates > 99.9% significance

Figliozzi, Wheeler, and Monsere 24
TABLE 2 T-test between mean crossing times, and noncentral T-test between 85th
percentile crossing times, grade intersection
T-test between Mean Crossing Times (sec)
T-test between 85th Percentile Crossing Times (sec)
Fem
ale
vs M
ale
Crossing Time female male t-stat p-value female,
85th male, 85th t-stat t0.05,171 p-value
t1’ 4.84 4.39 4.79*** 1.00E-04 5.65 4.90 7.83*** 4.75 5.24E-06
t2’ 2.49 2.14 6.72*** 1.00E-04 2.85 2.49 6.87*** 1.82 1.53E-10
t1’ + t2’ 7.34 6.53 6.59*** 1.00E-04 8.35 7.39 7.88*** 2.95 6.06E-10
* Indicates > 95% significance, ** Indicates > 99% significance, *** Indicates > 99.9% significance

Figliozzi, Wheeler, and Monsere 25
TABLE 3 Acceleration case by gender (%)
Intersection Group Case 1 Case 2 Case 3 Case 4
Flat Female 98 2 0 0
Male 82 12 6 0
Grade Female 45 51 4 0
Male 46 44 10 0

Figliozzi, Wheeler, and Monsere 26
TABLE 4 Unpaired T-tests between mean acceleration and cruising speed Level Intersection Grade Intersection
Fem
ale
vs M
ale
Winter female male t-stat p-value female male t-stat p-value
a 4.90 5.06 0.60 5.51E-01 3.34 3.78 2.40* 1.84E-02
Vc 13.61 15.24 5.28*** 0 14.26 16.23 4.19*** 7.00E-05
Summer female male t-stat p-value female male t-stat p-value
a 5.36 6.15 1.56 1.20E-01 2.90 3.88 4.40*** 3.00E-05
Vc 13.77 14.87 3.45*** 7.40E-04 15.22 17.71 4.34*** 4.00E-05
* Indicates > 95% significance, ** Indicates > 99% significance, *** Indicates > 99.9% significance

Figliozzi, Wheeler, and Monsere 27
TABLE 5 Noncentral T-tests on 15th percentile acceleration and cruising speed Level Intersection Grade Intersection
Fem
ale
vs M
ale
Winter female,
15th male,
15th t-stat t0.05,98 p-value female,
15th male,
15th t-stat t0.05,86 p-value
a 3.76 3.35 -1.52 -0.47 2.76E-01 2.49 2.91 2.30** 1.56 9.10E-03
Vc 11.85 13.64 5.78*** 2.17 5.28E-07 12.73 13.70 2.06*** -0.48 1.80E-05
Summer female,
15th male,
15th t-stat t0.05,147 p-value female,
15th male,
15th t-stat t0.05,82 p-value
a 3.98 4.05 0.14 0.22 5.91E-02 2.00 2.94 4.22*** 1.49 1.54E-05
Vc 12.50 13.33 2.61*** 0.81 3.29E-04 12.04 14.93 5.03*** 2.37 2.73E-05
* Indicates > 95% significance, ** Indicates > 99% significance, *** Indicates > 99.9% significance