a methodology to compute roundabout corridor travel time …docs.trb.org/prp/15-1257.pdf · 1 a...
TRANSCRIPT

A Methodology to Compute Roundabout Corridor Travel Time 1 2
By 3 4
Zachary Bugg, Ph.D* 5 Kittelson & Associates, Inc.** 6
Tel: (443) 524-9413 7 Email: [email protected] 8
9
Bastian Schroeder, Ph.D, PE 10 Institute for Transportation Research and Education 11
North Carolina State University 12
Campus Box 8601 13 Raleigh, NC 27695-8601 14
Tel: (919) 515-8899 15
Email: [email protected] 16
17 Pete Jenior, PE, PTOE 18
Kittelson & Associates, Inc. 19 Tel: (410) 347-9610 20
Email: [email protected] 21
22 Marcus Brewer, PE 23
Texas A&M Transportation Institute 24
2935 Research Parkway 25 College Station, TX 77843-3135 26
Tel: (979) 845-7321 27 Email: [email protected] 28
29
Lee Rodegerdts, PE 30 Kittelson & Associates, Inc. 31
Tel: (503) 228-5230 32 Email: [email protected] 33
34 35
Submitted for publication and presentation at the 94th
Annual Meeting of the Transportation 36 Research Board, January 11-15, 2015 37
38 Word Count: 5,497 text words plus 2,000 for figures/tables (8 x 250) = 7,497 total 39
40
*Corresponding Author 41
42 ** Kittelson & Associates, Inc. 43
36 S Charles St, Suite 1920 44 Baltimore, MD 21201 45
46
Bugg, Schroeder, Jenior, Brewer, Rodegerdts 2
ABSTRACT 47 Urban and suburban arterials with roundabouts in series are becoming more prevalent in North 48 America. While the Highway Capacity Manual (HCM) currently provides a methodology for 49 computing the segment travel time of urban streets with various forms of intersection control, it 50
does not provide a similar procedure for corridors with interdependent roundabouts. This 51 methodology is necessary to evaluate roundabout corridor performance, and it allows the 52 practitioner to compare both roundabout and signalized treatments for the same series of 53 intersections. 54
This paper presents a series of models intended to predict arterial travel time for a 55
corridor with roundabouts, including a free-flow speed (FFS) model, a model to predict the 56 length of the roundabout influence area (or RIA, the area where geometric delay is incurred), a 57 model for geometric delay, and models for impeded delay and average travel speed. These 58
models were calibrated with data from seven existing roundabout corridors. The resulting models 59 suggest that while FFS is a function of segment length, posted speed limit, and central island 60 diameter, the RIA length and geometric delay are functions of the FFS itself, as well as other 61
geometric elements. The impeded delay and average travel speed are functions of traffic 62 congestion and FFS. After validating the models with travel time data from two additional 63
roundabout corridors not used in model development, the authors present a framework for 64 incorporating the travel time prediction procedure into the HCM urban streets analysis. 65
66
67
68
69
70
71
72
73
74
75
76
77
78
79
80
81

Bugg, Schroeder, Jenior, Brewer, Rodegerdts 3
INTRODUCTION 82 Traffic on urban and suburban arterials is typically signalized at major intersections, but many 83 transportation agencies are increasingly looking to roundabouts as an alternative to signalized or 84 two-way stop-controlled intersections as a safety improvement and as a means to reduce delay 85
during off-peak periods. This trend has extended to arterials with roundabouts in series, which 86 are becoming more prevalent across the United States. 87 88
Roundabout Corridor Description 89 As defined in this paper, a roundabout corridor includes a series of three or more roundabouts 90
that function interdependently on an arterial. An example is displayed in Figure 1. 91 92
93
FIGURE 1 Roundabout Corridor in Golden, Colorado. (1) 94
95 Arterials such as the one displayed in Figure 1 would normally be analyzed using the 96
urban streets facility and segment procedures explained in Chapters 16 and 17 of the Highway 97 Capacity Manual (2). However, the HCM currently only allows for the analysis of independent 98 roundabouts (Chapter 21) and does not account for their effect on corridor travel time, platoon 99
dispersion, access management, and other elements. The HCM 2010 also does not incorporate 100
the effects of closely-spaced roundabouts on arterial operational performance. 101
Research Objective 102 The objective of this research is to understand the effect of a series of roundabouts on arterial 103 performance, specifically considering the performance measures of corridor travel time and 104
percent free flow speed. The authors intend to develop a model to predict roundabout corridor 105 performance based on geometric and operational elements and construct a methodology for 106 operational performance evaluation analogous to the urban streets methodology presented in the 107 HCM. The research presented here is also contained in NCHRP Report 772: Evaluating the 108

Bugg, Schroeder, Jenior, Brewer, Rodegerdts 4
Performance of Corridors with Roundabouts (3), which is the result of NCHRP Project 03-100. 109 While this paper focuses on the model development and implementation of the methodology into 110 the HCM, the reader will be referred to NCHRP Report 772 for details on data collection, model 111 calibration, and model sensitivity analysis. 112
This paper is organized as follows: literature review, methodology, results, 113 implementation, conclusion, and references. 114
115 Literature Review 116 The transportation profession has an extensive body of knowledge for traffic operations at 117
isolated roundabouts and urban corridors with signalized intersections. Little research has been 118 published on traffic operations of roundabout corridors, but it can be principally divided into 119 safety research and operational research. Emissions, non-motorized transportation modes, 120
constructability, and corridor context are additional considerations that could provide 121 differentiating characteristics between corridor types. 122
Roundabouts have well-documented safety benefits compared to other traffic control 123
types, and these safety benefits are the predominant attractiveness of roundabouts compared to 124 signalized intersections (4, 5, 6, 7). Safety relationships of isolated roundabouts are likely to 125
transfer to roundabout corridors; there are no known specific characteristics of roundabouts in 126 series that diminish the safety performance of the roundabout itself. One key differentiating 127 consideration between corridor types may be safety at midblock access points. Opportunities to 128
use U-turns at roundabouts could potentially eliminate left turns to or from driveways along the 129 corridor, and reduced conflicts at these driveways would positively influence corridor safety. 130
Depending on the spacing of the roundabouts, segment operating speeds could be reduced 131 compared to signalized corridors and, therefore, could reduce crash severity. 132
A crash study of a half-mile roundabout corridor consisting of four roundabouts in 133 Golden, Colorado (Figure 1) indicated a steep decline in crash rates after roundabout installation 134
(8). Between 1996 and 2004, crash rates declined by 88%, from 5.9 to 0.4 crashes per million 135 vehicle miles. Injury crashes were reduced from 31 in the three years prior to installation to one 136 in the 4.5 years after—a 93% decline. Isebrands et al. (9) reviewed a corridor in Brown County, 137
Wisconsin, and found that total crashes at one of the Wisconsin roundabouts were reduced by 138 one per year, and injury crashes were nearly eliminated. 139
Roundabout corridors have unique operational characteristics compared to their 140 signalized intersection counterparts. Fundamentally, the notion of moving platoons of vehicles to 141
maximize the performance of signalized intersections is not applicable to roundabouts, where 142 gap acceptance principles allow more dispersed flows to mingle within the intersections. Travel 143 time is a natural performance measure for roundabout and signalized corridors. Roundabouts 144 have greater geometric delay compared to signalized intersections by virtue of their shape; 145
therefore, defining travel time performance measures is of paramount interest. According to 146 Akçelik (10), geometric delay is determined as a function of approach and exit cruise speeds as 147 well as negotiation speeds, which depend on the geometry of the roundabout. Akçelik added that 148
steps could be taken to approximate the value of geometric delay and add it to the control delay 149 computed by the HCM procedure. 150
The Golden, Colorado study also reviewed operating speeds, travel times, and sales tax 151 revenue along the corridor (8). The study concluded that installing the roundabouts resulted in 152 lower speeds between major intersections in the corridor, but travel times also decreased 153 compared to when the corridor was signalized, indicating a decrease in control delay. The 154

Bugg, Schroeder, Jenior, Brewer, Rodegerdts 5
analysis also revealed much less delay at business access points. While adjacent businesses are 155 often concerned about corridor reconfiguration and access management adjustments, the 156 development around the corridor flourished after installation of the roundabouts. This consisted 157 of an additional 75,000 square feet of retail/office space, resulting in a 60% increase in sales tax 158
revenue along the corridor after installation. 159
160 METHODOLOGY 161 The following sections describe the methodology used to develop the models for roundabout 162 corridor travel time, including site selection, data collection and extraction, and model 163
development (including formulation of the models and model calibration). 164 165
Data Collection and Extraction 166 At least three methods were available to develop a model framework for roundabout corridor 167
travel time: 168
Analytically, through the use of the HCM models. This would make use of the existing 169 methodology but is limited by the applicability of the current HCM methodology, given that it 170
does not support the interaction of closely-spaced roundabouts. 171
Using data from microsimulation. This technique would supply a heavy amount of data 172
but would also require extensive calibration with field data so that the output from 173 microsimulation yields realistic results. 174
Manually-collected field data. Given the presence of dozens of roundabout corridors in 175 the United States identified as part of the initial efforts of NCHRP Project 03-100, the authors 176 concluded that developing models from empirical data is the best approach. GPS devices were 177
used to collect travel time data at these sites, and the reader is referred to NCHRP Report 772 for 178
more details on the data collection procedure (3). 179
To maximize model applicability and range of the dataset, the authors selected sites for 180
data collection representing a variety of characteristics and conditions. Using these 181 considerations, nine roundabout corridors from across the United States were identified. Two of 182 these sites, both in Carmel, Indiana, were reserved for model validation. Table 1 lists each site 183
where data was collected, including the route name, geographic location, number of roundabouts 184 along the corridor, number of lanes on the arterial, number of circulating lanes in the 185 roundabouts, length of the corridor, type of area (commercial, residential, or rural), whether the 186
corridor includes a roundabout (also called raindrop) interchange, year(s) the corridor was 187 constructed, type/presence of restrictive median, and peak hour traffic volume on the arterial.188

Bugg, Schroeder, Jenior, Brewer, Rodegerdts 6
TABLE 1 Summary of Study Sites 189
Corridor Location # of
Roundabouts
Arterial
# of Lanes
Roundabout
# of Lanes
Length
(mi) Area Type
Includes
Interchange? Built Median
Peak Hour
Traffic Volume
on Arterial (vph)
MD-216 Scaggsville, MD 4 4 2 0.7 Commercial Yes 2002, 2009 Raised 1,600-2,100
La Jolla Blvd San Diego, CA 5 2 1 0.6 Commercial No 2005-2008 Raised 1,000-1,500
Borgen Blvd Gig Harbor, WA 4 4 2 1.4 Commercial/
Residential Yes 2000-2007 Varies 1,000-2,000
SR-539 Whatcom County, WA 4 4 2 3.7 Rural No 2010 Cable 800
Golden Rd Golden, CO 5 4 2 1.0 Commercial No 1998-1999,
2004 Raised with
openings 1,000-1,400
Avon Rd Avon, CO 5 4 2-3 0.5 Commercial Yes 1997 Raised with
one opening 1,300-1,800
SR-67 Malta, NY 7 2-4 1-2 1.6 Commercial/ Residential
Yes 2006-2011 Raised 600-1,200
Spring Mill Rd* Carmel, IN 7 2 1 4.5 Residential No 2005-2009 Some 1,100-1,600
Old Meridian St* Carmel, IN 4 4 2 1.3 Commercial/
Residential No 2006
Mostly
raised 500-1,200
* indicates site reserved for model validation

Bugg, Schroeder, Jenior, Brewer, Rodegerdts 7 7
During data collection, the authors identified two types of data that were crucial to the 190 development of corridor travel time models. These elements are based on characteristics used in 191
the HCM urban streets analysis procedure. The types of data are as follows: 192
1. Site-specific data 193
Roundabout geometry (Inscribed Circle Diameter, Central Island Diameter, entry and 194 exit radii) 195
Roundabout spacing 196
Presence of raised median 197
Driveway density 198
Grade 199
Posted speed limit 200
Circulating speed 201 2. Time-of-day-dependent data 202
Entering volume 203
Circulating volume 204
Volume-to-capacity ratio 205
To be consistent with the HCM urban streets procedure but also to organize the modeling 206
effort to best consider the effects on travel speed of elements within the corridor, the authors 207 proposed a new methodology to partition each corridor into a series of roundabout segments and 208 sub-segments. Essentially, the method distinguishes whether a vehicle is upstream or 209
downstream of a roundabout yield line. Figure 2 illustrates this approach; two roundabouts 210 (RBT1 and RBT2) are separated by (Urban Street) Segment B. For the purpose of analysis, 211
Segment B is divided into sub-segments B1 and B2, where B1 corresponds to the downstream 212 influence of RBT1, and B2 corresponds to the upstream influence of RBT2. The upstream sub-213
segment of RBT1 is consequently labeled A1 (portion of Segment A associated with RBT1), and 214 the downstream sub-segment of RBT labeled C2 (portion of Segment C associated with RBT2). 215

Bugg, Schroeder, Jenior, Brewer, Rodegerdts 8 8
216
FIGURE 2 Segment Definitions for Roundabout Corridor Travel Time Modeling. 217
218 The HCM Chapter 17 defines an urban street segment as the sum of the downstream and 219
upstream sub-segments of two adjacent roundabouts (e.g. B1 plus B2). Similarly, the HCM 220 Chapter 21 defines a roundabout segment as the sum of the upstream and downstream segment 221 of the same roundabout (e.g. A1 plus B1). In developing the models, the upstream and 222
downstream sub-segments are evaluated separately for two primary reasons: (1) this allows 223 aggregation of model results from both HCM Chapter 17 and 21, and (2) the operational effects 224
of the two are hypothesized to be different. 225 To illustrate the latter point, the shaded areas in Figure 2 represent the theoretical areas of 226
geometric delay for upstream and downstream sub-segments. Geometric delay in this case is 227
defined as the difference between segment free-flow speed (FFS) and the unimpeded trajectory 228 speed across the sub-segment length. A trajectory that does not encounter any interaction with 229
other vehicles (e.g. by yielding at the roundabout or braking between intersections) is considered 230 unimpeded. The exhibit makes evident that geometric delay for the upstream roundabout sub-231
segment (gray lines) is arguably much less than for the downstream sub-segment (black 232 crosshatch marks), as the latter includes significant travel distance at the geometrically-233 constrained circulating speed. Consistent with these sub-segment definitions, all variables are 234 defined on a sub-segment basis. This includes variables such as the FFS, with each roundabout 235 having a potentially different upstream (A1) and downstream (B1) FFS. Coincidentally, the 236
downstream FFS of RBT1 (B1) is the same as the upstream FFS of RBT2 (B2). 237
238
239
Bugg, Schroeder, Jenior, Brewer, Rodegerdts 9 9
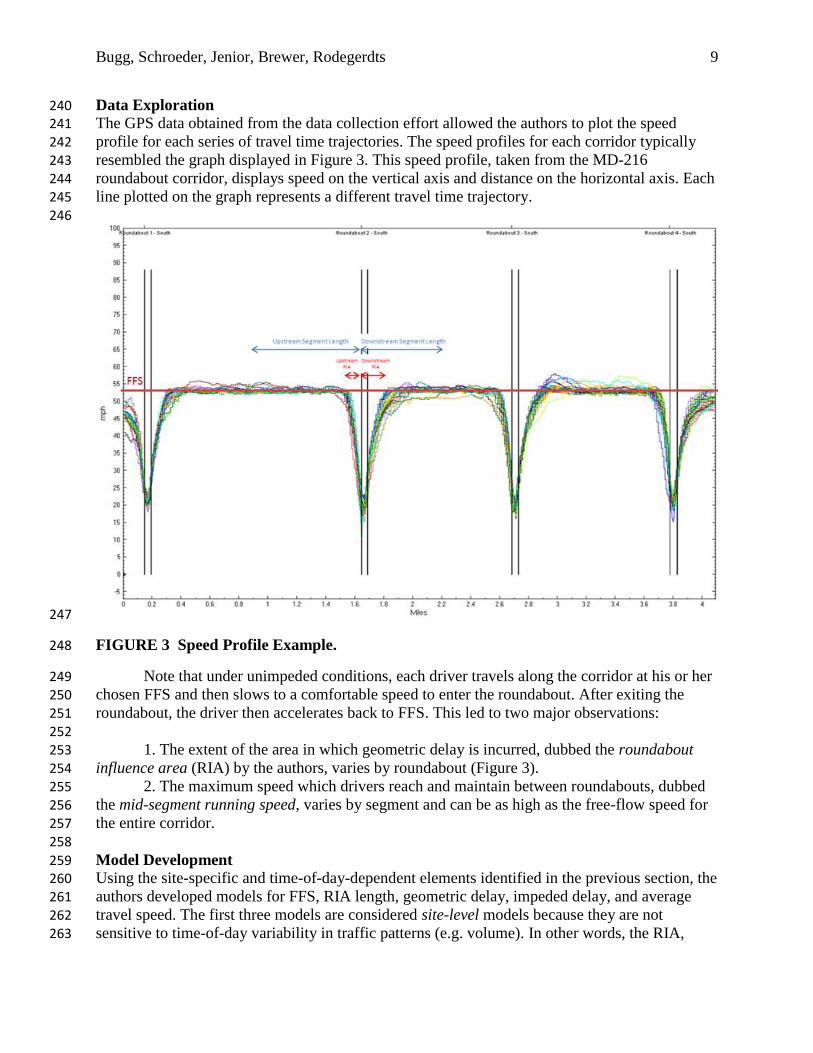
Data Exploration 240 The GPS data obtained from the data collection effort allowed the authors to plot the speed 241 profile for each series of travel time trajectories. The speed profiles for each corridor typically 242 resembled the graph displayed in Figure 3. This speed profile, taken from the MD-216 243
roundabout corridor, displays speed on the vertical axis and distance on the horizontal axis. Each 244 line plotted on the graph represents a different travel time trajectory. 245 246
247
FIGURE 3 Speed Profile Example. 248
Note that under unimpeded conditions, each driver travels along the corridor at his or her 249
chosen FFS and then slows to a comfortable speed to enter the roundabout. After exiting the 250 roundabout, the driver then accelerates back to FFS. This led to two major observations: 251
252 1. The extent of the area in which geometric delay is incurred, dubbed the roundabout 253
influence area (RIA) by the authors, varies by roundabout (Figure 3). 254 2. The maximum speed which drivers reach and maintain between roundabouts, dubbed 255
the mid-segment running speed, varies by segment and can be as high as the free-flow speed for 256
the entire corridor. 257 258
Model Development 259 Using the site-specific and time-of-day-dependent elements identified in the previous section, the 260 authors developed models for FFS, RIA length, geometric delay, impeded delay, and average 261
travel speed. The first three models are considered site-level models because they are not 262 sensitive to time-of-day variability in traffic patterns (e.g. volume). In other words, the RIA, 263

Bugg, Schroeder, Jenior, Brewer, Rodegerdts 10 10
geometric delay, and FFS models are considered to be fixed over time for a specific roundabout 264 approach. On the other hand, the impeded delay and average travel speed models are 265 operational-level models that consider traffic volumes and volume-to-capacity ratios. 266 Conceptually, these latter two models may use one or more of the site-level models as inputs, 267
where, for example, the average travel speed may be a function of the free-flow speed and the 268 RIA estimated in earlier models. In the HCM 2010 Chapter 17, the average travel speed is 269 estimated as a function of the segment running speed and the various sources of delay. The 270 motivation for the formulation of a separate average travel speed model here is based on a desire 271 to verify the applicability of the Chapter 17 method to roundabout corridors. 272
The authors assembled a dataset by calculating geometric and operational parameters for 273 each roundabout approach from seven of the nine roundabout corridors listed in Table 1, leaving 274 the two Carmel corridors out for validation purposes. Each approach was partitioned into sub-275
segments, as shown in Figure 2. The total dataset included 62 roundabout approaches, with each 276 providing an upstream and a downstream sub-segment. Some approaches were excluded due to 277 (a) overlapping influence areas, or (b) a short upstream or downstream sub-segment length at the 278
end of the roundabout corridor. In the case of overlapping influence areas, these approaches were 279 only excluded from the RIA models; these approaches were used in other models like the FFS 280
prediction model. For the short sub-segments, the GPS travel-time vehicles were not able to 281 accelerate to their desired speeds (even in free-flow conditions), because of a nearby intersection 282 or turnaround point. 283
After excluding selected approaches, the remaining dataset included 49 upstream and 52 284 downstream roundabout sub-segments. The models were developed using the SAS general liner 285
model with a forward selection procedure, and separate models were developed for upstream and 286 downstream segment data. Several individual models were developed for each dependent 287
variable, and then the authors selected a preferred model for each based on goodness-of-fit, 288 simplicity, statistical significance of the independent variables within the model, and general 289
sense of the model within the context of an urban streets analysis. 290 291
RESULTS 292 This section explains the results of the model calibration and validation efforts. The detailed 293 results for each model (RIA, geometric delay, FFS, average travel speed, and impeded delay) are 294
presented separately, and then the validation results are presented. 295
296
Roundabout Influence Area 297 After comparing several models obtained from the regression effort, the authors recommend the 298 following sub-models for roundabout influence area length: 299 300
RIAupstream = 165.9 + 13.8 * Sf – 21.1 * Sc (1) 301 RIAdownstream = -149.8 + 31.4 * Sf – 22.5* Sc (2) 302 303
where 304 RIAupstream = upstream roundabout influence area length (ft), 305 RIAdownstream = downstream roundabout influence area length (ft), 306 Sf = free-flow speed (mph), and 307 Sc = circulating speed (mph). 308 309

Bugg, Schroeder, Jenior, Brewer, Rodegerdts 11 11
The upstream sub-model has an R2 of 28.9%, while the downstream sub-model has an R
2 310
of 71.4%. All terms in the model were statistically significant (p<0.05). The model shows that 311 the RIA length is primarily related to the FFS along the sub-segment as well as the circulating 312 speed (i.e. the minimum unimpeded speed) within the roundabout. For a given sub-segment, as 313
the FFS increases, the RIA length predicted by the model also increases, but this length 314 decreases as the circulating flow in the roundabout adjacent to the segment increases. This is 315 intuitive because it suggests that roundabouts necessitating a greater decrease in speed (as 316 indicated by a large difference between the FFS and circulating speed) should be associated with 317 a longer RIA. 318
319
Geometric Delay 320 The authors recommended the following sub-models for geometric delay after comparing several 321
models obtained from the regression effort: 322 323 Delaygeom, upstream = 1.57 + 0.11*Sf – 0.21*Sc (3) 324
Delaygeom, downstream = min{-2.63 + 0.086*Sf + 0.72 * ICD *(1/Sc -1/Sf),0} (4) 325 326
where 327 Delaygeom, upstream = upstream geometric delay (s/veh), 328 Delaygeom, downstream = downstream average geometric delay (s/veh), 329
ICD = inscribed circle diameter (ft), 330 Sf = free-flow speed (mph), and 331
Sc = circulating speed (mph). 332 333
The upstream sub-model has an R2 of 31.5%, while the downstream sub-model has an R
2 334
of 79.4%. All terms in the model were statistically significant (p<0.05). 335
An interaction term between the FFS, circulating speed, and inscribed circle diameter was 336 also used to model geometric delay with positive results for the downstream geometric delay 337 sub-model. This circulating delay term, shown in Figure 4, is based on the difference between 338
FFS and circulating speed. Intuitively, this term applies to the downstream geometric delay, as it 339 includes the geometric delay within the circle. 340
341

Bugg, Schroeder, Jenior, Brewer, Rodegerdts 12 12
342
FIGURE 4 Illustration of Circulating Delay Term. 343
344 The geometric delay could be partially explained by the FFS along the segment and the 345
circulating speed within the roundabout. These relationships were similar to those in the RIA 346
model in that a higher FFS along a sub-segment would cause the model to predict a higher 347
geometric delay, but a higher circulating speed within the adjacent roundabout would lower the 348
predicted geometric delay. This is also intuitive, as drivers should experience more geometric 349 delay at a roundabout necessitating a greater decrease in speed. Note that is also necessary to add 350
a boundary condition (minimum value of zero geometric delay) to Equation 4, since low FFS 351 (under 30 mph) on downstream sub-segments will typically result in very low geometric delays. 352
353
Free Flow Speed 354 The following sub-models were developed for upstream and downstream FFS: 355
356 Sf,upstream = 15.1 + 0.0037*L + 0.43*S + 0.05*CID – 4.73*OL (5) 357 Sf,downstream = 14.6 + 0.0039*L + 0.48*S + 0.02*CID – 4.43*OL (6) 358 359
where 360
Sf,upstream = upstream free-flow speed (mph), 361
Sf,downstream = downstream free-flow speed (mph), 362 L = sub-segment length (ft), 363 S = posted speed limit (mph), 364 CID = central island diameter (ft), and 365 OL = dummy variable for overlapping roundabout influence areas, i.e. OL = 1 if the roundabout 366
influence area of the sub-segment is longer than the sub-segment length, 0 otherwise. 367 368

Bugg, Schroeder, Jenior, Brewer, Rodegerdts 13 13
The FFS model possesses the strongest fit of any models developed, with an R2 of 90% 369
for the upstream sub-model and 93% for the downstream sub-model. All terms in the model were 370 significant (p<0.05). FFS was intuitively found to related to the segment length, the posted speed 371 limit along the segment, and the central island diameter of the adjacent roundabout, as well as 372
whether the segment was an overlapping segment. Specifically, the FFS was found to increase 373 with the posted speed, segment length, and central island diameter, but the model assigned a 374 significant penalty (minus 4.5 to 5.0 mph) to the FFS of sub-segments within segments with 375 overlapping RIAs. 376
377
Average Travel Speed 378 The authors investigated the average speed along the sub-segments of the roundabout corridor, 379 considering traffic characteristics such as the level of congestion. The average travel speed along 380
each sub-segment was calculated for the upstream and downstream segments to calibrate several 381 models. This model is an optional step in the implementation of this procedure in the HCM 2010 382 Chapter 17, as the existing procedure already contains a step to estimate the average travel speed, 383
considering FFS, delays, and other factors. 384 The following are the sub-models for upstream and downstream average travel speed: 385
386 Saverage,upstream = 8.52 + 0.73*Sf – 18.2*v/c (7) 387 Saverage,downstream = 6.45 + 0.74*Sf – 5.4*v/c (8) 388
389 where 390
Saverage,upstream = average travel speed for the upstream sub-segment (mph), 391 Saverage,downstream= average travel speed for the downstream sub-segment (mph), 392
Sf = free-flow speed (mph), and 393 v/c = volume-to-capacity ratio for the downstream roundabout, i.e. the roundabout adjacent to an 394
upstream sub-segment or downstream of (not adjacent to) a downstream sub-segment. 395 396
The upstream sub-model has an R2 of 76%, while the downstream sub-model has an R
2 397
of 83%. All terms in the model were statistically significant (p<0.01). 398 The model indicates that average travel speed is chiefly related to the FFS and volume-to-399
capacity ratio of the downstream roundabout. Thus, a sub-segment with a higher FFS would 400 experience a higher average speed, but an increase in volume-to-capacity ratio would lower the 401
average speed within the sub-segment. In the application of this model, the FFS would be 402 calculated from the FFS model. The volume-to-capacity ratio is calculated using entering volume 403 and the theoretical roundabout capacity calculated from the equations in the HCM. 404 405
Impeded Delay 406 Finally, the authors investigated the average impeded delay incurred to each driver at each 407 roundabout by calibrating a delay model for the time-of-day dataset. The impeded delay is 408
defined as the delay experienced due to interaction with other vehicles, yielding at entry, and 409 queuing effects, but it does not include the geometric delay calculated above. The authors 410 determined the impeded delay for each sub-segment by taking the difference between the 411 average travel time and the unimpeded travel time. The impeded delay is a function of these 412 elements: the upstream impeded delay is a function of FFS, the volume-to-capacity ratio, and the 413

Bugg, Schroeder, Jenior, Brewer, Rodegerdts 14 14
entering flow rate, and the downstream impeded delay is a function of FFS, volume-to-capacity 414 ratio, segment length, median length, and curb length across the segment: 415 416 Delayimpeded,upstream = -5.35 + 0.15*Sf + 42.5*v/c – 0.03*Vent (9) 417
Delayimpeded,downstream = -2.65 + 0.07*Sf + 3.1*v/c + 0.002*L – 0.001*Lm + 0.0014*Lc (10) 418 419 where 420 Delayimpeded,upstream = average upstream impeded delay (s/veh), 421 Delayimpeded,downstream = average upstream impeded delay (s/veh), 422
Vent = entering volume at the roundabout adjacent to the segment (vph), 423 L = sub-segment length (ft), 424 Lm = length of sub-segment with restrictive median (ft), 425
Lc = length of sub-segment with curb (ft), 426 Sf = free-flow speed (mph), and 427 v/c = volume-to-capacity ratio for the downstream roundabout, i.e. the roundabout adjacent to an 428
upstream sub-segment or downstream of (not adjacent to) a downstream sub-segment. 429 430
The upstream sub-model has an R2 of 67%, while the downstream sub-model has an R
2 431
of 56%. All terms in the model were statistically significant (p<0.1), with the terms in the 432 upstream sub-model being more significant (p<0.01). 433
The upstream sub-model suggests drivers will experience more delay at a roundabout 434 with a high level of congestion (indicated by a high volume-to-capacity ratio), but a roundabout 435
with a higher level of entering flow will incur a lower amount of delay. This latter relationship 436 may seem counterintuitive but should be interpreted along with the volume-to-capacity ratio 437
term. Like the geometric delay model, a segment with a higher FFS is associated with greater 438 impeded delay. For the downstream sub-segments, the FFS, sub-segment length, curb length, and 439
volume-to-capacity ratio all increased the delay, but an increase in median length led to a 440 decrease in the predicted delay. This last relationship may be due to the sample size or range of 441 median lengths. 442
443
Model Validation 444 This section describes the results of the model validation effort. Two roundabout corridors, both 445 from Carmel, Indiana, were withheld from the calibration dataset and were instead used to 446
validate the models. By applying the HCM 2010 Chapters 16 and 17 methodologies, integrated 447 with modifications for the roundabout nodes, the authors determined the corridor travel time and 448 average speed for the two corridors. Figure 5 displays the results of the validation effort for the 449 first corridor, Old Meridian Street. This corridor is unique to the dataset because it contains an 450
internal signalized intersection between two of the roundabouts. 451
452

Bugg, Schroeder, Jenior, Brewer, Rodegerdts 15 15
453
FIGURE 5 Validation Results for Old Meridian Street. 454 455
The validation results suggest a close match of the predicted FFS for both northbound 456
and southbound routes, with an error of 0.6 mph and 1.2 mph, respectively. For the average 457 travel speed estimation, the northbound results for the a.m. and p.m. peak match the field-458
observed data with an error of 2.1 mph (8.0%) and 0.2 mph (0.8%) difference. For the 459 southbound route, the average travel speed estimates are lower than the field observed data by 460 5.4 mph (17.0%) and 2.5 mph (9.2%) for the a.m. and p.m. peak, respectively. This difference in 461
average travel speed translates to a difference in travel times of 0.0 and 0.2 minutes for 462 northbound a.m. and p.m. peak, and 0.6 and 0.5 minutes for the southbound routes. 463
464 465
466 467 468 469 470
471 472 473 474 475

Bugg, Schroeder, Jenior, Brewer, Rodegerdts 16 16
Figure 6 displays the validation results for the Spring Mill Road corridor. 476 477
478
FIGURE 6 Validation Results for Spring Mill Road. 479 480
The Spring Mill corridor validation shows a close match between the model and field 481 estimates. The model slightly overestimated the FFS and the average travel speed by 482
approximately 2 to 5 mph across the four analyzed routes. This translates to a slight 483 underestimation of travel time for three of the routes by 0.2 to 0.8 minutes. However, the 484 resulting percent FFS measure proved to be within 10% of the field-observed data for all routes, 485
which is explained because the error in FFS and average travel speed was in the same direction. 486 487
HCM IMPLEMENTATION 488 Figure 7 illustrates the calculation framework for applying the models within a given segment. 489 The framework should be applied separately for each upstream and downstream sub-segment 490 before eventually aggregating to the segment level. Further aggregation to the facility level can 491 be performed using the urban streets analysis procedure in HCM 2010 Chapter 17. The 492
framework is divided into computational steps A through L, with reference being made to the 493 corresponding steps in HCM 2010 Chapter 17 for urban street segments at the appropriate time. 494

Bugg, Schroeder, Jenior, Brewer, Rodegerdts 17 17
495
FIGURE 7 Roundabout Travel Time Calculation Methodology. 496 497
First, the analyst gathers input data, and the FFS is calculated based on the posted speed 498 limit, sub-segment length, and central island diameter of the roundabout, with the assumption 499
that overlapping RIAs are not present. On a portion of a roundabout corridor between two 500
roundabouts (i.e. not a first or last segment), the calculation is performed for a downstream sub-501
segment and the upstream sub-segment. Using the model-predicted FFS and the circulating 502 speed within the roundabout, the RIA length is calculated for both sub-segments. The analyst 503 must then check whether the RIAs of the sub-segments overlap. If so, this necessitates a 504 recalculation of the FFS with the overlap (OL) term set equal to 1, which will cause the predicted 505 FFS to decrease. 506
After the final sub-segment FFS is determined, the analyst selects the controlling FFS for 507 each segment. Because the FFS is defined as being measured at the segment mid-point, the same 508 FFS must be used for a downstream sub-segment and the next upstream sub-segment. In this 509

Bugg, Schroeder, Jenior, Brewer, Rodegerdts 18 18
procedure, the lower of the two free-flow speeds controls and is selected as the FFS value for the 510 entire segment. 511
Next, this procedure uses HCM Chapter 17 Step 2 to estimate the segment running time, 512 followed by roundabout-specific models to estimate geometric delay and impeded delay. Next, 513
the sub-segment performance measures are aggregated to the HCM Chapter 17 segment level 514 (Step J), and Chapter 17 Step 7 is used to determine the average travel speed on the segment. 515 From the average travel speed, the level of service is estimated for the urban street segment with 516 roundabouts. The facility LOS (HCM Chapter 16) and overall corridor travel time are then 517 obtained by aggregating the performance of individual segments, consistent with the procedure 518
for signalized corridors. 519 520
Model Updates 521 After the models were developed, the authors updated the models to make them more suitable for 522 integration with the HCM urban streets analysis procedure. Specifically, the average travel speed 523 models, while useful for comparison of the results with the existing methodology, were 524
developed independently from the existing HCM Chapter 17 procedure. Thus, they are optional 525 within the framework presented in Figure 7. 526
Additionally, the downstream impeded delay model was updated to the following model: 527 528
Delayimpeded,downstream = -1.01 + 0.004*VT + 0.003*L – 0.001*Lm + 0.002*Lc (11) 529
530 where VT = the through-movement volume (vph) along the downstream sub-segment, and all 531
other terms are previously defined. While the first model resulted in a better fit, this model is 532 more intuitive because it removes the term for v/c ratio, an element that, in practice, will be 533
difficult to predict or explain for the downstream portion of the impeded delay. 534 535
CONCLUSION 536 The modeling efforts described in this paper indicate that a series of simple linear models could 537 be used to successfully describe the relationship between the components of roundabout corridor 538
travel time (roundabout influence area, geometric delay, free-flow speed, average travel speed, 539 and impeded delay) and the geometric and operational elements of a roundabout corridor. The 540
data were modeled separately for upstream sub-segments and downstream sub-segments, and 541 most of the models could explain over 70% of the variability in the data. A few of the models 542
could be used to compute components of other models; e.g. the estimated FFS is an explanatory 543 variable in the other four models. 544
After completing the model development of all predictive models, the authors performed 545 a validation exercise intended to verify that the proposed methodology results in satisfactory 546
performance results. The authors presented an external validation of the methodology through 547 application to two corridors in Carmel, Indiana. Both corridors were excluded from model 548 development and thus represent a true validation of the methodology. The resulting percent FFS 549
estimates matched the field-observed data within 10% for Spring Mill Road (all four routes) and 550 for the northbound routes on Old Meridian Street. The Old Meridian Street southbound routes 551 matched within a 20% difference, but this corridor also contains an internal signalized 552 intersection between two of the roundabouts. 553
After validation, the authors present a step-by-step framework for calculation of 554 roundabout corridor travel time in a manner consistent with the existing HCM 2010 Chapter 17 555

Bugg, Schroeder, Jenior, Brewer, Rodegerdts 19 19
methodology. This framework is intended to be used to incorporate the models into a future 556 version of the Highway Capacity Manual. 557
558
ACKNOWLEDGEMENT 559 This paper is based on research conducted during NCHRP Project 03-100: Evaluating the 560 Performance of Corridors with Roundabouts. The authors would like to thank the project panel 561 for valuable feedback, as well as the state DOTs for supplying data and participating in 562 interviews during the project. 563 564
REFERENCES 565 1. Google Maps. 2014. <http://maps.google.com>. Accessed 1-18-2014. 566 2. Transportation Research Board. Highway Capacity Manual 2010. Transportation 567
Research Board of the National Academies, Washington, DC, 2010. 568 3. Rodegerdts, L. A., P.M. Jenior, Z. H. Bugg, B. L. Ray, B. J. Schroeder, and M. A. 569
Brewer. NCHRP Report 772: Evaluating the Performance of Corridors with Roundabouts. 570
Transportation Research Board of the National Academies, Washington, DC, 2014. 571 4. Gross, F. C. Lyon, B. Persaud, and R. Srinivasan. “Safety Effectiveness of Converting 572
Signalized Intersections to Roundabouts.” Presented at the Transportation Research Board 91st 573
Annual Meeting. Transportation Research Board of the National Academies, Washington, DC, 574 2012. 575
5. Rodegerdts, L., J. Bansen, C. Tiesler, J. Knudsen, E. Myers, M. Johnson, M. Moule, B. 576 Persaud, C. Lyon, S. Hallmark, H. Isebrands, R. B. Crown, B. Guichet, and A. O’Brien. NCHRP 577
Report 672: Roundabouts: An Informational Guide, 2nd ed. Transportation Research Board of 578 the National Academies, Washington, D.C., 2010. 579
6. Rodegerdts, L., M. Blogg, E. Wemple, E. Myers, M. Kyte, M. P. Dixon, G. F. List, A. 580 Flannery, R. Troutbeck, W. Brilon, N. Wu, B. N. Persaud, C. Lyon, D. L. Harkey, and D. Carter. 581
NCHRP Report 572: Roundabouts in the United States. Transportation Research Board of the 582 National Academies, Washington, D.C., 2007. 583
7. Persaud, B., R. Retting, P. Garder, and D. Lord. “Safety Effect of Roundabout 584
Conversions in the United States: Empirical Bayes Observational Before-After Study.” 585 Transportation Research Record 1751. Transportation Research Board of the National 586
Academies, Washington, DC, 2001. 587 8. Ariniello, A.J. Are Roundabouts Good for Business? LSC Transportation Consultants, 588
Inc., Denver, CO. December 2004. <http://ci.golden.co.us/files/roundaboutpaper.pdf>. Accessed 589 June 2011. 590
9. Isebrands, H., S. Hallmark, E. Fitzsimmons, and J. Stroda. Toolbox to Evaluate the 591 Impacts of Roundabouts on a Corridor or Roadway Network. Report No. MN/RC 2008-24. 592
Minnesota Department of Transportation, St. Paul, MN, 2008. 593 10. Akcelik, R. “An Assessment of the Highway Capacity Manual 2010 Roundabout 594
Capacity Model.” Proceedings, 2011 Transportation Research Board International Roundabout 595
Conference. Transportation Research Board of the National Academies, Carmel, IN, 2011. 596